My Account
My Slides
Search by Category
Templates
Leave Feedback
Login
Logout
Get Started
Browse all Slides
Browse all Slides
Create a FREE Account
Instant access to 1,000+ real slides from top companies like McKinsey, BCG, Goldman Sachs, Google and many more!
First Name
Last Name
Email
Password
I agree to all
Terms & Privacy Policy
Thank you! Your submission has been received!
Oops! Something went wrong while submitting the form.
Have an account?
Sign in
📢 Ready to start building slides? Check out our new template library
VIEW TEMPLATES
Welcome,
Welcome
PRO
Show Featured Only
Checkbox 8
Companies
Mckinsey
Bain
BCG
EY
Deloitte
Accenture
PwC/Strategy&
JP Morgan
Goldman Sachs
Morgan Stanley
Citigroup
Deutsche Bank
Barclays
LEK
KPMG
Kearney
Oliver Wyman
Booz Allen Hamilton
Gartner
IPSOS
Nielsen
Slide type
Text Only
Linear Flow
Vertical Flow
Single Chart
Header Horizontal
Mixed Chart
Header Vertical
Pillar
Multiple Chart
Graphic
Agenda
Title
Table
Framework
Industry
Technology & Software
Artificial Intelligence
Financial Services
Retail & E-commerce
Consumer Goods
Industrial & Manufacturing
Transportation & Logistics
Telecommunications
Real Estate & Construction
Hospitality & Tourism
Professional Services
Education & Training
Media & Entertainment
Agriculture & Food Production
Healthcare & Pharmaceuticals
Environmental Services & Sustainability
Government & Public Sector
Use Case
Mergers and Acquisitions
Performance Metrics and KPIs
Client Case Studies
Competitive Landscape
Corporate Finance and Valuation
Product and Service Analysis
Customer and Market Segmentation
Organizational Structure and Change
Industry Overview
Regulatory and Compliance
Risk Assessment and Management
Investment Analysis
Organizational Structure and Change
Human Resources and Talent Management
Financial Performance
Market Analysis and Trends
Sales and Business Development
Human Resources and Talent Management
Clear all
Thank you! Your submission has been received!
Oops! Something went wrong while submitting the form.
Tag
View slide
Two column charts comparing household debt to GDP and government debt to GDP among various countries as of December 29, 2022.
Market Analysis and Trends
Financial Services
The slide evaluates Indonesia's economic positioning by comparing its household and government debt levels to other countries, showing its relatively strong position.
Indonesia, Household Debt, Government Debt, GDP, Comparison
false
Market Analysis and Trends
Financial Services financial-services
Multiple Chart
Morgan Stanley
View slide
A large column chart displays the growth of Indonesia’s internet economy, with projections to 2025. A smaller line graph shows the Compound Annual Growth Rate (CAGR).
Market Analysis and Trends
Technology & Software
Shows Indonesia's growing internet economy with projections suggesting robust future growth, symbolizing a positive economic outlook.
Indonesia, Internet Economy, Growth, Projection, CAGR, Optimism, $70B, 2025
false
Market Analysis and Trends
Technology & Software technology-and-software
Single Chart
Bain
View slide
This slide presents a column chart showing growth in Indonesia's internet economy GMV from 2015 to 2025 with projected CAGR. It uses a simple layout with a clear color distinction for different years.
Market Analysis and Trends
Technology & Software
The slide illustrates the growth of Indonesia's internet economy reaching US $44B despite economic challenges, with a focus on past and projected GMV values.
Indonesia, Internet economy, GMV, Growth, Projections, CAGR, Economic challenges, 2015, 2020, 2025
false
Market Analysis and Trends
Technology & Software technology-and-software
Single Chart
Bain
View slide
The slide features bar graphs comparing projections from 2020 to 2025 in different sectors of Indonesia's Internet economy, like e-commerce and health-tech. It has a moderate visual complexity with clear labels.
Market Analysis and Trends
Technology & Software
The slide analyzes projected growth in sectors of Indonesia's Internet economy, providing insights for investors and companies planning expansion or entry into these markets.
Indonesia, Internet economy, e-commerce, growth, health-tech, ride-hailing, payments, lending, projections, investors
false
Market Analysis and Trends
Technology & Software technology-and-software
Multiple Chart
Kearney
View slide
The slide features two doughnut charts detailing the number of deals and investment value distribution across different stages in Indonesia for 2017.
Market Analysis and Trends
Financial Services
Discusses the stages of investment in Indonesia, highlighting the predominance of seed and early-stage investments generating most of the value.
Indonesia, Investment Stages, Seed, Trends
false
Market Analysis and Trends
Financial Services financial-services
Mixed Chart
Kearney
View slide
The slide uses column charts to show the growth of investment values in Indonesia from 2012 to 2017, illustrating exponential increases.
Market Analysis and Trends
Financial Services
Provides an analysis of the rapid growth in Indonesia’s investment values, showing significant increases from 2012 to mid-2017.
Indonesia, Investment, Growth, Trends
false
Market Analysis and Trends
Financial Services financial-services
Multiple Chart
Kearney
View slide
Comprises a vertical column chart showcasing deal values over years and the number of deals, with a marked increase in the first half of 2021.
Investment Analysis
Financial Services
Indicates a surge in investment deal values in Indonesia within the first half of 2021, exceeding the past four years’ totals.
Indonesia, Investments, Deal Value, 2021, H1, Growth, Financial Analysis
false
Investment Analysis
Financial Services financial-services
Single Chart
Bain
View slide
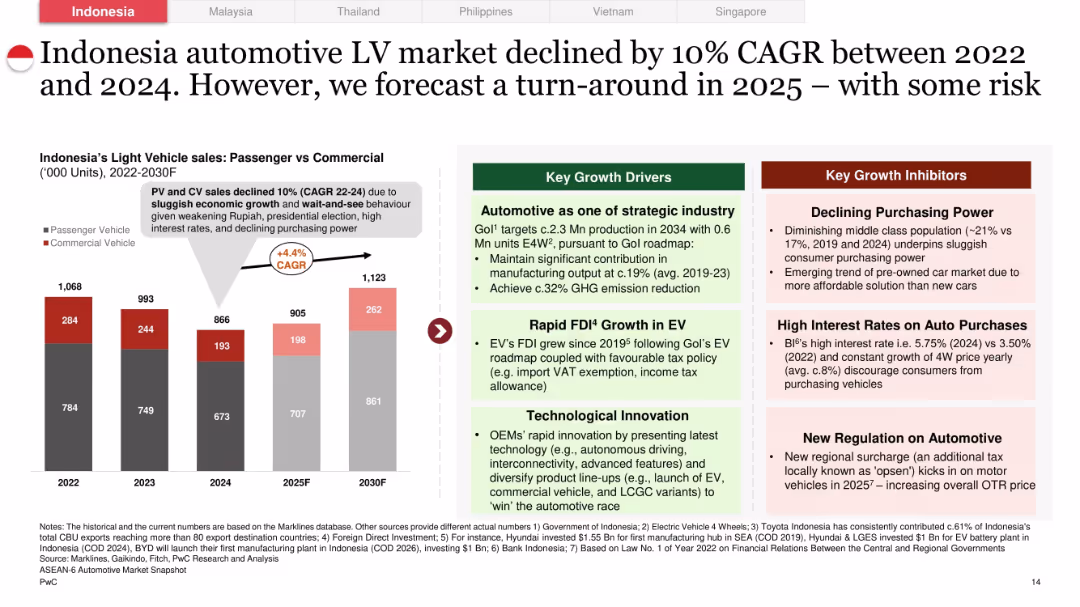
Left side includes a column chart of passenger vs commercial vehicles (2022–2030F); right side has green/red panels with key growth drivers and inhibitors.
Market Analysis and Trends
Industrial & Manufacturing
Analyzes Indonesia’s automotive LV market, highlighting a 10% decline from 2022–2024, followed by expected recovery. Lists drivers like EV investment and FDI, versus risks like declining purchasing power and high interest rates. Forecasts a turnaround in 2025 despite regulatory uncertainty.
Indonesia, LV market, growth drivers, inhibitors, forecast, FDI, EV roadmap
false
Market Analysis and Trends
Industrial & Manufacturing industrial-and-manufacturing
Mixed Chart
PwC/Strategy&
View slide
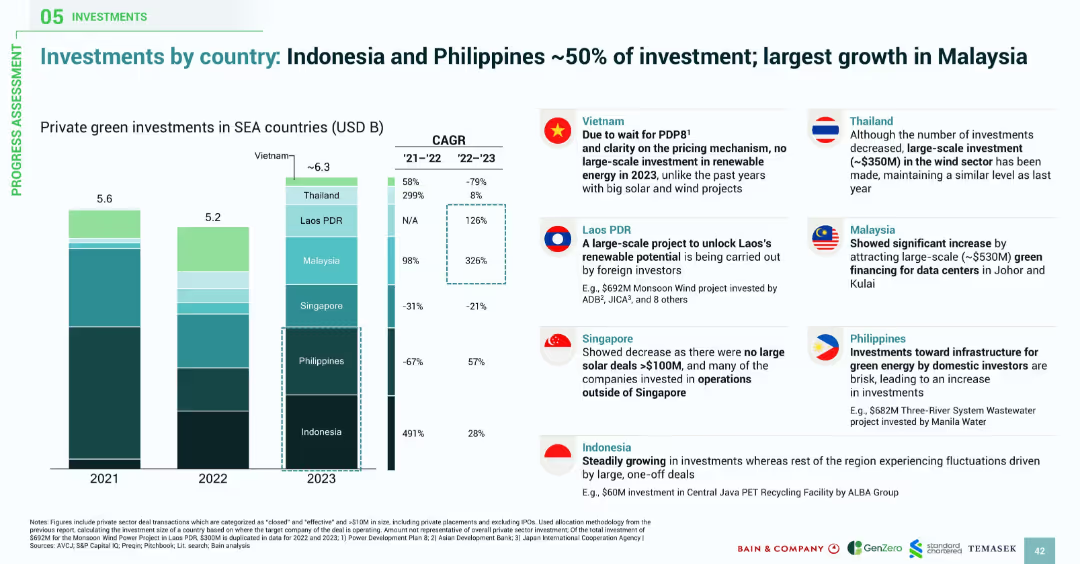
Bar charts display green investment volumes by country (2021–2023); flags and callouts summarize country-specific developments; vertical CAGR figures included.
Investment Analysis
Environmental Services & Sustainability
This slide presents country-level breakdowns of green investments in SEA. Indonesia and the Philippines lead in total volumes, while Malaysia shows the fastest growth due to large-scale data center financing. Side boxes detail major projects and strategic movements in each country, including policy and investor behavior.
Indonesia, Philippines, Malaysia, Laos, Vietnam, Thailand, green finance, renewable energy, investments, SEA
false
Investment Analysis
Environmental Services & Sustainability environmental-services-and-sustainability
Mixed Chart
Bain
View slide
Features multiple column charts detailing the Gross Merchandise Value (GMV) growth by sector, including e-commerce and transport, with percentage increases noted.
Market Analysis and Trends
Technology & Software
Highlights the growth in all sectors of Indonesia's economy in 2021, with e-commerce showing significant increases.
Indonesia, Sector Growth, E-commerce, Transport, Double-Digit Growth, 2021, GMV
false
Market Analysis and Trends
Technology & Software technology-and-software
Multiple Chart
Bain
View slide
Slide contains maps and infographics illustrating Indonesia’s status as the world’s largest island country, highlighting the variances in connectivity setup.
Market Analysis and Trends
Telecommunications
Examines Indonesia's unique challenges in developing ICT infrastructure due to its extensive archipelago, focusing on connectivity issues and regional disparities.
Indonesia, connectivity, islands, infrastructure, challenges
false
Market Analysis and Trends
Telecommunications telecommunications
Boxed
BCG
View slide
Slide shows a combination of maps, demographic tables, and data points illustrating the connectivity challenges in different regions of Indonesia.
Market Analysis and Trends
Telecommunications
Provides a comprehensive overview of Indonesia's connectivity challenges, focusing on demographic factors, school internet access, and regional disparities in connectivity.
Indonesia, demographics, connectivity, challenges, schools
false
Market Analysis and Trends
Telecommunications telecommunications
Mixed Chart
BCG
View slide
A bar chart with segments showing digital consumer population in SEA countries for 2021 and new digital consumers in 2022.
Market Analysis and Trends
Retail & E-commerce
Examines Indonesia's leading position in SEA's digital consumer base for 2021, with added numbers for 2022, providing a quick comparative regional analysis.
Indonesia, digital consumers, SEA, market analysis, growth trend
false
Market Analysis and Trends
Retail & E-commerce retail-and-e-commerce
Single Chart
Bain
View slide
A combination of column and bar charts, and infographic elements on a white background. The top section features a...
Market Analysis and Trends
Technology & Software
Showcasing Indonesia's digital consumer growth, this slide compares pre-pandemic and new digital consumers,...
Indonesia, digital growth, consumers, services, e-commerce, convenience, routine, penetration
false
Market Analysis and Trends
Technology & Software technology-and-software
Multiple Chart
Bain
View slide
Provides a detailed case study of Jejak.in with photos, icons, and data points about their programs and achievements in forest conservation in Indonesia.
Market Analysis and Trends
Environmental Services & Sustainability
Slide presents a case study on Jejak.in's efforts in forest conservation using digital monitoring and carbon credits, suitable for discussions on technological impacts on environmental efforts.
Indonesia, forest conservation, Jejak.in, case study, carbon sequestration, digital monitoring, technology, carbon credits
false
Market Analysis and Trends
Environmental Services & Sustainability environmental-services-and-sustainability
Header Vertical
Bain
View slide
Displays text and graphics detailing the cost structure, funding, and operational models for connecting schools in Indonesia's less developed regions.
Investment Analysis
Telecommunications
Analyzes specific funding and operational models to enhance school connectivity in Indonesia's remote regions, detailing costs and potential operational models.
Indonesia, funding, schools, connectivity, models
false
Investment Analysis
Telecommunications telecommunications
Pillar
BCG
View slide
Includes a detailed map of Indonesia with demographic stats, focusing on the challenges of connecting remote areas and the socio-demographic diversity across regions.
Strategic Planning
Government & Public Sector
Discusses the challenges posed by Indonesia's geography on connectivity efforts, emphasizing the socio-demographic disparities and the impact on infrastructure development efforts.
Indonesia, geography, connectivity, challenges, demographics
false
Strategic Planning
Government & Public Sector government-and-public-sector
Graphic
BCG
View slide
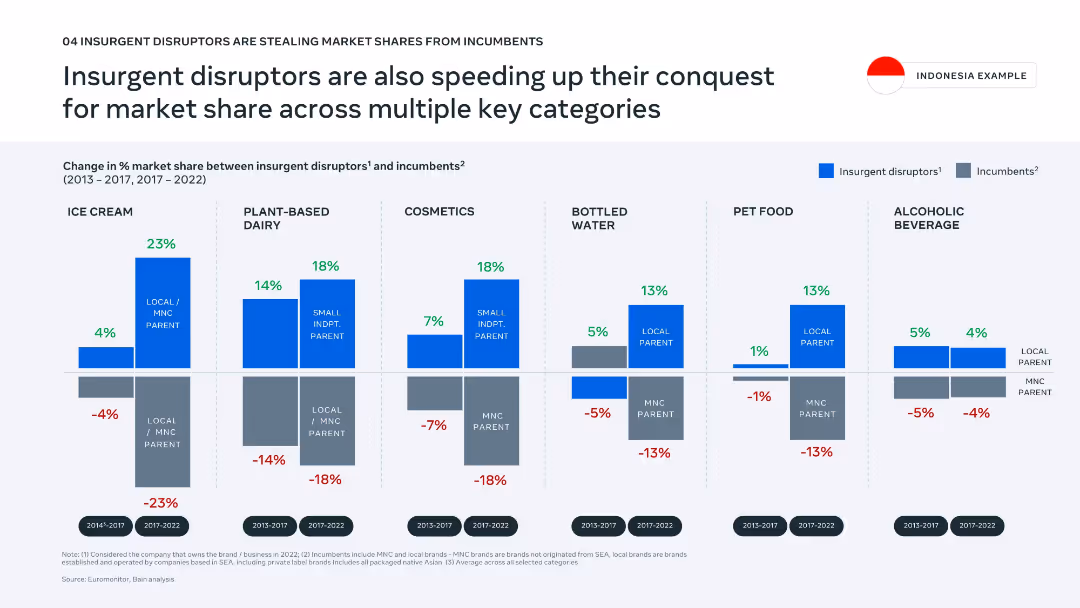
Horizontal bar graphs showing % market share change across categories in Indonesia; strong category-label alignment.
Competitive Landscape
Consumer Goods
This slide focuses on Indonesia, detailing how insurgent disruptors are gaining share in specific categories like ice cream, plant-based dairy, and cosmetics, often at the expense of multinational incumbents.
Indonesia, insurgent brands, market share, product categories, competition, local brands, disruptor growth, incumbents, consumer products, SEA
false
Competitive Landscape
Consumer Goods consumer-goods
Single Chart
Bain
View slide
Complex slide with multiple infographics, including a table, column charts, and a roadmap layout. Visual elements are densely packed with a clear focus on data presentation.
Regulatory and Compliance
Energy & Utilities
Details Indonesia's commitments and challenges in achieving net zero emissions, emphasizing government actions and market practices affecting environmental and investment strategies.
Indonesia, net zero, emissions, government, environmental policy
false
Regulatory and Compliance
Energy & Utilities energy-and-utilities
Mixed Chart
Bain
View slide
Displays a series of stacked column charts detailing the sharp decline in private funding across sectors in Indonesia from 2019 to H1 2023. The slide is organized similarly to slide 1821, with a legend and data source included.
Market Analysis and Trends
Technology & Software
Highlights the dramatic reduction in private funding across different sectors in Indonesia, with implications for market analysis and investment strategies.
Indonesia, private funding, sector analysis, 2019-2023 trends, stacked column charts, funding decline.
false
Market Analysis and Trends
Technology & Software technology-and-software
Single Chart
Bain
View slide
This slide is divided into two sections, each featuring a graph. On the left, the Index of Industrial Production is displayed with dual axes for level and percent change. On the right, the performance of stock markets (BSE Sensex and NSE Nifty) is shown in a line graph. The design is data-heavy and focused on visual representation of statistics.
Financial Performance
Industrial & Manufacturing
It explores India's industrial production growth with a year-on-year comparison and stock market indices' performance. The presentation of the data allows for analysis of economic health and investment potential, particularly beneficial for stakeholders in industrial and financial sectors seeking to understand market trends and economic vitality.
Industrial Production, NSE, BSE, Stock Market, India, Growth, Economy
false
Financial Performance
Industrial & Manufacturing industrial-and-manufacturing
Multiple Chart
McKinsey
View slide
Includes a balance column chart showing job gains and losses across different industrial trends.
Market Analysis and Trends
Industrial & Manufacturing
Summarizes the net effect of various industrial trends on employment, showing overall stability despite fluctuations caused by factors like technology and offshoring. Provides a comprehensive view of the employment landscape.
Industrial Trends, Employment Stability, Job Gains, Job Losses
false
Market Analysis and Trends
Industrial & Manufacturing industrial-and-manufacturing
Single Chart
BCG
View slide
Displays a list of six key trends affecting industry employment with associated icons for each trend.
Market Analysis and Trends
Industrial & Manufacturing
Discusses major industrial trends such as technology evolution and market shifts, and their implications on employment in the sector. Offers a strategic overview of factors influencing job dynamics.
Industrial Trends, Employment, Technology Evolution, Market Shifts
false
Market Analysis and Trends
Industrial & Manufacturing industrial-and-manufacturing
Header Vertical
BCG
View slide
Moderate visual complexity with text sections and graphic elements delineating the three key subsectors of industrial automation and their end-industries. The design integrates visuals and texts seamlessly, with a color code for each subsector.
Technology and Digital Transformation
Industrial & Manufacturing
This slide provides a segmented overview of the industrial automation sector, detailing the key subsectors and relevant end industries. It helps in understanding the broad categories within industrial automation and how they are applicable across different market segments.
Industrial automation, Subsectors, Market segmentation, End-industries
false
Technology and Digital Transformation
Industrial & Manufacturing industrial-and-manufacturing
Diagram
LEK
View slide
Two juxtaposed line charts, one for Industrial Production and one for equity markets, with descriptive texts and a dark background.
Market Analysis and Trends
Financial Services
Slide compares trends in industrial production with equity market performances, useful for investment strategizing and economic assessments.
Industrial production, equity markets, Sensex, Nifty, economic trends, investment
false
Market Analysis and Trends
Financial Services financial-services
Multiple Chart
McKinsey
View slide
Column chart with three years (FY-21, FY-22, FY-23) of deal volumes by sector in the Middle East, including consumer markets, financial services, etc.
Market Analysis and Trends
Industrial & Manufacturing
Reviews the strategic importance of the Middle East in global manufacturing and automotive sectors, citing major deals and investments.
Industrial, Manufacturing, Automotive, Deal Volumes, Middle East
false
Market Analysis and Trends
Industrial & Manufacturing industrial-and-manufacturing
Mixed Chart
PwC/Strategy&
View slide
This slide showcases a list of industries with relevant examples of how they are affected by software development trends. Icons and colored markers are used to denote the level of industry relevance, creating a clear visual hierarchy and focus points. The layout is simple, prioritizing clarity and readability.
Industry Overview
Technology & Software
The slide addresses the broad impact of software development trends across various industries, providing examples and common industry qualities. It emphasizes the transformative role of technology in sectors like financial services, healthcare, and manufacturing, making it relevant for a cross-industry audience.
Industries, Software Development, Impact, Financial Services, Healthcare, Manufacturing
false
Industry Overview
Technology & Software technology-and-software
Header Vertical
McKinsey
View slide
Exhibit 2 displays a table categorizing technology trends and their relevance across multiple industries with color-coded relevance.
Industry Overview
Technology & Software
This table slide exhibits the relevance of various technology trends across different industry sectors.
Industries, Technology, Trends, Relevance, Silicon Age, Engineering Tomorrow
false
Industry Overview
Technology & Software technology-and-software
Single Chart
McKinsey
View slide
This slide displays a bar chart with varying lengths representing the adoption of Industry 4.0 technologies like AI, robotics, and biotech in the food sector. Each technology is color-coded, enhancing readability and focus. The design is straightforward, emphasizing data presentation.
Customer and Market Segmentation
Agriculture & Food Production
It examines the adoption rates of Industry 4.0 technologies in the food sector, highlighting areas such as biotech, robotics, and AI. The slide is useful for discussions on technological advancements and strategic planning in the food industry.
Industry 4.0, technology adoption, food sector, AI, robotics, biotech, technological advancements, strategic planning
false
Customer and Market Segmentation
Agriculture & Food Production agriculture-and-food-production
Mixed Chart
Deloitte
View slide
Stacked bar graph depicting anticipated approaches to agility in various industries by 2026, along with a pie chart of overall percentages.
Strategic Planning
Professional Services
Predicts the future of agility in different industries, providing a comparative look at expected strategic changes by 2026.
Industry Agility, Future Forecast, Strategic Change, Bar Graph, Pie Chart
false
Strategic Planning
Professional Services professional-services
Single Chart
Kearney
Previous
Loading...
Hold On!
We are searching in our database
If nothing, comes up, please try different filters!
Column Chart
Heatmap
Chevron
Org Chart
Infographic
Callouts
Timeline
List
Graphic
Picture
Process Flow
Diagram
Paragraph
Map
Table
Framework
Subtitle
Takeaway Box
Icon
Other Chart
Radar Chart
Waterfall Chart
Mekko Chart
Pie Chart
Scatter Plot
Line Chart
Bar chart
Bullet points
Create a FREE account to continue browsing
Receive Instant Access to 1,000+ slides from companies like McKinsey, Google, and Goldman Sachs
First Name
Last Name
Email
Password
I agree to all
Terms & Privacy Policy
Thank you! Your submission has been received!
Oops! Something went wrong while submitting the form.
Have an account?
Sign in
Upgrade to PRO to Save slides
Advanced Search and Filters
Access to 15,000+ slides
Access to Category Pages
Save/Bookmark Slides
PowerPoint Template Library
Pick a Plan
MONTHLY
$12/month
Billed every month, Cancel anytime.
YEARLY
$9/year
Billed $108 annually, Cancel anytime.
Checkout for $12/month
Checkout for $108/yr
Secured by Stripe | AES-256 bit encryption