My Account
My Slides
Search by Category
Templates
Leave Feedback
Login
Logout
Get Started
Browse all Slides
Browse all Slides
Create a FREE Account
Instant access to 1,000+ real slides from top companies like McKinsey, BCG, Goldman Sachs, Google and many more!
First Name
Last Name
Email
Password
I agree to all
Terms & Privacy Policy
Thank you! Your submission has been received!
Oops! Something went wrong while submitting the form.
Have an account?
Sign in
📢 Ready to start building slides? Check out our new template library
VIEW TEMPLATES
Welcome,
Welcome
PRO
Show Featured Only
Checkbox 8
Companies
Mckinsey
Bain
BCG
EY
Deloitte
Accenture
PwC/Strategy&
JP Morgan
Goldman Sachs
Morgan Stanley
Citigroup
Deutsche Bank
Barclays
LEK
KPMG
Kearney
Oliver Wyman
Booz Allen Hamilton
Gartner
IPSOS
Nielsen
Slide type
Text Only
Linear Flow
Vertical Flow
Single Chart
Header Horizontal
Mixed Chart
Header Vertical
Pillar
Multiple Chart
Graphic
Agenda
Title
Table
Framework
Industry
Technology & Software
Artificial Intelligence
Financial Services
Retail & E-commerce
Consumer Goods
Industrial & Manufacturing
Transportation & Logistics
Telecommunications
Real Estate & Construction
Hospitality & Tourism
Professional Services
Education & Training
Media & Entertainment
Agriculture & Food Production
Healthcare & Pharmaceuticals
Environmental Services & Sustainability
Government & Public Sector
Use Case
Mergers and Acquisitions
Performance Metrics and KPIs
Client Case Studies
Competitive Landscape
Corporate Finance and Valuation
Product and Service Analysis
Customer and Market Segmentation
Organizational Structure and Change
Industry Overview
Regulatory and Compliance
Risk Assessment and Management
Investment Analysis
Organizational Structure and Change
Human Resources and Talent Management
Financial Performance
Market Analysis and Trends
Sales and Business Development
Human Resources and Talent Management
Clear all
Thank you! Your submission has been received!
Oops! Something went wrong while submitting the form.
Tag
View slide
Bar charts showing the breakdown of invested assets by class and currency for Global Wealth Management and Asset Management.
Financial Performance
Financial Services
Analyzes the distribution of invested assets across different classes and currencies, comparing Global Wealth Management and Asset Management.
Invested assets, asset class, currency, UBS, Global Wealth Management, Asset Management, financial performance, 3Q22
false
Financial Performance
Financial Services financial-services
Multiple Chart
UBS
View slide
The slide uses a combination of icons and bullet points to explore the personal motivations behind investing, categorized into heart, mind, and wallet sections.
Strategic Planning
Financial Services
It encourages viewers to consider their personal motivations for investing, categorizing questions into heart (goals), mind (financial importance), and wallet (financial planning).
Investing, motivations, UBS, personal goals, financial planning
false
Strategic Planning
Financial Services financial-services
Header Vertical
UBS
View slide
The slide contains a sequence of circular graphs showing the percentage change of the investment bank's assets within the overall group from 2023 to 2026.
Investment Analysis
Financial Services
This slide presents the strategic scaling of the investment bank's assets as a percentage of total group assets, with projections leading up to 2026. It highlights the dynamic allocation strategies and scaling efforts within the financial group, crucial for investment stakeholders.
Investment Bank, Assets, Growth, Strategy
false
Investment Analysis
Financial Services financial-services
Multiple Chart
Barclays
View slide
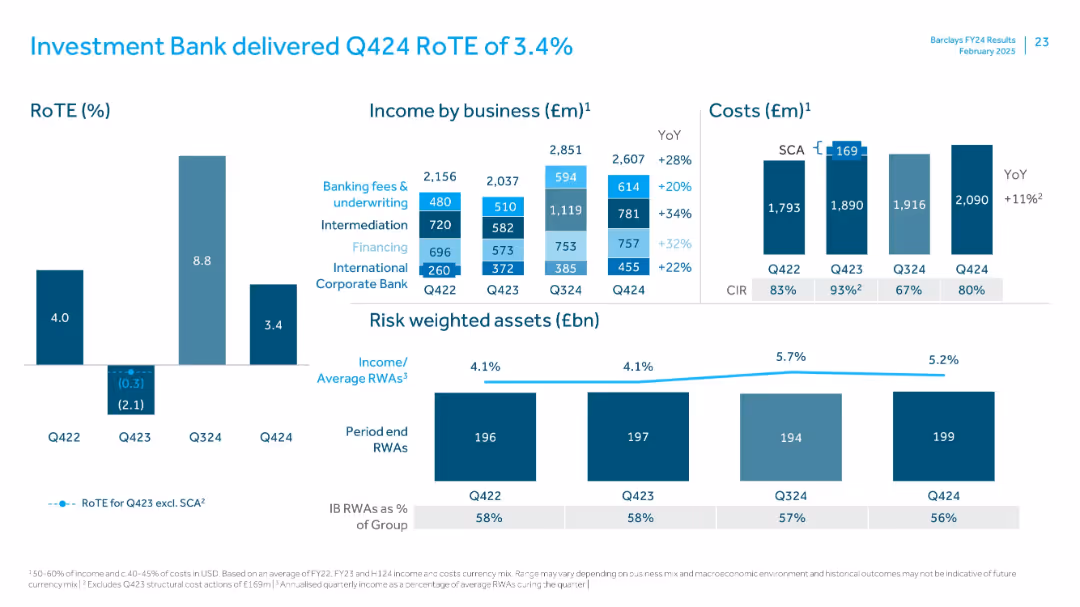
Similar layout as 18398; includes financials, segment revenue bars, and highlight bullet points.
Financial Performance
Financial Services
Highlights strong revenue growth in Investment Bank, driven by Fixed Income and Origination & Advisory. Costs remained flat. Increased provisions due to model effects from prior year. Reflects a strong YoY rebound and stable financing performance.
Investment Bank, FIC, O&A, revenue growth, credit losses, RoTE
false
Financial Performance
Financial Services financial-services
Mixed Chart
Deutsche Bank
View slide
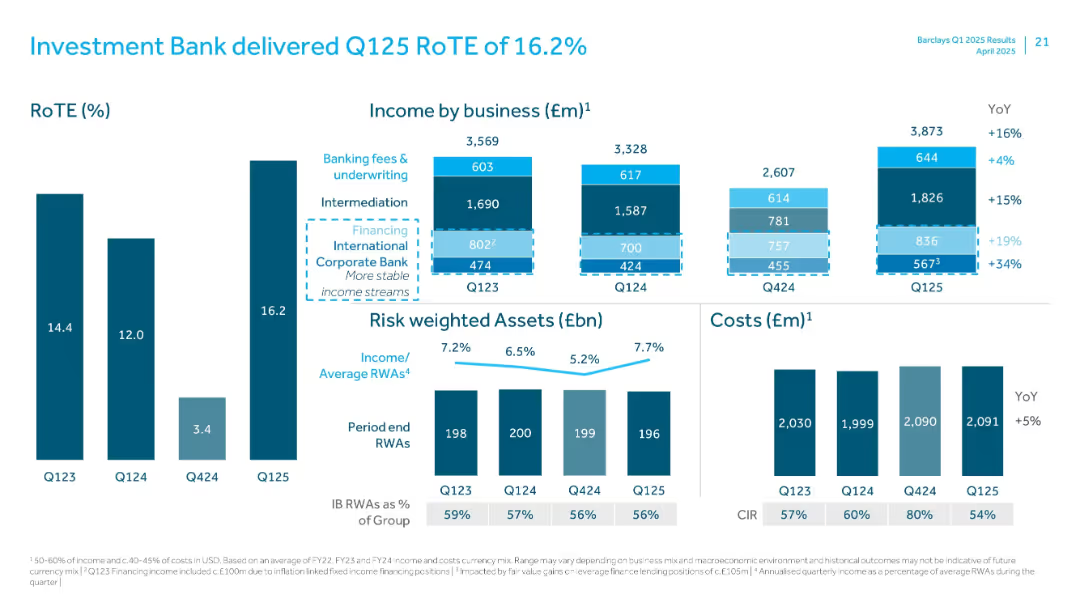
Clustered vertical bar charts for RoTE, income by business, risk weighted assets, and cost overview.
Financial Performance
Financial Services
Summarizes Investment Bank’s Q125 performance. RoTE reached 16.2%, with 16% YoY income growth. Shows income split across various business lines and notes RWA and cost trends. Highlights stable financing income and improved CIR.
Investment Bank, RoTE, Income, RWA, Financing, CIR, Q125, Intermediation, Fees
false
Financial Performance
Financial Services financial-services
Multiple Chart
Barclays
View slide
Panel layout with income by business and type; cost bar charts and risk-weighted assets at bottom
Financial Performance
Financial Services
Breaks down Investment Bank’s income across key services—fees, intermediation, financing. RoTE is relatively low. Expenses and risk-weighted assets are charted, with commentary on CIR improvement and business mix effects.
Investment Bank, RoTE, income breakdown, risk-weighted assets, CIR, financing, underwriting
false
Financial Performance
Financial Services financial-services
Multiple Chart
Barclays
View slide
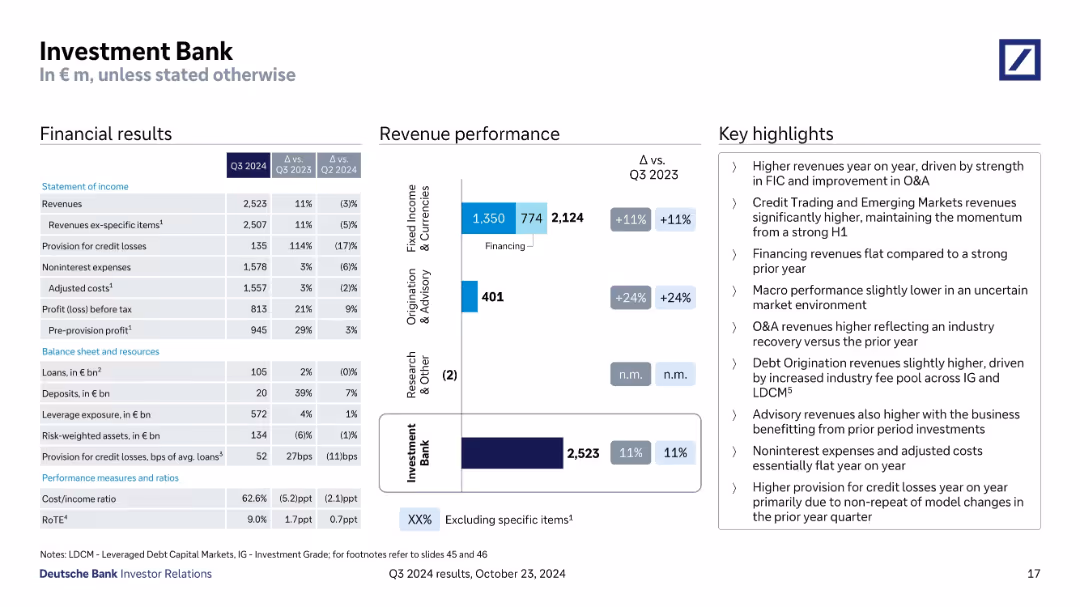
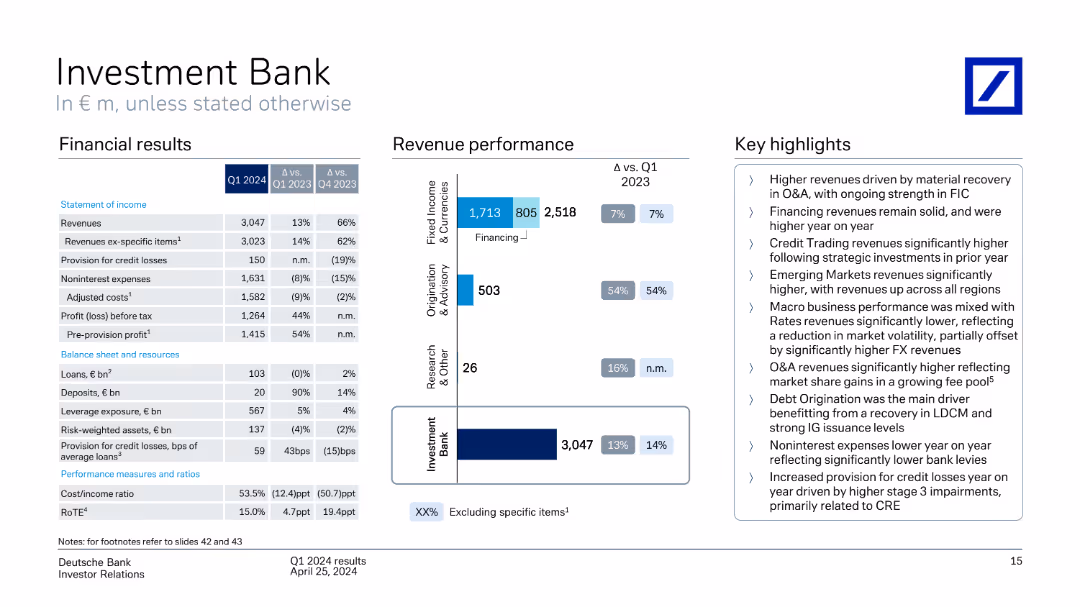
A column chart showing revenue performance across different segments, a table of financial results, and key highlights. The slide is moderately dense with a mix of text and visual elements.
Financial Performance
Financial Services
The slide highlights the Investment Bank's Q1 2024 financial performance, detailing revenue, profit, and other key metrics, and comparing performance across various business segments.
Investment Bank, revenue performance, financial results, Q1 2024, business segments
false
Financial Performance
Financial Services financial-services
Mixed Chart
Deutsche Bank
View slide
Contains bar and tables comparing revenue streams and financial metrics across quarters, with emphasis on different banking activities.
Financial Performance
Financial Services
Analyzes the Investment Bank's financial results, focusing on revenue variations and strategic adjustments in response to market dynamics.
Investment Bank, revenue, market dynamics
false
Financial Performance
Financial Services financial-services
Mixed Chart
Deutsche Bank
View slide
The slide displays column charts representing debt underwriting league table rankings and net revenues, accompanied by textual analysis and bullet points. The layout is structured and information-dense.
Strategic Planning
Financial Services
Outlines the advancement in client coverage in investment banking, highlighting league table rankings, net revenue, and client engagement strategies.
Investment Banking, Client Coverage, League Table, Net Revenue, Engineering, Client Engagement, Debt Underwriting, Strategy
false
Strategic Planning
Financial Services financial-services
Multiple Chart
Goldman Sachs
View slide
The slide includes a title, a column chart with net revenues, a table detailing financial results, and bullet points summarizing the highlights. The slide is well-organized with moderate visual complexity.
Financial Performance
Financial Services
Aimed at displaying detailed financial results for the global banking and markets sector of a company. It includes revenue from various services like investment banking and equities. The data is probably used to analyze market positions and inform strategy meetings or investor updates.
Investment Banking, Equities, Net Revenues, Financial Results
false
Financial Performance
Financial Services financial-services
Mixed Chart
Goldman Sachs
View slide
This slide features a column chart and a table that depicts the global wallet evolution by product, the other by region, accompanied by a sidebar listing key market drivers with directional arrows.
Market Analysis and Trends
Financial Services
Reflecting on the investment banking industry's financial metrics, it shows the distribution of wallet size by product and region, with attention to various economic and geopolitical drivers influencing the industry.
Investment Banking, Global Wallet, Drivers
false
Market Analysis and Trends
Financial Services financial-services
Mixed Chart
JP Morgan
View slide
Features a combination of column and line charts for GIB, M&A, DCM, and ECM. The slide includes a legend, market share trend lines, and key takeaways at the bottom.
Financial Performance
Financial Services
Displays market share growth in global investment banking sectors, emphasizing leadership and deal participation over five years.
Investment Banking, Market Share, M&A, DCM, ECM
false
Financial Performance
Financial Services financial-services
Multiple Chart
JP Morgan
View slide
This slide features a column chart with a timeline from 2010 to 2019, depicting market share and investment banking rank. The chart is annotated with percentage figures and gaps between the ranks.
Market Analysis and Trends
Financial Services
The slide illustrates the #1 rank in Global Investment Banking fees and a 9.0% market share in 2019, highlighting the company's leadership over the decade.
Investment Banking, Market Share, Rank, Column Chart, Decade, Leadership, Percentage, Global, Finance
false
Market Analysis and Trends
Financial Services financial-services
Single Chart
JP Morgan
View slide
This slide is divided into two parts: on the left, a blue box lists strategic priorities, and on the right, a green checkmark list presents market dynamics. The slide has a blue header and footer with the page number at the bottom right.
Strategic Planning
Financial Services
Aimed at the financial sector, this slide details the strategic priorities and market dynamics that drive share gains and client footprint expansion for the presenter's investment banking division. Useful for strategic planning meetings or financial sector analyses, it communicates the company's market share growth and strategic business expansion, making it relevant for internal strategy discussions and investment banking market analysis.
Investment Banking, Market Share, Strategy, Growth, Client Base, Financing, Market Dynamics
false
Strategic Planning
Financial Services financial-services
Header Horizontal
Goldman Sachs
View slide
Displays a line chart of the combined wallet size from 2019 to 2026 alongside column charts of investment banking fees and market income, indicating trends and recovery.
Investment Analysis
Financial Services
This slide offers a detailed review of investment banking growth based on realistic market assumptions, showing past income trends and future projections. It is crucial for understanding the financial landscape and planning investment strategies, providing insights into market recovery and stability expectations.
Investment Banking, Market Trends, Growth
false
Investment Analysis
Financial Services financial-services
Multiple Chart
Barclays
View slide
Slide with column chart comparing investment banking net revenues, alongside a table detailing financial metrics such as net revenues, earnings, and equity. The graphs use blue and white bars, and the layout is clean and data-focused.
Investment Analysis
Financial Services
Summarizes the financial results and highlights of investment banking activities, suitable for investor briefings or financial strategy meetings. It provides insights into areas like equity, debt underwriting, and financial advisory services.
Investment Banking, Net Revenue, Financial Advisory
false
Investment Analysis
Financial Services financial-services
Mixed Chart
Goldman Sachs
View slide
The slide contains a bubble chart and various company logos with financial data. It is divided into two main sections, showing local execution platform and cooperation details.
Market Analysis and Trends
Financial Services
The slide highlights Credit Suisse's position in Investment Banking in Switzerland, showing execution platform details and cooperation with other divisions.
Investment Banking, Switzerland, market analysis, execution platform, cooperation
false
Market Analysis and Trends
Financial Services financial-services
Mixed Chart
Credit Suisse
View slide
Concludes the series with a tabular view of the top three considerations for investors when making decisions, marking the significance of changes.
Investment Analysis
Financial Services
Caps off the series with an investor focus on investment decision criteria, key for investment strategy and portfolio management.
Investment Criteria, Decision Making, Growth Outlook, Margin Potential, Cash Flow, Returns on Capital, Valuation Levels, ESG Considerations, Governance Policies, Market Opportunities
false
Investment Analysis
Financial Services financial-services
Table
BCG
View slide
Incorporates a column chart displaying factors important for investment decisions, labeled with rankings and percentage importance.
Strategic Planning
Professional Services
Explores the key factors influencing corporate investment decisions, highlighting the significance of workforce cost and economic stability.
Investment Decisions, Workforce Cost, Economic Stability, Strategic Factors
false
Strategic Planning
Professional Services professional-services
Single Chart
Bain
View slide
Composed of multiple vertical bar graphs, this slide indicates the factors investors consider when making investment decisions. It uses a teal color scheme with variations in bar height to represent percentages, making it data-rich and informative.
Investment Analysis
Financial Services
The slide conveys investors' focus on various company-specific factors for investment consideration, such as long-term growth and valuation, suitable for analyzing investment criteria.
Investment Factors, Market Share, Valuation, Cash Flow, Balance Sheet, Organic Growth, Capital Improvement, Long-term Outlook, Strategic Investment, Company Evaluation
false
Investment Analysis
Financial Services financial-services
Mixed Chart
BCG
Previous
Hold On!
We are searching in our database
If nothing, comes up, please try different filters!
Column Chart
Heatmap
Chevron
Org Chart
Infographic
Callouts
Timeline
List
Graphic
Picture
Process Flow
Diagram
Paragraph
Map
Table
Framework
Subtitle
Takeaway Box
Icon
Other Chart
Radar Chart
Waterfall Chart
Mekko Chart
Pie Chart
Scatter Plot
Line Chart
Bar chart
Bullet points
Create a FREE account to continue browsing
Receive Instant Access to 1,000+ slides from companies like McKinsey, Google, and Goldman Sachs
First Name
Last Name
Email
Password
I agree to all
Terms & Privacy Policy
Thank you! Your submission has been received!
Oops! Something went wrong while submitting the form.
Have an account?
Sign in
Upgrade to PRO to Save slides
Advanced Search and Filters
Access to 15,000+ slides
Access to Category Pages
Save/Bookmark Slides
PowerPoint Template Library
Pick a Plan
MONTHLY
$12/month
Billed every month, Cancel anytime.
YEARLY
$9/year
Billed $108 annually, Cancel anytime.
Checkout for $12/month
Checkout for $108/yr
Secured by Stripe | AES-256 bit encryption