My Account
My Slides
Search by Category
Templates
Leave Feedback
Login
Logout
Get Started
Browse all Slides
Browse all Slides
Create a FREE Account
Instant access to 1,000+ real slides from top companies like McKinsey, BCG, Goldman Sachs, Google and many more!
First Name
Last Name
Email
Password
I agree to all
Terms & Privacy Policy
Thank you! Your submission has been received!
Oops! Something went wrong while submitting the form.
Have an account?
Sign in
📢 Ready to start building slides? Check out our new template library
VIEW TEMPLATES
Welcome,
Welcome
PRO
Show Featured Only
Checkbox 8
Companies
Mckinsey
Bain
BCG
EY
Deloitte
Accenture
PwC/Strategy&
JP Morgan
Goldman Sachs
Morgan Stanley
Citigroup
Deutsche Bank
Barclays
LEK
KPMG
Kearney
Oliver Wyman
Booz Allen Hamilton
Gartner
IPSOS
Nielsen
Slide type
Text Only
Linear Flow
Vertical Flow
Single Chart
Header Horizontal
Mixed Chart
Header Vertical
Pillar
Multiple Chart
Graphic
Agenda
Title
Table
Framework
Industry
Technology & Software
Artificial Intelligence
Financial Services
Retail & E-commerce
Consumer Goods
Industrial & Manufacturing
Transportation & Logistics
Telecommunications
Real Estate & Construction
Hospitality & Tourism
Professional Services
Education & Training
Media & Entertainment
Agriculture & Food Production
Healthcare & Pharmaceuticals
Environmental Services & Sustainability
Government & Public Sector
Use Case
Mergers and Acquisitions
Performance Metrics and KPIs
Client Case Studies
Competitive Landscape
Corporate Finance and Valuation
Product and Service Analysis
Customer and Market Segmentation
Organizational Structure and Change
Industry Overview
Regulatory and Compliance
Risk Assessment and Management
Investment Analysis
Organizational Structure and Change
Human Resources and Talent Management
Financial Performance
Market Analysis and Trends
Sales and Business Development
Human Resources and Talent Management
Clear all
Thank you! Your submission has been received!
Oops! Something went wrong while submitting the form.
Tag
View slide
Includes multiple small column charts displaying trends in net interest income, loans, and deposits across several business units.
Financial Performance
Financial Services
Analyzes the performance of net interest income and the dynamics of loan and deposit figures across various segments. The slide provides detailed financial metrics to assess liquidity and lending performance over recent quarters.
Interest, Income, Loans, Deposits, Analysis
false
Financial Performance
Financial Services financial-services
Multiple Chart
Citigroup
View slide
Features column charts and a complex table. The design utilizes shades of blue, gray, and white and is dense with both graphics and text.
Financial Performance
Financial Services
It provides a detailed account of net interest income and loan distribution, offering insights into the financial health and lending practices of the firm.
Interest, Income, Loans, Financial, Health, Lending, Practices, Insights, Distribution, Firm
false
Financial Performance
Financial Services financial-services
Mixed Chart
Goldman Sachs
View slide
Two pie charts illustrating Canadians' knowledge of interest rates, showing the correct response rates and comparisons between 2023 and 2022.
Human Resources and Talent Management
Financial Services
This slide assesses the understanding of interest rates among Canadians, showing the percentage of correct answers and comparing data from 2023 to 2022.
Interest, rate, knowledge, Canadians, 2023, 2022
false
Human Resources and Talent Management
Financial Services financial-services
Multiple Chart
IPSOS
View slide
This slide features a bar chart displaying the incremental cost to firm intermittent renewable resources across different regions, alongside the levelized cost of energy for gas peaking and combined cycle.
Risk Assessment and Management
Energy & Utilities
The slide examines the cost of firming intermittent renewable energy sources, comparing it with conventional gas peaking and combined cycle plants to highlight the challenges of integrating renewables.
Intermittency, Firming Cost, Renewable Energy, Comparison, Gas Peaking
false
Risk Assessment and Management
Energy & Utilities energy-and-utilities
Mixed Chart
Roland Berger
View slide
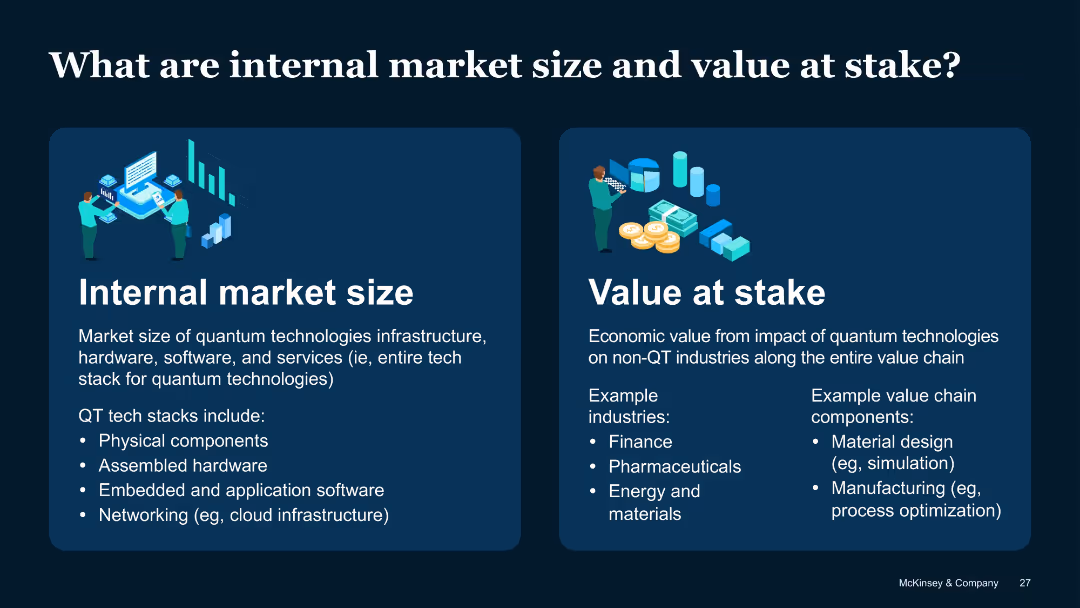
Two-column layout with icons and text explaining internal QT market size vs external value impact
Strategic Planning
Artificial Intelligence
The slide defines "internal market size" as the value of QT infrastructure and services, and "value at stake" as the broader economic impact on non-QT sectors like finance and energy. It clarifies QT’s economic ecosystem.
Internal Market, Value at Stake, QT Impact, Economic Potential, Use Cases
false
Strategic Planning
Artificial Intelligence artificial-intelligence
Boxed
McKinsey
View slide
This slide contains two column charts, each showing data for different regions (Global, US, LATAM, Europe, APAC) on internal risks and strategic priorities. Key findings are highlighted in text boxes.
Risk Assessment and Management
Financial Services
The slide analyzes internal risks and strategic priorities in various regions. It highlights the top internal risks and strategic priorities for the past and next 24 months.
Internal risks, strategic priorities, regions, analysis, financial services
false
Risk Assessment and Management
Financial Services financial-services
Multiple Chart
Deloitte
View slide
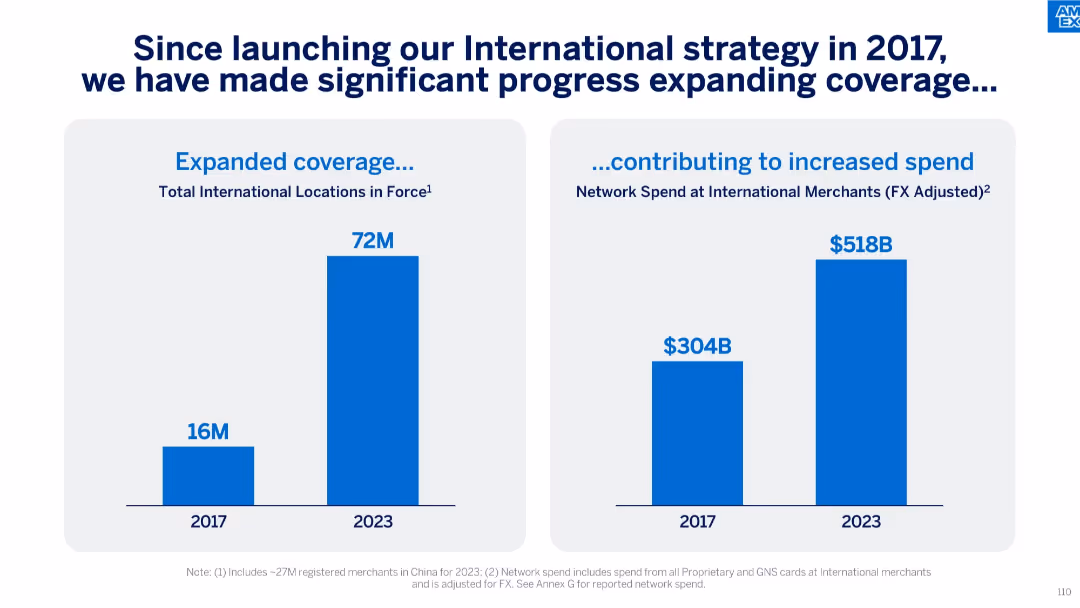
Two vertical bar charts: one for expanded international locations, another for network spend growth at international merchants.
Strategic Planning
Financial Services
This slide shows the outcome of the 2017 international strategy, highlighting significant increases in locations (from 16M to 72M) and FX-adjusted network spend (from $304B to $518B) at international merchants by 2023.
International Strategy, Merchant Spend, FX Adjusted, Location Growth, Global Expansion
false
Strategic Planning
Financial Services financial-services
Single Chart
McKinsey
View slide
A world map highlighting specific regions with markers, annotated with revenue, headcount, and office numbers from 1990. Minimal text and clean design.
Industry Overview
Financial Services
Illustrates the initial international presence and expansion of the company, showing early-stage revenues, headcount, and the number of offices.
International growth, expansion, revenue, headcount, offices
false
Industry Overview
Financial Services financial-services
Graphic
Goldman Sachs
View slide
Slide features bar graphs comparing GMV of Thailand’s internet economy from 2019 to 2025, highlighted by growth rates. Sparse text.
Industry Overview
Technology & Software
Predicts the growth of Thailand’s internet economy despite challenges, with an estimated value reaching $57B by 2025.
Internet Economy, Thailand, Growth, Projection, Pandemic, Political, GMV, 2025
false
Industry Overview
Technology & Software technology-and-software
Single Chart
Bain
View slide
Bar graph showing growth in internet economy GMV from 2019 to 2025, with a forecast. The layout is clean with a central graph and annotations for CAGR percentages. The color scheme is blue and gray, adhering to a professional look.
Financial Performance
Technology & Software
The slide presents the growth of Vietnam's internet economy, reaching $21 billion. It provides a positive outlook on the government and economy's resilience, with projections up to 2025.
Internet Economy, Vietnam, GMV, Resilience, Government, Growth, Forecast, CAGR
false
Financial Performance
Technology & Software technology-and-software
Single Chart
Bain
View slide
The slide features a single, prominent column chart showing growth from 2015 to 2020 with future projections to 2025 for Vietnam's Internet economy, including percentage growth rates.
Market Analysis and Trends
Financial Services
It illustrates the growth of Vietnam's Internet e-Conomy Gross Merchandise Value (GMV), highlighting past performance and future expectations with a Compound Annual Growth Rate (CAGR) analysis.
Internet Economy, Vietnam, Growth, Projections, GMV
false
Market Analysis and Trends
Financial Services financial-services
Single Chart
Bain
View slide
Slide with a timeline showing the growth in internet users over three years. Each year is represented by a different size and colored circle, with numbers indicating user growth.
Market Analysis and Trends
Technology & Software
Provides a visual representation of internet user growth in Southeast Asia, showing the year-over-year increase. Used for discussing trends in digital adoption and the expanding internet user base.
Internet Users, Growth, SEA
false
Market Analysis and Trends
Technology & Software technology-and-software
Single Chart
Bain
View slide
The slide employs a clean layout with a large bar chart that communicates the internet economy's growth in Singapore, along with annotations for future projections.
Financial Performance
Technology & Software
Summarizes the reach of the internet economy in Singapore, considering the challenges faced due to lockdowns, and forecasts growth, highlighting digital transformation and economic resilience.
Internet economy, Economic resilience, Lockdown challenges, Growth projection
false
Financial Performance
Technology & Software technology-and-software
Single Chart
Bain
View slide
The slide is minimalistic with a single bar chart depicting the growth of the internet economy in the Philippines. The projected growth is also indicated.
Financial Performance
Technology & Software
Highlights the doubling of the Philippines' internet economy in 2021 and its expected future value, emphasizing the impact of the pandemic and government initiatives.
Internet economy, Growth forecast, Government initiatives, Pandemic impact
false
Financial Performance
Technology & Software technology-and-software
Single Chart
Bain
View slide
A single column chart shows the resilient growth of Malaysia's internet economy GMV from 2015 to projected 2025.
Market Analysis and Trends
Technology & Software
Shows Malaysia's internet economy's resilient growth, reaching US $11B with future projections and growth rate.
Internet economy, Malaysia, GMV, Resilience, Growth, Projections, 2015, 2025
false
Market Analysis and Trends
Technology & Software technology-and-software
Single Chart
Bain
View slide
Contains a stacked column chart showing market size by segment and a bulleted list on the left, with annotations and a footnote.
Industry Overview
Technology & Software
Summarizes the internet economy's expected growth in Southeast Asia by 2025, breaking down the market into ecommerce, travel, and online media segments with a focus on the significant share of ecommerce and travel in online retail spend.
Internet economy, SEA, market size, ecommerce, travel, online media
false
Industry Overview
Technology & Software technology-and-software
Single Chart
Bain
View slide
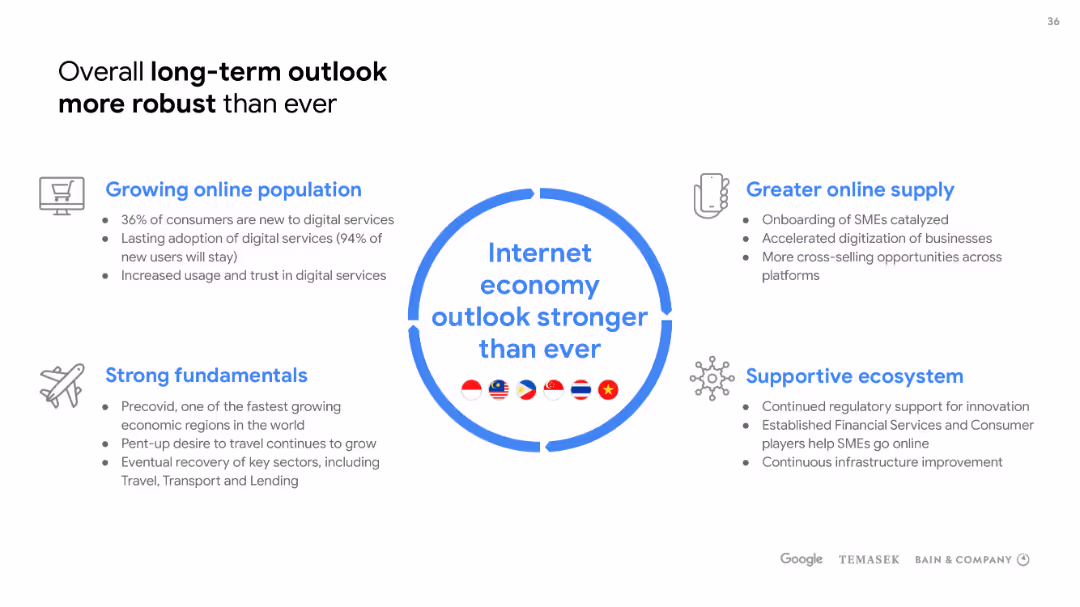
Dominated by a large circular infographic in the center, with descriptive bullet points around it, the slide uses a balance of icons, text, and graphics on a white background.
Strategic Planning
Technology & Software
Focuses on the long-term positive outlook of the internet economy, citing growing online population, strong fundamentals, greater online supply, and a supportive ecosystem. Useful for strategic planning discussions.
Internet economy, outlook, online population, fundamentals, ecosystem
false
Strategic Planning
Technology & Software technology-and-software
Header Vertical
Bain
View slide
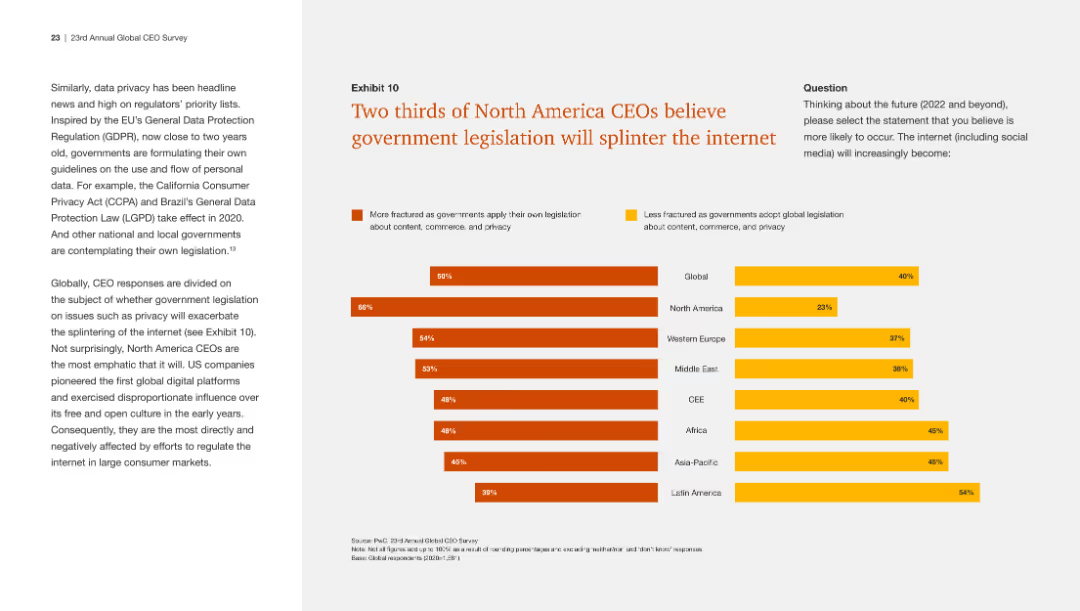
Utilizes bar charts to display CEO opinions on the potential fragmentation of the internet due to government legislation across various regions. The slide is cleanly organized with a consistent color scheme to denote different responses.
Regulatory and Compliance
Financial Services
Reveals the perspectives of North American CEOs on government legislation and its impact on the internet's integrity, serving as a discussion point for internet regulation and corporate strategy implications.
Internet fragmentation, CEO beliefs, Government legislation, Regional impact, Corporate strategy
false
Regulatory and Compliance
Financial Services financial-services
Multiple Chart
PwC/Strategy&
View slide
Features bar charts contrasting the expected government actions as foreseen by CEOs. The data is arranged to facilitate comparison between interventions and maintains the color-coding for visual clarity.
Regulatory and Compliance
Financial Services
The slide presents CEO predictions on government interventions in tech regulation, big tech breakup, and personal data compensation. It serves as an insight into future regulatory expectations and is relevant for discussions on privacy, data management, and corporate governance.
Internet legislation, Tech regulation, CEO forecasts, Data privacy, Government intervention, Big tech
false
Regulatory and Compliance
Financial Services financial-services
Mixed Chart
PwC/Strategy&
View slide
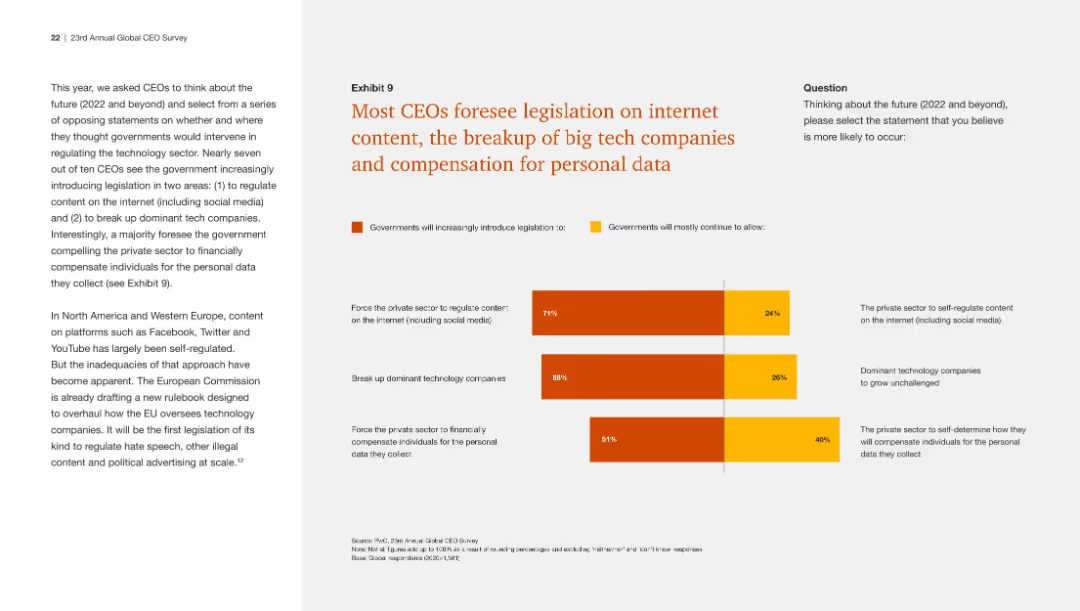
This slide includes a bar chart showing CEOs' predictions about future legislation on internet content, tech company breakups, and personal data compensation. The design is clear.
Regulatory and Compliance
Technology & Software
The slide presents survey results indicating that most CEOs believe there will be increased government regulation in internet content, tech company breakups, and data compensation.
Internet legislation, tech companies, personal data, CEO predictions, regulation
false
Regulatory and Compliance
Technology & Software technology-and-software
Mixed Chart
PwC/Strategy&
View slide
Slide showcases three circles growing in size from left to right with labels for 2015, 2019, and 2020, indicating the increasing number of internet users in SEA.
Market Analysis and Trends
Technology & Software
Illustrates the explosive growth of the internet user base in Southeast Asia from 2015 to 2020, emphasizing the rapid digital adoption in the region.
Internet users, Southeast Asia, growth, digital adoption, comparative analysis, 2020, 2015, 2019
false
Market Analysis and Trends
Technology & Software technology-and-software
Multiple Chart
Bain
View slide
A graphically dense slide with statistics on internet downloads, preferences for network reliability, and illustrations that emphasize user engagement with the nbn™ network.
Technology and Digital Transformation
Telecommunications
Highlights the preferred status of the nbn™ network in Australia, its value to users, and the significant amount of internet traffic it handles.
Internet, Downloads, nbn, Connectivity, User Preference, Traffic
false
Technology and Digital Transformation
Telecommunications telecommunications
Pillar
Accenture
View slide
Bubble chart showing the projected revenue growth from 2018 to 2023 in different media sectors, with size indicating magnitude.
Market Analysis and Trends
Media & Entertainment
Analyzes the future revenue growth in internet access and advertising compared to other media sectors, projecting significant growth for internet sectors.
Internet, Revenue Growth, Media, 2018-2023, Advertising, Access
false
Market Analysis and Trends
Media & Entertainment media-and-entertainment
Multiple Chart
PwC/Strategy&
View slide
A pie chart and bar graphs with percentages in shades of purple. The slide focuses on Australian users' preferences for the nbn™ network over mobile data for internet connection.
Market Analysis and Trends
Telecommunications
It shows a consumer survey's findings on preferences for internet access at home, with a majority favoring the nbn™ network over mobile data for its reliability, affordability, and speed.
Internet, Survey, Preferences, Home Connection, nbn™, Mobile Data, Reliability, Affordability, Speed, Australia
false
Market Analysis and Trends
Telecommunications telecommunications
Multiple Chart
Accenture
View slide
This slide features a bar chart showing regional differences in CEO opinions on whether government legislation will fracture the internet. It is detailed and visually organized.
Regulatory and Compliance
Technology & Software
The slide indicates that a significant portion of North American CEOs believe government legislation will lead to a fragmented internet, compared to other regions.
Internet, legislation, North America, CEO opinions, government
false
Regulatory and Compliance
Technology & Software technology-and-software
Multiple Chart
PwC/Strategy&
View slide
The slide shows a vertical bar chart comparing the percentage of people agreeing with the statement about the importance of the internet across various countries.
Market Analysis and Trends
Technology & Software
The slide highlights global survey results indicating a widespread recognition of the importance of the internet in people's lives.
Internet, technology, global survey, public opinion, internet importance
false
Market Analysis and Trends
Technology & Software technology-and-software
Multiple Chart
IPSOS
View slide
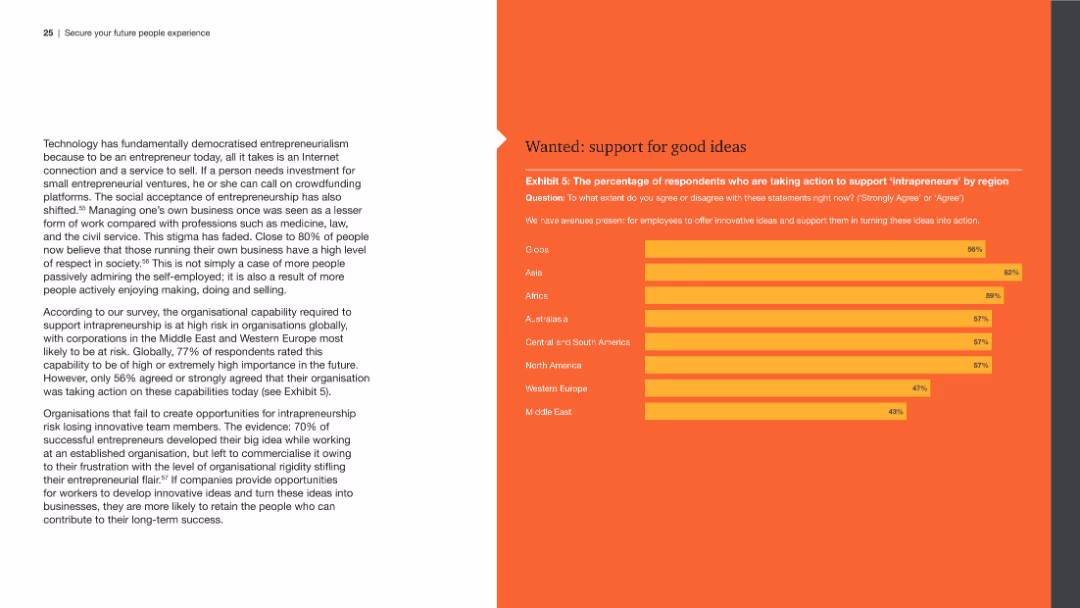
The slide consists of a left panel with text discussing entrepreneurial support and a right panel with a horizontal bar chart showing regional differences in support for intrapreneurs.
Human Resources and Talent Management
Professional Services
This slide addresses the organizational support needed for intrapreneurship, presenting survey data on regional variations in providing avenues for innovative ideas and their implementation.
Intrapreneurship, entrepreneurial support, innovation, regional differences, survey data
false
Human Resources and Talent Management
Professional Services professional-services
Mixed Chart
PwC/Strategy&
View slide
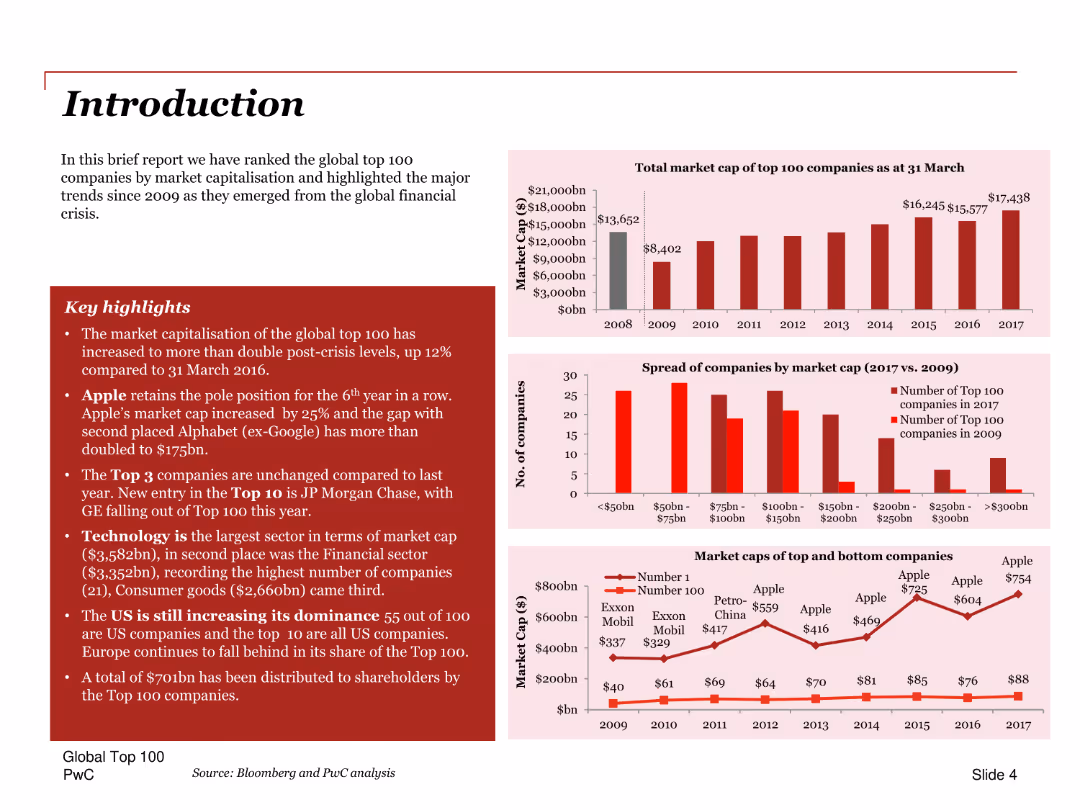
A title slide with an introduction to a report, featuring key highlights and column charts showing market capitalization trends.
Industry Overview
Technology & Software
Introduces the report on the global top 100 companies by market capitalization, highlighting key trends and changes since 2009. Includes insights on technology sector dominance.
Introduction, market capitalization, trends, global top 100, key highlights, technology, financial crisis, market trends
false
Industry Overview
Technology & Software technology-and-software
Multiple Chart
PwC/Strategy&
View slide
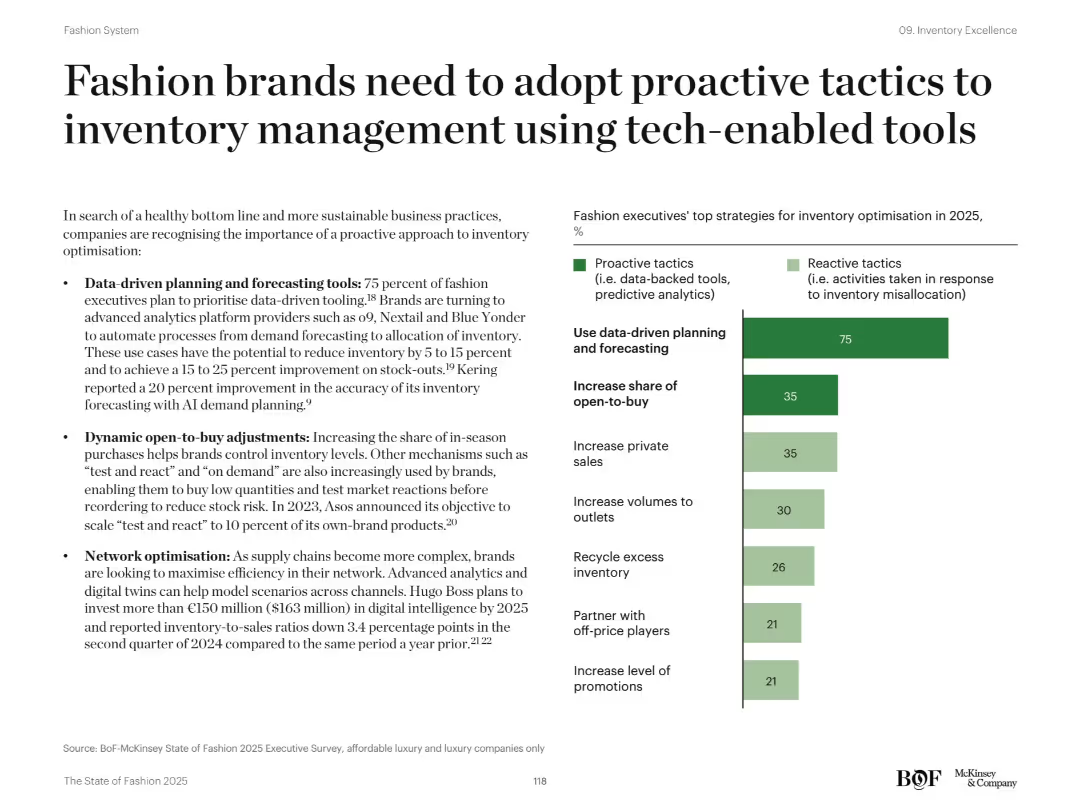
Split layout: left side contains bullet-point text with insights on data-driven forecasting, open-to-buy adjustments, and network optimization. Right side features a horizontal bar chart comparing proactive vs. reactive inventory tactics.
Operational Efficiency
Retail & E-commerce
This slide advocates for proactive, tech-enabled inventory management practices in the fashion industry. It highlights strategies such as AI-powered demand forecasting, dynamic inventory control, and supply chain optimization to reduce costs and improve stock accuracy. A chart shows 75% of executives favoring data-driven forecasting by 2025.
Inventory optimization, AI forecasting, open-to-buy, dynamic planning, retail strategy, network optimization, supply chain, fashion brands, analytics, inventory misallocation
false
Operational Efficiency
Retail & E-commerce retail-and-e-commerce
Mixed Chart
McKinsey
View slide
Scatter plot graph correlating inventory turns with gross margin, accompanied by analyst commentary.
Investment Analysis
Financial Services
Illustrates the relationship between inventory management and profitability in distribution.
Inventory, Profitability, Distribution, Correlation, Gross Margin, Analysis
false
Investment Analysis
Financial Services financial-services
Single Chart
EY
Previous
Loading...
Hold On!
We are searching in our database
If nothing, comes up, please try different filters!
Column Chart
Heatmap
Chevron
Org Chart
Infographic
Callouts
Timeline
List
Graphic
Picture
Process Flow
Diagram
Paragraph
Map
Table
Framework
Subtitle
Takeaway Box
Icon
Other Chart
Radar Chart
Waterfall Chart
Mekko Chart
Pie Chart
Scatter Plot
Line Chart
Bar chart
Bullet points
Create a FREE account to continue browsing
Receive Instant Access to 1,000+ slides from companies like McKinsey, Google, and Goldman Sachs
First Name
Last Name
Email
Password
I agree to all
Terms & Privacy Policy
Thank you! Your submission has been received!
Oops! Something went wrong while submitting the form.
Have an account?
Sign in
Upgrade to PRO to Save slides
Advanced Search and Filters
Access to 15,000+ slides
Access to Category Pages
Save/Bookmark Slides
PowerPoint Template Library
Pick a Plan
MONTHLY
$12/month
Billed every month, Cancel anytime.
YEARLY
$9/year
Billed $108 annually, Cancel anytime.
Checkout for $12/month
Checkout for $108/yr
Secured by Stripe | AES-256 bit encryption