My Account
My Slides
Search by Category
Templates
View All Templates
Download Template Slides
Leave Feedback
Login
Logout
Get Started
Browse all Slides
Browse all Slides
Create a FREE Account
Instant access to 1,000+ real slides from top companies like McKinsey, BCG, Goldman Sachs, Google and many more!
First Name
Last Name
Email
Password
I agree to all
Terms & Privacy Policy
Thank you! Your submission has been received!
Oops! Something went wrong while submitting the form.
Have an account?
Sign in
Spark Your Next Big Idea with New Presentation Templates
VIEW ALL Templates
Welcome,
Welcome
PRO
Show Featured Only
Checkbox 8
Companies
Mckinsey
Bain
BCG
EY
Deloitte
Accenture
PwC/Strategy&
JP Morgan
Goldman Sachs
Morgan Stanley
Citigroup
Deutsche Bank
Barclays
LEK
KPMG
Kearney
Oliver Wyman
Booz Allen Hamilton
Gartner
IPSOS
Nielsen
Slide type
Text Only
Linear Flow
Vertical Flow
Single Chart
Header Horizontal
Mixed Chart
Header Vertical
Pillar
Multiple Chart
Graphic
Agenda
Title
Table
Framework
Industry
Technology & Software
Artificial Intelligence
Financial Services
Retail & E-commerce
Consumer Goods
Industrial & Manufacturing
Transportation & Logistics
Telecommunications
Real Estate & Construction
Hospitality & Tourism
Professional Services
Education & Training
Media & Entertainment
Agriculture & Food Production
Healthcare & Pharmaceuticals
Environmental Services & Sustainability
Government & Public Sector
Use Case
Mergers and Acquisitions
Performance Metrics and KPIs
Client Case Studies
Competitive Landscape
Corporate Finance and Valuation
Product and Service Analysis
Customer and Market Segmentation
Organizational Structure and Change
Industry Overview
Regulatory and Compliance
Risk Assessment and Management
Investment Analysis
Organizational Structure and Change
Human Resources and Talent Management
Financial Performance
Market Analysis and Trends
Sales and Business Development
Human Resources and Talent Management
Clear all
Thank you! Your submission has been received!
Oops! Something went wrong while submitting the form.
Tag
View slide
The slide presents a series of stacked column charts with highlights, showcasing asset management across investments, deposits, and loans. The design uses blue and purple hues, with annotations for key data.
Financial Performance
Financial Services
It shows year-end balances for investments, deposits, and loans, with highlights on significant achievements, indicating a robust asset management strategy focused on serving clients comprehensively.
Asset Management, Investments, Deposits, Loans, Client Service, Balance Sheet, Financial Services, Highlights, Growth
false
Financial Performance
Financial Services financial-services
Multiple Chart
JP Morgan
View slide
With a title at the top, the slide features a table of financial results, column chart of net revenues by segment, and a highlighted points section. It balances detailed data with clear visual elements.
Financial Performance
Financial Services
Designed to report the financial results of asset and wealth management, the slide compares quarter-over-quarter and year-to-date metrics. It may be used in financial analysis, strategic planning, or investor relations to showcase performance and operational highlights.
Asset Management, Net Revenues, Management Fees, Operating Expenses
false
Financial Performance
Financial Services financial-services
Mixed Chart
Goldman Sachs
View slide
The slide contains a column chart and detailed lists of key drivers with explanatory notes. The layout is neatly organized for clear comprehension of complex financial information.
Financial Performance
Financial Services
Focuses on the financial performance of Macquarie Asset Management, particularly base and performance fees. It’s useful for financial reviews and assessing the impact of operating expenses on net income.
Asset Management, Performance Fees, Operating Expenses, Financial Review, Net Income
false
Financial Performance
Financial Services financial-services
Mixed Chart
Goldman Sachs
View slide
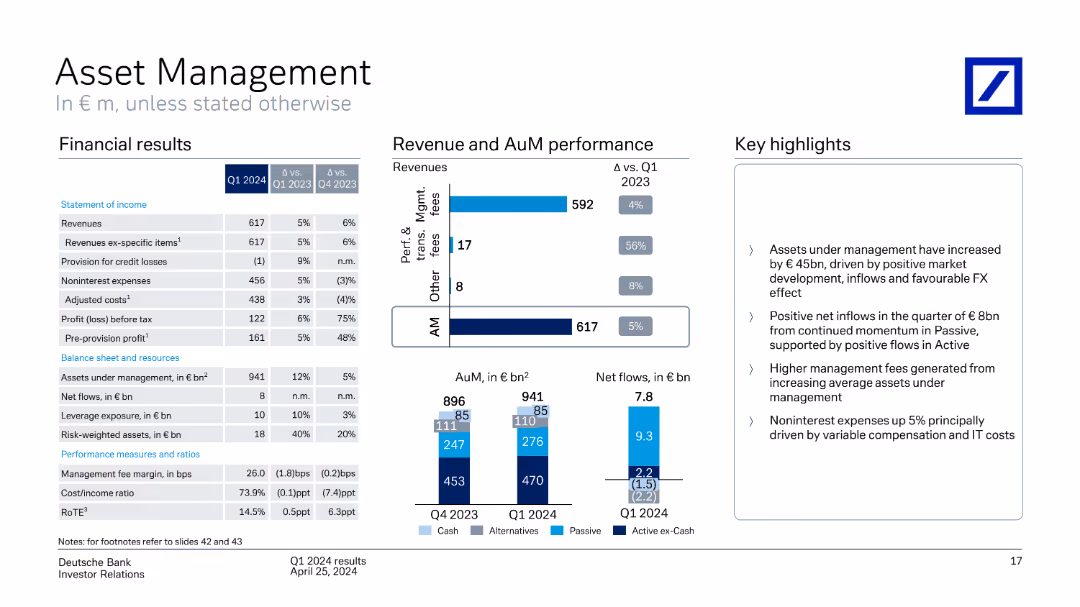
This slide includes bar charts and a column chart reflecting revenue and asset management performance metrics.
Financial Performance
Financial Services
This slide offers an overview of the asset management performance, detailing revenue streams, assets under management, and net flows. It is tailored for stakeholders or analysts in finance, providing a snapshot of financial health and operational changes in asset management, including discussions on net inflows, passive revenue generation, and expense management strategies.
Asset Management, Performance, Revenue, Net Flows, Financial Analysis
false
Financial Performance
Financial Services financial-services
Multiple Chart
Deutsche Bank
View slide
The slide features two distinct column chart sections with annotations, a CAGR arrow, and a segmented arrow.
Financial Performance
Financial Services
This slide presents a financial performance forecast, showing revenue growth and a plan to reduce historical principal investments. It's used to convey long-term growth strategies and financial trajectories.
Asset Management, Revenue Growth, Investment, CAGR
false
Financial Performance
Financial Services financial-services
Multiple Chart
Goldman Sachs
View slide
Dense information slide featuring tables, pie charts, and a significant amount of text to convey detailed data.
Financial Performance
Financial Services
It examines assets under supervision with a detailed breakdown of inflows, outflows, and net changes, used in financial planning or asset management reviews.
Asset Management, Supervision, AUS, Financial Data
false
Financial Performance
Financial Services financial-services
Multiple Chart
Goldman Sachs
View slide
Features a column chart displaying 'Asset & Wealth Management Net Revenues' and a financial results table detailing various types of fees and revenues, with year-over-year and quarter-over-quarter comparisons.
Investment Analysis
Financial Services
The slide provides a financial summary of the Asset & Wealth Management sector, showing revenue generation from management fees, private banking, and investments. Useful for evaluating financial health and opportunities in asset management.
Asset Management, Wealth Management, Net Revenue, Management Fees, Private Banking, Investment, Revenue Analysis, Financial Results
false
Investment Analysis
Financial Services financial-services
Mixed Chart
Goldman Sachs
View slide
A column chart showing revenue and assets under management performance, with a table of financial results and key highlights. The slide is moderately dense with a balanced mix of text and visuals.
Financial Performance
Financial Services
The slide provides an overview of Q1 2024 financial results for Asset Management, detailing revenue, assets under management, and net flows, with key insights on performance and future outlook.
Asset Management, revenue performance, financial results, assets under management
false
Financial Performance
Financial Services financial-services
Multiple Chart
Deutsche Bank
View slide
A combination slide with a table on the left showing a breakdown of loan portfolios and a pie chart on the right detailing corporate loans by industry. Key credit metrics are presented below the table. The slide is data-heavy and designed for an analytical audience.
Financial Performance
Financial Services
The slide provides an overview of loan portfolio allocations and credit quality with specific focus on corporate loans distribution across various industries. It also includes key credit metrics like net charge-off rates. This could be used in investor briefings to explain the company's asset quality and credit management.
Asset Quality, Credit Overview, Loan Portfolio, Corporate Loans, Credit Metrics, Industry Distribution
false
Financial Performance
Financial Services financial-services
Mixed Chart
Goldman Sachs
View slide
This slide features a column chart showing asset sales, mark-ups/mark-downs, and net dispositions. The layout is simple with a significant focus on the data represented by blue columns against a grey backdrop with green accent lines.
Risk Assessment and Management
Financial Services
Highlights the progress in asset sales and balance sheet management over a period. It can be used to inform stakeholders of risk management and asset optimization strategies.
Asset Sales, Equity Investments, Balance Sheet
false
Risk Assessment and Management
Financial Services financial-services
Single Chart
Goldman Sachs
View slide
The slide shows a column chart comparing the market size of assets by revenue in Southeast Asia. The bars are segmented by different revenue size categories, with annotations indicating the total market size.
Investment Analysis
Education & Training
It illustrates the market size distribution of education assets by revenue in Southeast Asia, emphasizing the challenge of asset scale for investors. The contrast between the broad range of smaller revenue assets and the limited number of larger ones is used to discuss investment strategies.
Asset Scale, Investors, Education, Southeast Asia, Market Size, Revenue, Challenge
false
Investment Analysis
Education & Training education-and-training
Single Chart
EY
View slide
Comprises pie charts depicting 'AUS by Asset Class' and 'AUS Mix', and a table summarizing the assets under supervision rollforward. Each graphical element is accompanied by explanatory notes and highlights.
Investment Analysis
Financial Services
A detailed overview of assets under supervision, including class mix and regional distribution, designed for financial analysis and strategic investment planning. Highlights changes in asset valuation and inflows/outflows for the quarter.
Asset Supervision, Asset Class, Client Channel, AUS, Net Inflows, Net Market Appreciation, Investment Strategy, Regional Distribution
false
Investment Analysis
Financial Services financial-services
Multiple Chart
Goldman Sachs
View slide
Features two sets of column charts comparing equity investments and lending asset yields over a three-year period. It utilizes a simple color scheme to differentiate data from the background.
Financial Performance
Financial Services
Analyzes on-balance sheet investment performance, showing asset yields for equity investments and lending, indicating a consistent track record of strong performance over recent years.
Asset Yield, Performance, Equity, Lending
false
Financial Performance
Financial Services financial-services
Multiple Chart
Goldman Sachs
View slide
Pie charts showing strategic asset allocation recommendations by Morgan Stanley's Global Investment Committee.
Strategic Planning
Financial Services
Provides asset allocation advice based on investor risk tolerance and net worth, with detailed recommendations.
Asset allocation, investment, strategy
false
Strategic Planning
Financial Services financial-services
Multiple Chart
Morgan Stanley
View slide
Two pie charts showing asset allocation changes between 2019 and 2020, accompanied by a list of offered solutions.
Risk Assessment and Management
Financial Services
Depicts how asset allocation in UHNW RM book is expected to change due to negative interest rates, with a projected margin uplift of +20bps.
Asset allocation, negative interest rates, UHNW, RM book, solutions
false
Risk Assessment and Management
Financial Services financial-services
Multiple Chart
Credit Suisse
View slide
The slide is divided into upper and lower sections with colorful tables displaying annual return percentages across different asset classes, highlighting higher and lower performances from 2013 to YTD.
Investment Analysis
Financial Services
This retrospective analysis of annual returns across asset classes aids investors in understanding historical performance trends for strategic planning.
Asset class analysis, annual returns, historical performance, financial trends, strategic planning, investment review
false
Investment Analysis
Financial Services financial-services
Table
Morgan Stanley
View slide
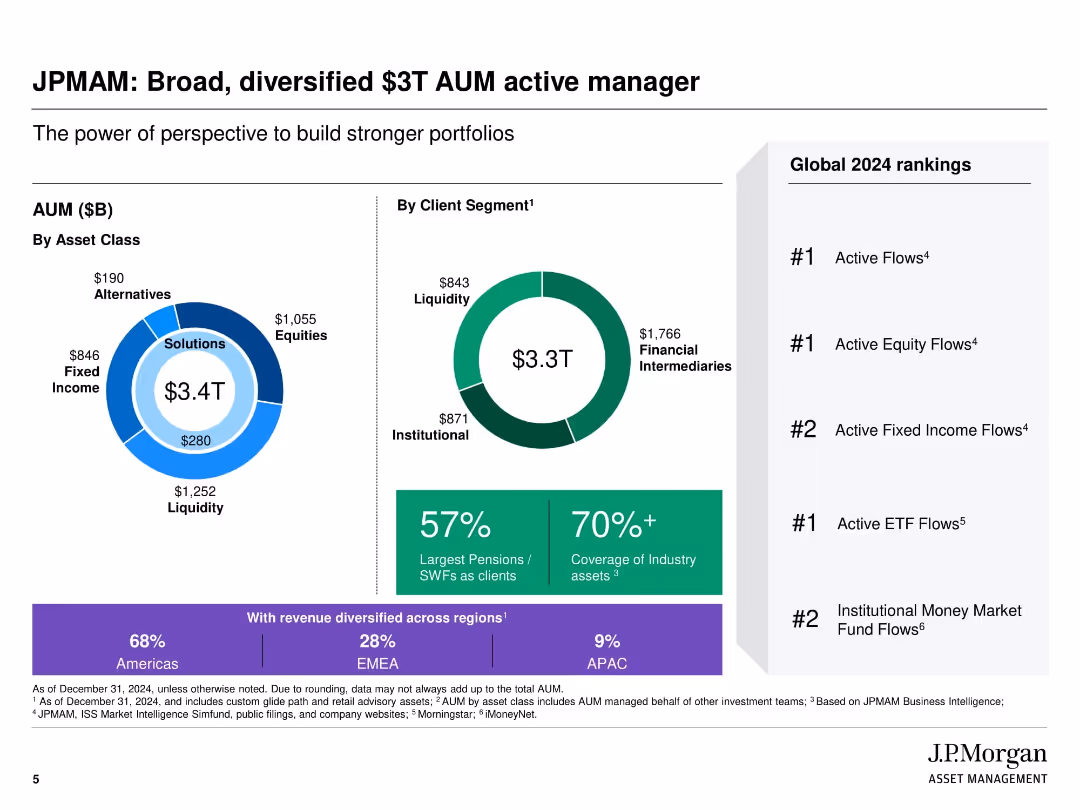
Visually segmented slide with donut and pie charts showing AUM by asset class and client segment; right column with global rankings
Industry Overview
Financial Services
The slide highlights J.P. Morgan Asset Management's diversified $3T AUM, showcasing asset class distribution, client segments, and geographic revenue split. It emphasizes leadership in global rankings across multiple fund flow categories and the firm's wide industry asset coverage.
Asset management, AUM, client segmentation, fund flows, industry leadership, global rankings, J.P. Morgan, diversified portfolio
false
Industry Overview
Financial Services financial-services
Multiple Chart
JP Morgan
View slide
The slide is split into two sections, "Execution of Strategic Priorities" and "Market Dynamics," with bullet points and numerical data. There are checkmarks next to market dynamics points. The layout is clean with a mix of blue and green text for emphasis.
Market Analysis and Trends
Financial Services
The slide discusses the integration of investing businesses and market dynamics in asset management and wealth management. It highlights key financial data and strategic priorities, suggesting a focus on growth and addressing industry trends such as market consolidation and a shift towards alternative investments.
Asset management, Wealth management, Market dynamics, Consolidation, Strategic priorities
false
Market Analysis and Trends
Financial Services financial-services
Header Horizontal
Goldman Sachs
View slide
Presents bar and column charts with financial results and revenues related to asset management, along with detailed textual information on performance metrics and asset under management (AuM) growth.
Financial Performance
Financial Services
This slide focuses on the Q2 2023 financial results for Deutsche Bank's Asset Management division, detailing revenue distribution and highlighting growth in assets under management.
Asset management, financial results, revenue distribution, AuM growth, Deutsche Bank, Q2 2023
false
Financial Performance
Financial Services financial-services
Multiple Chart
Deutsche Bank
View slide
Features growth curves and financial data represented through line graphs and comparative data points.
Financial Performance
Financial Services
The slide reviews a decade of growth in asset management at JPMorgan, focusing on client assets, revenue, and pre-tax income.
Asset management, growth, financial performance, revenue, client assets, investment returns
false
Financial Performance
Financial Services financial-services
Multiple Chart
JP Morgan
View slide
This slide is divided into three sections: 'Scale', 'Competitive advantages', and '5-year performance'. It combines bullet points and a column chart, comparing traditional and alternative asset performances. The design is sleek with good use of space and contrasting elements for readability.
Investment Analysis
Financial Services
It compares key aspects of asset and wealth management, such as scale and performance over five years, relevant for investor insights into the company's market position and competitive advantages in asset management.
Asset management, performance, competitive
false
Investment Analysis
Financial Services financial-services
Table
Goldman Sachs
View slide
Column charts and tables presenting total revenues, profit before tax, and cost/income ratios for different periods.
Financial Performance
Financial Services
Shows total revenues and profit before tax for asset management, highlighting key performance metrics for Q3 2022.
Asset management, revenues, profit, cost/income ratio, UBS, financial performance, Q3 2022, net management fees
false
Financial Performance
Financial Services financial-services
Multiple Chart
UBS
View slide
This slide presents pie charts and donut charts detailing equity and lending investments, using colors to distinguish between sectors and asset classes. The information is well-organized, making it visually accessible.
Investment Analysis
Financial Services
The slide illustrates the diversification and categorization of assets in equity and lending investments. It provides a breakdown by industry, asset class, and region, offering a detailed overview for investment analysis and decision-making processes within asset management.
Asset mix, Equity investments, Lending, Investment analysis, Asset management
false
Investment Analysis
Financial Services financial-services
Multiple Chart
Goldman Sachs
View slide
A dense, color-coded table displays annual asset performance from 1999 to 2023. Various asset classes are represented in colored squares, forming a grid that provides a visual performance history. Below, the source information is cited.
Investment Analysis
Financial Services
The slide is a comprehensive visual representation of the relative performance of various asset classes over a 25-year period, serving as a valuable tool for investment analysis and understanding market trends.
Asset performance, investment analysis, market trends, historical data, annual comparison, asset classes, financial history, relative performance, market research, data visualization
false
Investment Analysis
Financial Services financial-services
Table
Morgan Stanley
View slide
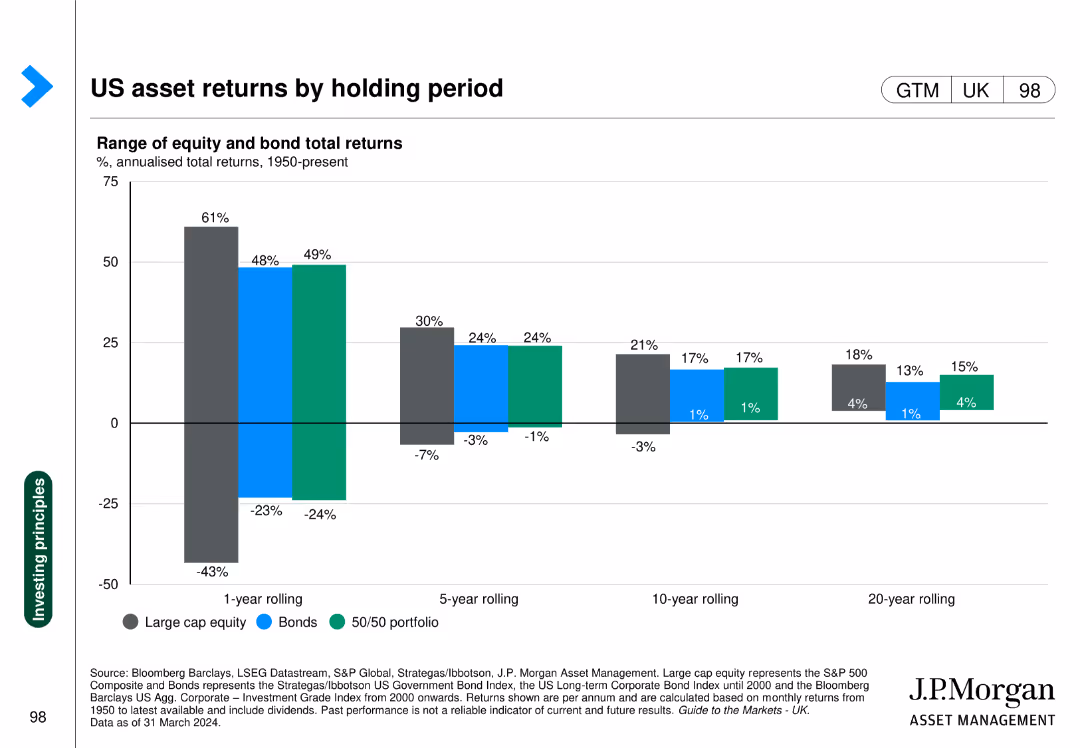
Column chart comparing returns of large cap equity, bonds, and 50/50 portfolios over different holding periods.
Investment Analysis
Financial Services
Highlights the returns of different assets over varying holding periods, emphasizing the importance of investment duration.
Asset returns, holding period, equity, bonds, portfolio
false
Investment Analysis
Financial Services financial-services
Single Chart
JP Morgan
View slide
This slide features tables and pie charts alongside numerical data for AUS and fees. It maintains consistency with a blue color theme and clear segmentation of data, contributing to a structured layout.
Financial Performance
Financial Services
Reviewing asset supervision and management fees, this slide details quarterly and annual data for asset management and consumer & wealth management. It's likely intended for financial review and performance tracking, emphasizing growth and fee management within these financial sectors.
Asset supervision, Management fees, Wealth management, Financial review, Performance tracking
false
Financial Performance
Financial Services financial-services
Multiple Chart
Goldman Sachs
View slide
The slide displays column charts in varying shades of blue, showcasing asset growth over time with annotations. Arrows are used to indicate trends and future projections.
Financial Performance
Financial Services
This slide presents asset growth data and projections for future growth, illustrating traditional and alternative net inflows, with the ultimate goal of reaching a projected AUS of approximately $2.2 trillion.
Asset, Growth, Inflows, Projections, Financial
false
Financial Performance
Financial Services financial-services
Single Chart
Goldman Sachs
View slide
Mix of pie charts, circular diagrams, and ample descriptive texts.
Financial Performance
Financial Services
A comprehensive financial summary detailing asset supervision, management fees, and distribution channels.
Asset, Management, Consumer, Wealth, Supervision, Fees, Pie Chart, Distribution, Financial, Summary, Details
false
Financial Performance
Financial Services financial-services
Multiple Chart
Goldman Sachs
View slide
Features a table, a column chart, and detailed textual descriptions.
Financial Performance
Financial Services
Discusses management fees, incentive fees, equity investments, and net revenue impacts with year-on-year comparisons.
Asset, Management, Fees, Incentives, Investments, Bar Chart, Revenue, Performance, Net Earnings, Financial
false
Financial Performance
Financial Services financial-services
Mixed Chart
Goldman Sachs
View slide
Consists of pie charts and bar graphs, a table, and a key point section, all maintaining a professional blue, gray, and white color scheme.
Investment Analysis
Financial Services
Analyzes asset management investment distribution by sector and geography, offering insights for strategic investment decisions.
Asset, Management, Investment, Distribution, Sector, Geography, Analysis, Insights, Strategic, Decisions
false
Investment Analysis
Financial Services financial-services
Multiple Chart
Goldman Sachs
Previous
Loading...
Hold On!
We are searching in our database
If nothing, comes up, please try different filters!
Column Chart
Heatmap
Chevron
Org Chart
Infographic
Callouts
Timeline
List
Graphic
Picture
Process Flow
Diagram
Paragraph
Map
Table
Framework
Subtitle
Takeaway Box
Icon
Other Chart
Radar Chart
Waterfall Chart
Mekko Chart
Pie Chart
Scatter Plot
Line Chart
Bar chart
Bullet points
Create a FREE account to continue browsing
Receive Instant Access to 1,000+ slides from companies like McKinsey, Google, and Goldman Sachs
First Name
Last Name
Email
Password
I agree to all
Terms & Privacy Policy
Thank you! Your submission has been received!
Oops! Something went wrong while submitting the form.
Have an account?
Sign in
Upgrade to PRO to Save slides
Advanced Search and Filters
Access to 15,000+ slides
Access to Category Pages
Save/Bookmark Slides
PowerPoint Template Library
Pick a Plan
MONTHLY
$12/month
Billed every month, Cancel anytime.
YEARLY
$9/year
Billed $108 annually, Cancel anytime.
Checkout for $12/month
Checkout for $108/yr
Secured by Stripe | AES-256 bit encryption