My Account
My Slides
Search by Category
Templates
Leave Feedback
Login
Logout
Get Started
Browse all Slides
Browse all Slides
Create a FREE Account
Instant access to 1,000+ real slides from top companies like McKinsey, BCG, Goldman Sachs, Google and many more!
First Name
Last Name
Email
Password
I agree to all
Terms & Privacy Policy
Thank you! Your submission has been received!
Oops! Something went wrong while submitting the form.
Have an account?
Sign in
📢 Ready to start building slides? Check out our new template library
VIEW TEMPLATES
Welcome,
Welcome
PRO
Show Featured Only
Checkbox 8
Companies
Mckinsey
Bain
BCG
EY
Deloitte
Accenture
PwC/Strategy&
JP Morgan
Goldman Sachs
Morgan Stanley
Citigroup
Deutsche Bank
Barclays
LEK
KPMG
Kearney
Oliver Wyman
Booz Allen Hamilton
Gartner
IPSOS
Nielsen
Slide type
Text Only
Linear Flow
Vertical Flow
Single Chart
Header Horizontal
Mixed Chart
Header Vertical
Pillar
Multiple Chart
Graphic
Agenda
Title
Table
Framework
Industry
Technology & Software
Artificial Intelligence
Financial Services
Retail & E-commerce
Consumer Goods
Industrial & Manufacturing
Transportation & Logistics
Telecommunications
Real Estate & Construction
Hospitality & Tourism
Professional Services
Education & Training
Media & Entertainment
Agriculture & Food Production
Healthcare & Pharmaceuticals
Environmental Services & Sustainability
Government & Public Sector
Use Case
Mergers and Acquisitions
Performance Metrics and KPIs
Client Case Studies
Competitive Landscape
Corporate Finance and Valuation
Product and Service Analysis
Customer and Market Segmentation
Organizational Structure and Change
Industry Overview
Regulatory and Compliance
Risk Assessment and Management
Investment Analysis
Organizational Structure and Change
Human Resources and Talent Management
Financial Performance
Market Analysis and Trends
Sales and Business Development
Human Resources and Talent Management
Clear all
Thank you! Your submission has been received!
Oops! Something went wrong while submitting the form.
Tag
View slide
Utilizes pie charts and circular diagrams to showcase investment distributions and asset classes.
Investment Analysis
Financial Services
Analyzes the asset mix in equity investments and lending, as well as debt investments, by various categorizations such as industry and region.
Asset, Management, Mix, Equity, Investments, Lending, Debt, Pie Chart, Diagram, Region, Industry, Allocation
false
Investment Analysis
Financial Services financial-services
Multiple Chart
Goldman Sachs
View slide
A visually dense slide featuring tables, a variety of column chart, and sections for textual highlights. The color scheme is blue, gray, and white.
Investment Analysis
Financial Services
Details asset management performance, highlighting net revenues and investment areas. It's used for evaluating asset management strategies and performance.
Asset, Management, Performance, Investment, Net, Revenues, Strategies, Evaluation, Pie Chart, Table
false
Investment Analysis
Financial Services financial-services
Mixed Chart
Goldman Sachs
View slide
The slide includes pie charts, and a table, all showing assets under supervision (AUS). It has a title at the top and key highlights on the right, using a moderate design.
Investment Analysis
Financial Services
This slide focuses on the distribution and changes in assets under supervision for asset and wealth management. Ideal for financial reviews, investor updates, or internal strategic planning, providing insight into asset allocation and client channels.
Assets Under Supervision, AUS Mix, Net Inflows, Equity
false
Investment Analysis
Financial Services financial-services
Multiple Chart
Goldman Sachs
View slide
Tables depict asset distribution by class and region, accompanied by column chart showing asset and net flow changes over time.
Investment Analysis
Financial Services
The slide breaks down firmwide assets under supervision by segment, asset class, and region, with highlights on annual changes. It is useful for assessing investment distributions and monitoring long-term net asset flows.
Assets Under Supervision, Investment, Equity, Fixed Income, Regional Distribution, Net Flows, Asset Class, Financial Analysis, Firmwide Assets
false
Investment Analysis
Financial Services financial-services
Multiple Chart
Goldman Sachs
View slide
This slide contains multiple pie charts, a column chart, and detailed text sections.
Financial Performance
Financial Services
The slide presents a financial comparison of firmwide assets and management fees, along with asset mix and regional distribution.
Assets, Management, Wealth, Distribution, Pie Chart, Column Chart, Financial, Regional, Supervision, Fees
false
Financial Performance
Financial Services financial-services
Multiple Chart
Goldman Sachs
View slide
Multiple tables and pie charts depict firmwide asset supervision and distribution. The layout is evenly split between visual and textual information.
Market Analysis and Trends
Financial Services
Analyzes firmwide assets under supervision, detailing asset distribution by class and region, as well as historical organic net flows. It also emphasizes the mix of assets under supervision, highlighting the firm's financial growth and market presence.
Assets, Supervision, Market Analysis, Financial Growth, Distribution
false
Market Analysis and Trends
Financial Services financial-services
Multiple Chart
Goldman Sachs
View slide
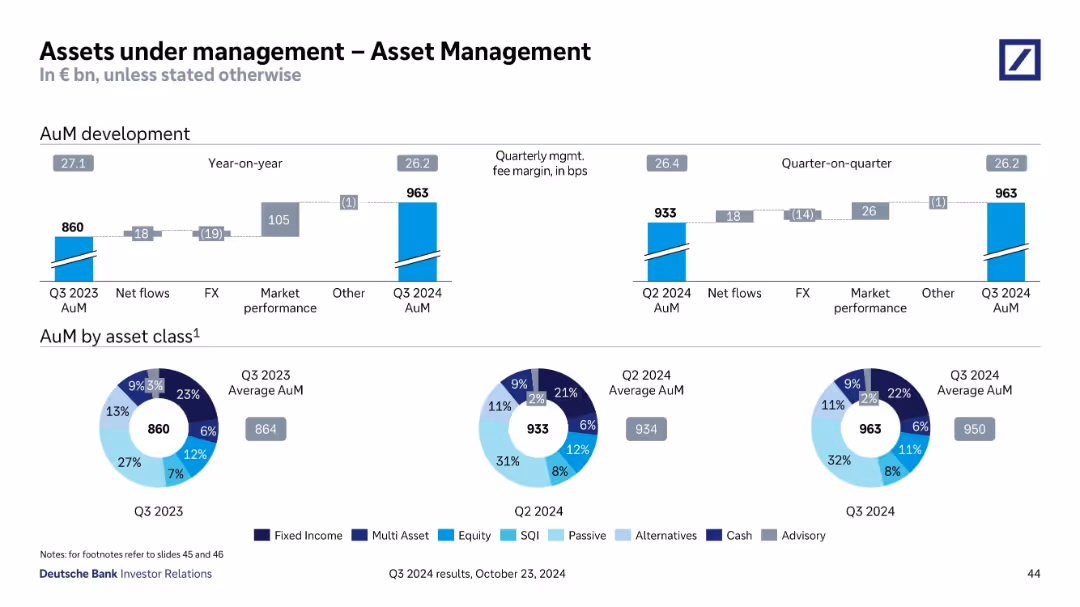
Top shows AuM development bar chart (YoY and QoQ), bottom features pie charts of AuM by asset class for 3 quarters.
Financial Performance
Financial Services
Analyzes changes in Asset Management AuM from Q3 2023 to Q3 2024, highlighting impact from market performance and FX. Pie charts show diversification across fixed income, equity, passive, and other asset classes.
AuM, Asset Management, FX, Market Performance, Fixed Income, Equity
false
Financial Performance
Financial Services financial-services
Multiple Chart
Deutsche Bank
View slide
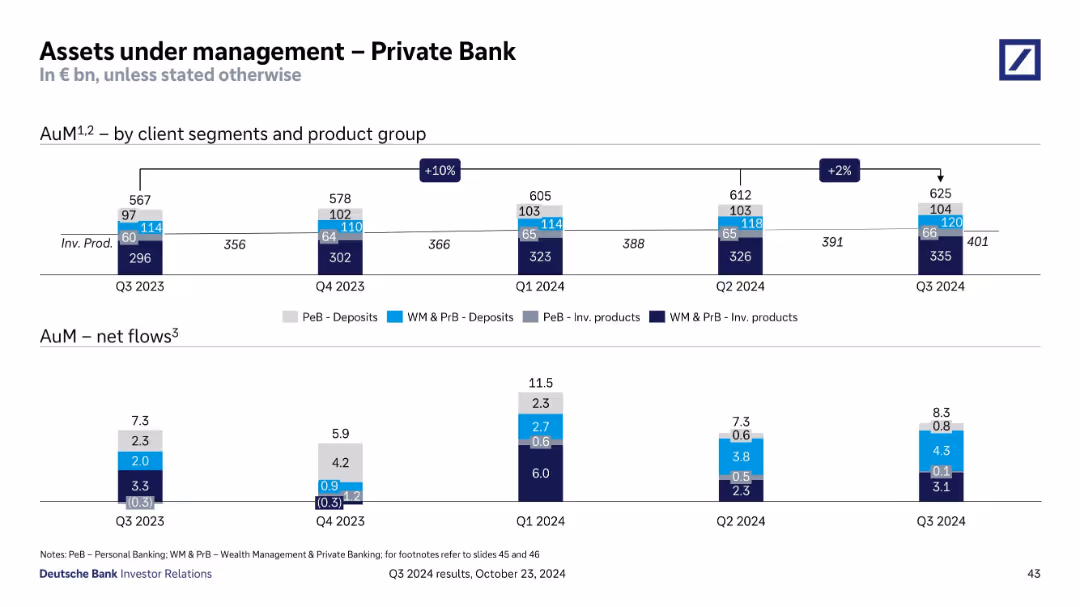
Two sections: stacked bar chart (top) showing AuM by segment/product over time, and bottom chart for net flows.
Financial Performance
Financial Services
Reports AuM growth from Q3 2023 to Q3 2024 in Private Bank, segmented by deposits and investment products. Shows consistent net inflows, peaking in Q1 2024. Indicates client segment behavior and investment trends.
AuM, Private Bank, Deposits, Investment Products, Net Flows
false
Financial Performance
Financial Services financial-services
Single Chart
Deutsche Bank
View slide
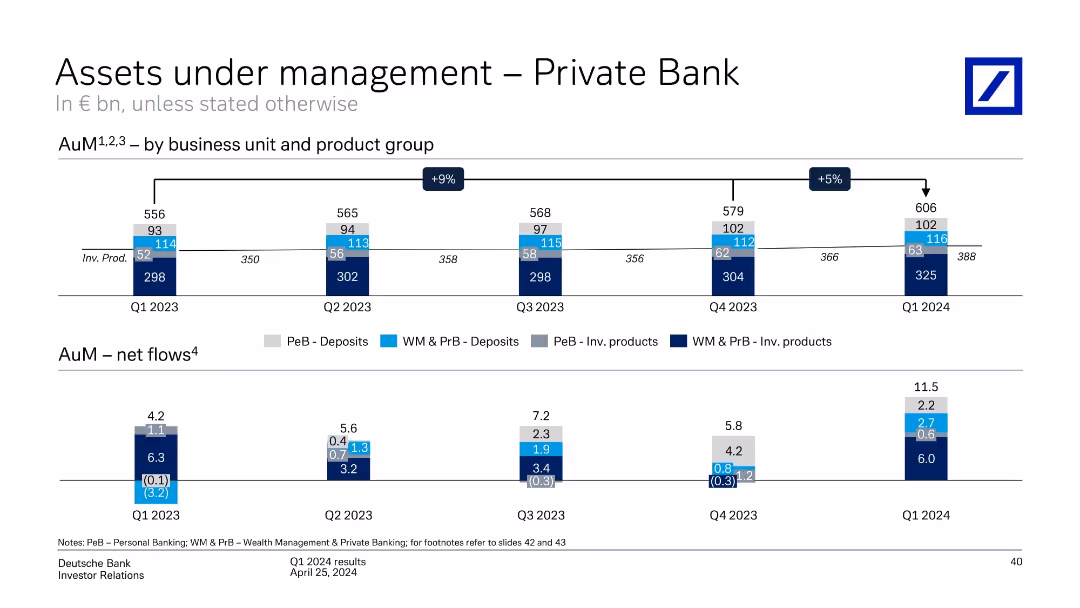
Split into top and bottom sections. Top shows stacked bar chart over time, bottom shows bar charts of net flows by quarter and category.
Financial Performance
Financial Services
The slide tracks AuM evolution across business units and products in Deutsche Bank’s Private Bank from Q1 2023 to Q1 2024. It highlights growth (+5% QoQ), net flows, and diversification across deposits and investment products.
AuM, Private Bank, Net Flows, Deposits, Investment Products, Growth, Q1 2024, KPIs, Revenue
false
Financial Performance
Financial Services financial-services
Single Chart
Deutsche Bank
View slide
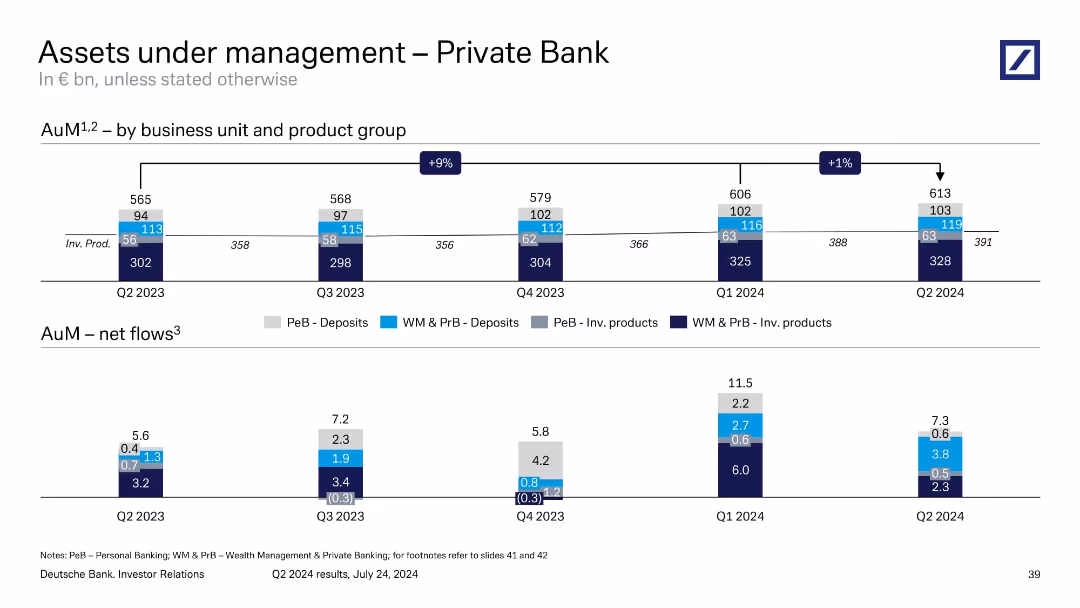
Dual-tier bar chart layout: top tracks AuM over time, bottom shows net flows per segment; business units and product types are color-coded.
Performance Metrics and KPIs
Financial Services
The slide outlines AuM growth in the Private Bank, from €565bn in Q2 2023 to €613bn in Q2 2024. It breaks down contributions by deposits and investment products across personal and wealth segments. It also shows quarterly net flows, demonstrating ongoing client activity and trends in fund allocations.
AuM, Private Bank, net flows, wealth management, deposits, investments
false
Performance Metrics and KPIs
Financial Services financial-services
Single Chart
Deutsche Bank
View slide
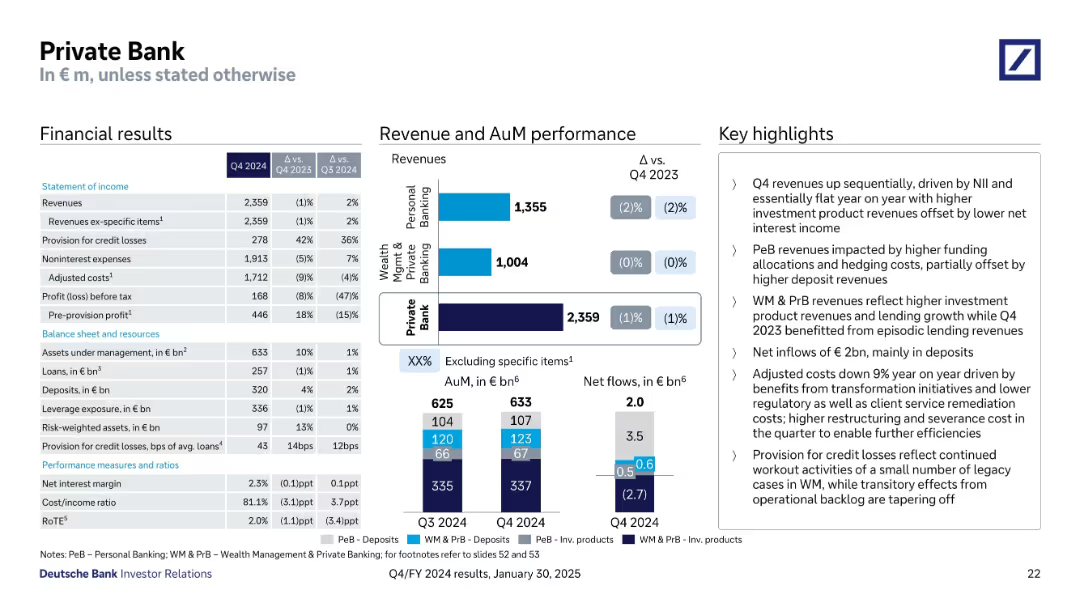
Layout includes financial tables, revenue performance bar charts, and AuM visuals with bullet-point notes
Financial Performance
Financial Services
This slide outlines the Private Bank’s Q4 2024 performance, indicating flat revenues YoY, net inflows of €2bn, and reduced adjusted costs. Revenue is broken down into Wealth Management and Personal Banking. Highlights mention higher deposit revenues, transformation benefits, and credit losses tied to legacy cases.
AuM, Revenues, Deposits, Credit Losses, Transformation, WM, PeB
false
Financial Performance
Financial Services financial-services
Multiple Chart
Deutsche Bank
View slide
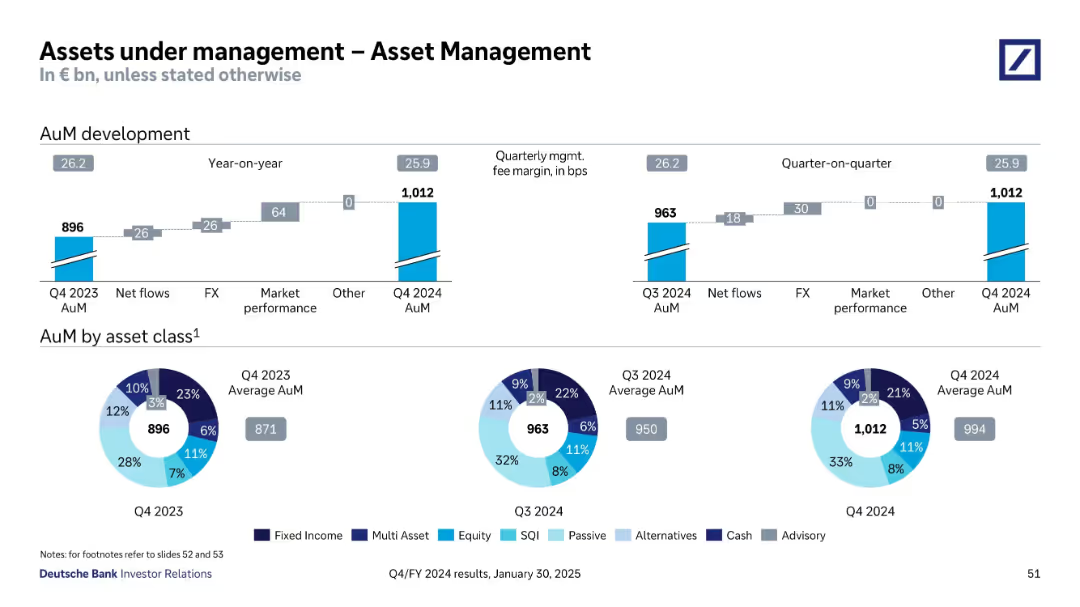
Combined bar and donut charts; top bar shows year-over-year and quarterly development of AuM; bottom pie charts show breakdown by asset class
Financial Performance
Financial Services
The slide shows growth in asset management AuM from Q4 2023 to Q4 2024, detailing sources of growth such as net flows, FX, and market performance. It also includes asset allocation breakdowns by class.
AuM, asset classes, asset management, net flows, FX impact, market performance, Deutsche Bank
false
Financial Performance
Financial Services financial-services
Multiple Chart
Deutsche Bank
View slide
The slide contains two column charts showing yearly and quarterly assets under management (AuM) development and a set of pie charts detailing asset class distributions for different quarters.
Investment Analysis
Financial Services
Provides detailed analysis of asset management growth through net flows, market performance, and fee margins, alongside the composition of assets under management segmented by class, aiding strategic investment decisions.
AuM, asset management, growth analysis, asset class distribution, market performance
false
Investment Analysis
Financial Services financial-services
Multiple Chart
Deutsche Bank
View slide
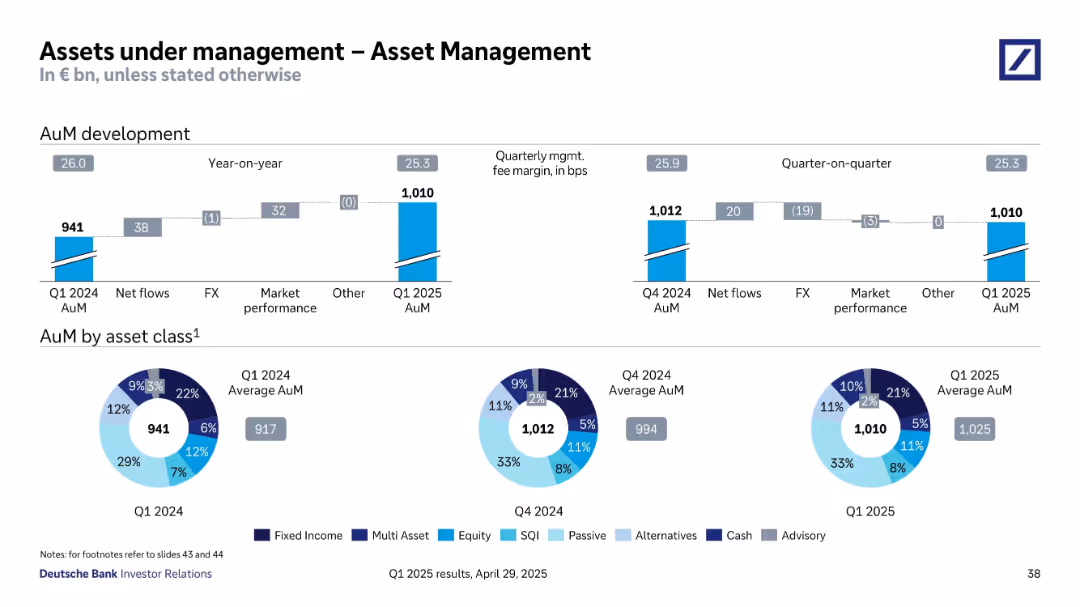
Split into two sections: AuM development (bar chart with net flows, FX, etc.) and pie charts of AuM by asset class.
Financial Performance
Financial Services
The slide details changes in Assets under Management (AuM) over time (YoY and QoQ), showing net flows, FX impacts, and market performance. It also shows the breakdown of AuM by asset class for Q1 2024, Q4 2024, and Q1 2025 with a visual pie chart comparison.
AuM, net flows, market performance, FX, asset classes, equity, fixed income, cash, alternatives, Q1 2025, Deutsche Bank
false
Financial Performance
Financial Services financial-services
Multiple Chart
Deutsche Bank
View slide
This slide features a series of column charts showing assets under management (AuM) over several quarters for different product groups, and a detailed bar chart showing net flows by quarter.
Investment Analysis
Financial Services
The slide presents quarterly financial data of a private bank's assets under management categorized by product type and net flows. This allows for analysis of trends and investment product performance across quarters.
AuM, private bank, net flows, quarterly data, investment products, financial trends
false
Investment Analysis
Financial Services financial-services
Multiple Chart
Deutsche Bank
View slide
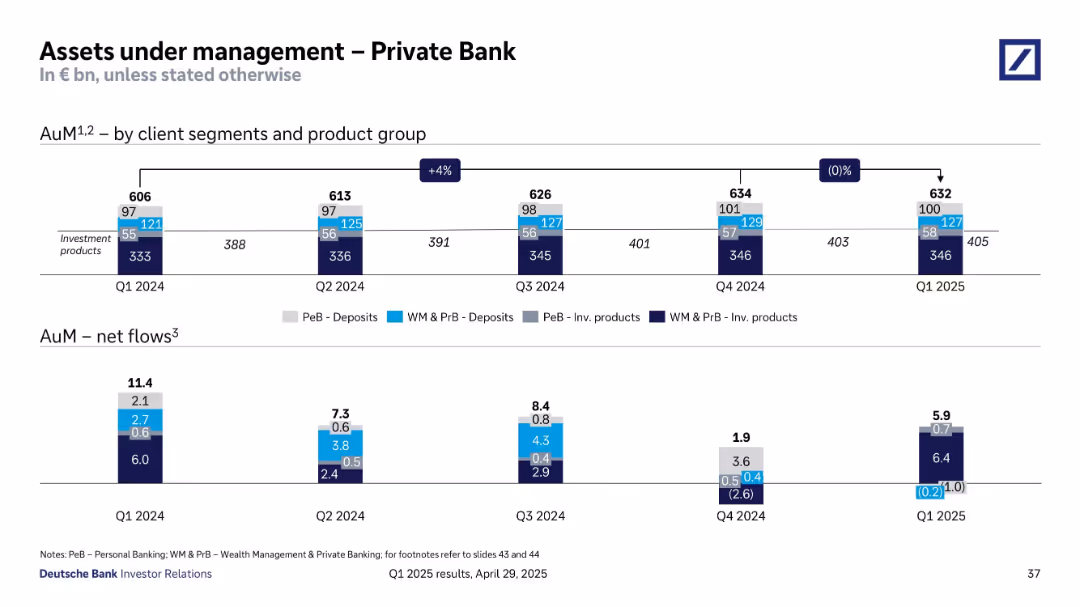
Bar graphs show quarterly AuM by segment and product type, with net flows detailed below. Color-coded by product and client type.
Performance Metrics and KPIs
Financial Services
This slide tracks assets under management (AuM) for the Private Bank from Q1 2024 to Q1 2025, segmented by product type (deposits vs investment products) and client segment. It also presents net flow trends, showing continued positive inflows despite a dip in Q4 2024, suggesting strong client engagement and growth potential.
AuM, private banking, investment products, deposits, net flows, clients
false
Performance Metrics and KPIs
Financial Services financial-services
Single Chart
Deutsche Bank
View slide
The slide features column charts with different color-coded bars representing total population, radio listeners, and podcast listeners. The chart measures consumer willingness to shop and make purchases.
Market Analysis and Trends
Media & Entertainment
The slide highlights that audio consumers are more willing to engage in various activities like shopping and travel post-pandemic. It compares the willingness of the total population with radio and podcast listeners.
Audio, consumers, recovery, shopping, travel, pandemic, willingness, market trends, Nielsen
false
Market Analysis and Trends
Media & Entertainment media-and-entertainment
Multiple Chart
Nielsen
View slide
This slide features a bar chart under "FIGURE 3" and bulleted points discussing the potential of worker time being augmented/automated by intelligent technologies.
Market Analysis and Trends
Technology & Software
The slide details which roles are most susceptible to automation and augmentation by intelligent technologies, with a focus on how worker activities evolve with these advancements.
Augmentation, Automation, Employment, Trends, AI
false
Market Analysis and Trends
Technology & Software technology-and-software
Mixed Chart
Accenture
View slide
The slide features a prominent image of a person using augmented reality, with text on the right and a trend assessment.
Technology and Digital Transformation
Technology & Software
Highlights the rise of augmented, mixed, and virtual reality, focusing on new opportunities in the consumer industry.
Augmented Reality, Virtual Reality, Mixed Reality, Consumer Industry, Immersive Experience, Virtual Collaboration
false
Technology and Digital Transformation
Technology & Software technology-and-software
Multiple Chart
Deloitte
View slide
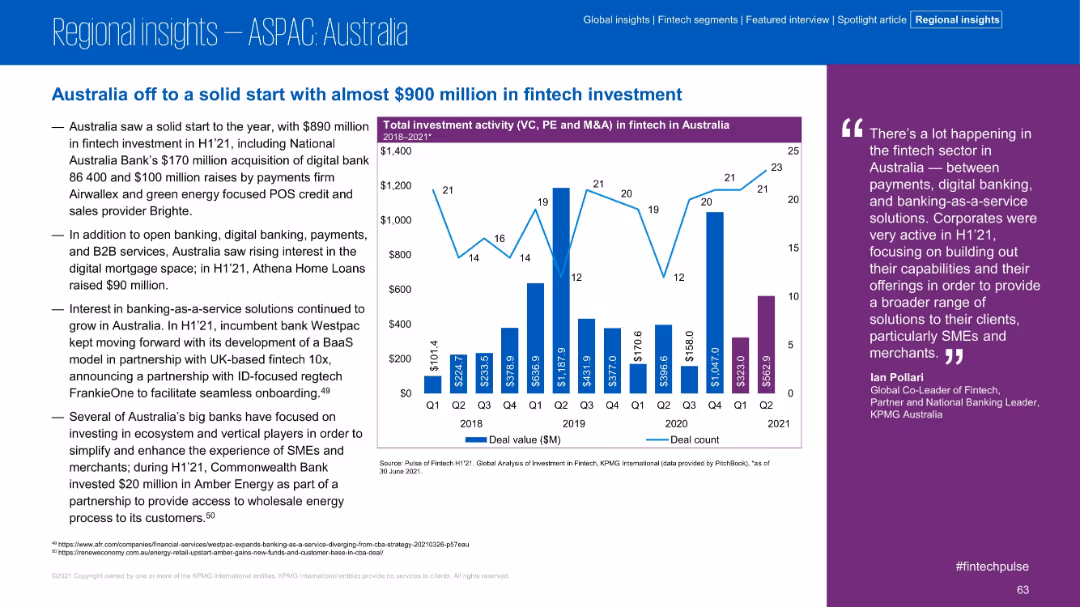
Split layout with bullet insights and bar-line graph for quarterly investments in Australia.
Market Analysis and Trends
Financial Services
Australia’s fintech sector saw a strong H1’21 with $890 million in investment. The slide details contributions from digital banks, B2B, payments, and BaaS platforms. A graph tracks deal volume from 2018 to 2021.
Australia, Fintech, VC, BaaS, Investment, Digital Banking
false
Market Analysis and Trends
Financial Services financial-services
Mixed Chart
KPMG
View slide
The slide features three line charts illustrating Australia's y/y real GDP, unemployment rate, and y/y CPI from 2005 to 2025. The layout is clear with minimal text.
Market Analysis and Trends
Financial Services
Discusses Australia's economic outlook, including GDP growth, unemployment, and inflation, in response to the Reserve Bank's monetary policy tightening.
Australia, GDP, Unemployment, CPI, RBA
false
Market Analysis and Trends
Financial Services financial-services
Multiple Chart
EY
View slide
Three line charts displaying Australia's y/y real GDP, unemployment rate, and y/y percentage change in CPI from 2005-25F. Moderate complexity, suitable for presenting detailed economic data and trends.
Market Analysis and Trends
Financial Services
This slide analyzes the Australian economy, discussing the impacts of persistent inflation, rising interest rates, and strong labor market conditions on economic growth. It provides projections for GDP, unemployment, and CPI.
Australia, GDP, unemployment, CPI, economy
false
Market Analysis and Trends
Financial Services financial-services
Multiple Chart
EY
View slide
The slide features a comprehensive table and icons showing policy strategies, enablers, and interventions for developing the battery industry in Australia.
Competitive Landscape
Energy & Utilities
This slide presents six key policy strategies needed to establish a competitive battery industry in Australia. It categorizes strategies and their impact on industry facilitation and regional partnerships.
Australia, battery industry, policy strategies, international competition, speed and scale
false
Competitive Landscape
Energy & Utilities energy-and-utilities
Table
Accenture
View slide
Slide presents a tabular data overview of projected work done in residential, commercial, and infrastructure sectors in Australia from FY22 to FY25, under three scenarios.
Market Analysis and Trends
Real Estate & Construction
Provides a consolidated view of potential growth or decline in various construction sectors in Australia across different economic scenarios, useful for comparative analysis.
Australia, construction sectors, growth, decline, scenarios
false
Market Analysis and Trends
Real Estate & Construction real-estate-and-construction
Table
Deloitte
View slide
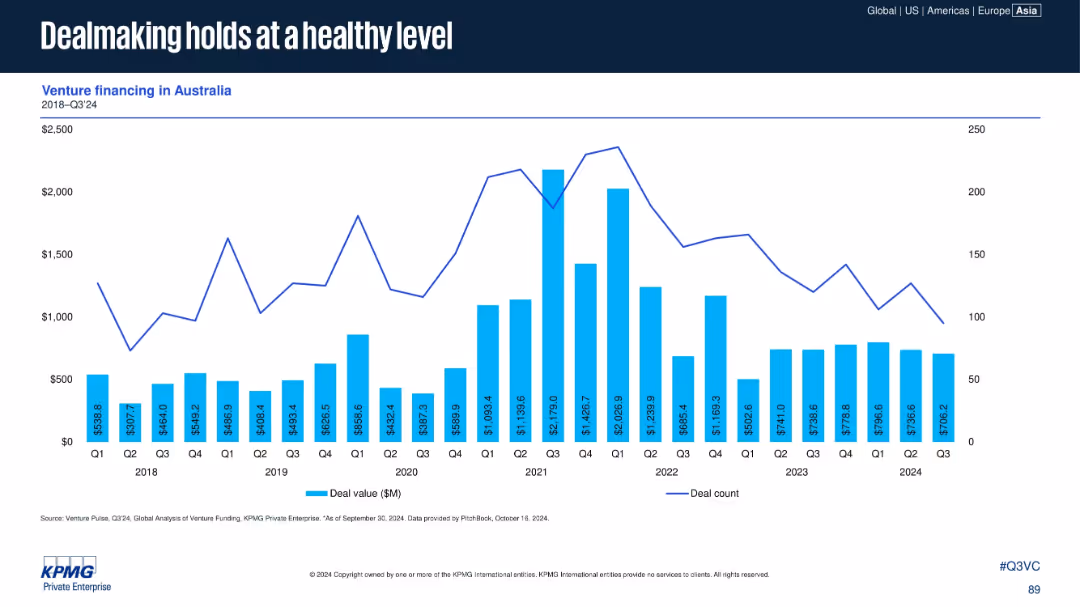
Bar and line chart presenting venture financing data (deal value and count) in Australia from 2018 to Q3 2024.
Investment Analysis
Financial Services
Australia has maintained relatively stable VC activity, with healthy dealmaking volumes in 2024. Although deal counts declined slightly, deal values remain resilient, supported by consistent investor interest in the region.
Australia, deal value, deal count, venture financing, KPMG, investment stability
false
Investment Analysis
Financial Services financial-services
Single Chart
KPMG
View slide
This slide contains multiple bar charts and textual content. There are three bar charts arranged horizontally, comparing Australia, US, and Indonesia in terms of production costs for lithium. The bar charts are divided into categories like Feedstock, Conversion Costs, Capex, and Tax. Each country's chart is distinguished by a different color and there are annotations and percentage changes highlighted.
Competitive Landscape
Energy & Utilities
The slide details the competitive advantages in production costs for lithium hydroxide in Australia compared to the US and Indonesia, emphasizing Australia's lower costs due to integration of mining and refining activities.
Australia, lithium, refining, cost comparison, mineral reserves, production costs, competitive advantage, integration benefits, global market
false
Competitive Landscape
Energy & Utilities energy-and-utilities
Multiple Chart
Accenture
View slide
Contains comparative data and visual representations, including a column chart and side-by-side comparisons, on CO2 intensity and environmental impacts of nickel and lithium mining in Australia versus other countries. The slide uses distinct colors to differentiate between countries and includes detailed annotations explaining the significance of the data presented.
Competitive Landscape
Energy & Utilities
Showcases Australia's comparative advantage in mining due to lower CO2 emissions and stronger environmental credentials, which could appeal to ESG-sensitive customers and markets.
Australia, mining, environmental impact, CO2 emissions, nickel, lithium, competitive advantage, ESG credentials, global market, sustainable practices
false
Competitive Landscape
Energy & Utilities energy-and-utilities
Mixed Chart
Accenture
View slide
Includes a table with bullet points and textual analysis detailing Australia's presence in global mining for key battery materials like lithium, cobalt, and nickel.
Competitive Landscape
Energy & Utilities
Discusses Australia's leading role and capabilities in mining essential battery materials, highlighting global market shares and reserves, and outlining upcoming projects.
Australia, mining, lithium, cobalt, nickel, market share, reserves
false
Competitive Landscape
Energy & Utilities energy-and-utilities
Table
Accenture
View slide
The slide uses a column chart to depict Australian residential work from FY07 to FY25, showing actuals and projections in three scenarios. It includes explanatory text boxes and scenario legends.
Market Analysis and Trends
Real Estate & Construction
Examines the resilience and sensitivity of residential construction work in Australia, comparing historical data to future projections and highlighting economic impacts.
Australia, residential, projections, economic impacts, construction
false
Market Analysis and Trends
Real Estate & Construction real-estate-and-construction
Mixed Chart
Deloitte
View slide
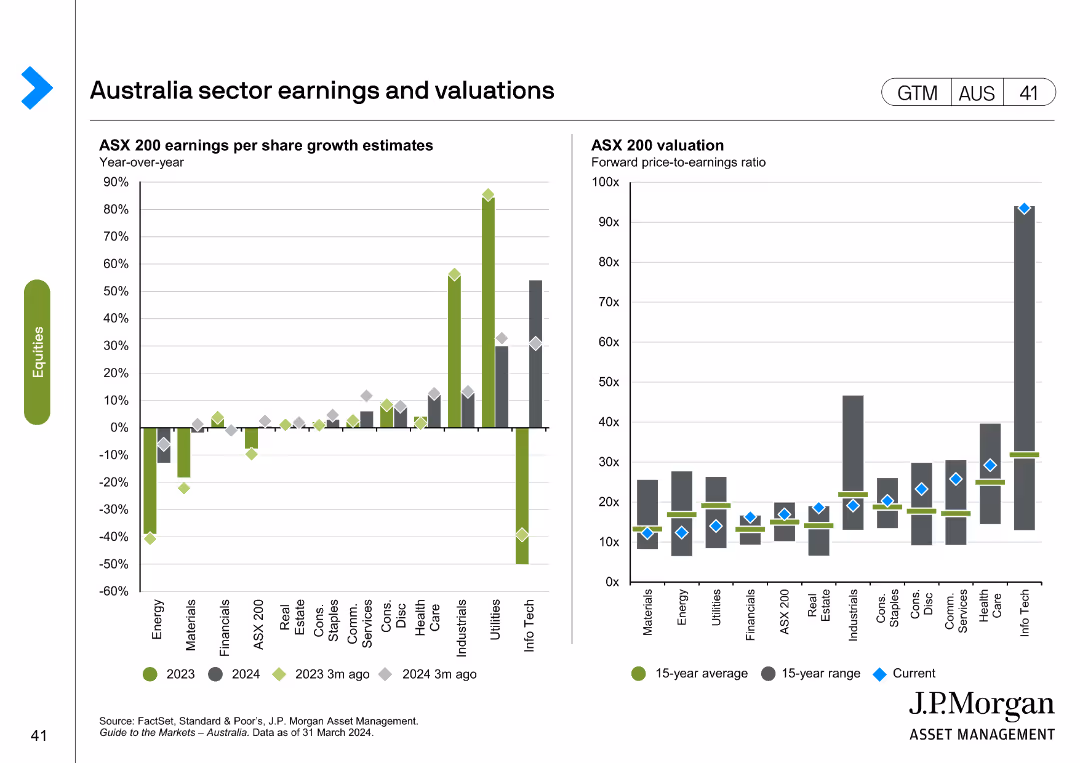
The slide contains two charts: a column chart on ASX 200 earnings per share growth estimates, and a line chart on ASX 200 valuation forward price-to-earnings ratio.
Financial Performance
Financial Services
Provides sector-specific earnings and valuation metrics for the Australian market, focusing on growth estimates and P/E ratios, useful for financial performance analysis.
Australia, sector earnings, valuations, ASX 200, growth estimates
false
Financial Performance
Financial Services financial-services
Multiple Chart
JP Morgan
Previous
Loading...
Hold On!
We are searching in our database
If nothing, comes up, please try different filters!
Column Chart
Heatmap
Chevron
Org Chart
Infographic
Callouts
Timeline
List
Graphic
Picture
Process Flow
Diagram
Paragraph
Map
Table
Framework
Subtitle
Takeaway Box
Icon
Other Chart
Radar Chart
Waterfall Chart
Mekko Chart
Pie Chart
Scatter Plot
Line Chart
Bar chart
Bullet points
Create a FREE account to continue browsing
Receive Instant Access to 1,000+ slides from companies like McKinsey, Google, and Goldman Sachs
First Name
Last Name
Email
Password
I agree to all
Terms & Privacy Policy
Thank you! Your submission has been received!
Oops! Something went wrong while submitting the form.
Have an account?
Sign in
Upgrade to PRO to Save slides
Advanced Search and Filters
Access to 15,000+ slides
Access to Category Pages
Save/Bookmark Slides
PowerPoint Template Library
Pick a Plan
MONTHLY
$12/month
Billed every month, Cancel anytime.
YEARLY
$9/year
Billed $108 annually, Cancel anytime.
Checkout for $12/month
Checkout for $108/yr
Secured by Stripe | AES-256 bit encryption