My Account
My Slides
Search by Category
Templates
Leave Feedback
Login
Logout
Get Started
Browse all Slides
Browse all Slides
Create a FREE Account
Instant access to 1,000+ real slides from top companies like McKinsey, BCG, Goldman Sachs, Google and many more!
First Name
Last Name
Email
Password
I agree to all
Terms & Privacy Policy
Thank you! Your submission has been received!
Oops! Something went wrong while submitting the form.
Have an account?
Sign in
📢 Ready to start building slides? Check out our new template library
VIEW TEMPLATES
Welcome,
Welcome
PRO
Show Featured Only
Checkbox 8
Companies
Mckinsey
Bain
BCG
EY
Deloitte
Accenture
PwC/Strategy&
JP Morgan
Goldman Sachs
Morgan Stanley
Citigroup
Deutsche Bank
Barclays
LEK
KPMG
Kearney
Oliver Wyman
Booz Allen Hamilton
Gartner
IPSOS
Nielsen
Slide type
Text Only
Linear Flow
Vertical Flow
Single Chart
Header Horizontal
Mixed Chart
Header Vertical
Pillar
Multiple Chart
Graphic
Agenda
Title
Table
Framework
Industry
Technology & Software
Artificial Intelligence
Financial Services
Retail & E-commerce
Consumer Goods
Industrial & Manufacturing
Transportation & Logistics
Telecommunications
Real Estate & Construction
Hospitality & Tourism
Professional Services
Education & Training
Media & Entertainment
Agriculture & Food Production
Healthcare & Pharmaceuticals
Environmental Services & Sustainability
Government & Public Sector
Use Case
Mergers and Acquisitions
Performance Metrics and KPIs
Client Case Studies
Competitive Landscape
Corporate Finance and Valuation
Product and Service Analysis
Customer and Market Segmentation
Organizational Structure and Change
Industry Overview
Regulatory and Compliance
Risk Assessment and Management
Investment Analysis
Organizational Structure and Change
Human Resources and Talent Management
Financial Performance
Market Analysis and Trends
Sales and Business Development
Human Resources and Talent Management
Clear all
Thank you! Your submission has been received!
Oops! Something went wrong while submitting the form.
Tag
View slide
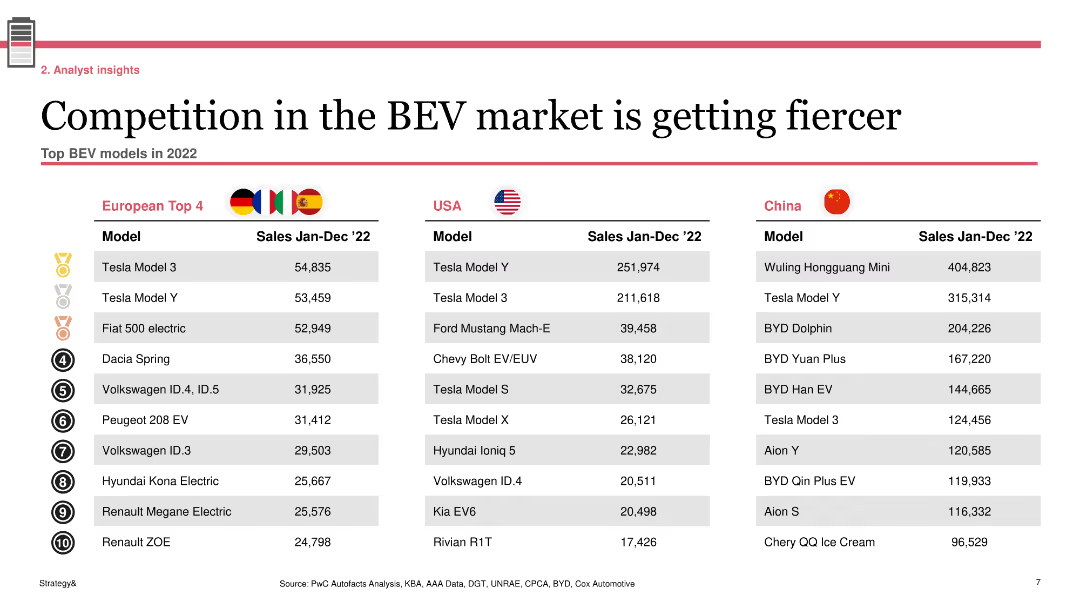
The slide presents three tables listing the top BEV models in 2022 for Europe, USA, and China. Each table includes the model name and sales figures for January to December 2022.
Competitive Landscape
Transportation & Logistics
This slide shows the top BEV models sold in Europe, USA, and China in 2022, highlighting the competitive nature of the BEV market across different regions with sales figures for each top model.
BEV, competition, market, sales, models
false
Competitive Landscape
Transportation & Logistics transportation-and-logistics
Table
PwC/Strategy&
View slide
Detailed diagram of a BEV chassis coolant system with annotations. It includes parts like chassis thermal lines and under-hood thermal hoses, visually differentiated through various colors and labels.
Technology and Digital Transformation
Industrial & Manufacturing
Demonstrates the coolant loop system for battery electric vehicles (BEV), focusing on the chassis design used by TI Fluid Systems. It highlights how these systems are integral to managing vehicle temperature and efficiency.
BEV, coolant system, chassis, diagram, technology
false
Technology and Digital Transformation
Industrial & Manufacturing industrial-and-manufacturing
Diagram
Deutsche Bank
View slide
A comprehensive table displays various concerns related to the cost of owning a BEV, including aspects like charging and battery replacement.
Risk Assessment and Management
Transportation & Logistics
Explores financial barriers to BEV adoption, such as cost and charging infrastructure, vital for risk assessment and strategy development in the automotive industry.
BEV, cost concerns, charging infrastructure, battery cost, financial barriers, automotive industry, risk assessment, strategy development
false
Risk Assessment and Management
Transportation & Logistics transportation-and-logistics
Single Chart
Deloitte
View slide
A bar chart depicts consumer expectations for BEV driving range, categorized by urban and sub-urban/rural responses, showing varying preferences.
Market Analysis and Trends
Transportation & Logistics
Discusses consumer expectations for battery electric vehicle (BEV) driving ranges, essential for understanding market needs and vehicle design in the automotive sector.
BEV, driving range, consumer expectations, urban, rural, market needs, vehicle design, automotive trends
false
Market Analysis and Trends
Transportation & Logistics transportation-and-logistics
Single Chart
Deloitte
View slide
Features diagrams of heat pump valve unit and car, with callouts describing parts and benefits.
Technology and Digital Transformation
Transportation & Logistics
Highlights the role of a specific heat pump technology in BEV cabin comfort, focusing on supplier monopoly and efficiency gains.
BEV, heat pump, valve unit, efficiency, supply chain
false
Technology and Digital Transformation
Transportation & Logistics transportation-and-logistics
Diagram
Deutsche Bank
View slide
Multiple small column charts integrated with a world map, color-coded to indicate different regions. Includes icons and labels for external factors affecting market growth.
Market Analysis and Trends
Transportation & Logistics
Predicts a 60% worldwide market share for battery electric vehicles by 2035 with regional differences. Factors like legislation, subsidies, and infrastructure development are highlighted as influences on market growth.
BEV, market share, 2035, global, electric vehicles
false
Market Analysis and Trends
Transportation & Logistics transportation-and-logistics
Multiple Chart
BCG
View slide
A comparative analysis with three line charts showing different market scenarios for BEV shares by region from 2025 to 2040. Color-coded to distinguish scenarios.
Market Analysis and Trends
Transportation & Logistics
Examines three potential growth scenarios for battery electric vehicles depending on regional adjustments like government policies and infrastructure expansion.
BEV, scenarios, growth, policy, infrastructure
false
Market Analysis and Trends
Transportation & Logistics transportation-and-logistics
Multiple Chart
BCG
View slide
Diagrams of thermal manifolds and modules with key components labeled, designed for integration in BEVs.
Technology and Digital Transformation
Transportation & Logistics
Focuses on integration techniques for manifolds and modules in BEVs, emphasizing reduction in part count and weight.
BEV, thermal management, integration, efficiency, manufacturing
false
Technology and Digital Transformation
Transportation & Logistics transportation-and-logistics
Diagram
Deutsche Bank
View slide
Column charts depicting the number of BEVs and PHEVs in use and the number of charging points per 100 vehicles across different regions, from 2015 to 2022.
Market Analysis and Trends
Energy & Utilities
This slide shows the growth of battery electric vehicles (BEVs) and plug-in hybrid electric vehicles (PHEVs) in use from 2015 to 2022 and their corresponding charging points.
BEVs, PHEVs, charging points, growth, regions
false
Market Analysis and Trends
Energy & Utilities energy-and-utilities
Multiple Chart
JP Morgan
View slide
Slide includes line graphs comparing the total cost of ownership of BEVs against other vehicle types, showing the trend towards cost-effectiveness of BEVs.
Investment Analysis
Transportation & Logistics
Provides a financial analysis on the cost-competitiveness of battery electric vehicles over time, useful for investors and companies planning transitions in vehicle fleets.
BEVs, cost analysis, electric vehicles, TCO, automotive economics, investment
false
Investment Analysis
Transportation & Logistics transportation-and-logistics
Single Chart
BCG
View slide
The slide includes a column chart with segments representing different banking sectors and a side section with key drivers listed as bullet points. The colors blue and gray are used for the chart, with annotations for changes. It also contains an inset box summarizing the content in a clear, readable font.
Market Analysis and Trends
Financial Services
Displays the growth in Banking and Financial Services (BFS) in areas like personal banking and wealth management, complemented by key drivers affecting these sectors, such as changes in deposit volumes and management fees. Tailored for analyzing market trends in banking services.
BFS, growth, banking, financial services, personal banking, wealth management, deposit volumes, performance analysis
false
Market Analysis and Trends
Financial Services financial-services
Mixed Chart
Goldman Sachs
View slide
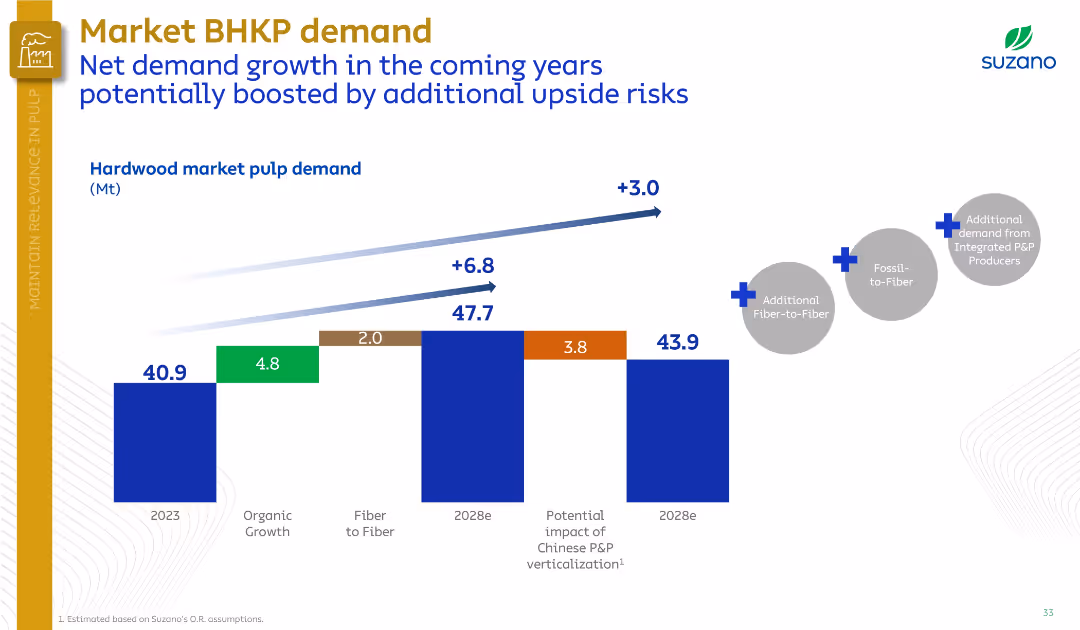
Horizontal bar chart tracks demand growth drivers; annotations highlight upside potential. Minimalist layout with emphasis on data.
Market Analysis and Trends
Industrial & Manufacturing
Suzano outlines projected demand growth for market BHKP from 2023 to 2028, driven by organic growth, fiber substitution, and potential upside from Chinese market changes and fossil-to-fiber trends.
BHKP demand, fiber-to-fiber, organic growth, pulp market, China, fossil substitution
false
Market Analysis and Trends
Industrial & Manufacturing industrial-and-manufacturing
Single Chart
Goldman Sachs
View slide
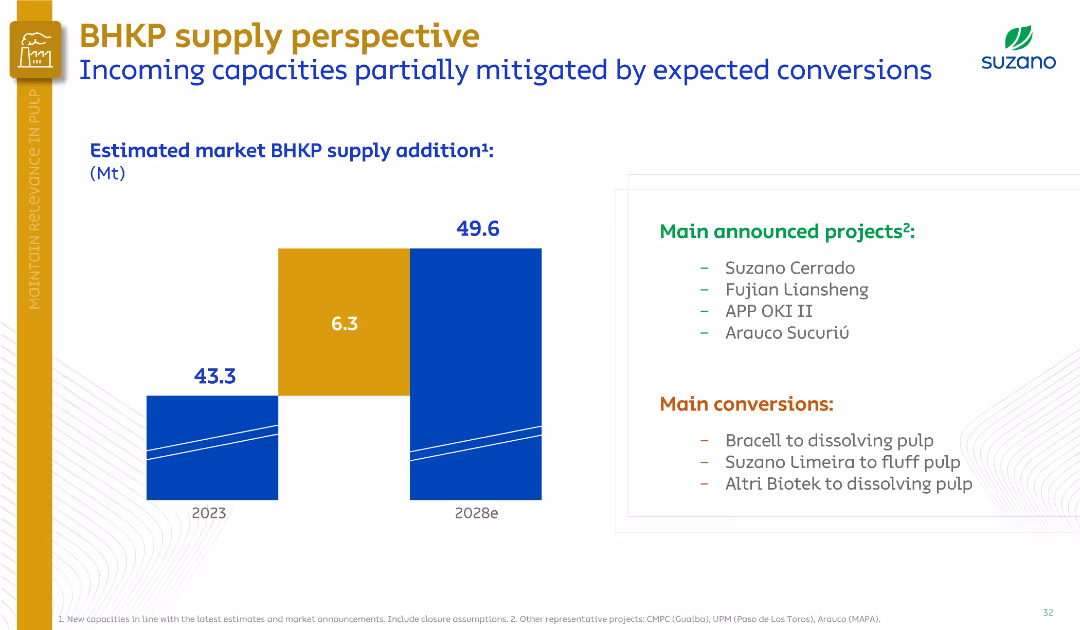
Left side shows bar chart of supply additions; right side lists new projects and conversions. Split layout, clean with minimal colors.
Market Analysis and Trends
Industrial & Manufacturing
The slide estimates BHKP market supply to increase from 43.3 Mt in 2023 to 49.6 Mt by 2028, offset by pulp conversions. Lists major new projects and planned mill conversions, helping stabilize market supply.
BHKP supply, pulp market, new projects, conversions, Suzano, capacity, 2028 forecast
false
Market Analysis and Trends
Industrial & Manufacturing industrial-and-manufacturing
Mixed Chart
Goldman Sachs
View slide
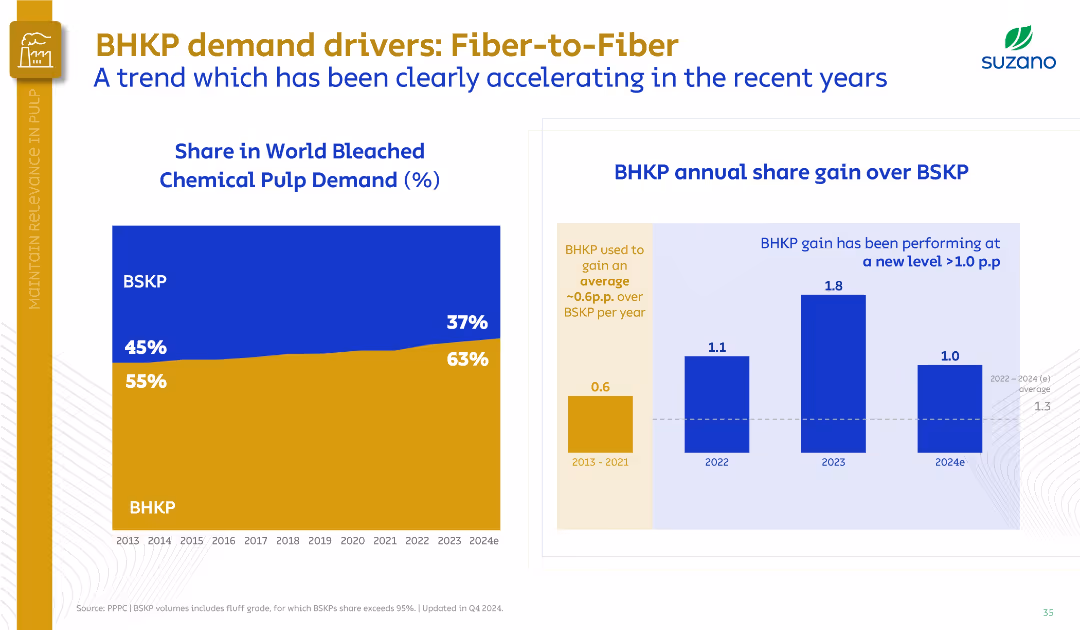
Left graph shows BHKP vs. BSKP share trend; right bar chart compares share gain. Uses a dual-panel data layout.
Market Analysis and Trends
Industrial & Manufacturing
The slide shows BHKP’s growing share in world pulp demand from 55% in 2013 to 63% in 2024, surpassing BSKP. Highlights increasing annual gains, particularly post-2022, signaling a market shift to hardwood pulp.
BHKP, BSKP, market share, demand growth, pulp, Suzano, fiber substitution
false
Market Analysis and Trends
Industrial & Manufacturing industrial-and-manufacturing
Multiple Chart
Goldman Sachs
View slide
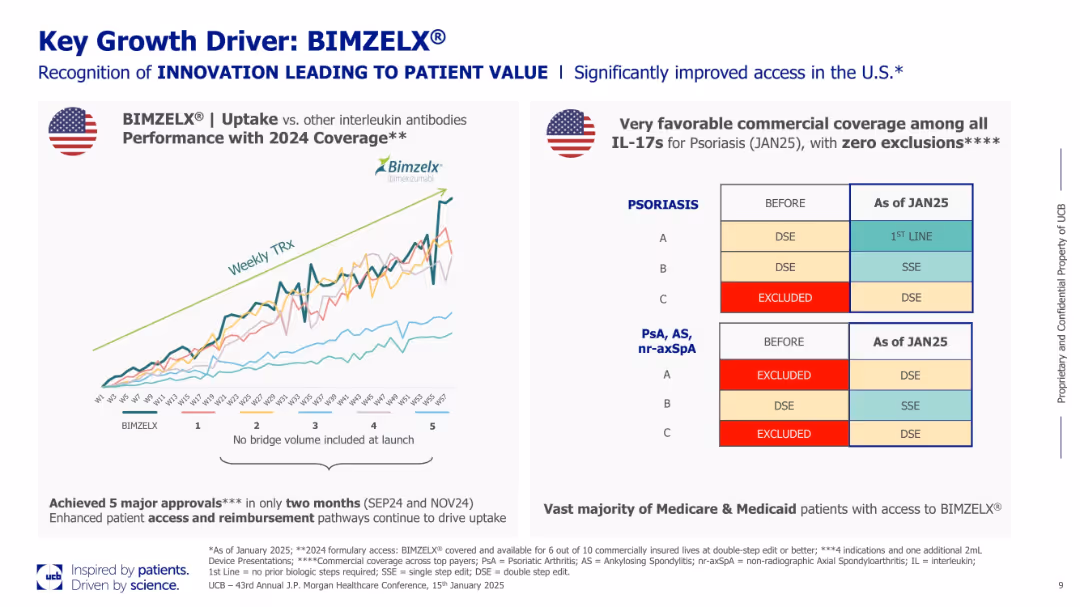
Dual-pane slide with uptake chart on the left and coverage grid on the right. Color-coded lines show BIMZELX® performance versus competitors. Right side emphasizes favorable insurance coverage.
Product and Service Analysis
Healthcare & Pharmaceuticals
BIMZELX® is positioned as a high-growth asset driven by superior uptake and favorable U.S. market access. The slide shows comparative prescription trends and outlines its broad commercial coverage, especially among Medicare and Medicaid patients for psoriasis and PsA.
BIMZELX, psoriasis, IL-17, U.S. market access, prescription trends, innovation
false
Product and Service Analysis
Healthcare & Pharmaceuticals healthcare-and-pharmaceuticals
Mixed Chart
JP Morgan
View slide
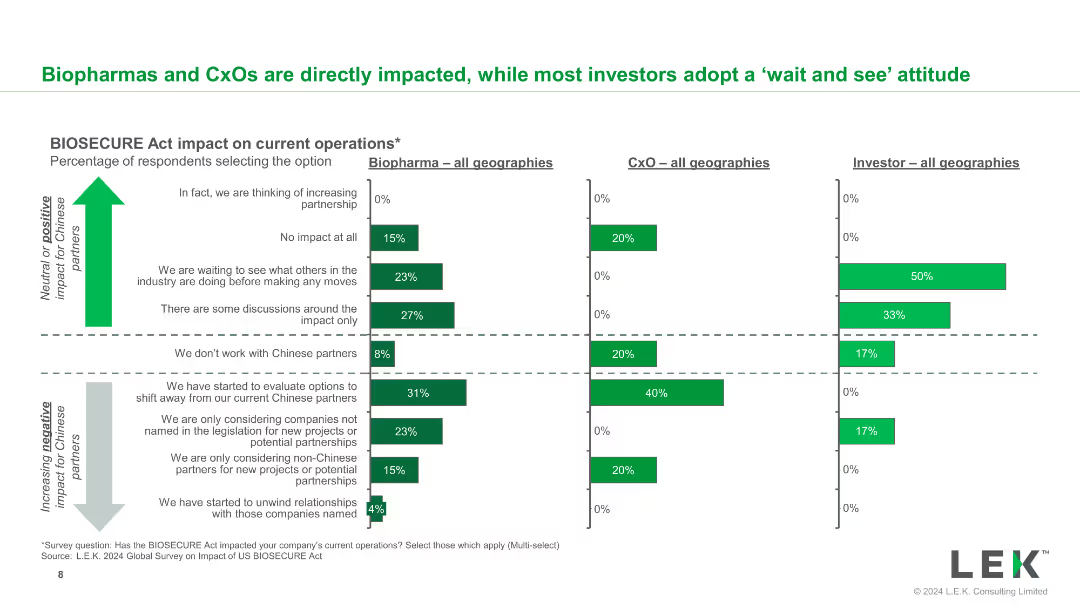
This slide includes a set of bar charts displaying the BIOSECURE Act's impact on current operations for biopharma, CxO, and investors, across all geographies.
Market Analysis and Trends
Healthcare & Pharmaceuticals
It details how the BIOSECURE Act has impacted operations within different segments of the healthcare industry, providing a segmented view of the effects.
BIOSECURE Act, biopharma, CxO, investors, operational impact, segmentation
false
Market Analysis and Trends
Healthcare & Pharmaceuticals healthcare-and-pharmaceuticals
Multiple Chart
LEK
View slide
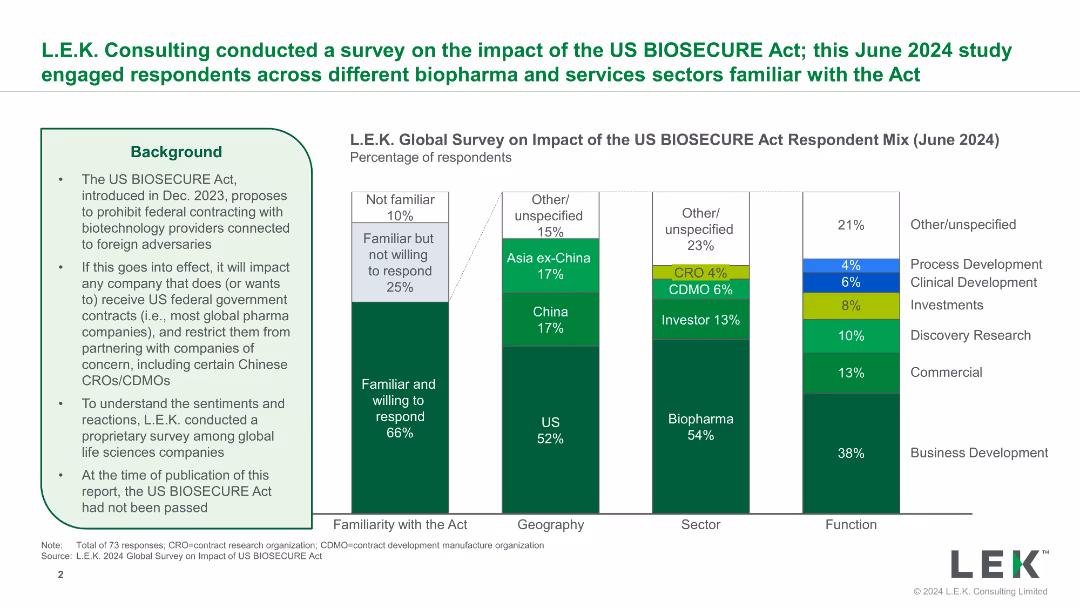
A combination of text and bar charts showing survey results about the impact of the US BIOSECURE Act, with a detailed timeline of the Act's development and key points.
Regulatory and Compliance
Healthcare & Pharmaceuticals
The slide presents survey results on the impact of the US BIOSECURE Act on biotech and services sectors, highlighting familiarity, willingness to respond, and sector-specific effects.
BIOSECURE Act, biotech, survey, impact, regulation
false
Regulatory and Compliance
Healthcare & Pharmaceuticals healthcare-and-pharmaceuticals
Mixed Chart
LEK
View slide
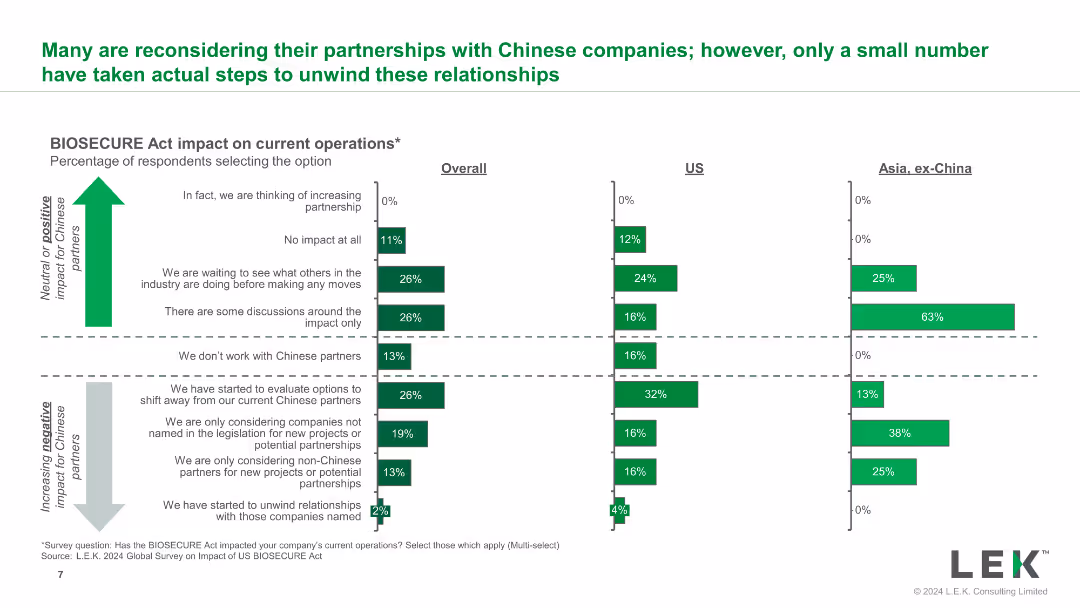
The slide features a bar chart that shows the percentage of respondents selecting various impacts of the BIOSECURE Act on their current operations. The chart is divided into overall, US, and Asia categories.
Regulatory and Compliance
Healthcare & Pharmaceuticals
This slide provides insights into how the BIOSECURE Act has affected current operations across different regions, highlighting the percentage of companies reconsidering their partnerships.
BIOSECURE Act, operations impact, respondents, current operations, Asia, US
false
Regulatory and Compliance
Healthcare & Pharmaceuticals healthcare-and-pharmaceuticals
Multiple Chart
LEK
View slide
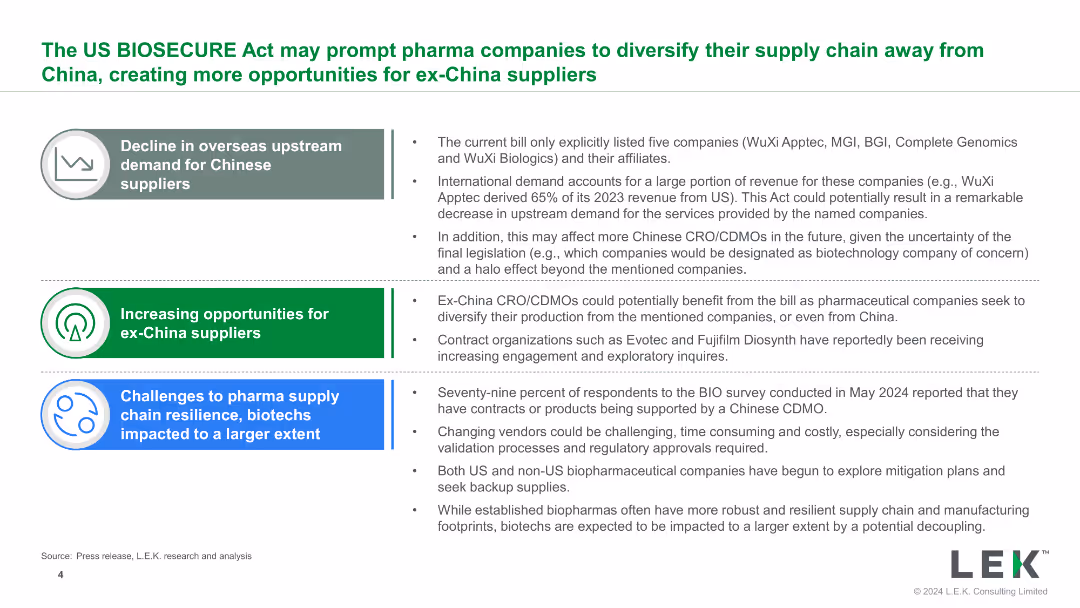
The slide features a mix of text and bullet points, organized into sections with icons, summarizing the decline in demand for Chinese suppliers and the rise in opportunities for others.
Strategic Planning
Healthcare & Pharmaceuticals
The slide discusses the opportunities and challenges for pharmaceutical companies due to the US BIOSECURE Act, focusing on supply chain resilience and the potential shift from China.
BIOSECURE Act, supply chain, opportunities, challenges, pharma
false
Strategic Planning
Healthcare & Pharmaceuticals healthcare-and-pharmaceuticals
Table
LEK
View slide
The slide uses bullet points and icons to present key findings from the 2024 Global Survey on the impact of the US BIOSECURE Act, with clear headings and supporting details.
Market Analysis and Trends
Healthcare & Pharmaceuticals
The slide summarizes key findings on the impact of the US BIOSECURE Act, highlighting changes in confidence, operational impacts, precautionary actions, and future partnership likelihoods.
BIOSECURE Act, survey, findings, impact, healthcare
false
Market Analysis and Trends
Healthcare & Pharmaceuticals healthcare-and-pharmaceuticals
Table
LEK
View slide
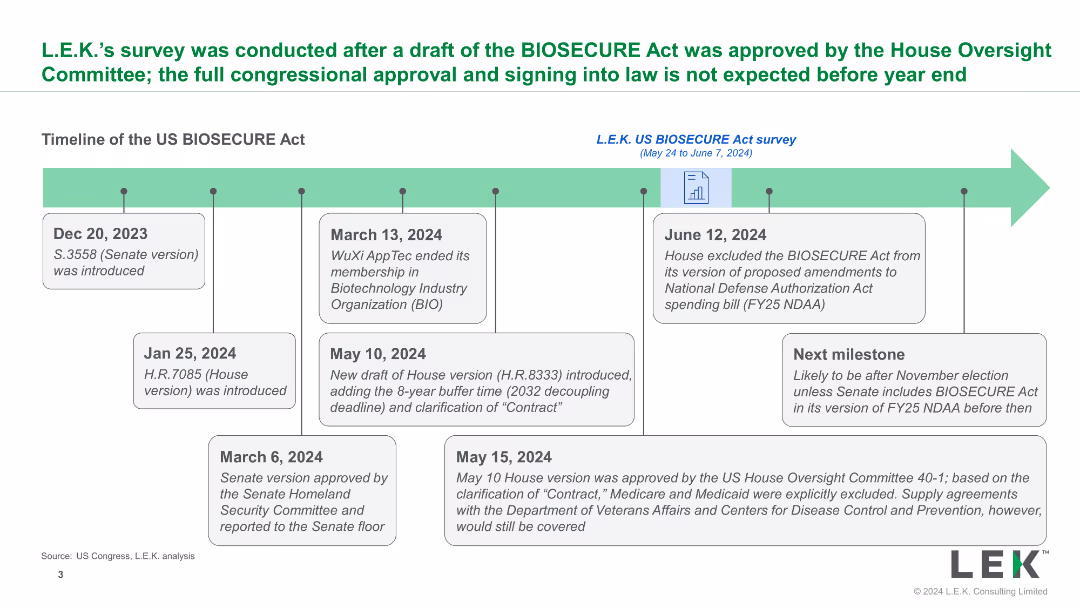
A timeline illustrating key dates and milestones in the development of the US BIOSECURE Act, with descriptive text boxes explaining each step and future projections.
Strategic Planning
Healthcare & Pharmaceuticals
The slide provides a detailed timeline of the US BIOSECURE Act, from its introduction to expected future steps, outlining significant legislative milestones and impacts.
BIOSECURE Act, timeline, legislation, milestones, U.S.
false
Strategic Planning
Healthcare & Pharmaceuticals healthcare-and-pharmaceuticals
Linear Flow
LEK
View slide
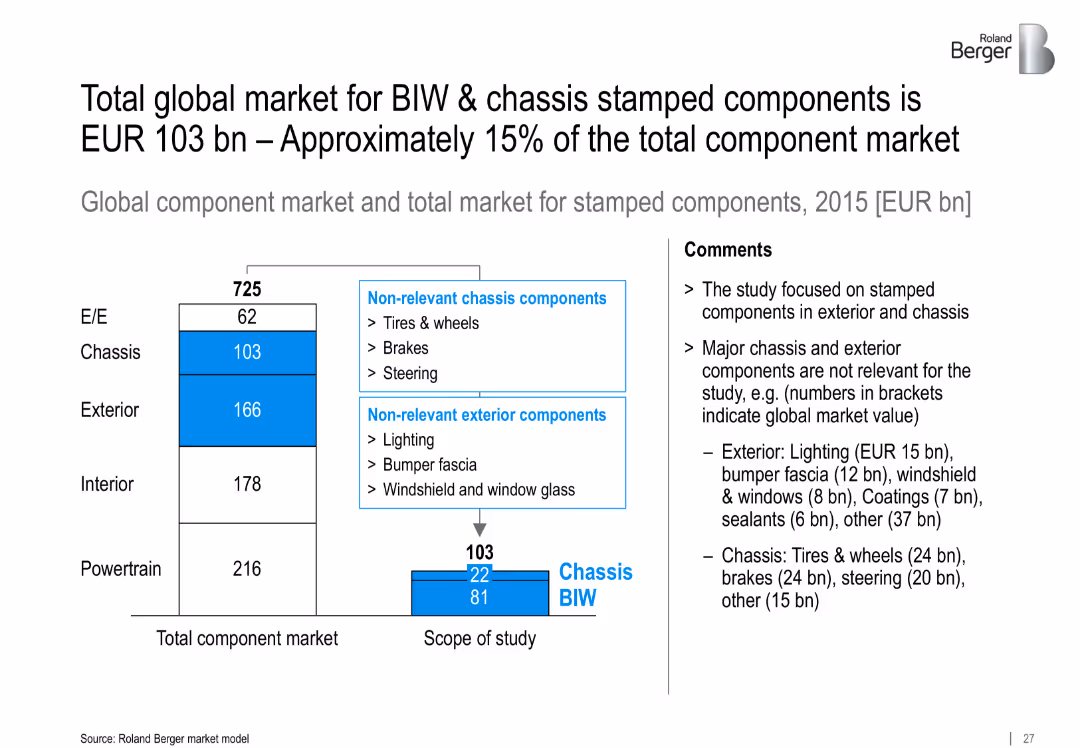
Bar chart showing breakdown of total component market and scope of BIW/chassis stamped components; comments explain exclusions
Investment Analysis
Industrial & Manufacturing
Defines the market scope for BIW and chassis stamped components, valued at EUR 103 bn in 2015. Excludes irrelevant chassis/exterior parts and focuses on relevant segments for detailed analysis.
BIW, chassis, stamped components, market size, EUR 103 bn, exterior, global component market
false
Investment Analysis
Industrial & Manufacturing industrial-and-manufacturing
Mixed Chart
Roland Berger
View slide
Contains a large line chart tracking spending via different payment types from January 2020. BNPL shows a sharp increase, highlighted with a callout box. The slide is visually simple with clear distinctions between payment types.
Financial Performance
Financial Services
Showcases the dramatic increase in BNPL service usage over time, specifically noting a spike in recent months. It's beneficial for financial analysis and predicting future consumer payment preferences.
BNPL, Consumer Spending, Trends, 2022, Payment
false
Financial Performance
Financial Services financial-services
Mixed Chart
Accenture
View slide
Features a column chart and a small portrait, highlighting the drastic increase in BNPL spending among younger generations. The slide uses contrasting colors to differentiate between generations effectively.
Product and Service Analysis
Retail & E-commerce
Highlights the substantial impact of Gen Z and Millennials on BNPL markets, showcasing their growing economic influence. Useful for market analysis and strategic planning in finance sectors.
BNPL, Gen Z, Millennials, Economic Influence
false
Product and Service Analysis
Retail & E-commerce retail-and-e-commerce
Mixed Chart
Accenture
View slide
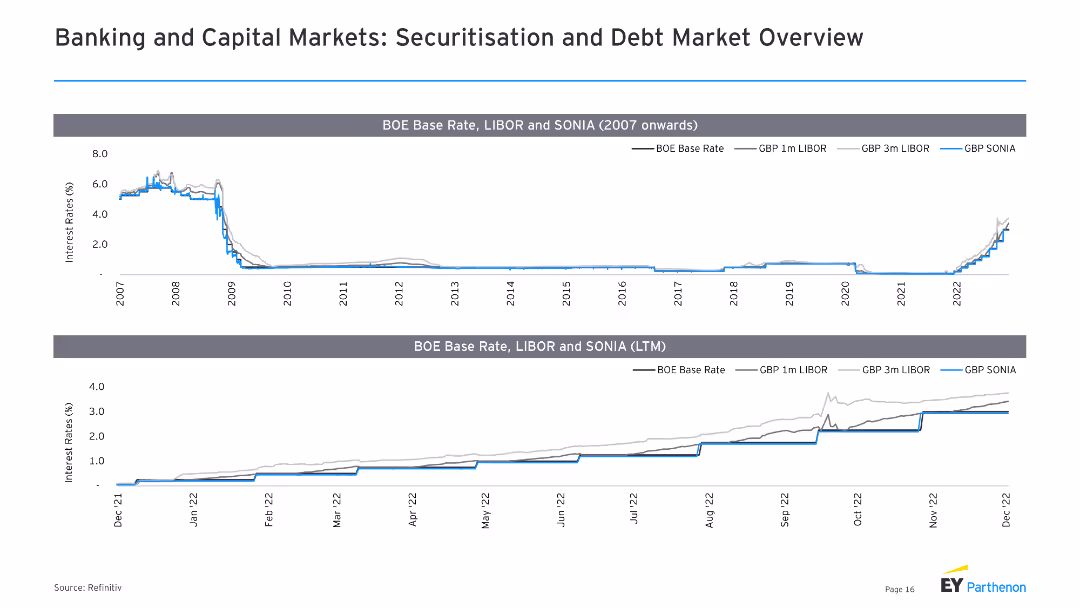
The slide features two line charts, displaying BOE base rate, LIBOR, and SONIA from 2007 onwards and LTM.
Market Analysis and Trends
Financial Services
It analyzes the trends in interest rates, particularly focusing on BOE base rate, LIBOR, and SONIA, useful for understanding monetary policy impacts.
BOE base rate, LIBOR, SONIA, interest rates, trends
false
Market Analysis and Trends
Financial Services financial-services
Multiple Chart
EY
View slide
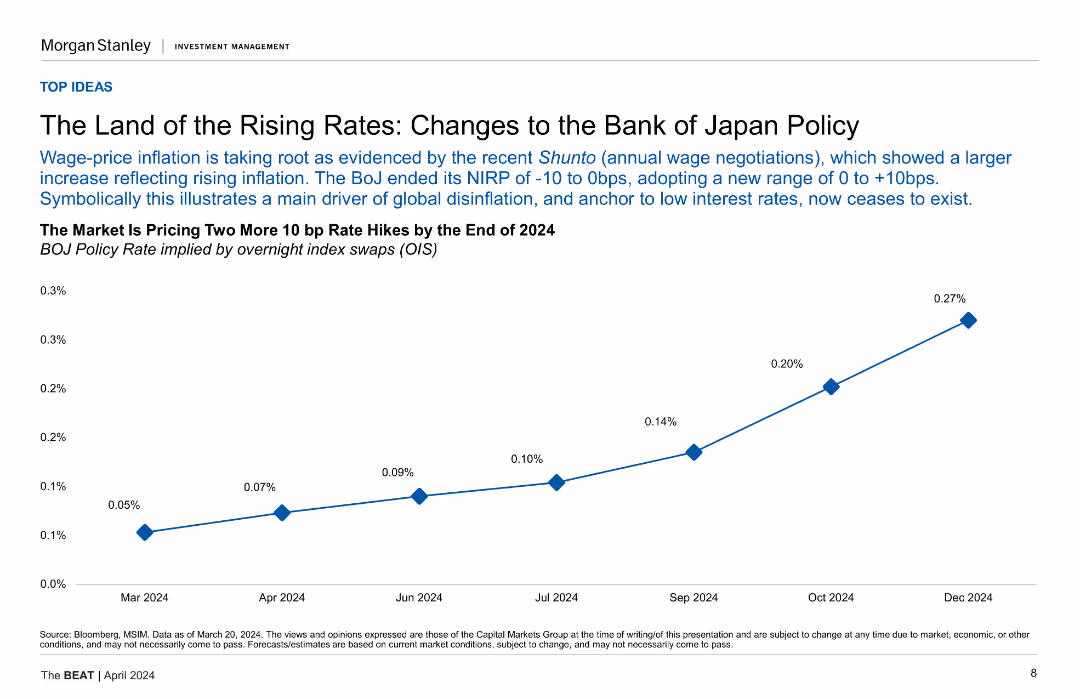
A line chart showing BOJ policy rate projections implied by overnight index swaps (OIS) from Mar-24 to Dec-24.
Market Analysis and Trends
Financial Services
This slide discusses changes to the Bank of Japan's policy and its impact on interest rates, showing the market's projections for future rate hikes.
BOJ Policy, Interest Rates, Japan, Projections, OIS, Rate Hikes
false
Market Analysis and Trends
Financial Services financial-services
Mixed Chart
Morgan Stanley
View slide
The slide features a dual-axis graph displaying the growth of BREEAM and LEED certifications over time, using green bars and a blue line. To the right is a patterned yellow bar representing future targets. The background is white, and the data is accentuated with a blue and green color palette for clarity.
Regulatory and Compliance
Real Estate & Construction
The slide offers a historical view of the increase in BREEAM and LEED certifications for office buildings, the percentage of green leases, and the GRESB score, including future targets. It is ideal for presentations on building sustainability, environmental certifications, and corporate sustainability goals to investors or stakeholders in the real estate and construction industry.
BREEAM, LEED, green leases, GRESB, certifications
false
Regulatory and Compliance
Real Estate & Construction real-estate-and-construction
Single Chart
Morgan Stanley
View slide
The slide includes two pie charts showing the share of global real GDP PPP by BRICS versus other major economies, alongside a map indicating annual real GDP PPP growth rates, with comparative data from 2015 to 2030.
Market Analysis and Trends
Financial Services
Discusses the future economic trajectory of BRICS countries, highlighting their growing influence on the global economy. Essential for presentations on emerging markets and global economic shifts.
BRICS, GDP, growth, future, global economy
false
Market Analysis and Trends
Financial Services financial-services
Diagram
Roland Berger
View slide
A column chart showing year-over-year percentage change in real GDP from 2022 to 2025F for BRICS countries and other regions including China, India, LatAm, Brazil, Mexico, ASEAN, MENA, and SSA. Colors represent different years.
Market Analysis and Trends
Financial Services
The slide highlights economic challenges for BRICS in 2024, with India leading growth, China facing structural headwinds, and Brazil and South Africa showing below-trend growth.
BRICS, economic challenges, GDP, 2024, growth forecast, structural headwinds
false
Market Analysis and Trends
Financial Services financial-services
Single Chart
EY
View slide
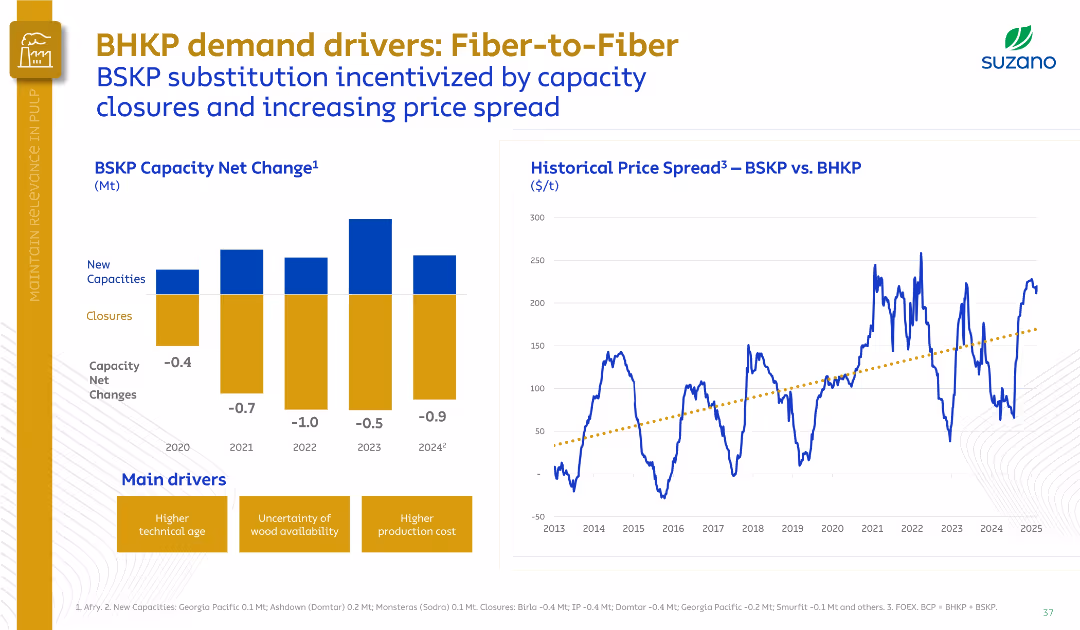
Split layout with a bar chart on the left (BSKP Capacity Net Change) and a line graph on the right (Historical Price Spread).
Market Analysis and Trends
Industrial & Manufacturing
This slide presents the declining net BSKP capacity from 2020 to 2024 due to closures and limited new capacities, alongside the rising BSKP vs. BHKP price spread. It highlights fiber substitution incentives and the main drivers behind this shift.
BSKP, BHKP, fiber substitution, capacity closures, price spread, pulp
false
Market Analysis and Trends
Industrial & Manufacturing industrial-and-manufacturing
Multiple Chart
Goldman Sachs
Previous
Loading...
Hold On!
We are searching in our database
If nothing, comes up, please try different filters!
Column Chart
Heatmap
Chevron
Org Chart
Infographic
Callouts
Timeline
List
Graphic
Picture
Process Flow
Diagram
Paragraph
Map
Table
Framework
Subtitle
Takeaway Box
Icon
Other Chart
Radar Chart
Waterfall Chart
Mekko Chart
Pie Chart
Scatter Plot
Line Chart
Bar chart
Bullet points
Create a FREE account to continue browsing
Receive Instant Access to 1,000+ slides from companies like McKinsey, Google, and Goldman Sachs
First Name
Last Name
Email
Password
I agree to all
Terms & Privacy Policy
Thank you! Your submission has been received!
Oops! Something went wrong while submitting the form.
Have an account?
Sign in
Upgrade to PRO to Save slides
Advanced Search and Filters
Access to 15,000+ slides
Access to Category Pages
Save/Bookmark Slides
PowerPoint Template Library
Pick a Plan
MONTHLY
$12/month
Billed every month, Cancel anytime.
YEARLY
$9/year
Billed $108 annually, Cancel anytime.
Checkout for $12/month
Checkout for $108/yr
Secured by Stripe | AES-256 bit encryption