My Account
My Slides
Search by Category
Templates
Leave Feedback
Login
Logout
Get Started
Browse all Slides
Browse all Slides
Create a FREE Account
Instant access to 1,000+ real slides from top companies like McKinsey, BCG, Goldman Sachs, Google and many more!
First Name
Last Name
Email
Password
I agree to all
Terms & Privacy Policy
Thank you! Your submission has been received!
Oops! Something went wrong while submitting the form.
Have an account?
Sign in
📢 Ready to start building slides? Check out our new template library
VIEW TEMPLATES
Welcome,
Welcome
PRO
Show Featured Only
Checkbox 8
Companies
Mckinsey
Bain
BCG
EY
Deloitte
Accenture
PwC/Strategy&
JP Morgan
Goldman Sachs
Morgan Stanley
Citigroup
Deutsche Bank
Barclays
LEK
KPMG
Kearney
Oliver Wyman
Booz Allen Hamilton
Gartner
IPSOS
Nielsen
Slide type
Text Only
Linear Flow
Vertical Flow
Single Chart
Header Horizontal
Mixed Chart
Header Vertical
Pillar
Multiple Chart
Graphic
Agenda
Title
Table
Framework
Industry
Technology & Software
Artificial Intelligence
Financial Services
Retail & E-commerce
Consumer Goods
Industrial & Manufacturing
Transportation & Logistics
Telecommunications
Real Estate & Construction
Hospitality & Tourism
Professional Services
Education & Training
Media & Entertainment
Agriculture & Food Production
Healthcare & Pharmaceuticals
Environmental Services & Sustainability
Government & Public Sector
Use Case
Mergers and Acquisitions
Performance Metrics and KPIs
Client Case Studies
Competitive Landscape
Corporate Finance and Valuation
Product and Service Analysis
Customer and Market Segmentation
Organizational Structure and Change
Industry Overview
Regulatory and Compliance
Risk Assessment and Management
Investment Analysis
Organizational Structure and Change
Human Resources and Talent Management
Financial Performance
Market Analysis and Trends
Sales and Business Development
Human Resources and Talent Management
Clear all
Thank you! Your submission has been received!
Oops! Something went wrong while submitting the form.
Tag
View slide
The slide includes three donut charts showing managers' views on whether leadership's targets align with employees' preferences for in-office work. An image on the left shows a professional using a shared bike service. The charts use shades of orange and red.
Human Resources and Talent Management
Financial Services
The slide examines the alignment between leadership's targets and employees' preferences for in-office work post-pandemic, indicating a trend towards structured policies for returning to the office.
Back-to-office, post-pandemic, employee preferences, leadership targets, remote work
false
Human Resources and Talent Management
Financial Services financial-services
Multiple Chart
EY
View slide
Bar and line graphs represent quarterly backlog and book-to-bill trends with annotations.
Strategic Planning
Professional Services
Reviews historical financial data, highlighting backlog volumes and book-to-bill ratios.
Backlog, book-to-bill, financial trends, quarterly data, operational metrics
false
Strategic Planning
Professional Services professional-services
Multiple Chart
Booz Allen Hamilton
View slide
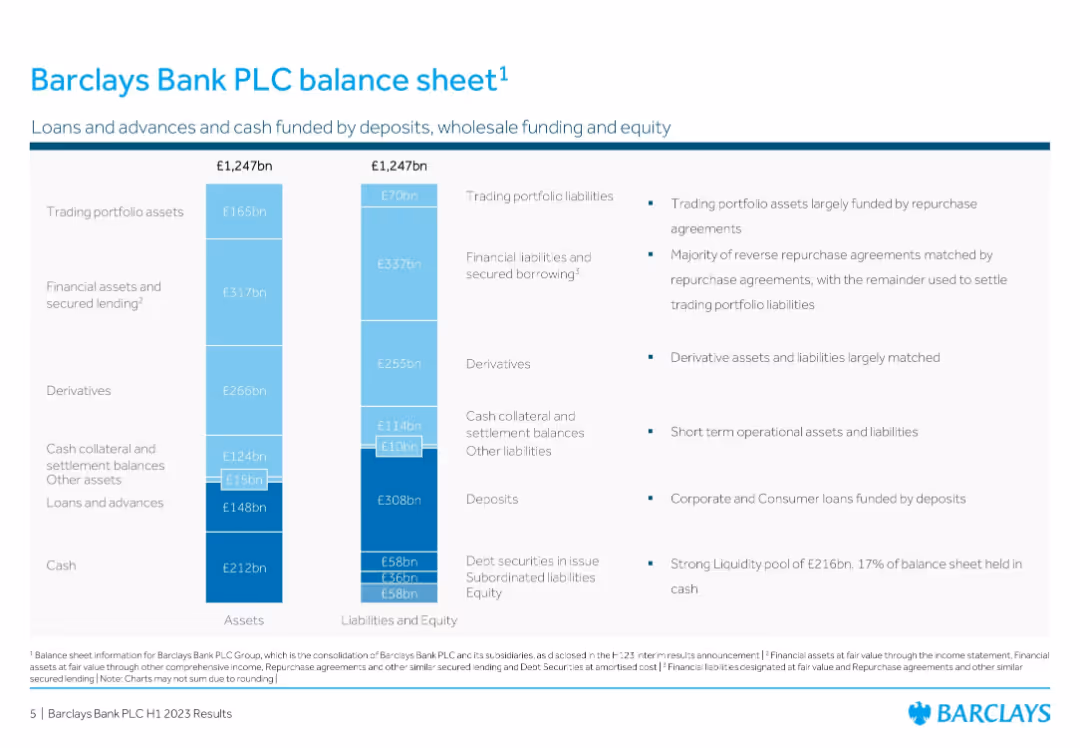
Split vertical chart: Assets vs. Liabilities & Equity; data labels with callouts and notes
Corporate Finance and Valuation
Financial Services
Provides a visual representation of Barclays’ balance sheet in H1 2023, showing the allocation of £1,247bn in both assets and liabilities. Highlights liquidity, deposits, secured lending, and trading liabilities with relevant funding details.
Balance Sheet, Assets, Liabilities, Deposits, Barclays, Valuation, Lending, Trading Portfolio
false
Corporate Finance and Valuation
Financial Services financial-services
Mixed Chart
Barclays
View slide
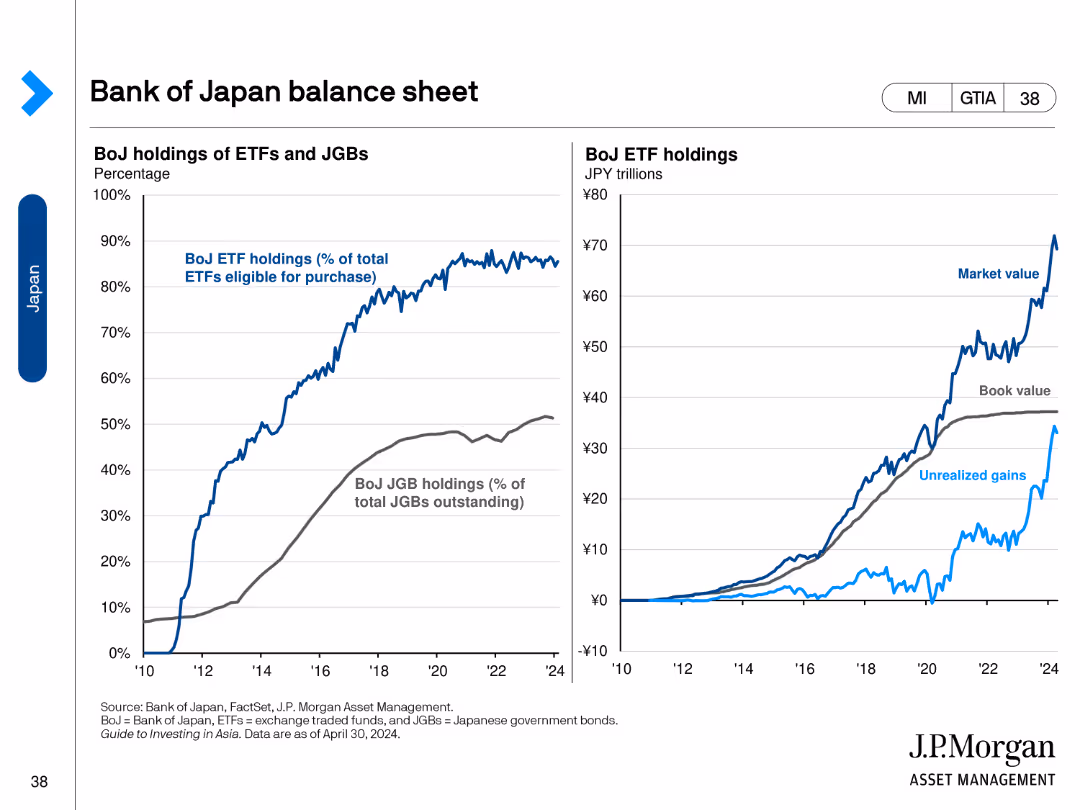
The slide contains two line charts. The left chart shows BoJ holdings of ETFs and JGBs as a percentage of total. The right chart shows the market, book value, and unrealized gains of BoJ ETF holdings in trillions of JPY.
Financial Performance
Financial Services
This slide reviews the balance sheet of the Bank of Japan, detailing ETF and JGB holdings, and market values, book values, and unrealized gains of these assets.
Balance Sheet, Bank of Japan, ETFs, JGBs, Market Value
false
Financial Performance
Financial Services financial-services
Multiple Chart
JP Morgan
View slide
The slide features a clear, tabular layout with multiple columns charting financial metrics over three periods (4Q21, 3Q22, 4Q22). It includes column charts showing percentages, text annotations, and distinct sections for Risk-based Capital Metrics, Leverage-based Capital Metrics, Liquidity Metrics, and Balance Sheet summaries.
Financial Performance
Financial Services
The slide presents a comprehensive overview of capital, leverage, and liquidity metrics alongside balance sheet data, with comparisons across three time periods. It’s intended for detailed financial analysis and to inform on financial stability, regulatory compliance, and operational insight for banking and investment professionals.
Balance Sheet, Capital Metrics, Leverage, Liquidity, Financial Analysis
false
Financial Performance
Financial Services financial-services
Multiple Chart
Citigroup
View slide
The slide features a balance sheet summary on the left with a simple table layout, and credit metrics on the right with numerical highlights and explanatory texts. The design includes shaded boxes and clear separation of content areas.
Financial Performance
Financial Services
This slide compares a company's balance sheet and credit profile, with a focus on cash, debt, and capital structure, as well as credit metrics like EBITDA and leverage ratio. It’s tailored for financial analysts or investors looking at company stability, creditworthiness, and financial health.
Balance Sheet, Credit Profile, EBITDA, Net Leverage, Capital, Financial Health
false
Financial Performance
Financial Services financial-services
Boxed
Goldman Sachs
View slide
This advanced slide contains two vertical stacked column charts representing changes in loan mix and noninterest income from 2012 to the present. It uses shades of blue, green, and other colors to differentiate between segments. Textual content is provided on the right to give context to the graphs, and bullet points below the graphs highlight key takeaways.
Strategic Planning
Financial Services
The slide outlines the strategic diversification of the company’s balance sheet and fee revenue to perform well in different economic environments. It presents changes in loan mix and noninterest income, emphasizing the reduction of cyclical impacts and improving fee diversification. Intended for strategic financial planning.
Balance Sheet, Diversification, Loan Mix, Revenue, Strategic Planning, Noninterest Income, Fee Diversification, Economic Performance
false
Strategic Planning
Financial Services financial-services
Multiple Chart
Morgan Stanley
View slide
A balanced layout with three pie charts on the left and a list of bullet points on the right. The slide uses consistent color coding to categorize different investment types and geographic allocations.
Financial Performance
Financial Services
This slide examines the diversified portfolio and investment strategies, detailing the benefits for clients and shareholders, along with geographical distribution and asset class breakdown of the firm’s balance sheet investments.
Balance Sheet, Diversification, Portfolio, Investments
false
Financial Performance
Financial Services financial-services
Multiple Chart
Goldman Sachs
View slide
The slide compares 'Funded balance sheet' data between two time periods, showcasing figures in column charts and additional financial statistics to provide a comparative financial analysis.
Financial Performance
Financial Services
Shows Macquarie's funded balance sheet strength, comparing term liabilities and assets over two periods. It’s used for financial analysis and to demonstrate the company's stability to investors or stakeholders.
Balance Sheet, Financial Stability, Term Liabilities, Assets, Comparative Analysis
false
Financial Performance
Financial Services financial-services
Multiple Chart
Morgan Stanley
View slide
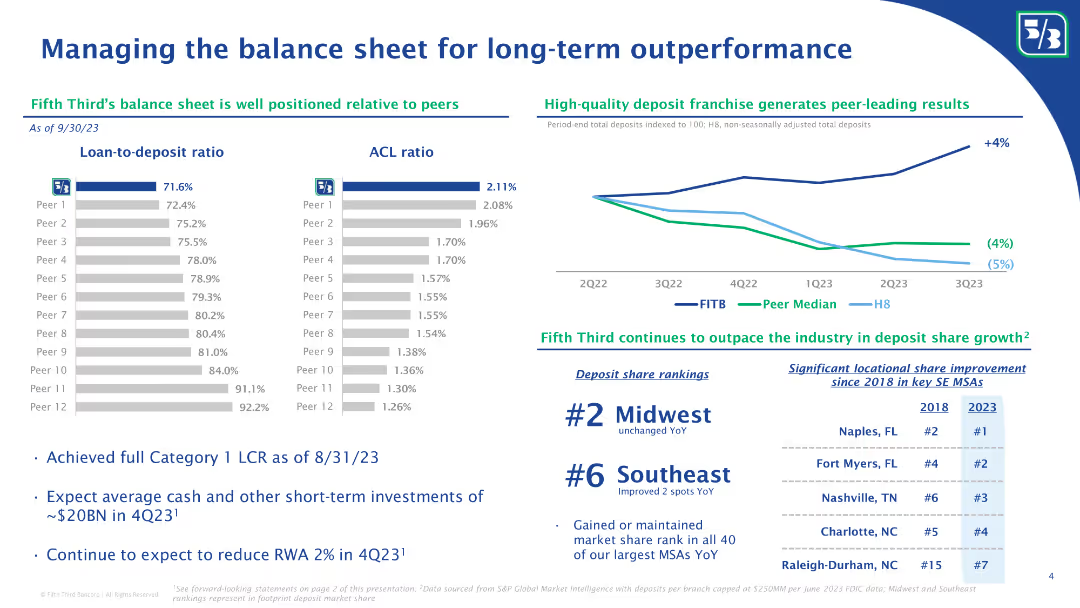
This slide features two graphs—a loan-to-deposit ratio bar graph and an ACL ratio bar graph—alongside a line chart comparing deposit growth and two bullet point sections with key insights. The design employs a clear, professional layout with a blue and green color scheme, enhancing readability and focus on the data presented.
Financial Performance
Financial Services
This slide compares Fifth Third's balance sheet metrics with industry peers and discusses its strong deposit franchise, along with market share rankings. It would be suitable for financial analysts or internal reviews to evaluate the bank's performance and strategy for long-term outperformance, as well as for discussing market positioning.
Balance Sheet, Ratios, Deposit Growth, Market Share, Bar Graph, Line Chart, Financial Services, Comparison, Strategy
false
Financial Performance
Financial Services financial-services
Multiple Chart
Goldman Sachs
View slide
Detailed balance sheet with assets and liabilities breakdown, showing various categories like loans, derivatives, and deposits, along with coverage ratio.
Financial Performance
Financial Services
Comprehensive breakdown of UBS's balance sheet for 3Q23, detailing assets, liabilities, and equity with a focus on coverage ratio.
Balance sheet, assets, liabilities, equity, coverage ratio
false
Financial Performance
Financial Services financial-services
Multiple Chart
UBS
View slide
The slide includes a column chart showing loan-to-deposit ratios and ACL ratios of Fifth Third Bank compared to peers. Bullet points below discuss liquidity coverage ratio and other financial metrics.
Risk Assessment and Management
Financial Services
The slide provides an analysis of Fifth Third Bank’s balance sheet management, comparing key financial ratios like loan-to-deposit and ACL ratios with peers. It highlights their liquidity coverage ratio and strategic financial positioning for long-term outperformance.
Balance sheet, long-term performance, financial ratios, loan-to-deposit ratio, ACL ratio, liquidity coverage, Fifth Third Bank, financial metrics, peer comparison, financial strategy
false
Risk Assessment and Management
Financial Services financial-services
Multiple Chart
Goldman Sachs
View slide
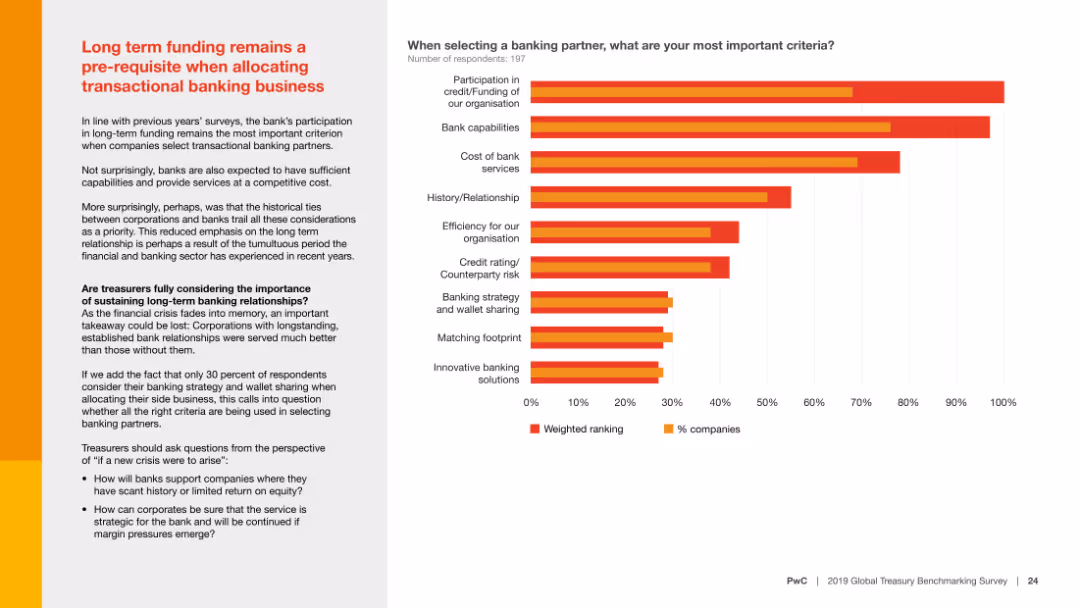
Features a column chart comparing CFO's and treasurer's agenda priorities. Text elaborates on balance sheet management importance.
Financial Performance
Financial Services
Discusses the importance of balance sheet management for treasurers and CFOs, emphasizing cash flow forecasting and capital structure as key priorities.
Balance sheet, management, cash flow, CFO, treasurer
false
Financial Performance
Financial Services financial-services
Mixed Chart
PwC/Strategy&
View slide
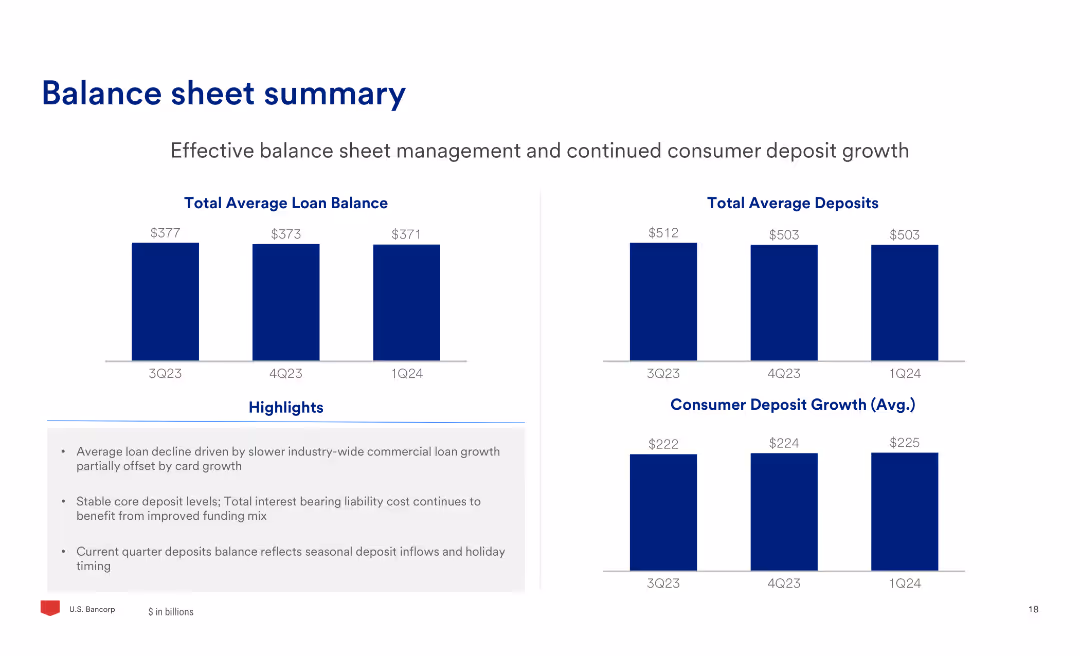
The slide includes two column charts showing total average loan balance and total average deposits over three quarters, along with text highlights on balance sheet management.
Financial Performance
Financial Services
The slide provides an overview of the balance sheet, focusing on effective management of loans and deposits, highlighting the trends in average balances and deposit growth.
Balance, Sheet, Loans, Deposits, Management, Growth
false
Financial Performance
Financial Services financial-services
Multiple Chart
Barclays
View slide
The slide shows three pie charts representing the geographical, sectoral, and client distribution of Ipsos's business.
Strategic Planning
Professional Services
The slide highlights Ipsos's balanced and diversified business approach, with detailed breakdowns of geographies, sectors, and client bases.
Balanced, Diversified, Business, Geographies, Sectors
false
Strategic Planning
Professional Services professional-services
Multiple Chart
IPSOS
View slide
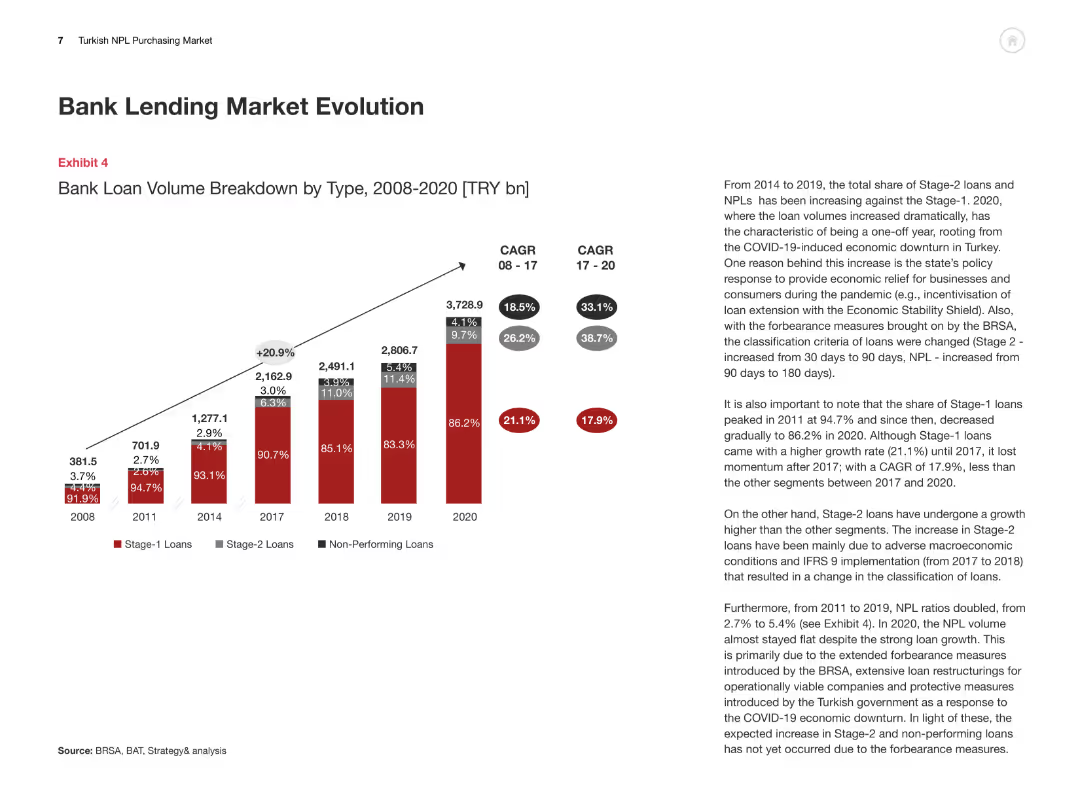
The slide includes a column chart showing the evolution of bank loan volumes by type from 2008 to 2020, with detailed textual analysis of the data trends and implications.
Market Analysis and Trends
Financial Services
This slide provides a comprehensive overview of the Turkish bank lending market evolution, highlighting the changes in loan volumes and types over a period of time.
Bank Lending, Market Evolution, Turkey, Loan Volumes, Data Trends
false
Market Analysis and Trends
Financial Services financial-services
Mixed Chart
PwC/Strategy&
View slide
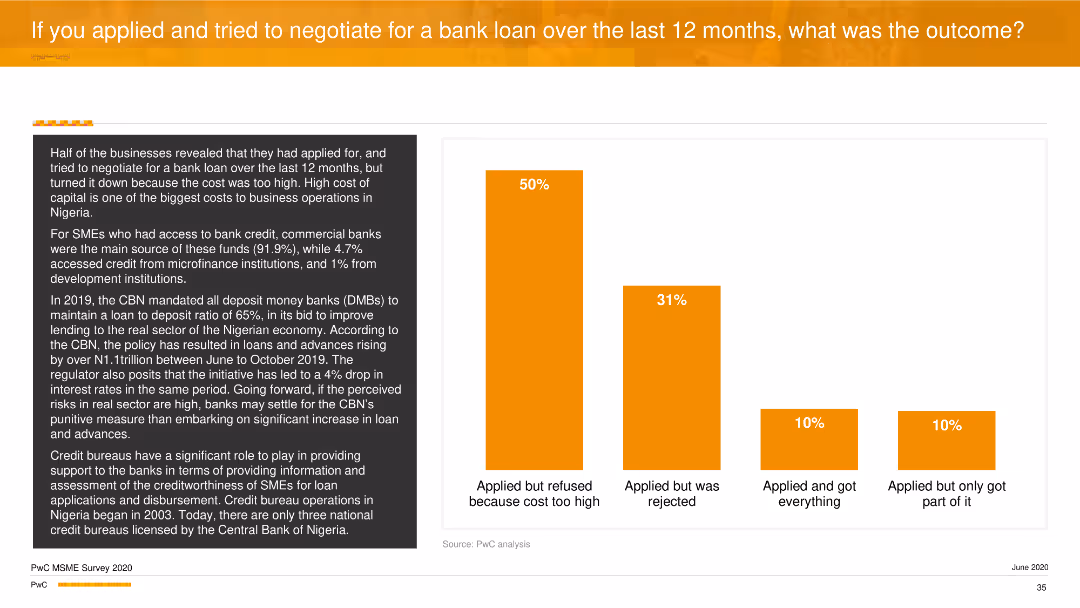
The slide features a vertical column chart showing outcomes of bank loan applications. Half were refused due to high costs. Detailed text on loan negotiation outcomes is on the left.
Risk Assessment and Management
Financial Services
It discusses the outcomes of loan applications, revealing that high costs were the primary reason for refusals. It provides insights into the challenges faced by SMEs in securing bank loans and highlights the role of credit bureaus.
Bank Loans, Negotiation, SMEs, Financing, PwC
false
Risk Assessment and Management
Financial Services financial-services
Mixed Chart
PwC/Strategy&
View slide
A compilation of headlines and dates detailing partnerships between banks and Fintech companies over recent years.
Mergers and Acquisitions
Financial Services
Focuses on the acceleration of bank and Fintech partnerships, detailing various collaborative efforts.
Bank Partnerships, Fintech, Collaboration, Acceleration, Strategic Alliances
false
Mergers and Acquisitions
Financial Services financial-services
Boxed
Citigroup
View slide
Line chart showing Japan's policy rate and yield curve control band. Another chart shows BOJ's holdings of government bonds and ETFs.
Market Analysis and Trends
Financial Services
Examines the Bank of Japan's monetary policy, highlighting the policy rate and bond holdings to understand its impact on the market.
Bank of Japan, monetary policy, yield curve, bonds, ETFs
false
Market Analysis and Trends
Financial Services financial-services
Multiple Chart
JP Morgan
View slide
Includes two pie charts showing the frequency of core and secondary bank relationship reviews. Text explains the importance of systematic reviews.
Operational Efficiency
Financial Services
Highlights the lack of regular review of bank relationships by treasurers, suggesting systematic, scheduled reviews to enhance service and future readiness.
Bank relationships, review, frequency, systematic, treasurers
false
Operational Efficiency
Financial Services financial-services
Mixed Chart
PwC/Strategy&
View slide
Contains a side-by-side column chart comparison and bullet points detailing the benefits of utilizing bank entities for growth.
Strategic Planning
Financial Services
Offers a strategic overview of banking model advantages, targeting stakeholders or internal strategic reviews to optimize banking operations.
Banking Model, Strategy, Asset Growth, Funding, Operational Efficiency, Financial Services
false
Strategic Planning
Financial Services financial-services
Mixed Chart
Goldman Sachs
View slide
Details Citigroup's global consumer banking performance with data on net income, expenses, and credit costs among various regions.
Financial Performance
Financial Services
Analyzes the financial outcomes of Citigroup's global consumer banking operations, highlighting profitability and expense management.
Banking, Consumer, Performance, Profitability, Regions
false
Financial Performance
Financial Services financial-services
Mixed Chart
Citigroup
View slide
Slide with a title at the top, three columns with blue and black text. The left column has monetary values, the middle column has checkmarks and benefits, and the right column has progress details in blue boxes.
Financial Performance
Financial Services
The slide outlines the opportunity, value proposition, and progress plan in building transaction banking services, including deposit balances, onboarding, and team development.
Banking, Deposit Balances, Analytics, Onboarding, Team Building
false
Financial Performance
Financial Services financial-services
Table
Goldman Sachs
View slide
Features a US map indicating client coverage and a column chart illustrating expansion market revenue growth in blue and green bars.
Financial Performance
Financial Services
Reviews JPMorgan Chase & Co.'s organic expansion in Middle Market Banking, showcasing national coverage and significant revenue growth over time.
Banking, Expansion, Revenue, Growth, Coverage
false
Financial Performance
Financial Services financial-services
Multiple Chart
JP Morgan
View slide
The slide presents two sets of column charts. The left chart shows a slight increase in technology expenses from 2019 to 2022. The right side shows infrastructure costs remaining steady from 2015 to 2021 alongside a dramatic doubling of compute and storage volumes. Each chart includes annotations like percentage changes.
Financial Performance
Financial Services
The slide illustrates control over banking operational expenses against a backdrop of doubling technology volumes, indicating efficient resource allocation.
Banking, Expense Management, Technology Investment, Operational Efficiency, Growth, Infrastructure, Financial Services, Cost Control, Computational Volume, Scalability
false
Financial Performance
Financial Services financial-services
Multiple Chart
JP Morgan
View slide
A two-column slide, the left side shows column charts with market share and industry wallet, while the right side lists key focus areas for discussion with check marks.
Market Analysis and Trends
Financial Services
Discussing the ranking in investment banking fees, the slide covers historical data, market share, regional performance, and focus areas for in-depth discussion regarding future strategy and client relationships.
Banking, Fees, Market Share, Strategy
false
Market Analysis and Trends
Financial Services financial-services
Mixed Chart
JP Morgan
View slide
This slide features multiple column charts showing loan volumes, revenues, and deposits growth from 2016 to 2017 for ICG and GCB units.
Financial Performance
Financial Services
The slide compares year-over-year growth in loan volumes, revenues, and deposits for Citigroup's ICG and GCB units, emphasizing strategic partnerships and market expansion.
Banking, Finance, Revenue, Growth, Loans
false
Financial Performance
Financial Services financial-services
Multiple Chart
Citigroup
View slide
Features column charts displaying decade-long trends in revenue, deposits, loans, and gross IB revenue, accompanied by key metric summaries. Dark and light blue palette.
Financial Performance
Financial Services
A decade-long review of commercial banking's sustainable growth, emphasizing revenue, deposits, and loans with a summary of key financial metrics over ten years.
Banking, Growth, Revenue, Loans, Deposits
false
Financial Performance
Financial Services financial-services
Multiple Chart
JP Morgan
View slide
Two main sections: upper with a business banking overview, lower with icons representing specialized industries. Blue and grey color scheme, clean layout.
Financial Performance
Financial Services
The slide provides an overview of JPMorgan Chase & Co.'s commercial and industrial segments, highlighting specialized industry expertise and key financial figures.
Banking, Industry, Specialization, Clients, Revenue
false
Financial Performance
Financial Services financial-services
Linear Flow
JP Morgan
View slide
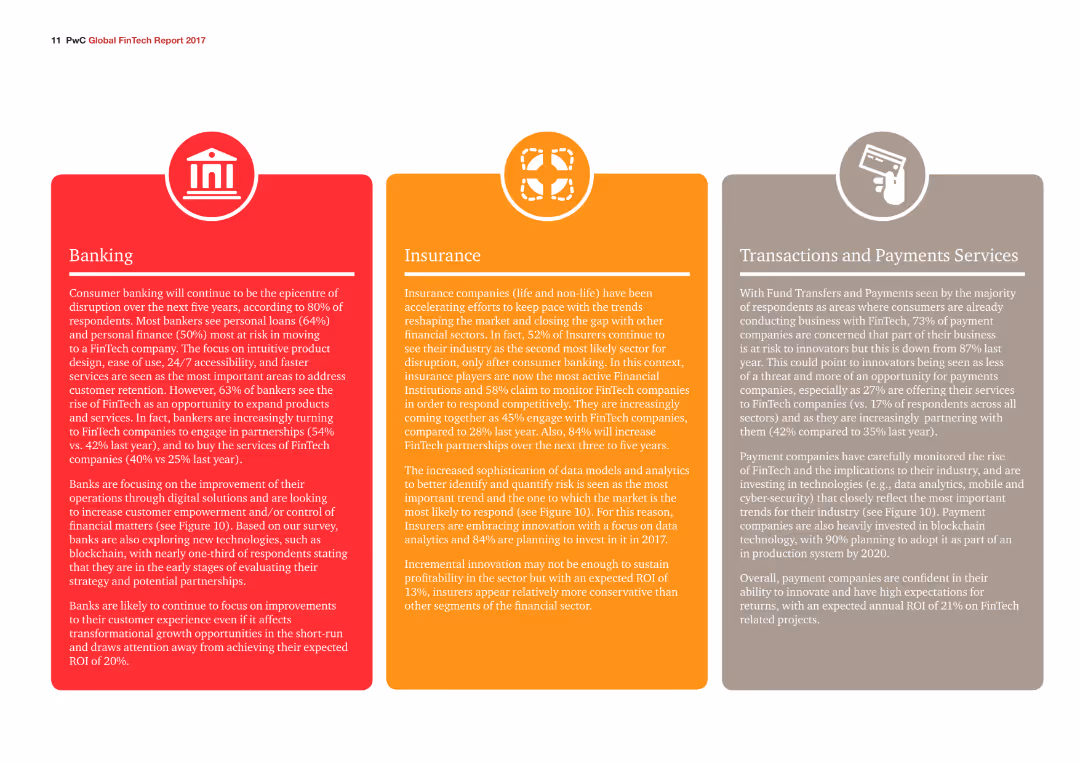
Three colored sections provide a detailed overview of trends and developments in Banking, Insurance, and Transactions and Payments Services, with corresponding icons.
Industry Overview
Financial Services
The slide gives an overview of consumer banking, insurance sector trends, and payment services, highlighting the increasing role of FinTech in these areas.
Banking, Insurance, Payments, Trends, FinTech
false
Industry Overview
Financial Services financial-services
Pillar
PwC/Strategy&
Previous
Loading...
Hold On!
We are searching in our database
If nothing, comes up, please try different filters!
Column Chart
Heatmap
Chevron
Org Chart
Infographic
Callouts
Timeline
List
Graphic
Picture
Process Flow
Diagram
Paragraph
Map
Table
Framework
Subtitle
Takeaway Box
Icon
Other Chart
Radar Chart
Waterfall Chart
Mekko Chart
Pie Chart
Scatter Plot
Line Chart
Bar chart
Bullet points
Create a FREE account to continue browsing
Receive Instant Access to 1,000+ slides from companies like McKinsey, Google, and Goldman Sachs
First Name
Last Name
Email
Password
I agree to all
Terms & Privacy Policy
Thank you! Your submission has been received!
Oops! Something went wrong while submitting the form.
Have an account?
Sign in
Upgrade to PRO to Save slides
Advanced Search and Filters
Access to 15,000+ slides
Access to Category Pages
Save/Bookmark Slides
PowerPoint Template Library
Pick a Plan
MONTHLY
$12/month
Billed every month, Cancel anytime.
YEARLY
$9/year
Billed $108 annually, Cancel anytime.
Checkout for $12/month
Checkout for $108/yr
Secured by Stripe | AES-256 bit encryption