My Account
My Slides
Search by Category
Templates
Leave Feedback
Login
Logout
Get Started
Browse all Slides
Browse all Slides
Create a FREE Account
Instant access to 1,000+ real slides from top companies like McKinsey, BCG, Goldman Sachs, Google and many more!
First Name
Last Name
Email
Password
I agree to all
Terms & Privacy Policy
Thank you! Your submission has been received!
Oops! Something went wrong while submitting the form.
Have an account?
Sign in
📢 Ready to start building slides? Check out our new template library
VIEW TEMPLATES
Welcome,
Welcome
PRO
Show Featured Only
Checkbox 8
Companies
Mckinsey
Bain
BCG
EY
Deloitte
Accenture
PwC/Strategy&
JP Morgan
Goldman Sachs
Morgan Stanley
Citigroup
Deutsche Bank
Barclays
LEK
KPMG
Kearney
Oliver Wyman
Booz Allen Hamilton
Gartner
IPSOS
Nielsen
Slide type
Text Only
Linear Flow
Vertical Flow
Single Chart
Header Horizontal
Mixed Chart
Header Vertical
Pillar
Multiple Chart
Graphic
Agenda
Title
Table
Framework
Industry
Technology & Software
Artificial Intelligence
Financial Services
Retail & E-commerce
Consumer Goods
Industrial & Manufacturing
Transportation & Logistics
Telecommunications
Real Estate & Construction
Hospitality & Tourism
Professional Services
Education & Training
Media & Entertainment
Agriculture & Food Production
Healthcare & Pharmaceuticals
Environmental Services & Sustainability
Government & Public Sector
Use Case
Mergers and Acquisitions
Performance Metrics and KPIs
Client Case Studies
Competitive Landscape
Corporate Finance and Valuation
Product and Service Analysis
Customer and Market Segmentation
Organizational Structure and Change
Industry Overview
Regulatory and Compliance
Risk Assessment and Management
Investment Analysis
Organizational Structure and Change
Human Resources and Talent Management
Financial Performance
Market Analysis and Trends
Sales and Business Development
Human Resources and Talent Management
Clear all
Thank you! Your submission has been received!
Oops! Something went wrong while submitting the form.
Tag
View slide
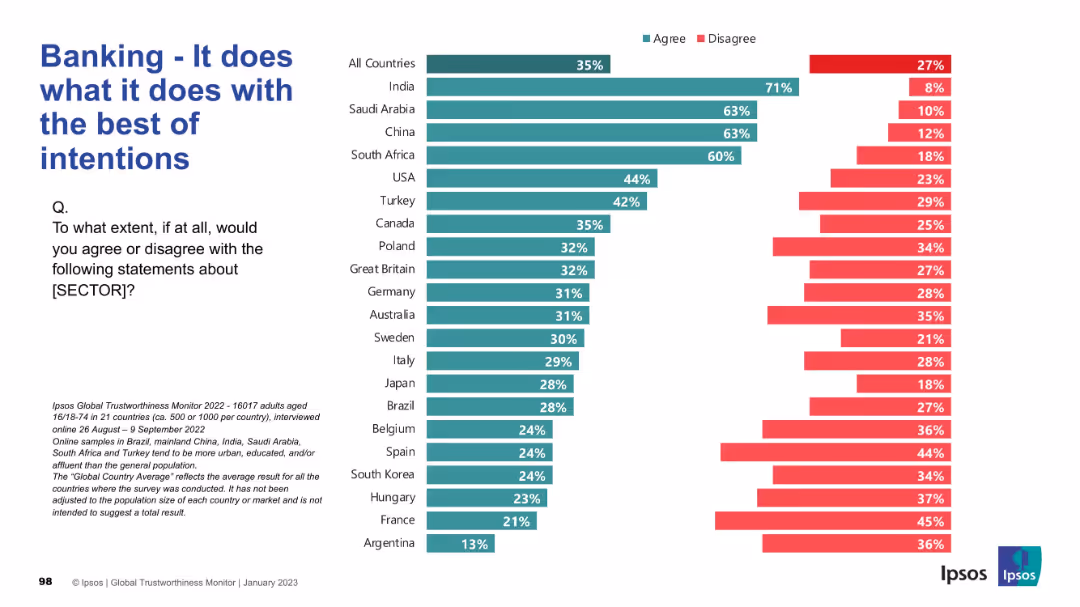
Standard bar chart format comparing agreement and disagreement globally. Green for agreement; red for disagreement.
Market Analysis and Trends
Financial Services
This slide presents whether the banking sector is perceived to operate with good intentions. High agreement is seen in India, Saudi Arabia, and China. Western countries display more critical views, with higher disagreement rates.
Banking, Intentions, Ethics, Global Survey, Financial Trust, Ipsos, Country Comparison, Public Perception
false
Market Analysis and Trends
Financial Services financial-services
Mixed Chart
IPSOS
View slide
A composite slide with a mix two column charts showing market share over time, one for individual products, and one by region.
Competitive Landscape
Financial Services
The slide compares investment banking fees, market share trends over a decade, and highlights continued leadership positions across various products, demonstrating sustained success in the industry.
Banking, Leadership, Fees, Trends
false
Competitive Landscape
Financial Services financial-services
Multiple Chart
JP Morgan
View slide
The slide includes a column chart showing the increase in WM loans from 2019 to 2023, and text highlighting the growth in net new assets and revenues for current checking account holders.
Strategic Planning
Financial Services
The slide emphasizes the momentum to expand household lending and the impact on net new assets and revenues, showcasing significant growth in WM loans and household penetration.
Banking, Lending, Net New Assets, Revenues, WM Loans, Household Penetration, Column Chart, Morgan Stanley
false
Strategic Planning
Financial Services financial-services
Mixed Chart
Morgan Stanley
View slide
A three-part image showing the U.S. map in red, blue, and dark blue, highlighting different business regions. The right side lists key company data points in a clear font.
Industry Overview
Financial Services
Offers an overview of U.S. Bancorp's key statistics, including founding year, market value, and services across regional, national, and international spectrums. Intended for corporate profiling.
Banking, Market Value, Branches, Assets
false
Industry Overview
Financial Services financial-services
Graphic
Goldman Sachs
View slide
The slide features multiple data visualization formats including bar charts, column charts, and tables. It compares financial performance over different quarters.
Financial Performance
Financial Services
This slide provides a detailed financial analysis for a Private Bank, comparing quarterly data including revenues, assets, and net flows. It highlights key areas such as double-digit revenue growth and net interest income changes, targeting professionals in financial management or strategic planning.
Banking, Revenue, Assets, Quarterly Analysis, Financial Growth
false
Financial Performance
Financial Services financial-services
Multiple Chart
Deutsche Bank
View slide
Blue and white color scheme with multiple graphics. There's a flowchart at the top, three outlined boxes below indicating rankings (#1 Primary bank market share, #2 SMB credit card spend, #1 Payment provider), and logos for VISA and Chase.
Market Analysis and Trends
Financial Services
The slide communicates Chase's market position and services offered to SMBs, highlighting key rankings in primary bank market share and SMB credit card spend.
Banking, SMBs, Chase, Market Share, Credit Card, Payment Provider, Rankings, Services, Business
false
Market Analysis and Trends
Financial Services financial-services
Linear Flow
JP Morgan
View slide
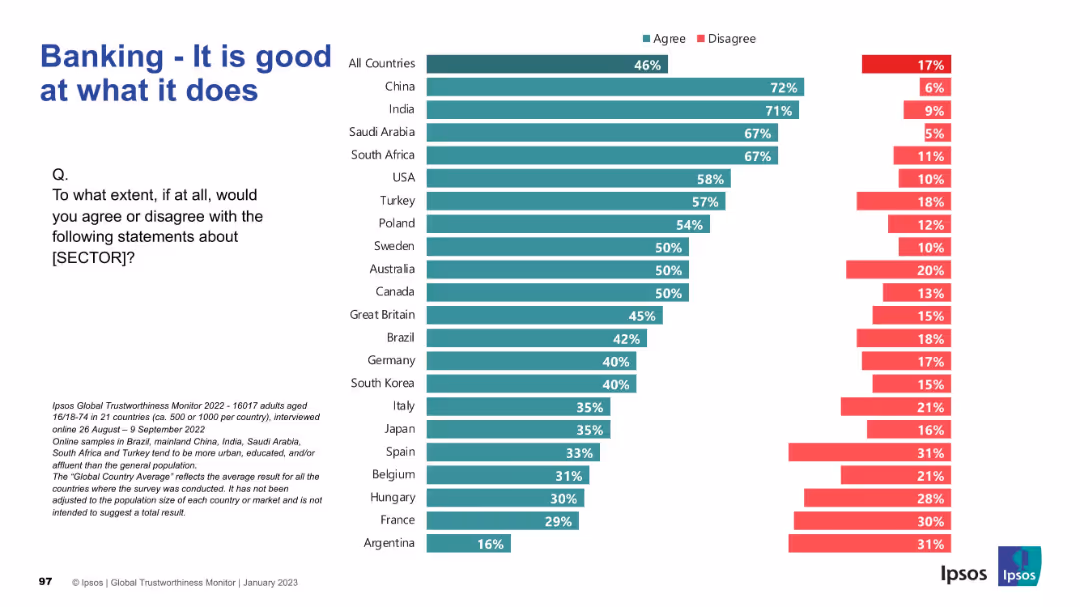
Bar chart similar to oil & gas slides, but focused on banking sector. Countries listed by agreement percentage.
Market Analysis and Trends
Financial Services
This slide surveys public confidence in the banking sector’s effectiveness. Agreement is strongest in China, India, and Saudi Arabia. Western nations show moderate agreement, with Argentina at the bottom.
Banking, Sector Performance, Trust, Financial Services, Global Sentiment, Effectiveness, Ipsos Survey, Public Perception
false
Market Analysis and Trends
Financial Services financial-services
Mixed Chart
IPSOS
View slide
Layout includes column charts and bullet points detailing performance metrics in personal banking and wealth management.
Client Case Studies
Financial Services
Reviews the performance results in personal banking and wealth management, highlighting net income growth and credit cost impacts. It serves to analyze client-oriented strategies and financial trends affecting personal banking sectors.
Banking, Wealth Management, Performance, Results, Financial
false
Client Case Studies
Financial Services financial-services
Mixed Chart
Citigroup
View slide
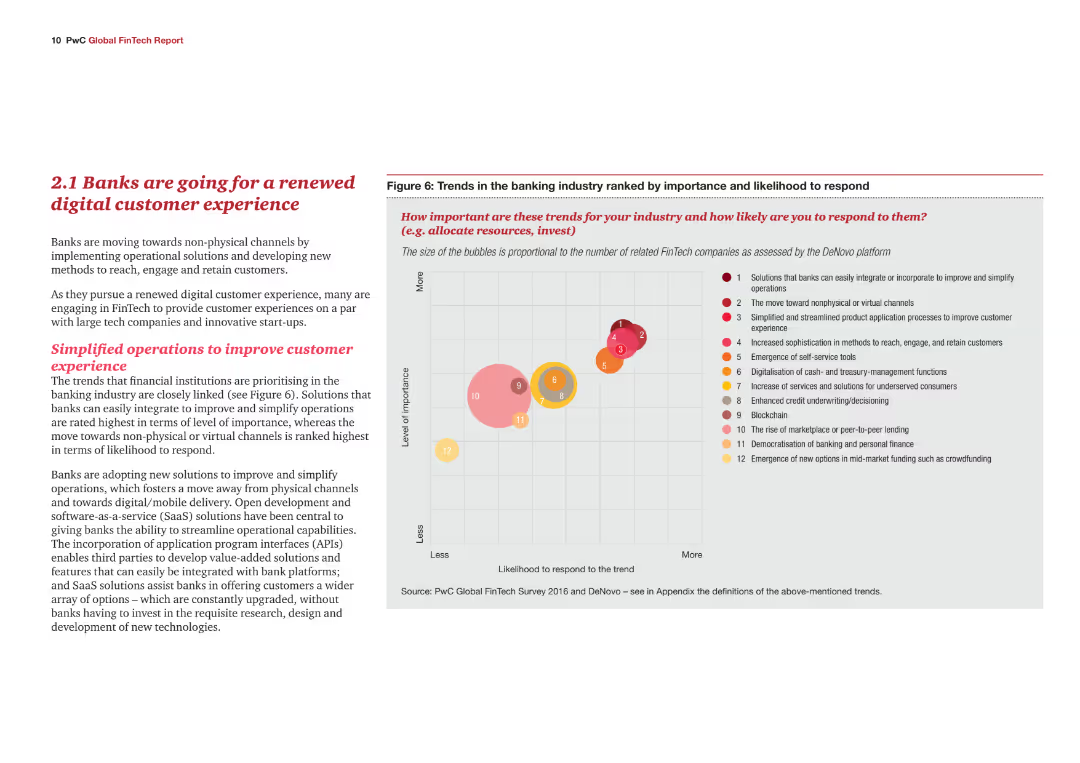
A content slide with text explaining the trends in the banking industry towards digital customer experiences. Includes a bubble chart ranking various trends in terms of importance and likelihood to respond.
Market Analysis and Trends
Financial Services
This slide highlights the shift in the banking industry towards enhancing digital customer experiences. It identifies key trends and their importance, supported by a bubble chart that ranks these trends based on their perceived significance and likelihood of adoption.
Banking, digital customer experience, trends, importance, likelihood to respond, bubble chart
false
Market Analysis and Trends
Financial Services financial-services
Mixed Chart
PwC/Strategy&
View slide
The slide includes a line chart depicting US commercial bank borrowing from the Federal Reserve from 2007 to 2023, highlighting events like the 2008-09 Global Financial Crisis, COVID-19 pandemic, and recent US bank failures. Text boxes annotate significant events.
Risk Assessment and Management
Financial Services
The slide discusses the elevated financial stress in the US banking sector post-regional bank failures, urging companies to reassess internal and external risks. It includes implications for corporates, such as increased market pressure, regulatory fallout, and liquidity management strategies.
Banking, liquidity, financial crisis, borrowing, market pressure, regulatory, corporate implications, stress, Federal Reserve, risk
false
Risk Assessment and Management
Financial Services financial-services
Mixed Chart
Accenture
View slide
Structured slide with hexagonal graphics, connecting various business operations aspects centered around commercial banking.
Operational Efficiency
Financial Services
Discusses enhancing client experience and operational excellence in commercial banking by improving onboarding, service channels, and lending processes.
Banking, operational excellence, client experience, service improvement, digital transformation, KYC
false
Operational Efficiency
Financial Services financial-services
Framework
JP Morgan
View slide
Slide contains column charts, and images. It has a dense layout with graphical data.
Financial Performance
Financial Services
Discusses Spain's banking activity, loan loss provisions, and focus on cost control in a low-interest-rate environment.
Banking, provisions, P&L, cost, interest
false
Financial Performance
Financial Services financial-services
Multiple Chart
Morgan Stanley
View slide
Combines text sections with check marks and minimalistic design.
Strategic Planning
Financial Services
Describes Goldman Sachs' progress in global banking and markets, asset & wealth management, and strategic initiatives for 2023.
Banking, strategies, Goldman Sachs
false
Strategic Planning
Financial Services financial-services
Header Horizontal
Goldman Sachs
View slide
Two charts: a bar chart showing global corporate debt maturities by year and a line chart tracking corporate bankruptcy trends alongside non-investment grade corporate yields, emphasizing financial stress from high-interest rates.
Financial Performance
Financial Services
The slide predicts amplified financial stress and bankruptcy pressures for corporations due to the likelihood of sustained high-interest rates, with significant refinancing needs emerging in 2024 and beyond.
Bankruptcy, Interest Rates, Corporate Debt, Financial Stress, Refinancing
false
Financial Performance
Financial Services financial-services
Multiple Chart
Accenture
View slide
Contains two line charts. The left chart depicts policy rate trends of the Fed, ECB, and BoJ from January 2020 to April 2024. The right chart shows the return-on-equity of US, European, and Japanese banks from 2010 to 2024.
Market Analysis and Trends
Financial Services
Discusses how global economic resilience and higher inflation expectations affect central bank policies, influencing the profitability of banks, particularly in the US, Europe, and Japan.
Banks, Fed, ECB, BoJ, Return-on-Equity, Policy Rates, Inflation, Market Analysis
false
Market Analysis and Trends
Financial Services financial-services
Multiple Chart
Morgan Stanley
View slide
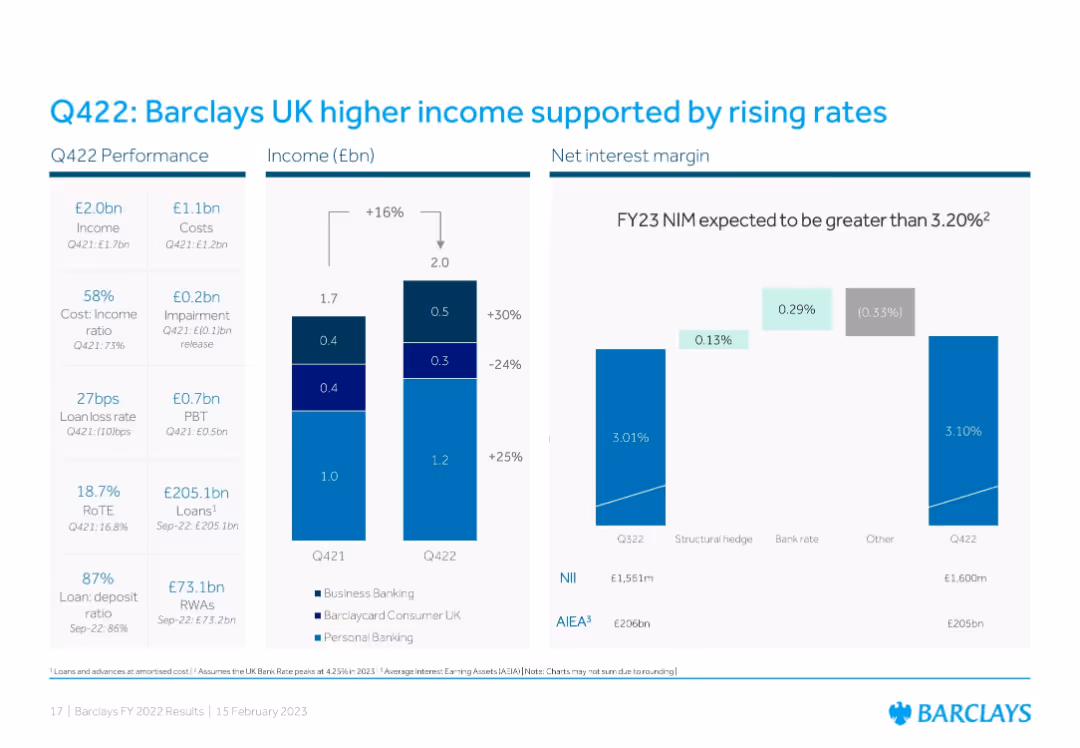
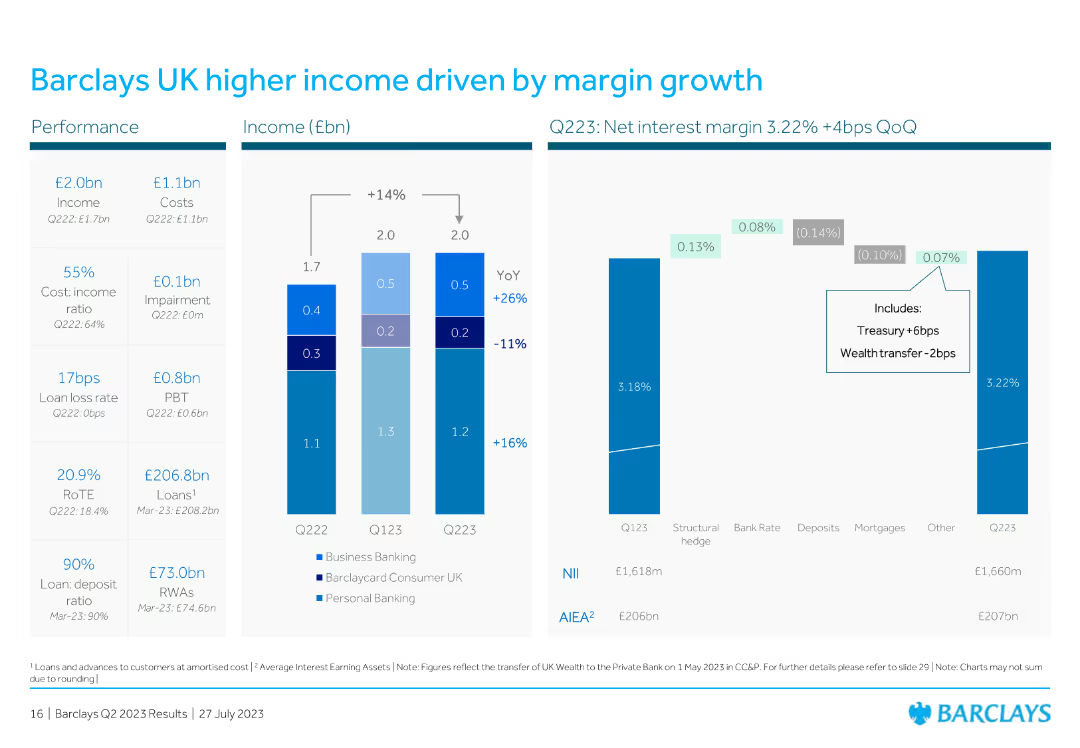
Three-section layout: Left shows Q422 performance metrics, center has a bar chart comparing Q421 and Q422 income by segment, and right displays a net interest margin (NIM) bridge.
Financial Performance
Financial Services
Demonstrates income growth in Barclays UK driven by interest rate rises, showing improved NIM and income across segments (Personal, Business, Barclaycard). Also includes NII and AIEA figures to reinforce NIM expectations for FY23.
Barclays UK, NIM, income growth, interest rates, Q422, personal banking, business banking, RoTE
false
Financial Performance
Financial Services financial-services
Multiple Chart
Barclays
View slide
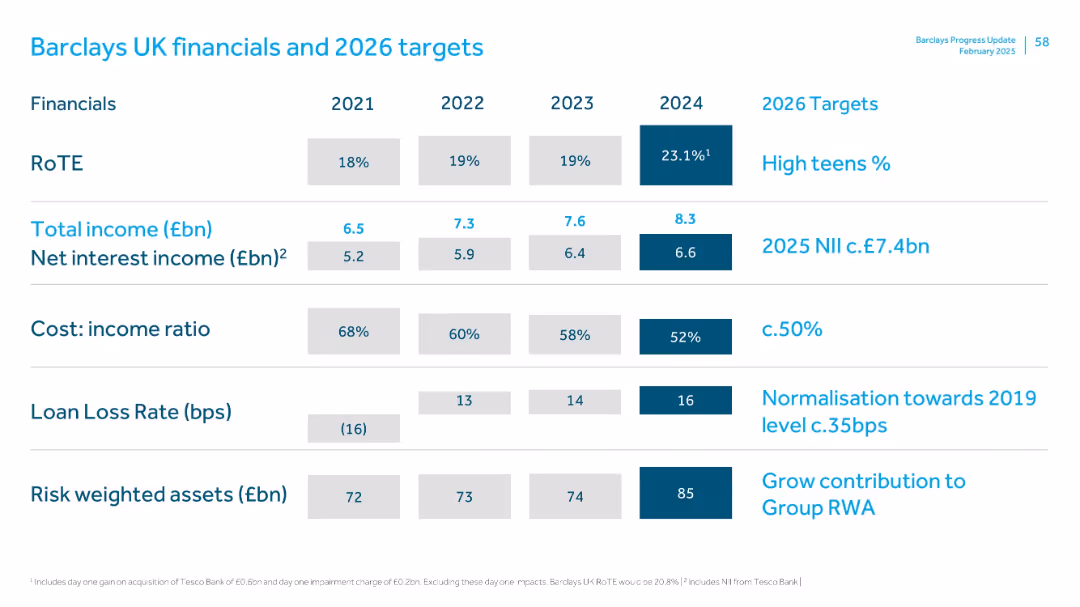
Table format comparing 2021–2024 historical data and 2026 forward targets for KPIs like RoTE, income, cost ratio, and loan loss rates.
Financial Performance
Financial Services
Shows historical and forecasted financials for Barclays UK, including a spike in RoTE (23.1% in 2024), cost ratio improvements, and RWA growth. Lays out performance targets including £7.4bn NII for 2025 and ~50% CIR by 2026.
Barclays UK, financial targets, RoTE, NII, CIR, loan loss, income forecast
false
Financial Performance
Financial Services financial-services
Single Chart
Barclays
View slide
The slide presents a column chart showing income, costs, and other metrics over different quarters, highlighting margin growth.
Financial Performance
Financial Services
This slide focuses on the income growth for Barclays UK driven by increased margins, and includes various performance metrics to support the data.
Barclays UK, income, growth, margin, performance, metrics, financial, column chart, quarter, costs
false
Financial Performance
Financial Services financial-services
Multiple Chart
Barclays
View slide
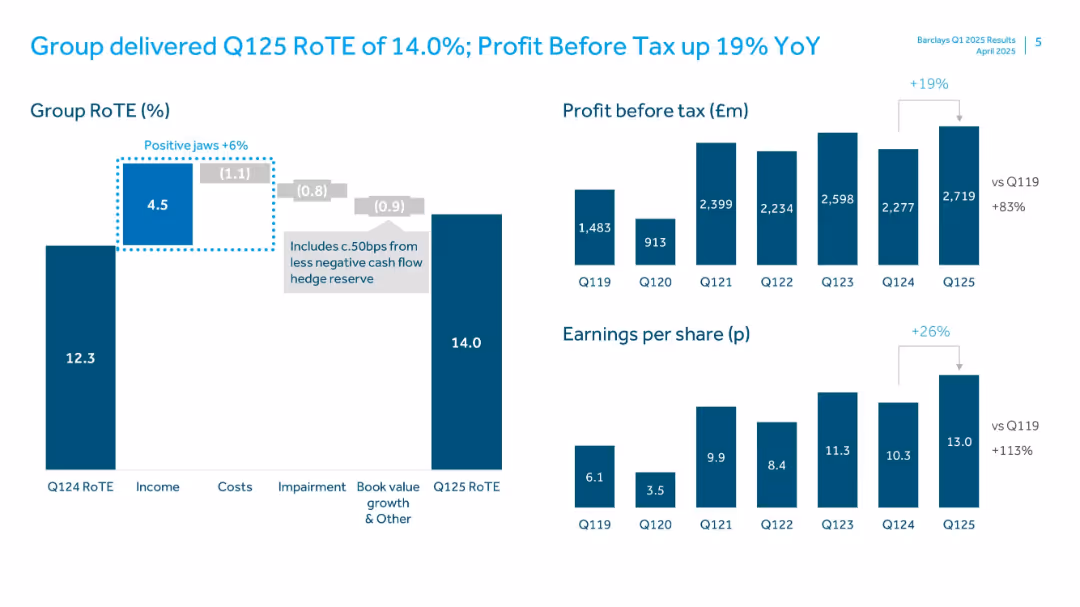
Bar and waterfall charts showing RoTE breakdown, profit before tax, and EPS.
Financial Performance
Financial Services
This slide from Barclays illustrates quarterly Return on Tangible Equity (RoTE), along with profit before tax and earnings per share from Q119 to Q125. It emphasizes YoY and QoQ improvements.
Barclays, RoTE, earnings, profit, EPS, financial results, Q125, tax, UK banking, performance metrics
false
Financial Performance
Financial Services financial-services
Multiple Chart
Barclays
View slide
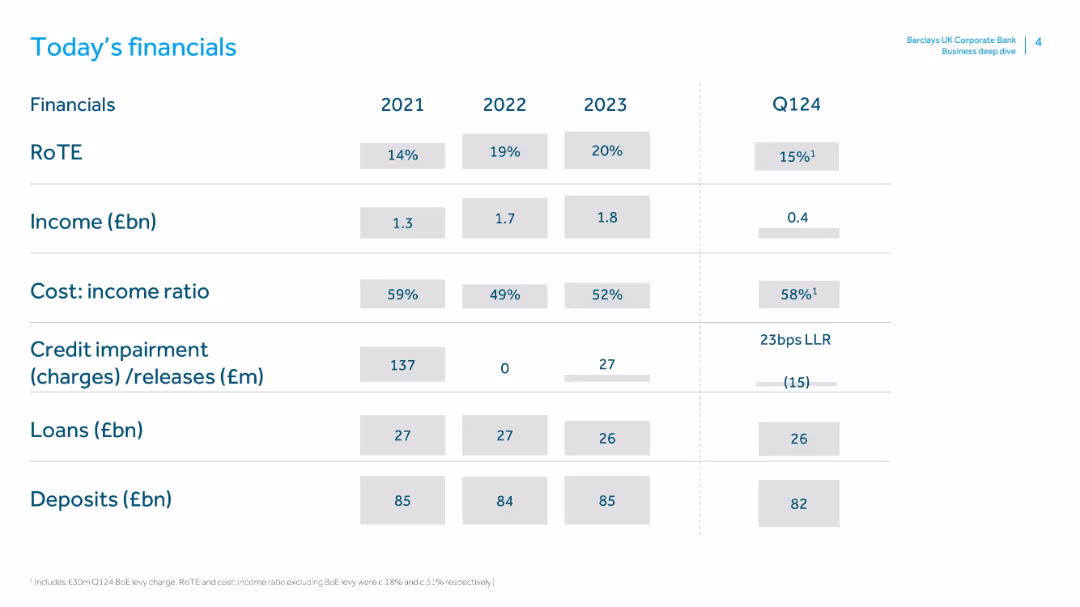
Minimalistic design; clean white background with grey tables; financial metrics across 2021–Q1 2024
Financial Performance
Financial Services
This slide summarizes Barclays UK Corporate Bank's financial performance across 2021–Q1 2024. Metrics include RoTE, income, cost:income ratio, credit impairment, loans, and deposits. It shows income growth and improved cost efficiency from 2021–2023, with Q1 2024 metrics still in early reporting phase. Provides snapshot of profitability and operational performance.
Barclays, RoTE, income, cost efficiency, credit impairment, deposits, loans, UK bank, Q1 2024, financial overview
false
Financial Performance
Financial Services financial-services
Single Chart
Barclays
View slide
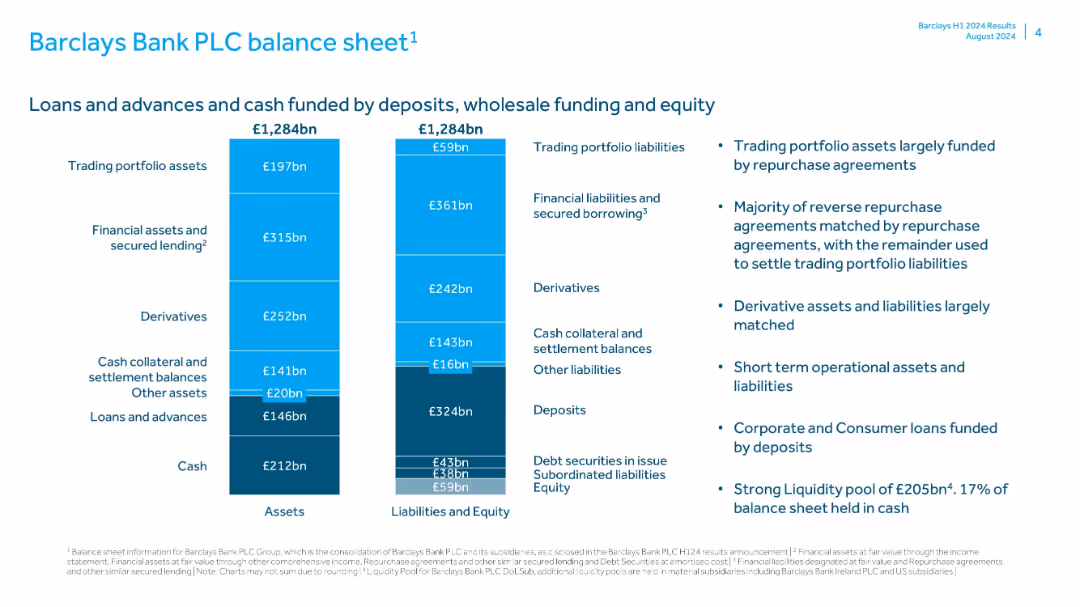
Dual vertical bar charts for assets and liabilities; bullet points on the right; color-coded segments representing major categories
Corporate Finance and Valuation
Financial Services
Presents Barclays’ balance sheet for H1 2024, categorizing assets and liabilities by type. Highlights the funding sources, such as deposits and repo agreements, and discusses liquidity and risk management strategy.
Barclays, balance sheet, H1 2024, trading portfolio, deposits, derivatives, secured lending, liquidity, funding
false
Corporate Finance and Valuation
Financial Services financial-services
Mixed Chart
Barclays
View slide
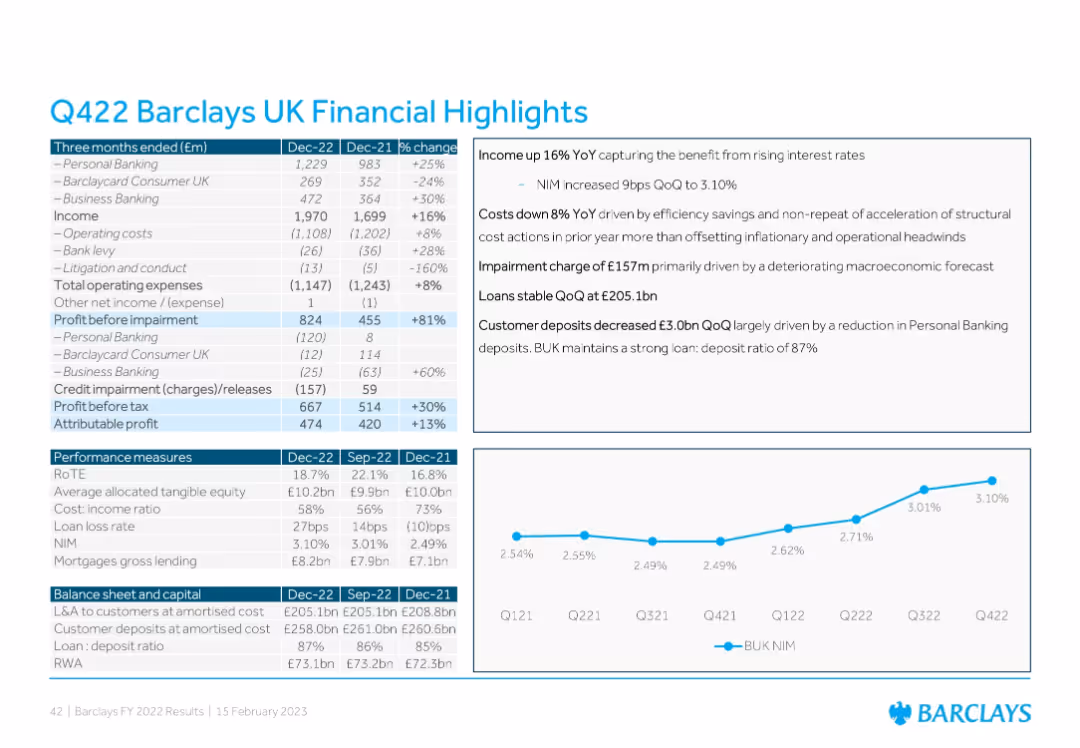
Text-heavy slide with two data tables, a boxed text summary, and a line chart; blue and white corporate design
Financial Performance
Financial Services
This slide provides Barclays UK’s Q4 2022 financial summary, comparing YoY and QoQ figures for income, costs, impairments, profit before tax, and other metrics. It includes insights on income growth, cost reduction, credit impairment, and deposits.
Barclays, financials, Q4 results, profit, impairments, deposits, banking
false
Financial Performance
Financial Services financial-services
Mixed Chart
Barclays
View slide
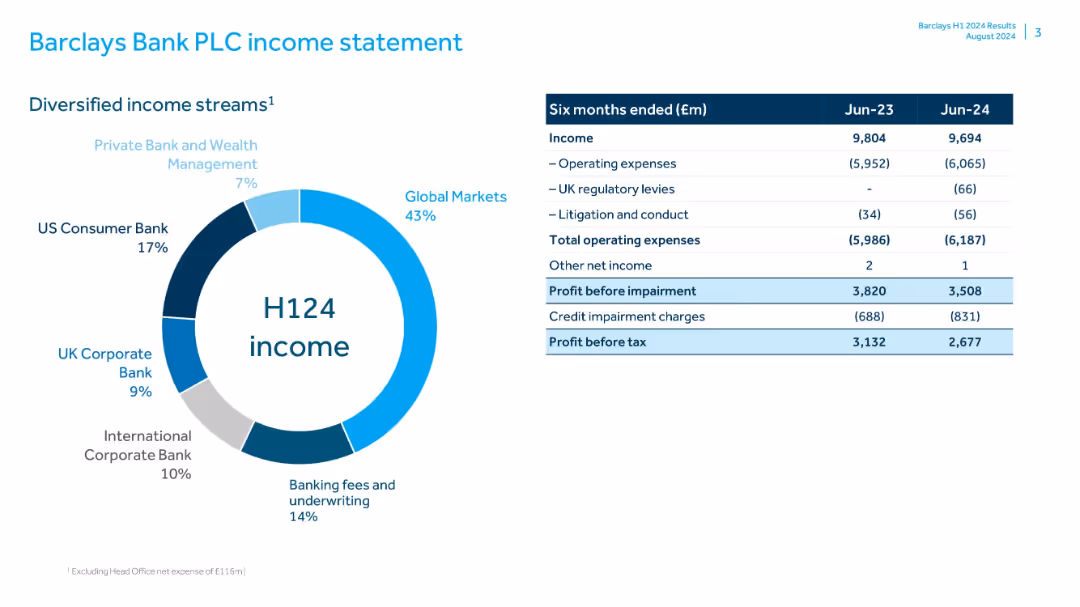
Donut chart for income breakdown by division; table of income, expenses, and profit for H1 2023 and H1 2024; blue/grey scheme
Financial Performance
Financial Services
Displays Barclays’ income and profit before tax for H1 2023 and 2024, with key figures broken down into income streams and major expenses. Provides a snapshot of profitability and changes year-over-year.
Barclays, income statement, H1 2024, profit, operating expenses, income streams, global markets, banking fees
false
Financial Performance
Financial Services financial-services
Mixed Chart
Barclays
View slide
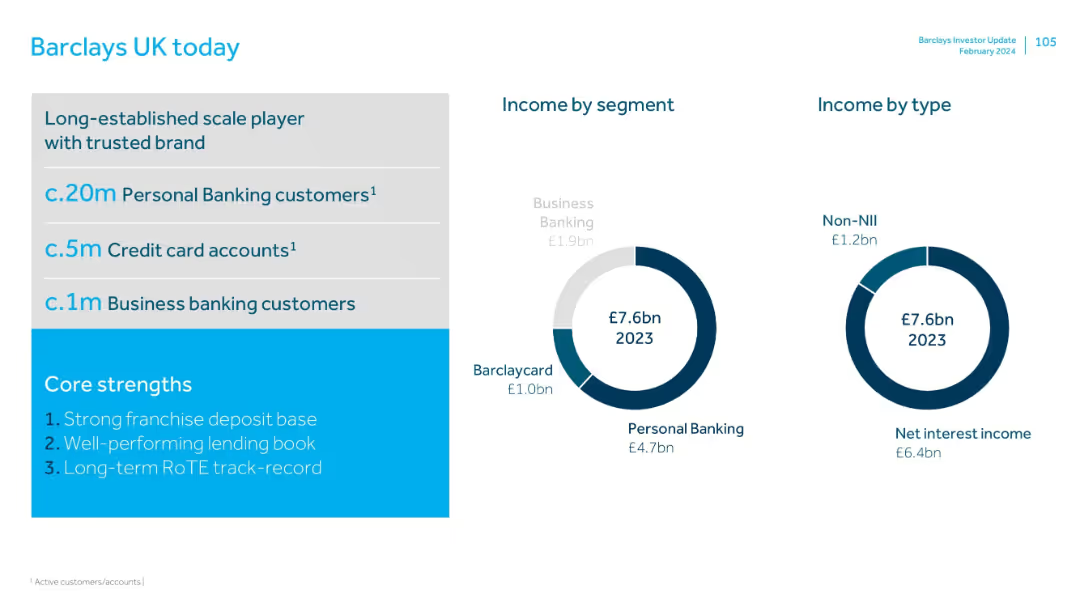
Left-aligned text and statistics on customers; two donut charts on the right show income by segment and by type.
Industry Overview
Financial Services
Provides a snapshot of Barclays UK’s scale and customer base, income segmentation, and core strengths. Emphasizes strong market presence with 20m personal banking customers and diversified income streams across banking segments.
Barclays, income, customers, personal banking, segment, brand, deposits
false
Industry Overview
Financial Services financial-services
Mixed Chart
Barclays
View slide
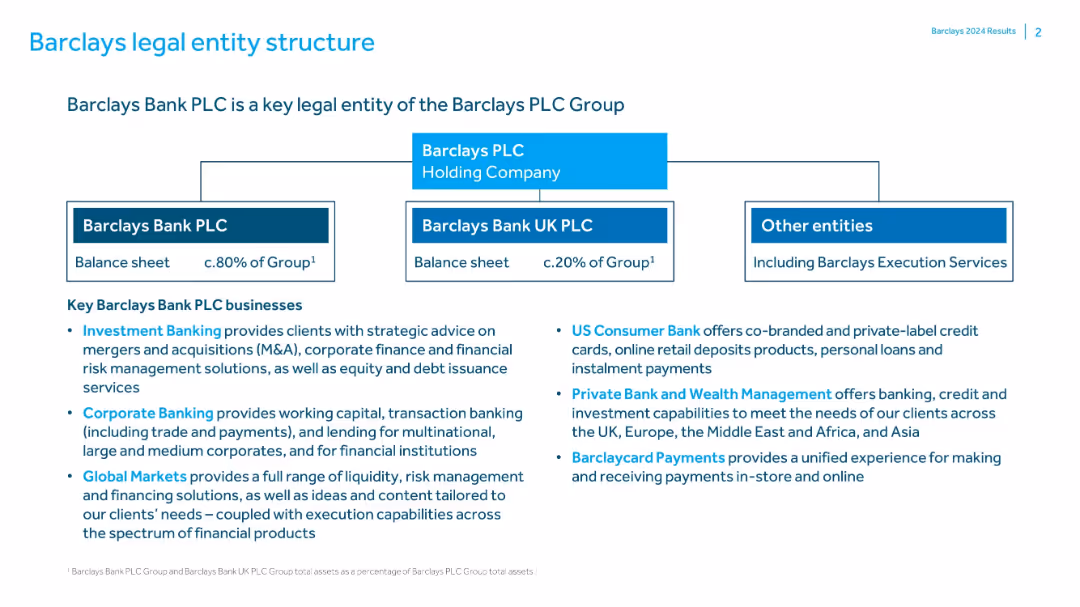
Flowchart-style layout with boxes connecting various legal entities under Barclays PLC Group, accompanied by bullet-point text on the bottom half.
Organizational Structure and Change
Financial Services
Describes the legal entity structure of Barclays PLC, highlighting the role of Barclays Bank PLC (80% of Group balance sheet), Barclays Bank UK PLC (20%), and other entities. Lists core business units and functions of each entity.
Barclays, legal structure, entities, investment banking, corporate banking, consumer bank, UK bank, balance sheet
false
Organizational Structure and Change
Financial Services financial-services
Header Vertical
Barclays
View slide
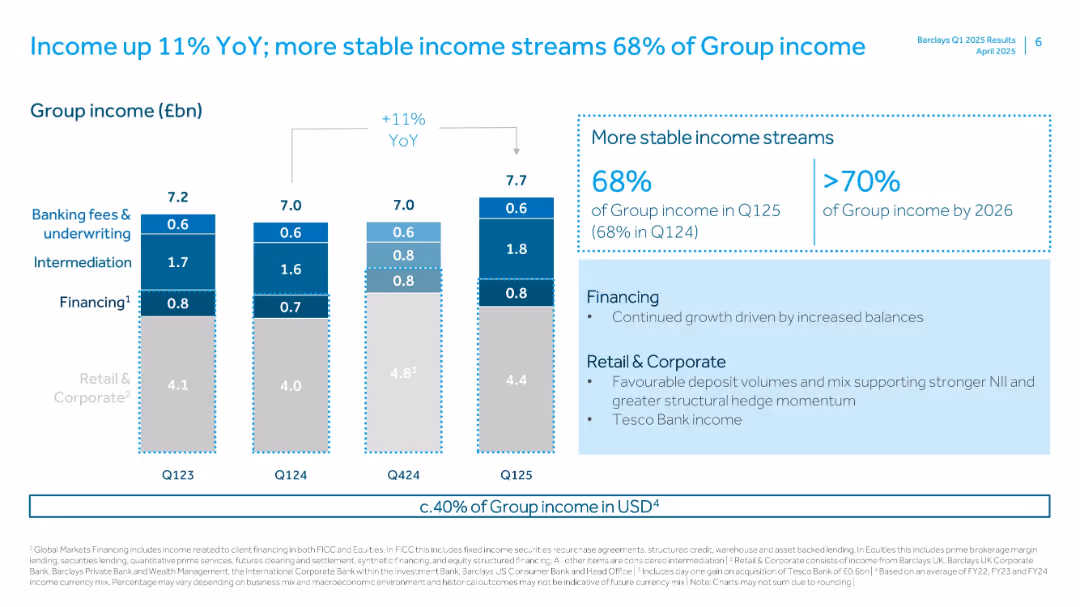
Stacked bar chart with detailed income components and stability commentary.
Performance Metrics and KPIs
Financial Services
This slide details Barclays' income growth and its increasingly stable composition. It breaks down income into categories and emphasizes stable sources now forming 68% of group income. A target for >70% by 2026 is highlighted.
Barclays, stable income, group earnings, income streams, KPIs, income growth, financial performance, UK bank
false
Performance Metrics and KPIs
Financial Services financial-services
Mixed Chart
Barclays
View slide
Features column charts depicting barriers to cost program success and lessons learned from such programs in the Nordics.
Operational Efficiency
Professional Services
Analyzes key barriers to the success of cost programs in Nordic countries and the lessons learned, highlighting management challenges and the underestimation of technology improvements.
Barriers, Lessons Learned, Nordic, Management Challenges, Technology
false
Operational Efficiency
Professional Services professional-services
Multiple Chart
Deloitte
View slide
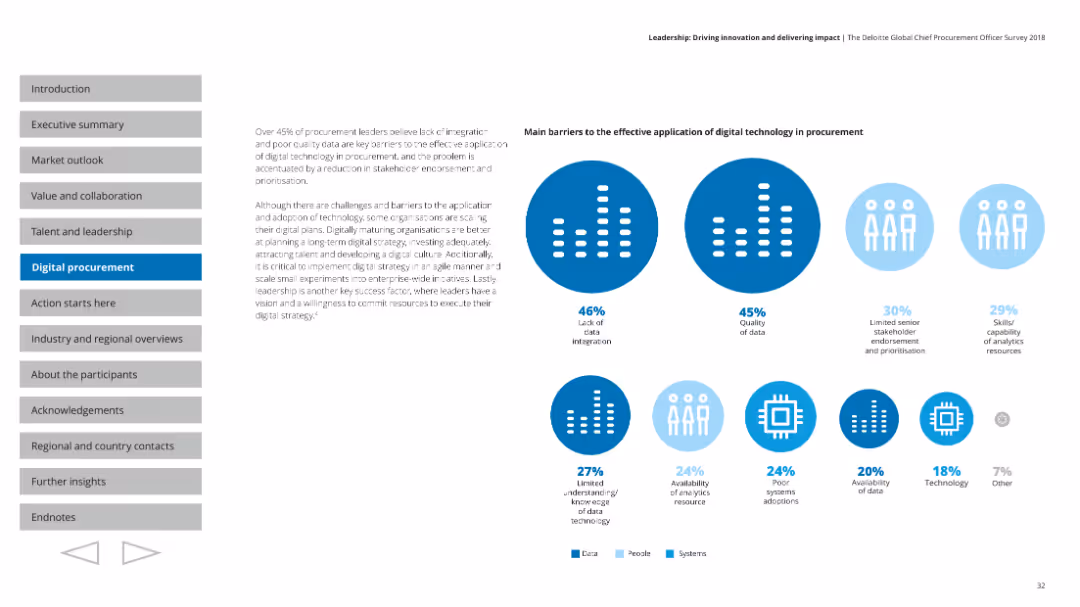
Displays pie charts illustrating main barriers to effective digital technology application in procurement, such as data integration and quality issues.
Technology and Digital Transformation
Professional Services
Identifies key barriers to the effective application of digital technologies in procurement, emphasizing the importance of stakeholder endorsement.
Barriers, digital technology, procurement, data integration
false
Technology and Digital Transformation
Professional Services professional-services
Multiple Chart
Deloitte
View slide
The slide showcases two line graphs comparing the common equity growth over time for different entities and projected growth due to Basel 3 reforms. It's a complex visual presentation meant for expert audiences.
Regulatory and Compliance
Financial Services
Provides an analysis of the firm's equity growth, anticipating the impact of Basel 3 regulatory reforms. Ideal for discussions on regulatory impact and financial forecasting in a professional or regulatory context.
Basel 3 Reforms, Equity Growth, Regulatory Impact, Financial Forecasting, Capital Adequacy
false
Regulatory and Compliance
Financial Services financial-services
Multiple Chart
Goldman Sachs
View slide
It includes column charts illustrating the 'Basel III capital position', with annotations and an adjacent key explaining the colors representing different financial categories.
Regulatory and Compliance
Financial Services
This slide highlights Macquarie's capital position under Basel III regulations, providing a regulatory compliance overview for stakeholders interested in financial health and compliance standards.
Basel III, Regulatory Compliance, Capital Position, Financial Health
false
Regulatory and Compliance
Financial Services financial-services
Single Chart
Morgan Stanley
Previous
Loading...
Hold On!
We are searching in our database
If nothing, comes up, please try different filters!
Column Chart
Heatmap
Chevron
Org Chart
Infographic
Callouts
Timeline
List
Graphic
Picture
Process Flow
Diagram
Paragraph
Map
Table
Framework
Subtitle
Takeaway Box
Icon
Other Chart
Radar Chart
Waterfall Chart
Mekko Chart
Pie Chart
Scatter Plot
Line Chart
Bar chart
Bullet points
Create a FREE account to continue browsing
Receive Instant Access to 1,000+ slides from companies like McKinsey, Google, and Goldman Sachs
First Name
Last Name
Email
Password
I agree to all
Terms & Privacy Policy
Thank you! Your submission has been received!
Oops! Something went wrong while submitting the form.
Have an account?
Sign in
Upgrade to PRO to Save slides
Advanced Search and Filters
Access to 15,000+ slides
Access to Category Pages
Save/Bookmark Slides
PowerPoint Template Library
Pick a Plan
MONTHLY
$12/month
Billed every month, Cancel anytime.
YEARLY
$9/year
Billed $108 annually, Cancel anytime.
Checkout for $12/month
Checkout for $108/yr
Secured by Stripe | AES-256 bit encryption