🎉 Black Friday Sale!
- Save 20% on SlideStart Pro Annual plan! CODE:
BLACKFRIDAY
My Account
My Slides
Search by Category
Templates
View All Templates
Download Template Slides
Leave Feedback
Login
Logout
Get Started
Browse all Slides
Browse all Slides
Create a FREE Account
Instant access to 1,000+ real slides from top companies like McKinsey, BCG, Goldman Sachs, Google and many more!
First Name
Last Name
Email
Password
I agree to all
Terms & Privacy Policy
Thank you! Your submission has been received!
Oops! Something went wrong while submitting the form.
Have an account?
Sign in
Instant access to the internet's best slides
Get access to 40+ advanced filters and more
Advanced Search and Filters
Access to
10,000+ slides
Access to Category Pages
Save/Bookmark Slides
PowerPoint Template Library (New)
Choose your plan
MONTHLY
$12/month
Billed every month, cancel anytime.
YEARLY
$9/month
Billed $108 annually, cancel anytime.
Checkout for $12/month
Checkout for $108/yr
Secured by Stripe | AES-256 bit encryption
Spark Your Next Big Idea with New Presentation Templates
VIEW ALL Templates
Welcome,
Welcome
Upgrade to SlideStart
Pro
Instant access to 15,000+ slides
Show Featured Only
Checkbox 8
Companies
Mckinsey
Bain
BCG
EY
Deloitte
Accenture
PwC/Strategy&
JP Morgan
Goldman Sachs
Morgan Stanley
Citigroup
Deutsche Bank
Barclays
LEK
Kearney
Oliver Wyman
Booz Allen Hamilton
Gartner
IPSOS
Nielsen
Slide type
Header Horizontal
Framework
Vertical Flow
Single Chart
Single Chart
Text Only
Mixed Chart
Header Vertical
Graphic
Pillar
Multiple Chart
Agenda
Title
Table
Linear Flow
Upgrade to SlideStart
Pro
Instant access to 40+ advanced filters
Industry
Upgrade to SlideStart
Pro
Instant access to 40+ advanced filters
Technology
Healthcare
Financial Services
Consumer Goods
Energy & Utilities
Manufacturing
Retail
E-commerce
Logistics
Telecommunications
Real Estate
Professional Services
Education
Media
Entertainment
Hospitatlity
Tourism
Agriculture
Food Production
Government & Public Sector
Environmental
Sustainability
Use Case
Upgrade to SlideStart
Pro
Instant access to 40+ advanced filters
Sales and Business Development
Mergers and Acquisitions
Corporate Finance and Valuation
Performance Metrics and KPIs
Client Case Studies
Competitive Landscape
Product and Service Analysis
Customer and Market Segmentation
Organizational Structure
Human Resources and Talent Management
Industry Overview
Regulatory and Compliance
Risk Assessment and Management
Agriculture & Food Production
Hospitality and Tourism
Government
Environmental
Sustainability
Clear all
Thank you! Your submission has been received!
Oops! Something went wrong while submitting the form.
Show Featured Only
Checkbox 8
Companies
Mckinsey
Bain
BCG
EY
Deloitte
Accenture
PwC/Strategy&
JP Morgan
Goldman Sachs
Morgan Stanley
Citigroup
Deutsche Bank
Barclays
LEK
Kearney
Oliver Wyman
Booz Allen Hamilton
Gartner
IPSOS
Nielsen
Slide type
Text Only
Linear Flow
Vertical Flow
Single Chart
Header Horizontal
Mixed Chart
Header Vertical
Pillar
Multiple Chart
Graphic
Agenda
Title
Table
Framework
Industry
Technology
Healthcare
Financial Services
Consumer Goods
Energy & Utilities
Manufacturing
Retail
E-commerce
Logistics
Telecommunications
Real Estate
Professional Services
Education
Media
Entertainment
Hospitatlity
Tourism
Agriculture
Food Production
Government & Public Sector
Environmental
Sustainability
Use Case
Sales and Business Development
Mergers and Acquisitions
Corporate Finance and Valuation
Performance Metrics and KPIs
Client Case Studies
Competitive Landscape
Product and Service Analysis
Customer and Market Segmentation
Organizational Structure
Human Resources and Talent Management
Industry Overview
Regulatory and Compliance
Risk Assessment and Management
Agriculture & Food Production
Hospitality and Tourism
Government
Environmental
Sustainability
Clear all
Thank you! Your submission has been received!
Oops! Something went wrong while submitting the form.
Tag
View slide
Features a projection column chart from 2022 to 2025 with strategic growth measures listed beside it. The slide uses a simple, clean design with blue and white tones.
Investment Analysis
Financial Services
Projects future revenue targets for Deutsche Bank, detailing strategic initiatives across various divisions to drive growth.
Revenue, projections, Deutsche Bank, strategy, growth, 2025, financial targets, divisions
false
Revenues planned to reach ~€ 30bn by 2025 10 Note: RM – relationship manager; for footnotes refer to slides 29 and 30 In € bnClient & Creditor Overview July 2023
Mixed Chart
Deutsche Bank
View slide
Diagram and text outlining IT functional vacancy rates over time. Specific IT vacancies are highlighted in an organizational chart.
Human Resources and Talent Management
Technology & Software
Analysis of IT functional vacancy rates within NH DHHS, showing increased vacancies impacting strategic decision-making and planning, especially during COVID-19.
IT Vacancies, DHHS, Staffing, Organizational Chart, COVID-19
false
Staffing Review | Vacancies | ITNH DHHS Operations Assessment
Header Horizontal
Alvarez & Marsal
View slide
Slide features detailed tables and column charts comparing quarterly financial results, with a focus on revenue, expenses, and profit margins across various banking sectors.
Financial Performance
Financial Services
Highlights financial results for Q3 2023, showing changes in revenue, costs, and profits. It notes significant financial dynamics and sector-specific performances within Deutsche Bank.
quarterly results, financial review, banking, revenue, profit
false
Q3 2023 highlights In € bn, unless stated otherwiseQ3 2023 results
Mixed Chart
Deutsche Bank
View slide
A pie chart and bar graphs with percentages in shades of purple. The slide focuses on Australian users' preferences for the nbn™ network over mobile data for internet connection.
Market Analysis and Trends
Telecommunications
It shows a consumer survey's findings on preferences for internet access at home, with a majority favoring the nbn™ network over mobile data for its reliability, affordability, and speed.
Internet, Survey, Preferences, Home Connection, nbn™, Mobile Data, Reliability, Affordability, Speed, Australia
false
Australians surveyed prefer to connect to the internet at home via the nbn network rather than mobile alternativesAccenture Consumer Value Report 2021
Multiple Chart
Accenture
View slide
This slide features a tripartite layout with three content blocks, each with an icon, title, and bullet points describing strategies for increasing recurring revenues. The layout is balanced with equal spacing and a minimalist design.
Strategic Planning
Financial Services
The slide details strategies to increase recurring revenues, focusing on property management business, global corporate services, and investing in predictable businesses. It's aimed at stakeholders interested in understanding and evaluating the company's growth strategies and potential for scaling.
Recurring Revenues, Strategy, Property Management, Global Services, Investment
false
How We Expect to Further Increase Recurring RevenuesFixed Income Investor Presentation for Goldman Sachs Annual Leveraged Finance & Credit Conference
Pillar
Goldman Sachs
View slide
The slide contains a mix of text and icons describing primary end markets, demand drivers, and outlook for the waste and recycling segment.
Market Analysis and Trends
Environmental Services & Sustainability
It details the resilience of the waste and recycling segment against commercial volume reduction, highlighting residential, commercial, and industrial demand.
Waste, recycling, demand, commercial, residential, industrial, segment, outlook, primary markets
false
Waste and recyclingsegment has not been significantly affected despite commercial volume reduction and lower recycling ratesEnvironmental Services Outlook
Table
LEK
View slide
The slide presents text descriptions of the key advantages of P2G, supported by a bar chart showing 2050 P2G potential in TWh for France.
Technology and Digital Transformation
Energy & Utilities
This slide discusses the benefits of Power-to-gas (P2G) for integrating renewable energy into the electricity grid. It highlights advantages like energy storage and transport, and projects P2G potential for the year 2050.
P2G, renewable energy, electricity grid, energy storage, 2050 potential
false
P2G has been identified as a tool to enable high penetration of renewable on the electricity gridHydrogen applications and business models
Mixed Chart
Kearney
View slide
Horizontal bar chart displaying percentage of people who experienced or witnessed gender discrimination-related scenarios. Gender breakdown included. Left-aligned narrative explains key findings.
Risk Assessment and Management
Government & Public Sector
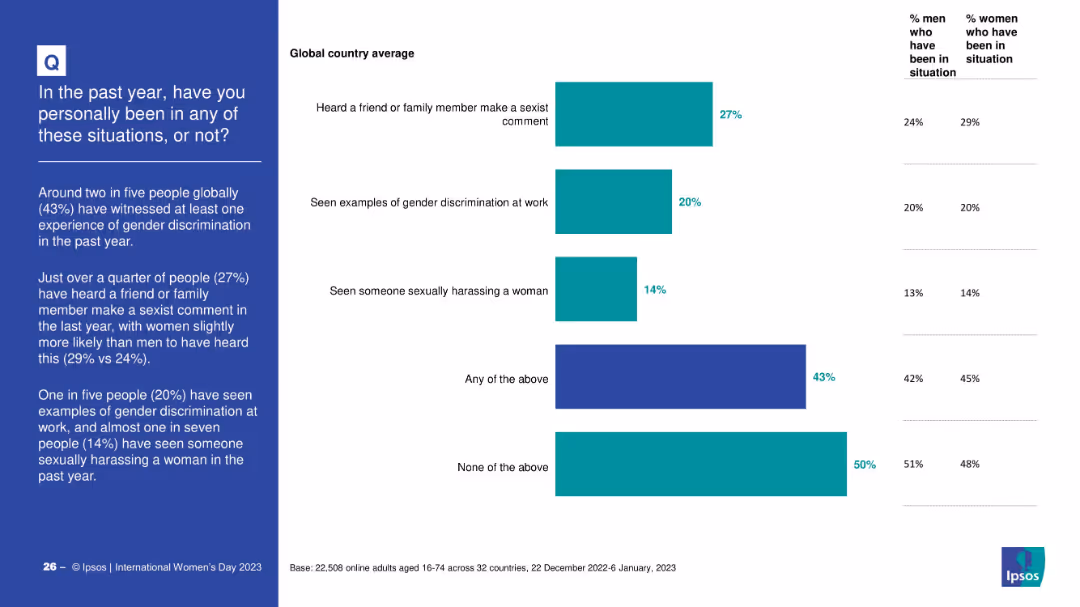
This slide reports global statistics on firsthand experiences of gender discrimination, including sexist comments, workplace discrimination, and sexual harassment. It notes a 43% incidence rate for any of these experiences and provides gender-specific comparisons.
gender bias, workplace discrimination, sexual harassment, global average, social behavior, lived experiences
false
Witnessing Gender Discrimination – Global OverviewINTERNATIONAL WOMEN'S DAY 2023
Mixed Chart
IPSOS
View slide
The slide presents a comparative analysis using a two-tiered list with "Key Contributors of Success" and factors leading to failure, distinguished by green checkmarks and red crosses.
Market Analysis and Trends
Financial Services
This slide compares the elements contributing to the success and failure of partnerships, with a focus on long-term success factors and mutual interests.
partnerships, success factors, long-term, comparative, mutual interest
false
Critical Success Factors of PartnershipsHow Fintech has changed the Financial Services Industry
Text Only
Citigroup
View slide
The slide features a list layout with iconography for different industries like Aircraft monitoring and Surgical robotics.
Client Case Studies
Transportation & Logistics
Highlights Ford's patents being cited across industries from agriculture to biopharma with specific examples of applications.
Ford, innovation, patents, industries, agriculture, biopharma
false
Ford’s IP is supporting innovation across industriesThe Economic Impact of Ford and the F-Series
Boxed
BCG
View slide
Features a combination of column charts and text, comparing IFRS and US GAAP credit loss expenses. The layout is moderately complex with detailed data comparisons.
Regulatory and Compliance
Financial Services
The slide compares credit loss expenses and allowances under IFRS and US GAAP, highlighting differences in financial impact, useful for compliance and financial reporting.
Credit, Loss, Comparison, IFRS, GAAP
false
Comparing credit loss expense and allowances under IFRS and US GAAPFirst quarter 2020 results
Mixed Chart
UBS
View slide
This slide contains column charts and bullet points. Charts illustrate the growth in security data processed, application vulnerability scanning, and devices secured from 2019 to 2022. The color scheme is teal and dark blue, with each point accompanied by a relevant icon.
Financial Performance
Financial Services
Details the bank's cybersecurity measures and investments, underscoring consistent efforts despite increased demand and evolving threats.
Cybersecurity, Risk Management, Technology, Data Protection, Financial Services, Investment, Device Security
false
We have maintained consistent cybersecurity investment through a dynamic threat and regulatory environmentGlobal Technology
Multiple Chart
JP Morgan
View slide
Two-part layout: left side features a bar chart comparing supermarket vs. online shopper willingness to pay more for sustainability across product categories, with numeric labels and color-coded bars; right side has a dark blue background with bold white and blue text summarizing insights and a German flag icon.
Customer and Market Segmentation
Retail & E-commerce
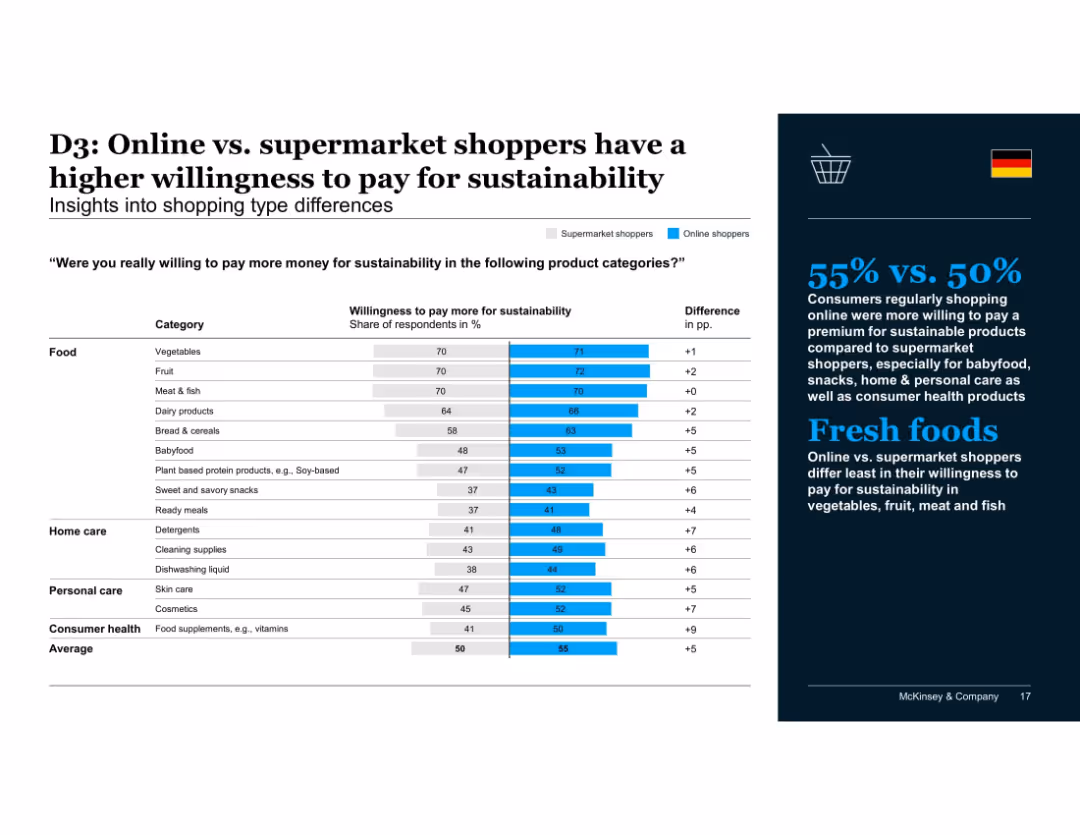
Highlights that online shoppers show greater willingness to pay for sustainability than supermarket shoppers in categories such as babyfood, snacks, and personal care, with less difference for fresh food categories like meat, fruit, and vegetables.
sustainability, online shopping, supermarkets, consumer behavior, willingness to pay, food categories, fresh produce, babyfood, personal care, market segmentation
false
D3: Online vs. supermarket shoppers have a higher willingness to pay for sustainabilityConsumers' sustainability sentiment and behavior before, during and after the COVID-19 crisis
Mixed Chart
McKinsey
View slide
The slide has a detailed summary text on the left, with two small bar charts on the right showing IPO proceeds and activity in Q4 2022. The layout is text-heavy with supporting visuals in grey and red for data highlights.
Market Analysis and Trends
Financial Services
This slide summarizes the record IPO activity in the MENA markets during Q4 2022. It highlights key IPOs, total proceeds, and changes compared to previous quarters. It includes a detailed narrative of notable IPOs and market performance, supported by visual data on proceeds and activity.
IPO, MENA markets, financial services, market trends, quarterly summary, IPO activity, proceeds, financial data, market analysis, investment
false
MENA IPO market summary: record IPO activity during Q4 2022 across MENA markets2022: a record year for MENA IPOs
Mixed Chart
EY
View slide
A world map displaying various countries highlighted in purple, with equity yield percentages annotated next to each country. The layout is clean with a central focus on the map.
Market Analysis and Trends
Financial Services
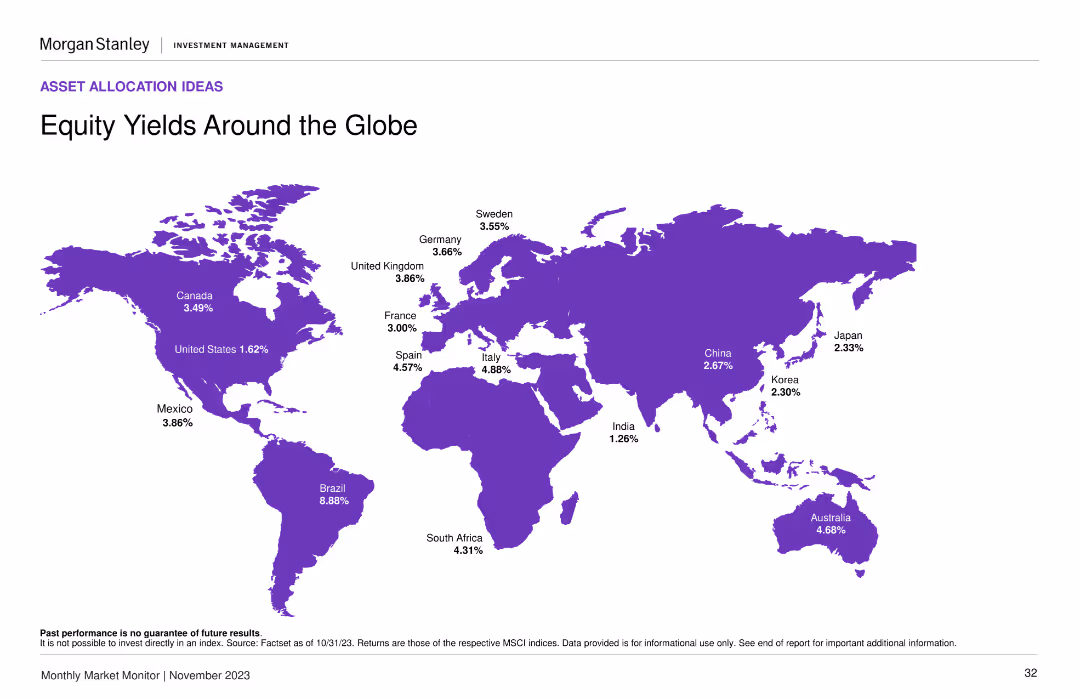
This slide provides a comparison of equity yields across different countries, showing investors where they might find the highest yields. Useful for global market analysis and investment decisions.
equity yields, global market, investment, countries, percentages
false
Equity Yields Around the GlobeMonthly Market Monitor November 2023
Graphic
Morgan Stanley
View slide
Slide includes line graphs comparing the total cost of ownership of BEVs against other vehicle types, showing the trend towards cost-effectiveness of BEVs.
Investment Analysis
Transportation & Logistics
Provides a financial analysis on the cost-competitiveness of battery electric vehicles over time, useful for investors and companies planning transitions in vehicle fleets.
BEVs, cost analysis, electric vehicles, TCO, automotive economics, investment
false
‘Tipping point’ for TCO right around the corner for midsized carsWhat if all vehicles were electric?
Single Chart
BCG
View slide
Bar chart showing various categories of government operational expenditures, including personnel, services, and interest payments. The values are provided alongside each bar.
Financial Performance
Government & Public Sector
Slide breaks down the operational expenditure of the government, useful for understanding where funds are allocated within different administrative areas.
operational expenditure, government budget, financial analysis
false
2023/24 Annual Budget Speech: Operational ExpenditureDissecting the 2023/24 Annual Budget Speech
Single Chart
PwC/Strategy&
View slide
Slide contains three column charts showing growth in wealth management relationships, travel sales volume, and business banking clients from 2019 to 2022. The graphics are highlighted with arrows and percentage increase markers. The layout is clean and uses a blue color scheme to convey financial stability and trust.
Financial Performance
Financial Services
Analyzes investments across different business lines, showing growth in client relationships and sales volumes. It's likely used for illustrating the company's investment strategies' effectiveness and identifying areas of successful expansion and opportunities for further growth.
Investments, Wealth Management, Commerce, Business Banking, Client Relationships, Sales Volume
false
We are investing across our lines of business to serve more of our client needsInverstors Day 2023
Multiple Chart
JP Morgan
View slide
Slide displays a bar chart with blue bars, listing percentages of VC interest in Web3 areas. Accompanied by quotes on the right side against a gray backdrop. The chart is a column chart, not a bar chart.
Investment Analysis
Technology & Software
Focuses on the growing interest in Web3 sectors among VCs, showing the percentage of VCs investing in areas like privacy, DeFi, and blockchain, with expectations for the future.
Web3, venture capital, investment, privacy, DeFi, blockchain, DAOs, Metaverse, crypto, NFTs
false
Though nascent, venture capital interest in Web3 themes is growinge-Conomy SEA 2022 Through the waves, towards a sea of opportunity
Single Chart
Bain
View slide
Diagram of agile principles and their impact on management, with color-coded sections and descriptive text.
Operational Efficiency
Professional Services
Details how agile methodologies influence manager and team dynamics, focusing on alignment, trust, and transparency, beneficial for implementing agile practices in companies.
agile methodology, team dynamics, management efficiency, organizational change, professional services, alignment, trust, transparency
false
Some companies have found this guidance in agile - its principles resonate well with emerging aspirationsBCG – IPSOS study
Diagram
BCG
View slide
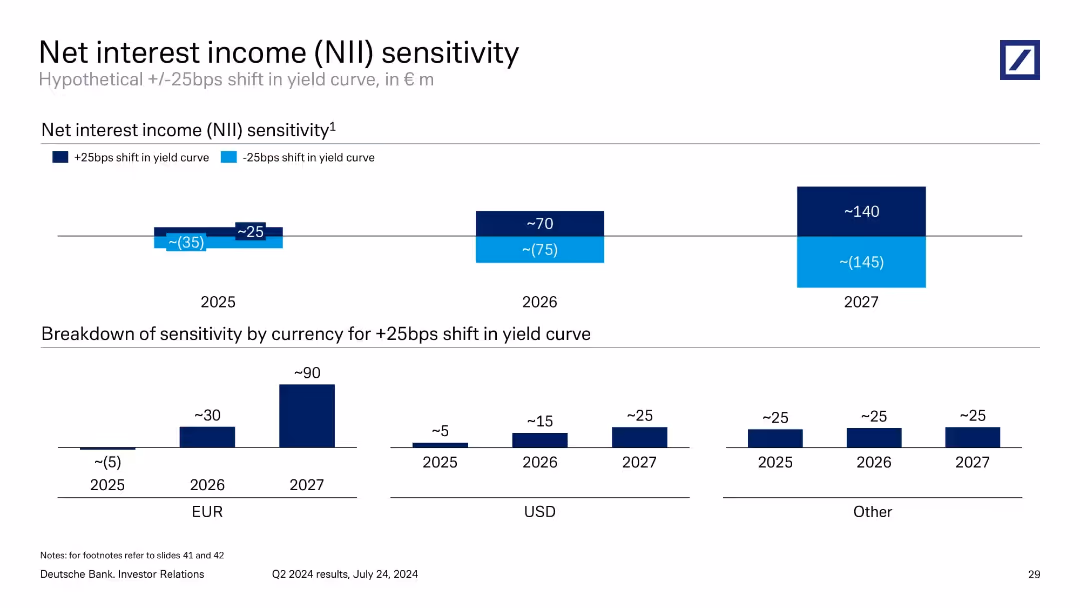
Dual-chart layout: one showing NII sensitivity to ±25bps shift in yield curves, the other breaking down by currency. Text highlights strategic measures to reduce sensitivity.
Risk Assessment and Management
Financial Services
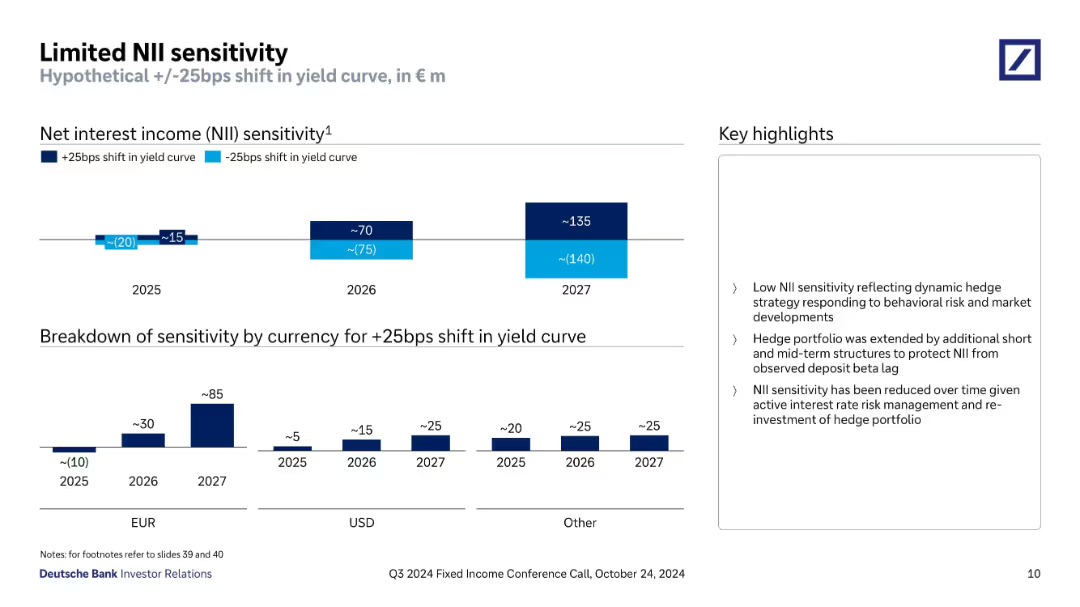
Illustrates the bank’s limited sensitivity to yield curve shifts due to dynamic hedge strategies. Outlines currency-level exposure and notes structural hedge re-investments that have reduced potential volatility in net interest income.
NII sensitivity, interest rates, yield curve, hedge strategy, EUR/USD exposure, 2025–2027, beta lag
false
Limited NII sensitivityQ3 2024 Fixed Income Investor Conference Call
Multiple Chart
Deutsche Bank
View slide
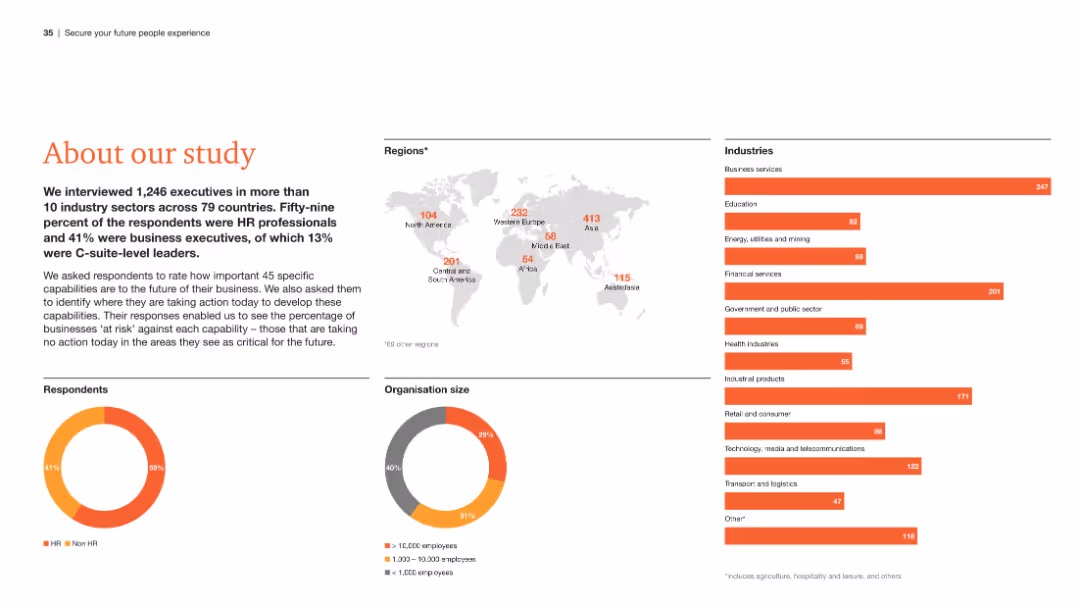
The slide presents an overview of the study, including a world map showing respondent distribution, pie charts of respondent roles and organization sizes, and a list of industries surveyed.
Strategic Planning
Professional Services
This slide provides a summary of the study's scope, detailing the demographics of respondents, the regions and industries covered, and the roles of the participants.
Study overview, respondent demographics, regions, industries, roles
false
About our study We interviewed 1,246 executives in more than 10 industry sectors across 79 countriesSecure your future people experience Five imperatives for action
Multiple Chart
PwC/Strategy&
View slide
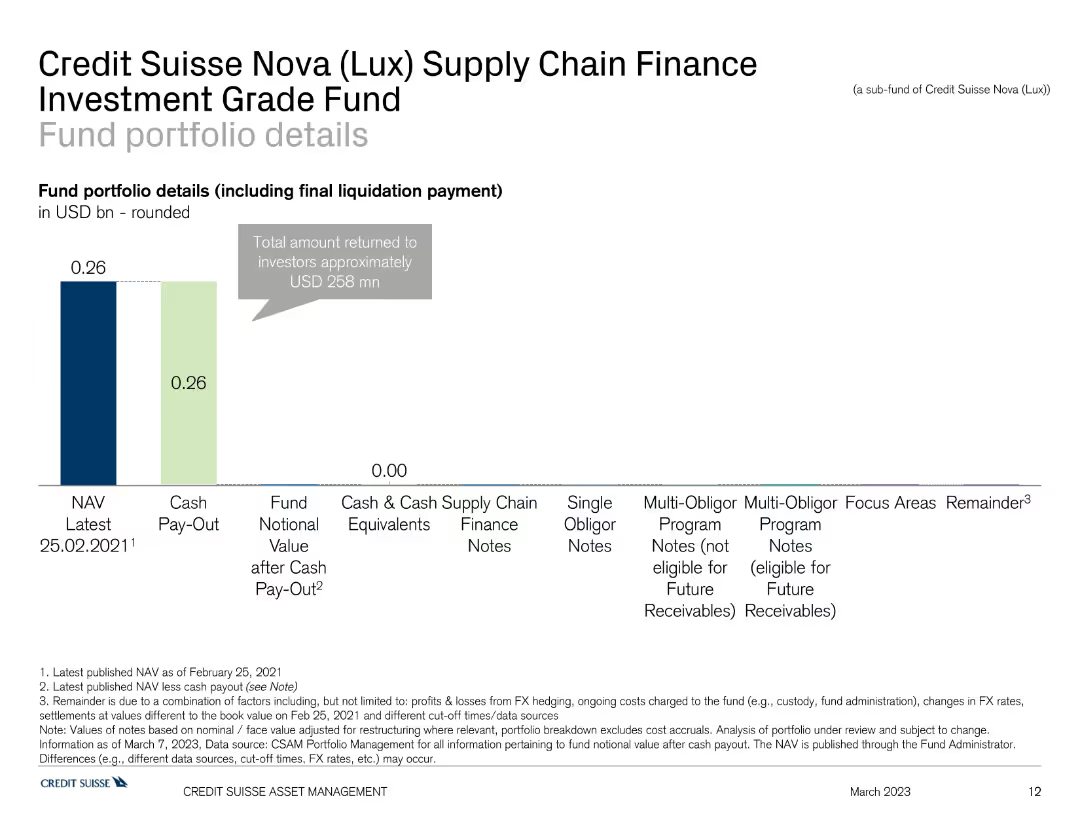
This slide shows a bar chart detailing the fund portfolio of the Credit Suisse Nova Supply Chain Finance Investment Grade Fund, with different sections indicating NAV, cash pay-out, and finance notes.
Investment Analysis
Financial Services
The slide provides an overview of the Credit Suisse Nova Supply Chain Finance Investment Grade Fund's portfolio, focusing on asset allocation and financial metrics. It is used for investment evaluation.
finance, supply chain, portfolio, Credit Suisse, investment grade
false
Credit Suisse (Lux) Supply Chain Finance FundCredit Suisse Nova (Lux) Supply Chain Finance Investment Grade FundSupply Chain Finance Funds (SCFF)
Single Chart
Credit Suisse
View slide
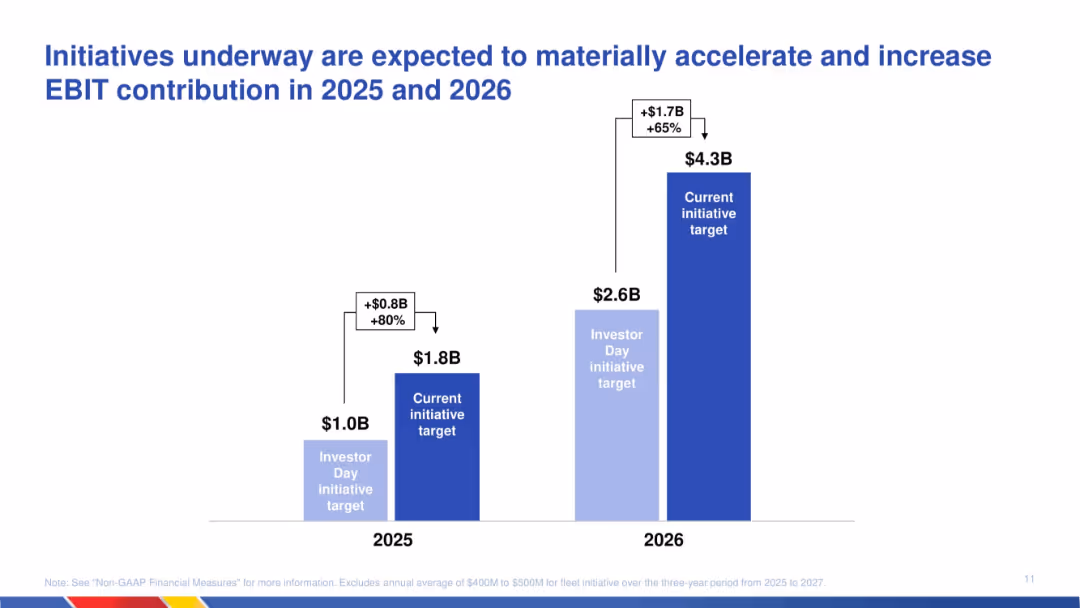
Column chart showing revised EBIT targets for 2025 and 2026; comparison of original and updated projections with labels for increase.
Strategic Planning
Transportation & Logistics
Communicates expected EBIT growth due to ongoing initiatives. The chart shows a material increase in EBIT targets for 2025 and 2026, emphasizing strategy execution effectiveness and operational uplift.
EBIT growth, initiatives, strategic plan, transportation, projections, acceleration, financial targets, operational improvement
false
Initiatives underway are expected to materially accelerate and increase EBIT contribution in 2025 and 2026J.P. Morgan Conference
Single Chart
JP Morgan
View slide
The slide shows column charts, bar graphs, and numerical key performance indicators. The design is streamlined with clear visual separation of sections.
Financial Performance
Financial Services
A comprehensive review of the digital financial services in Indonesia, including payment solutions and investment platforms, aimed at financial analysts or investors interested in the fintech sector.
financial services, Indonesia, fintech, investments, digital payments
false
DFS will maintain momentum towards 2025, with digital payments CAGR growing in the teens, and investment platforms accelerating by ~75% CAGRe-Conomy SEA 2022 Through the waves, towards a sea of opportunity
Multiple Chart
Bain
View slide
This slide compares benefits and challenges in two lists side by side. The benefits for businesses and economies are on the left, while the challenges are categorized into social, economic, and other issues on the right.
Market Analysis and Trends
Technology & Software
Discusses the benefits and challenges of technological advances, such as faster innovation and issues like job displacement, framing a discussion on managing technological impact.
technology impact, innovation, social challenges, economic benefits, job displacement, comparative analysis
false
So with huge benefits, some real challenges to addressA FUTURE THAT WORKS: AI, AUTOMATION, EMPLOYMENT, AND PRODUCTIVITY
Boxed
McKinsey
View slide
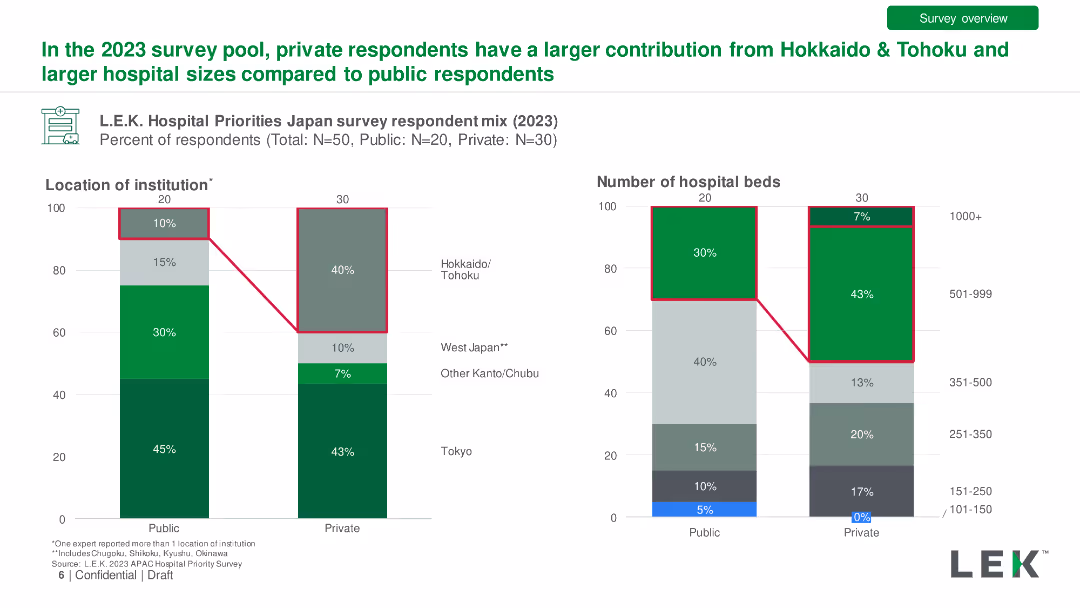
Bar charts comparing private vs. public hospital respondent mix by location and hospital size in 2023. Detailed with percentage differences.
Market Analysis and Trends
Healthcare & Pharmaceuticals
Comparison of survey responses from public and private hospitals, showing differences in regional representation and hospital sizes.
Private Hospitals, Public Hospitals, Respondents, Comparison, Location
false
In the 2023 survey pool, private respondents have a larger contribution from Hokkaido & Tohoku and larger hospital sizes compared to public respondentsJapan Hospital Insights Survey Findings Summary materials
Multiple Chart
LEK
View slide
Features a table listing financial figures and a textual explanation section. The design is clean with alternating shading for rows to enhance readability. The color scheme is consistent with the company's branding.
Financial Performance
Financial Services
Reviews key financial drivers over different time periods, useful for in-depth financial analysis and performance reviews. It assesses the contributions from different sectors to the overall financial results.
Income Statement, Financial Drivers, Net Operating Income, Banking, Asset Management
false
Income statement key driversGoldman Sachs 16thAnnual Australia and New Zealand Investment Forum
Table
Goldman Sachs
View slide
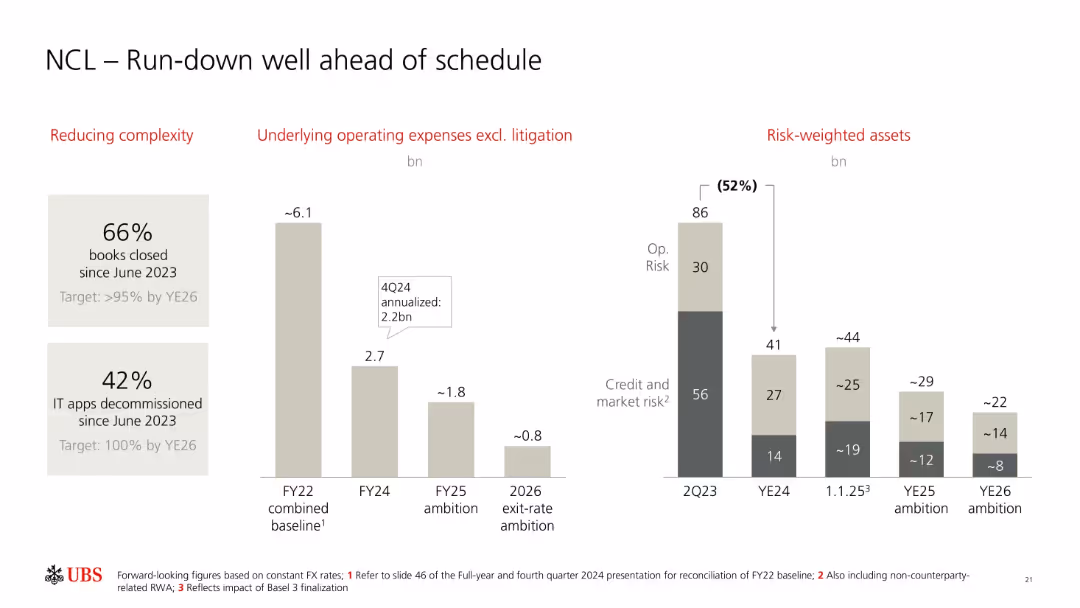
Three vertical bar chart sections showing complexity reduction, operating expenses, and RWA declines. Large numeric callouts and brief annotations.
Operational Efficiency
Financial Services
Highlights UBS’s progress in reducing non-core and legacy (NCL) complexity, operating expenses, and risk-weighted assets. Includes targets for FY25 and YE26 and progress on IT decommissioning and book closures.
UBS, NCL, run-down, complexity, RWA, operating expenses, FY25, YE26, decommissioning, risk management
false
NCL – Run-down well ahead of scheduleFull-year and fourth quarter 2024 Fixed Income investor presentation
Multiple Chart
UBS
View slide
A line chart displaying the integration cost as a percentage of cost synergies, with marked percentiles and a clear delineation of the median.
Financial Performance
Professional Services
Analyzes integration costs relative to annual synergies, providing a financial perspective on the cost-effectiveness of integration strategies.
integration, costs, synergies, financial analysis, cost-effectiveness
false
Integration costs are typically at the level of yearly synergiesHow to gain value from M&A
Single Chart
Deloitte
View slide
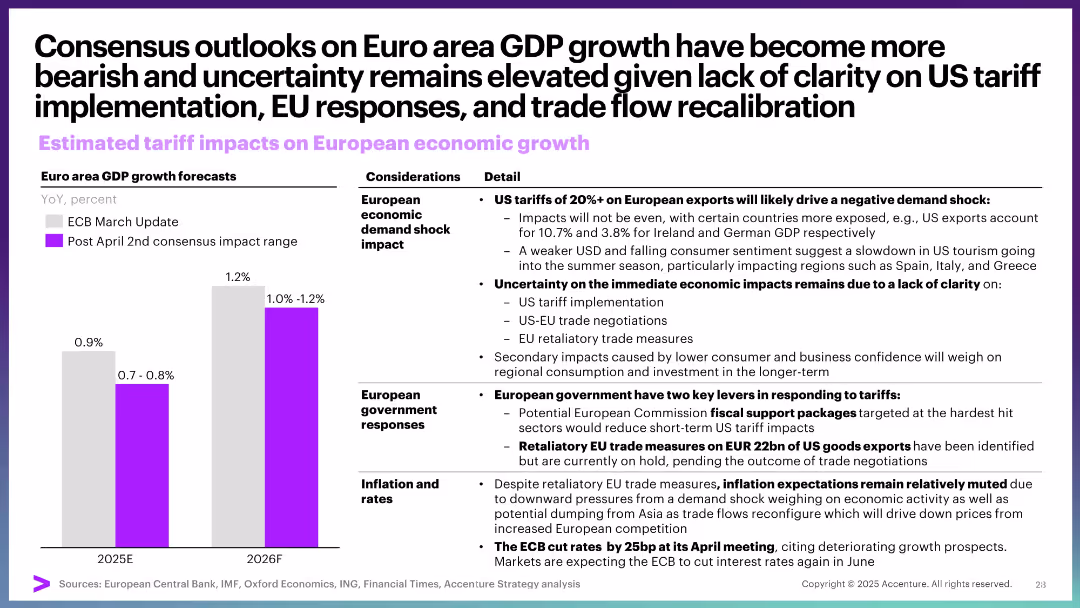
Bar chart for GDP forecasts; detailed text columns on economic shock, EU responses, and inflation. Structured layout.
Market Analysis and Trends
Government & Public Sector
This slide covers expected negative effects of US tariffs on EU economic growth, emphasizing demand shock, lack of clarity on implementation, and EU response options. Inflation expectations remain muted due to broader economic weakening.
Eurozone, GDP, tariffs, economic growth, inflation, trade negotiation, EU response
false
Consensus outlooks on Euro area GDP growth have become more bearish and uncertainty remains elevated given lack of clarity on US tariff implementation, EU responses, and trade flow recalibrationApril Macro Brief: Special edition Tariff distress
Mixed Chart
Accenture
View slide
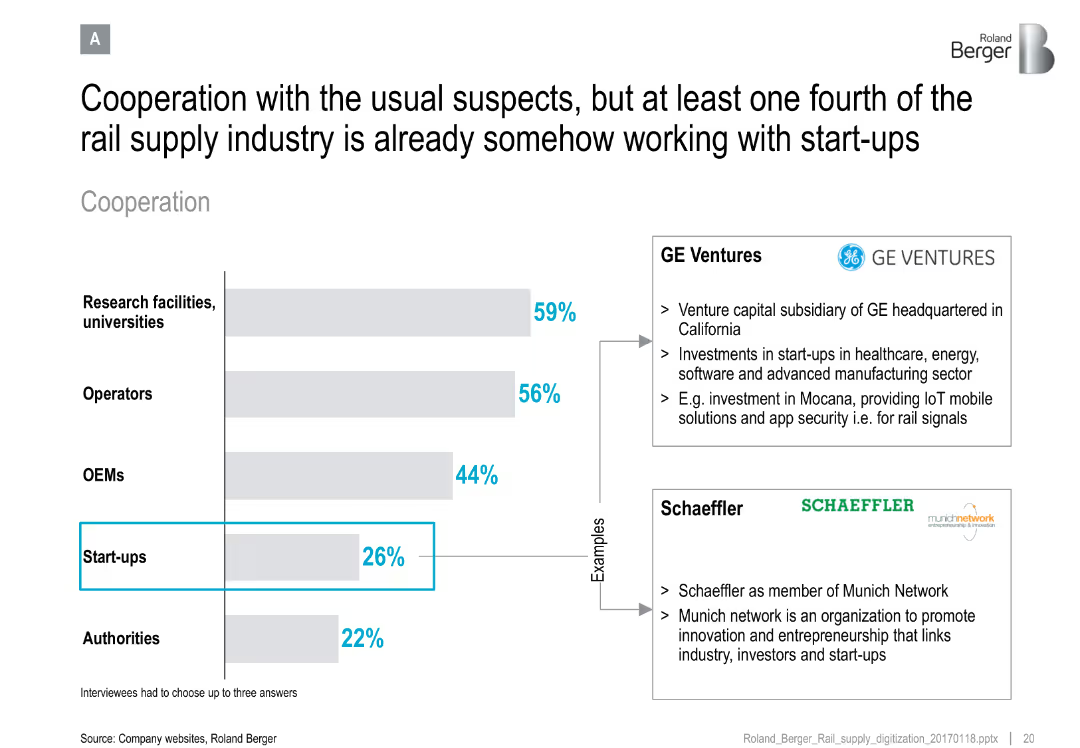
Horizontal bar chart of cooperation partners; side notes with examples (GE Ventures, Schaeffler)
Strategic Planning
Transportation & Logistics
Demonstrates the rail supply industry's cooperation landscape, noting that startups are emerging partners alongside universities, OEMs, and operators. Provides real-world examples of collaboration.
rail industry, cooperation, startups, innovation, GE Ventures, Schaeffler, ecosystem, collaboration strategy
false
Cooperation with the usual suspects, but at least one fourth of the rail supply industry is already somehow working with start-upsRail supply digitization
Mixed Chart
Roland Berger
View slide
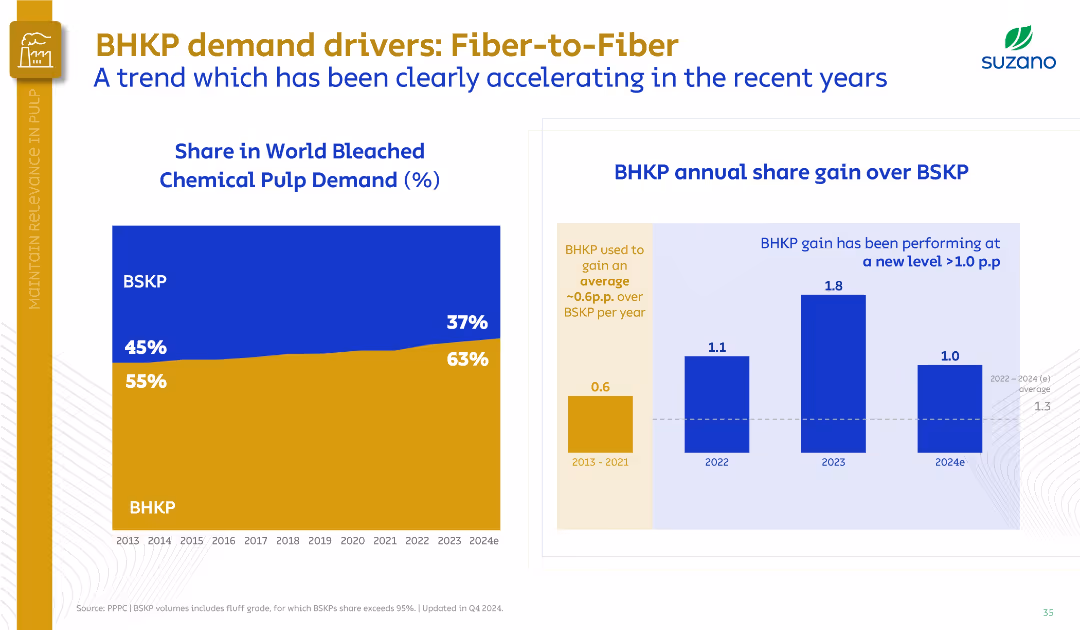
Left graph shows BHKP vs. BSKP share trend; right bar chart compares share gain. Uses a dual-panel data layout.
Market Analysis and Trends
Industrial & Manufacturing
The slide shows BHKP’s growing share in world pulp demand from 55% in 2013 to 63% in 2024, surpassing BSKP. Highlights increasing annual gains, particularly post-2022, signaling a market shift to hardwood pulp.
BHKP, BSKP, market share, demand growth, pulp, Suzano, fiber substitution
false
BHKP demand drivers: Fiber-to-FiberGoldman Sachs Brazil Commodities Days
Multiple Chart
Goldman Sachs
View slide
Two comparative area charts show the risk premia components for South American Chemicals Company using Morgan Stanley’s SICR Analysis vs. traditional analysis methods.
Strategic Planning
Financial Services
The slide explains the decomposition of risk premia into US treasury, sovereign-induced corporate credit, and corporate spread over sovereign spread. Useful for strategic risk analysis.
risk premia, SICR, corporate credit, sovereign spread, analysis
false
EM CORPORATE CREDIT Our ApproachEmerging Markets Debt Monitor
Multiple Chart
Morgan Stanley
View slide
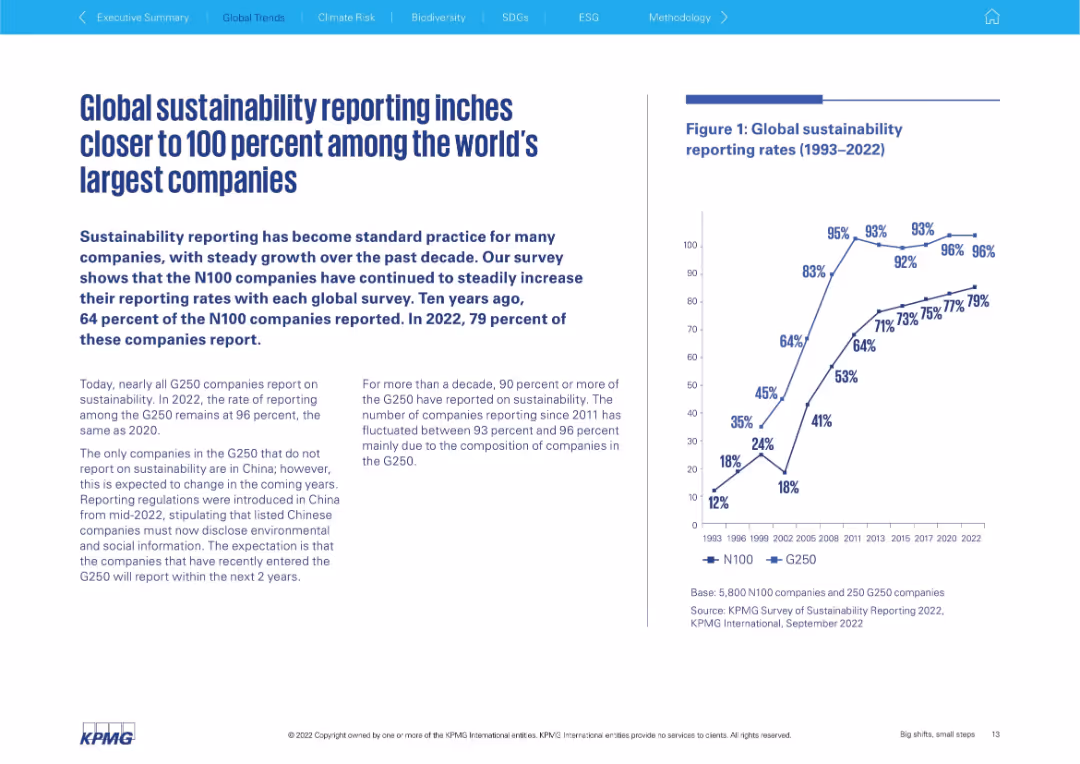
Bar and line chart showing global sustainability reporting rates; accompanying text elaborates on survey findings.
Market Analysis and Trends
Professional Services
Demonstrates growing global adoption of sustainability reporting among the world's largest companies, based on KPMG’s global surveys. Shows long-term trend from 1993 to 2022, with reporting rates climbing steadily toward 100%. Discusses regional and sector differences, especially the role of regulation in driving disclosure.
sustainability reporting, trends, ESG, corporate reporting, N100, G250, global survey, KPMG, compliance
false
Global sustainability reporting inches closer...Big shifts, small steps Survey of Sustainability Reporting 2022
Mixed Chart
KPMG
View slide
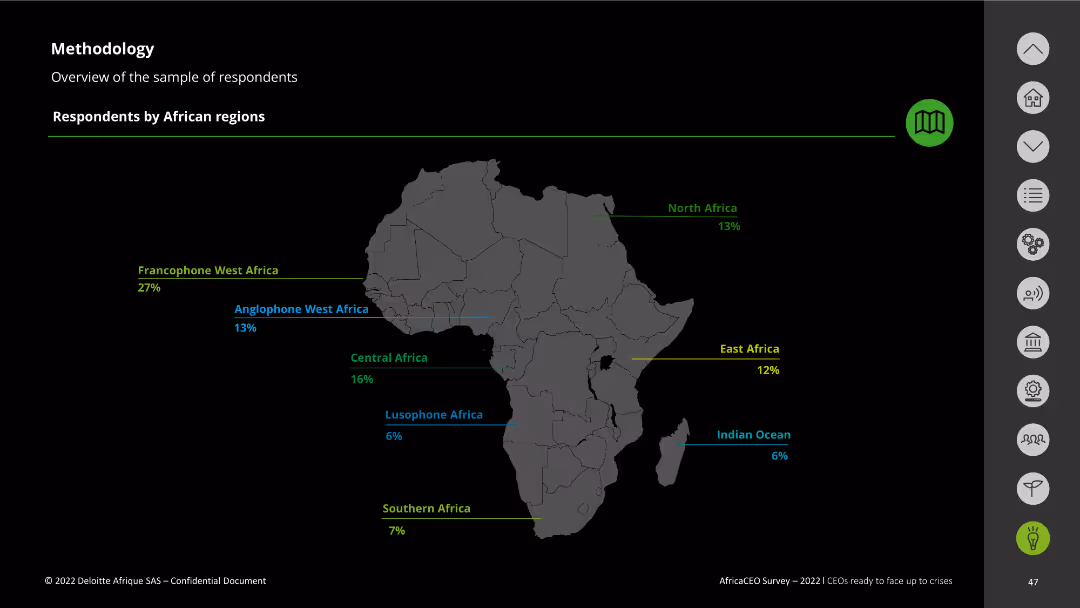
The slide features a map of Africa with regions highlighted and text describing respondents' distribution by African regions.
Strategic Planning
Professional Services
It gives a breakdown of survey respondents by African regions, providing context for the demographic distribution of the data collected.
respondents distribution, African regions, survey demographics, Africa CEO Survey
false
Methodology Overview of the sample of respondents Respondents by African regionsCEOs ready to face up to crises
Graphic
Deloitte
View slide
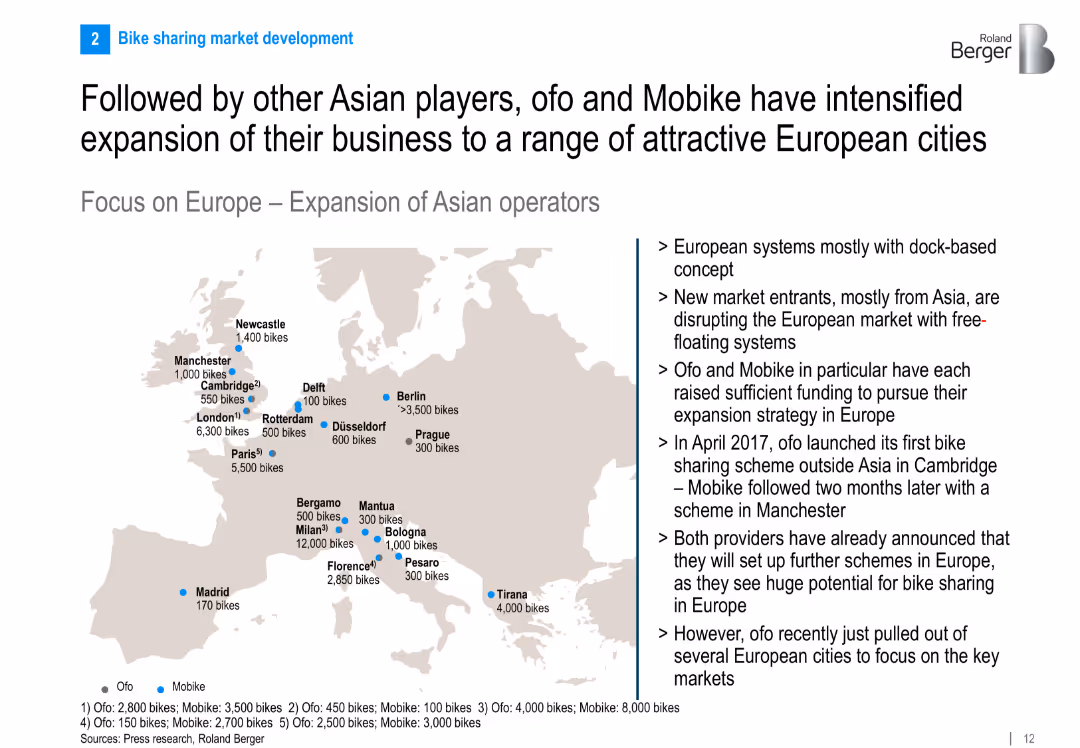
Map of Europe showing cities where Ofo and Mobike operate, with accompanying text on strategy and timeline of market entry.
Sales and Business Development
Transportation & Logistics
The slide outlines the expansion of major Asian bike sharing players into Europe. It maps out cities with Ofo and Mobike operations and discusses how these companies disrupted existing systems with dockless models and rapid scaling.
Ofo, Mobike, bike sharing, expansion, Europe, dockless, market entry, urban transport
false
Followed by other Asian players, ofo and Mobike have intensified expansion of their business to a range of attractive European citiesBike Sharing 5.0
Graphic
Roland Berger
View slide
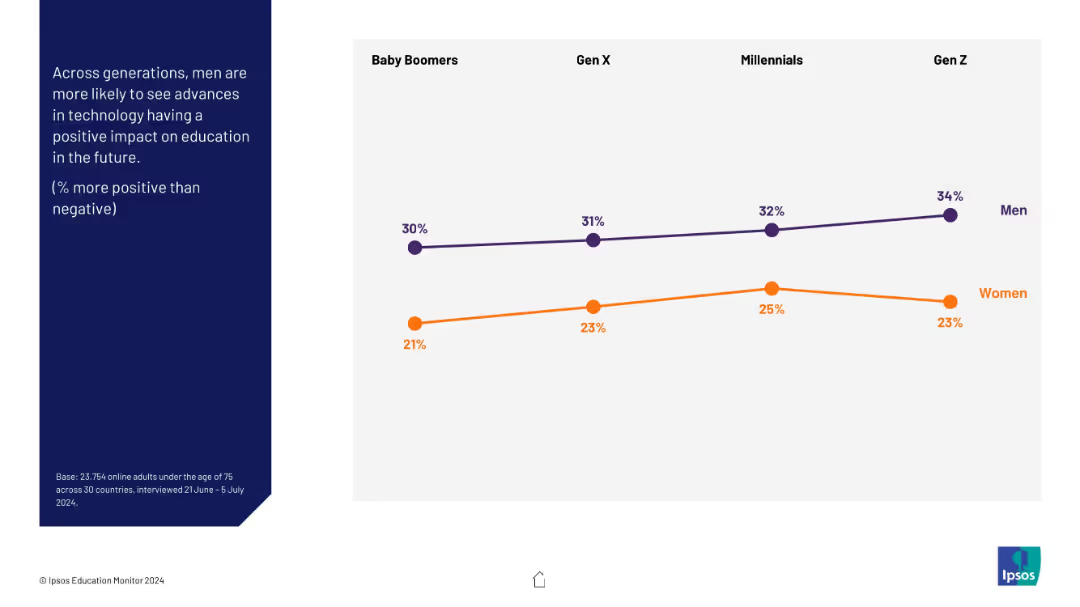
Line graph comparing men vs women across generations (Baby Boomers to Gen Z); question on left in blue
Market Analysis and Trends
Education & Training
The slide shows gender differences in optimism about technology’s impact on education. Men across all generations consistently show more optimism than women, with Gen Z men the most positive.
gender gap, perception, technology, education, AI, optimism, generations
false
(% more positive than negative)IPSOS EDUCATION MONITOR 2024
Mixed Chart
IPSOS
View slide
The slide shows a column chart on the left showing North American buyout deals and a text box on the right detailing representative deals. The color scheme is mainly blue and white, with text and graph elements.
Investment Analysis
Agriculture & Food Production
This slide provides a comprehensive overview of private equity investment focus within the agriculture industry's value chain from 2014-2016, highlighting specific deals and segments.
agriculture, private equity, investment, value chain, buyout deals, market segments
false
Agriculture industry overviewEY-Parthenon Perspectives: Investing in the agricultural crop industry
Single Chart
EY
View slide
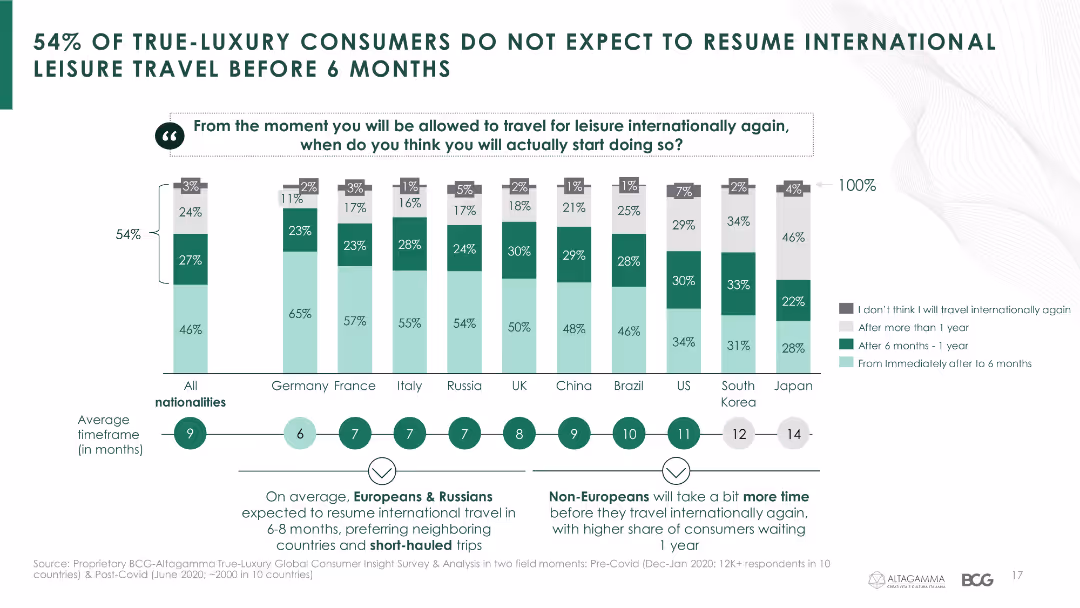
The slide features a column chart indicating the expected timelines for resuming international leisure travel among luxury consumers from various countries.
Market Analysis and Trends
Hospitality & Tourism
It provides insights into luxury consumers' expectations on when they will resume international travel, showing a significant delay due to the pandemic.
leisure travel, luxury consumers, travel expectations, COVID-19, international travel, country comparison
false
54% OF TRUE-LUXURY CONSUMERS DO NOT EXPECT TO RESUME INTERNATIONAL LEISURE TRAVEL BEFORE 6 MONTHSTrue-Luxury Global Consumer Insights 7th Edition
Mixed Chart
BCG
View slide
A vertical column chart showing hydrogen consumption by category. The categories include oil refining, ammonia production, steel production, methanol production, and others.
Market Analysis and Trends
Energy & Utilities
The slide highlights the hydrogen consumption by different industries, with a focus on chemicals, oil refining, and steel industries, presenting data from 2018.
hydrogen, consumption, industry, chemicals, oil refining, steel, market analysis, data, column chart
false
Hydrogen consumption by categoryHydrogen applications and business models
Single Chart
Kearney
View slide
The slide features two column charts. The first shows projected biofuel production costs from 2015 to 2045, comparing fossil fuels, 1st-gen biofuels, and advanced biofuels. The second chart shows biomethane production costs for energy crops, manure, and industrial waste.
Technology and Digital Transformation
Energy & Utilities
This slide compares the projected costs of biofuel and biomethane production, highlighting the economic challenges and opportunities driven by country regulations and improvements in production, collection, and transport efficiencies.
biofuel production cost, biomethane production cost, fossil fuels, 1st-gen biofuels, advanced biofuels, energy crops, manure, industrial waste
false
Biomass-tobiofuel/ gas is likely to remain more expensive than fossil fuels— opportunity driven by country regulationDeveloping sustainable carbon circularity Looking at advanced applications and business models
Multiple Chart
Kearney
View slide
A balanced layout featuring a pie chart on the right about self-assessed generative AI expertise and a column of text on the left. Color scheme is green and white.
Market Analysis and Trends
Technology & Software
Slide shows confidence among leaders in their organizations' generative AI expertise, with a pie chart visualizing the levels of self-assessed expertise across surveyed respondents.
Generative AI, Expertise, Confidence, Survey
false
Many leaders are confident about their organization’s generative AI expertise.Insights from the leading edge of generative AI adoption
Mixed Chart
Deloitte
View slide
The slide features three pie charts illustrating the survey results of over 25 local and foreign investors categorized by origin (foreign/local), fund size, and role (investment officer/manager, founder/CEO, partner/director).
Market Analysis and Trends
Financial Services
This slide captures investor outlook and priorities by surveying more than 25 investors, providing insights into their categories, fund sizes, and roles within the investment landscape.
investor survey, outlook, priorities, local, foreign, fund size, investment role
false
To capture investor outlook and priorities, we interviewed more than 25 local and foreign investorsIndonesia Venture Capital Outlook 2017
Multiple Chart
Kearney
View slide
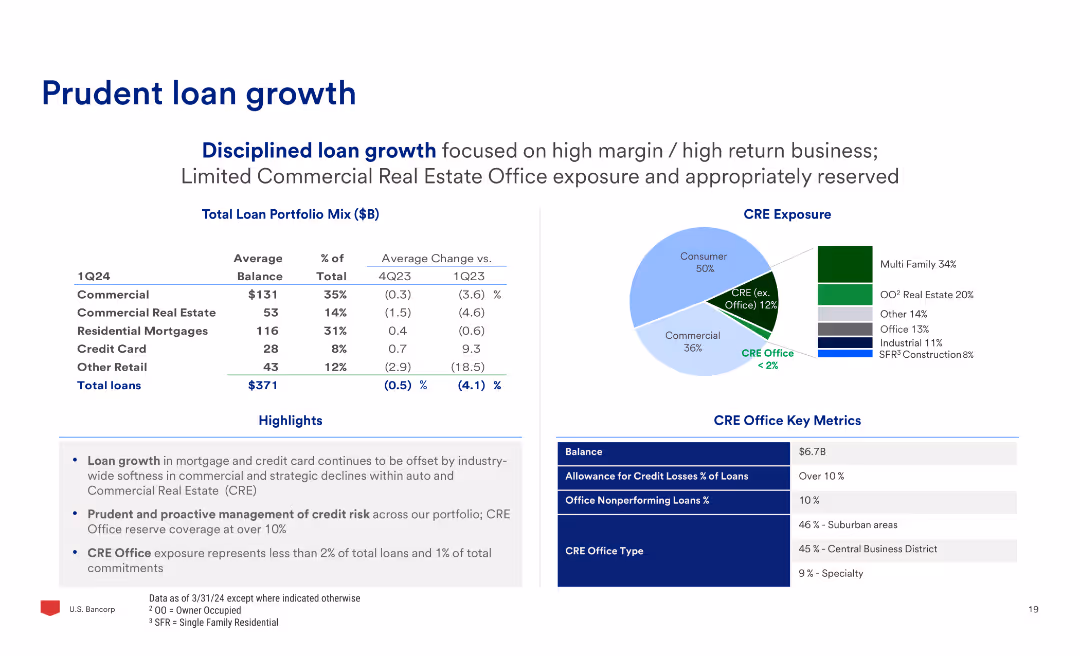
The slide features a table with loan portfolio mix and average changes, a pie chart of CRE exposure, and text highlights on loan growth and credit risk management.
Financial Performance
Financial Services
The slide discusses prudent loan growth, focusing on high-margin business, limited CRE office exposure, and proactive credit risk management, with detailed data on loan portfolio changes.
Loan, Growth, Portfolio, CRE, Risk, Management
false
Prudent loan growthBarclays Americas Select Franchise Conference 2024
Multiple Chart
Barclays
View slide
Moderate complexity with four column charts comparing funding in key sectors, accompanied by a comprehensive text explanation on the right side.
Market Analysis and Trends
Financial Services
Evaluates funding trends in mature and consolidated sectors, indicating a slowdown, and offers a detailed analysis of unicorn and other investments.
Funding, mature sectors, consolidation, slowdown
false
Funding in mature and consolidated sectors has slowede-Conomy SEA 2020 At full velocity: Resilient and racing ahead
Mixed Chart
Bain
View slide
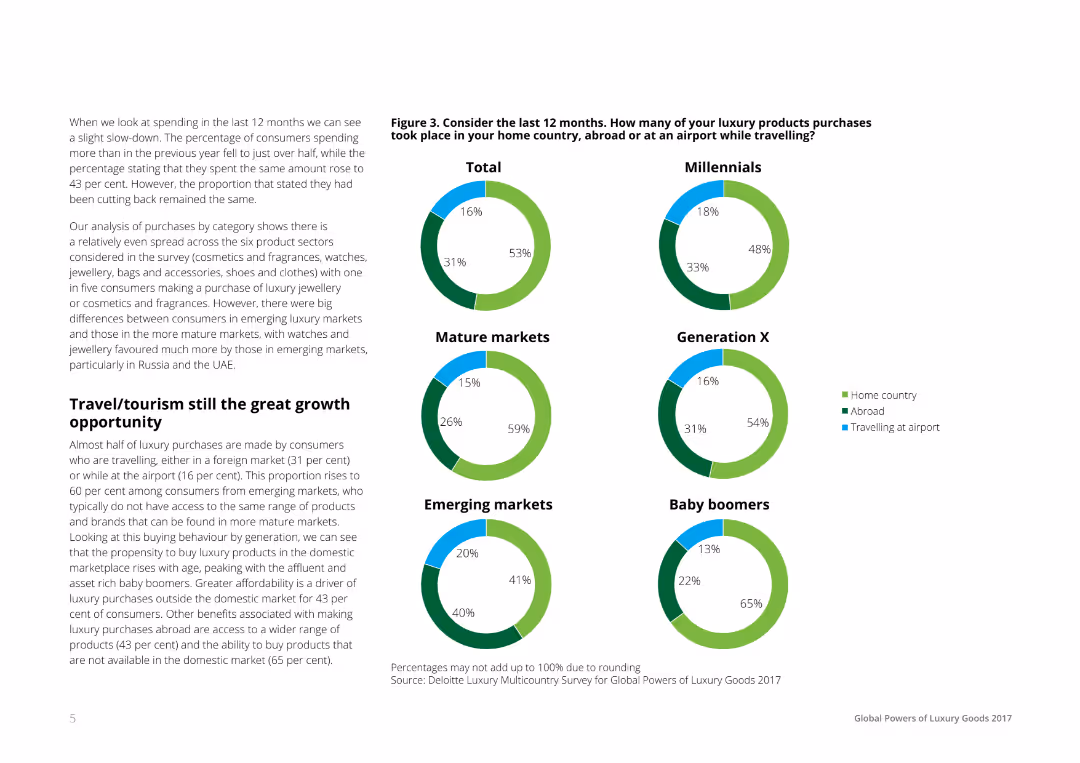
Textual analysis on the left with pie charts on the right, representing data on where luxury purchases took place: home country, abroad, or at the airport. Each pie chart is segmented and color-coded to represent different demographic groups.
Market Analysis and Trends
Hospitality & Tourism
The slide highlights the travel and tourism sector as a key growth area for luxury goods, presenting data on where consumers purchase luxury products, segmented by demographic groups such as Millennials, Generation X, and Baby Boomers.
Travel, Tourism, Luxury, Market, Growth
false
Figure 3. Consider the last 12 months. How many of your luxury products purchases took place in your home country, abroad or at an airport while travelling?Global Powers of Luxury Goods 2017 The new luxury consumer
Multiple Chart
Deloitte
View slide
Slide includes a column chart showing funding channels for ESG projects, like internal cash flow and green bonds. The chart is vertical and color-coded to differentiate between 2022 and 2023, indicating shifts in funding preferences over time.
Financial Performance
Environmental Services & Sustainability
Focuses on the financing strategies companies are adopting for ESG projects, particularly the increasing reliance on internal funding in response to higher interest rates and tighter credit markets. This shift underscores the practical aspects of funding sustainable initiatives amid broader economic pressures.
ESG, funding, finance, green bonds, 2023
false
More companies rely on internal cash flow to fund ESG activities amid higher interest rates and a tighter credit marketAFF 2023 HKTDC and PwC’s Joint Pulse Survey
Single Chart
PwC/Strategy&
View slide
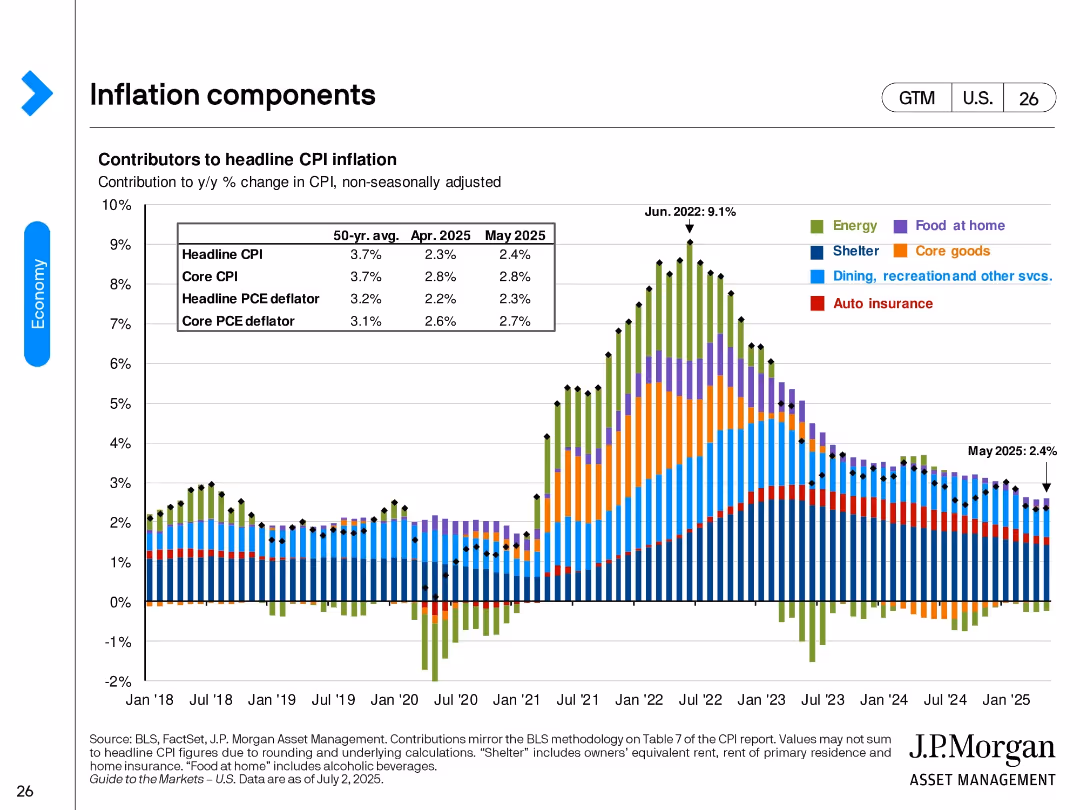
Vertical stacked bar chart showing monthly contributors to CPI inflation from 2018 to 2025. Each category (e.g., energy, shelter, food) is color-coded. A data box summarizes key inflation measures for April and May 2025.
Pricing Strategies
Financial Services
Breaks down CPI inflation by key categories over time. After peaking in mid-2022 (9.1%), inflation rates have moderated. By May 2025, headline CPI stands at 2.4%, with shelter remaining the largest contributor.
CPI, inflation, shelter, energy, core goods, food, consumer prices, May 2025, economic indicators
false
Inflation componentsGuide to the Markets U.S. 3Q 2025
Single Chart
JP Morgan
View slide
The slide showcases a line graph tracking global CO2 emissions, annotated with projections for future scenarios. The visual elements are effectively spaced, with clear labeling and contrasting colors to differentiate between historical and projected data.
Market Analysis and Trends
Environmental Services & Sustainability
It presents an analysis of the global gross energy-related CO2 emissions, including historical trends and future projections under various climate commitment scenarios. It illustrates the urgency and challenges of adhering to a 1.5°C pathway and the potential global impacts.
CO2 Emissions, Global Projections, Energy-Related, Net-Zero, Climate Commitments, 1.5°C Pathway, Historical Data, Future Scenarios
false
While net-zero commitments have been rising, the netzero equation is not solved todayThe net-zero transition
Single Chart
McKinsey
View slide
Line graph showing the yearly variance of NCDOT's cash balance from forecasts, marking a shift in FY19 with a detailed analysis of trends over time.
Regulatory and Compliance
Government & Public Sector
Analyzes the shift in cash balance variance for NCDOT in FY19, highlighting issues in fiscal management. Useful for government finance and policy analysis.
fiscal management, variance, government, NCDOT, trends
false
FY19 negative cash variance was a shift versus a pattern of increasing cash variancesBuilding a Best-in-Class DOT
Single Chart
McKinsey
View slide
Features concentric pie charts detailing the equity and CIE portfolios, with additional charts breaking down the data by geography and sector.
Investment Analysis
Financial Services
The slide presents the equity balance sheet for asset management, showcasing the distribution of investments by type, region, and sector. It's valuable for reviewing asset allocations and identifying trends in private equity investments.
Asset Management, Equity Balance, Private Equity, Real Estate, TMT, Healthcare, Consumer, Financials, Geography, Vintage, Sector Distribution
false
Asset Price: Asset Management Equity Balance SheetFixed Income Investor Presentation
Multiple Chart
Goldman Sachs
View slide
Combines text explanations with a bar chart showing ROI on various technologies
Technology and Digital Transformation
Financial Services
Analyzes the ROI of various technology investments within financial services, highlighting high returns on digital platforms.
technology investments, ROI, financial services, digital platforms
false
Firms see high returns on major tech investmentsBuilding a Future-Ready Investment Firm
Mixed Chart
Deloitte
View slide
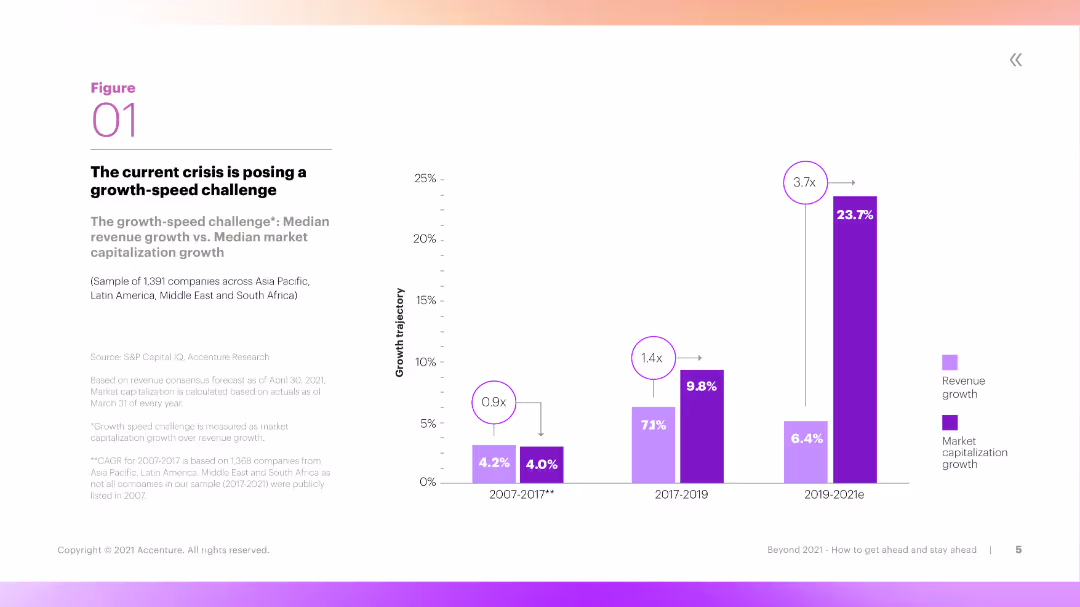
This slide features a column chart comparing median revenue growth and median market capitalization growth over three periods. The chart uses vibrant colors and clear labels to differentiate the data sets.
Market Analysis and Trends
Financial Services
The slide discusses the 'growth-speed challenge,' comparing revenue growth with market capitalization growth across three time periods. It highlights the challenges companies face in maintaining growth during crises.
Growth, Revenue, Market Capitalization, Crisis, Challenge
false
The current crisis is posing a growth-speed challengeBeyond 2021: How to Get Ahead and Stay Ahead
Mixed Chart
Accenture
View slide
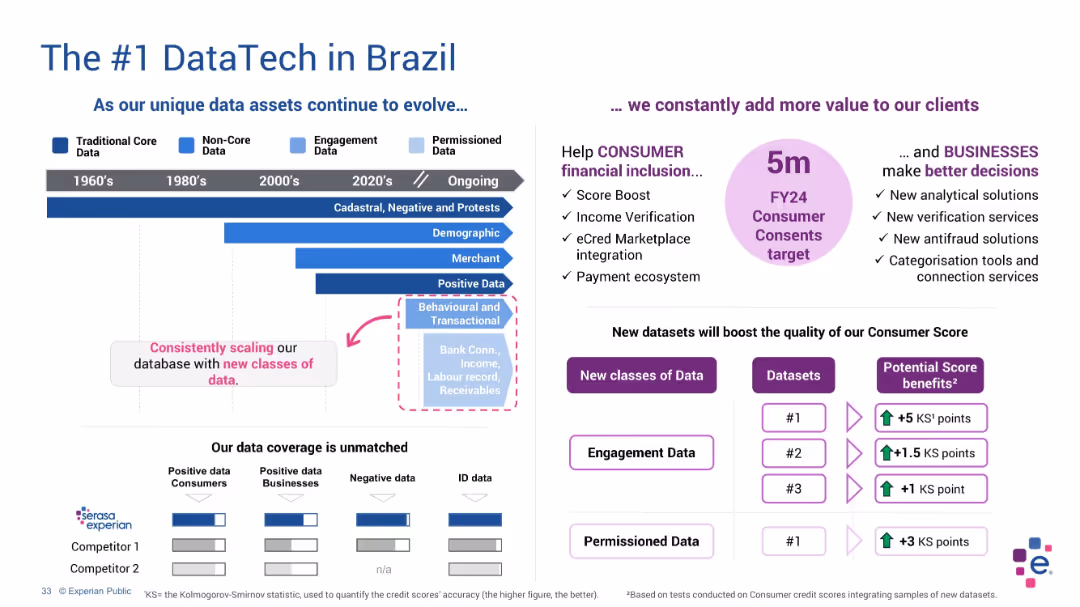
Horizontal timeline with evolving data types on the left, text highlights and comparison chart on right
Product and Service Analysis
Technology & Software
This slide emphasizes Experian’s evolution in Brazil from core to permissioned data. It details ongoing expansion in data classes and use cases such as fraud detection and credit scoring, with a comparison of competitors’ data capabilities.
Brazil, data evolution, Experian, ID data, permissioned data, analytics
false
The #1 DataTech in BrazilBarclays Credit Bureau Forum
Mixed Chart
Barclays
View slide
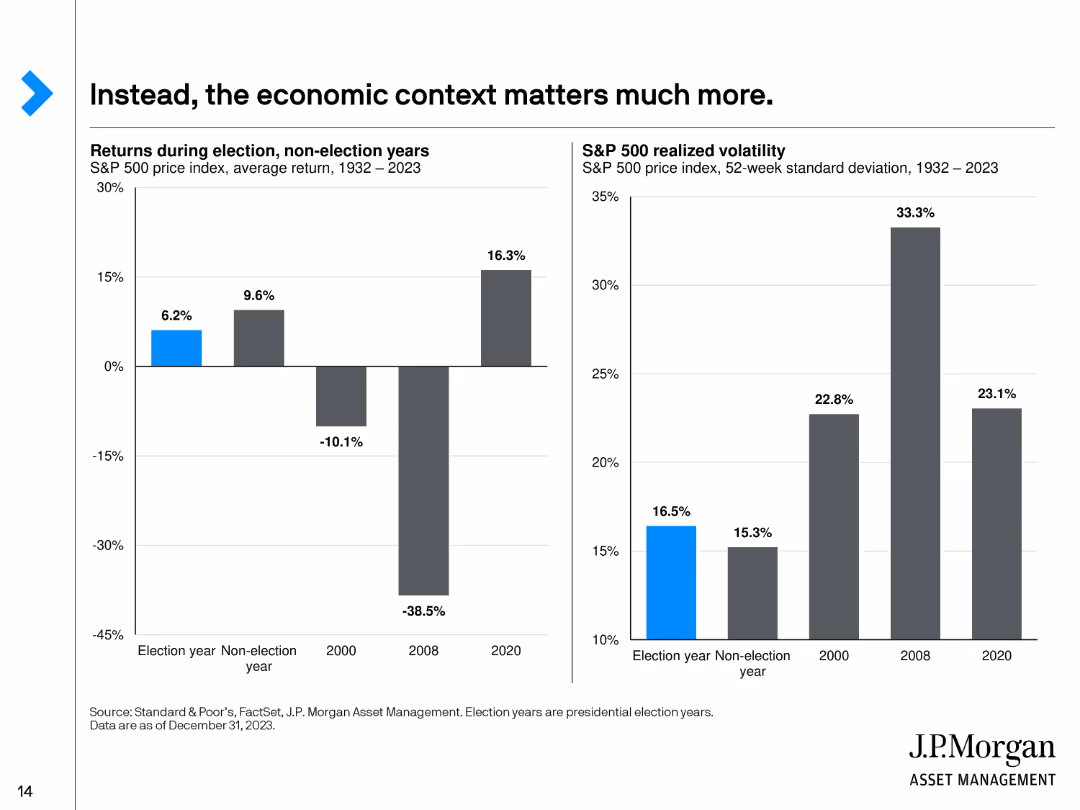
The slide displays two column charts: one showing returns during election and non-election years, and another showing S&P 500 realized volatility from 1932 to 2023.
Market Analysis and Trends
Financial Services
This slide highlights how economic context, rather than political events, significantly impacts market performance. It compares election year returns with non-election years and examines market volatility.
Economic Context, Election Years, Market Performance, Volatility, Analysis
false
Instead, the economic context matters much more.2024 Election
Multiple Chart
JP Morgan
View slide
The slide presents three scenarios (minimum, reference, and maximum scope) for hydrogen demand and related carbon impacts, using vertical column charts for each scope.
Strategic Planning
Energy & Utilities
The slide explores different scenarios for hydrogen demand by 2050, detailing the carbon impact and adjustments needed for each scope. It includes minimum, reference, and maximum scenarios, emphasizing the potential for reducing carbon emissions through hydrogen use.
hydrogen, scenarios, carbon impact, 2050, demand
false
Multiple scenarios have been developed with various carbon impactsHydrogen applications and business models
Mixed Chart
Kearney
View slide
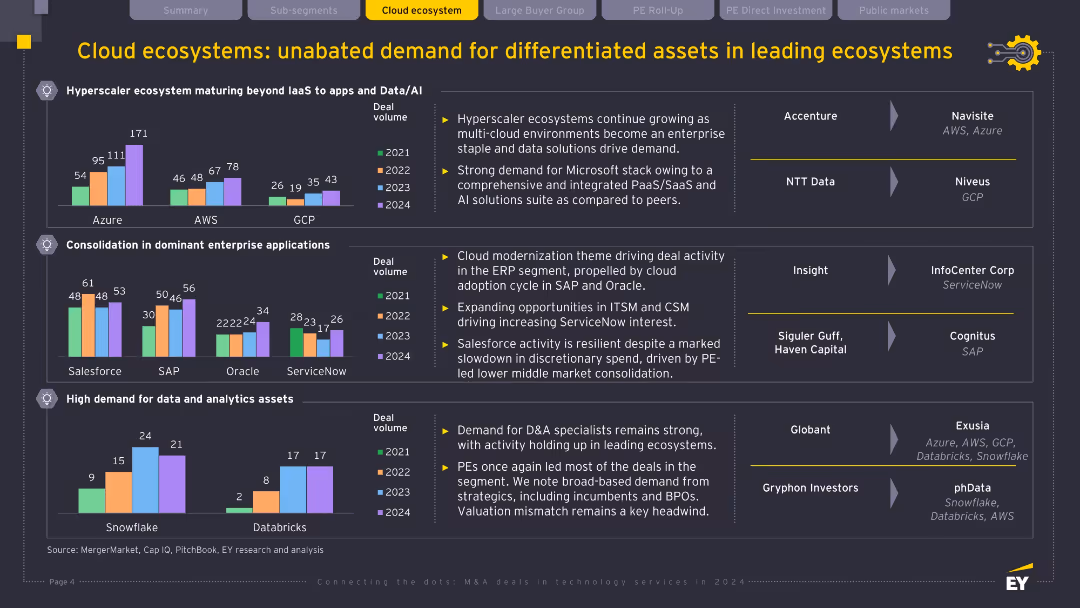
Three bar chart panels (hyperscaler growth, enterprise application consolidation, D&A demand); company logos and acquisition arrows on right; black background with yellow title bar.
Market Analysis and Trends
Technology & Software
This slide explores persistent demand for cloud ecosystem assets, highlighting hyperscaler expansion, application modernization (Salesforce, SAP), and continued strength in data & analytics. It notes strategic acquisitions and key players expanding within AWS, Azure, and other cloud domains to meet enterprise transformation demands.
cloud ecosystem, hyperscaler, data analytics, AWS, Azure, SAP, acquisitions
false
Cloud ecosystems: unabated demand for differentiated assets in leading ecosystemsConnecting the dots: M&A deals in technology services in 2024
Multiple Chart
EY
View slide
The slide features a structured list of recommendations for government involvement in supporting start-ups, including talent development, fiscal incentives, funding and exit options, and start-up facilitation, with examples from various countries.
Strategic Planning
Government & Public Sector
This slide presents recommendations for government roles in supporting start-ups, suggesting actions like providing tax incentives, setting up VC funds, and developing a start-up ecosystem, with international examples.
government role, start-ups, recommendations, talent development, fiscal incentives, funding, start-up facilitation
false
Government needs to play a strong role, as evidenced in other marketsIndonesia Venture Capital Outlook 2017
Table
Kearney
View slide
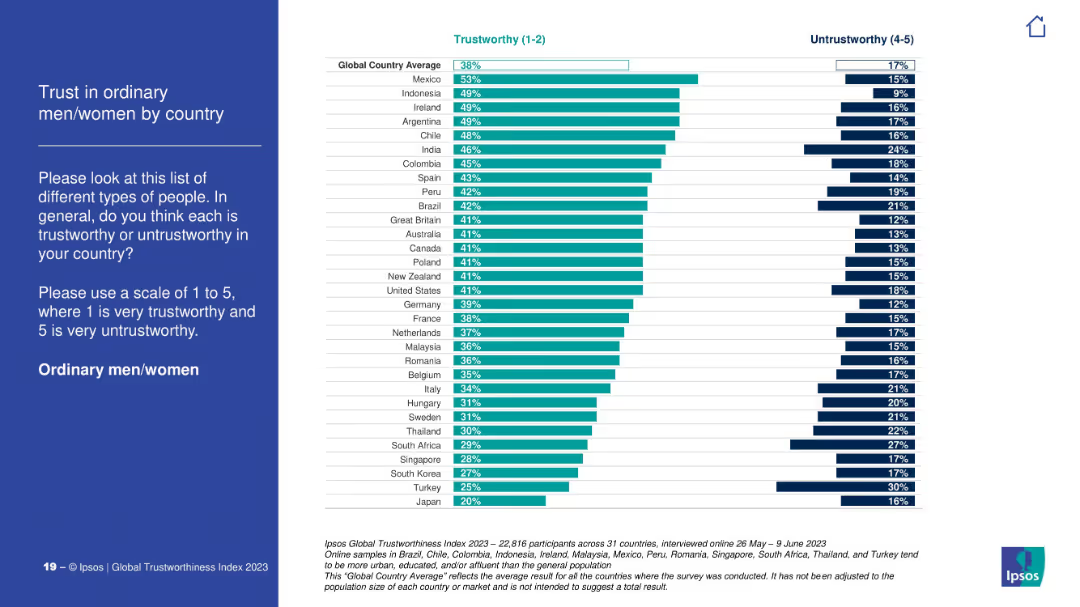
Ranked bar chart showing trust in ordinary citizens by country, with global average noted. Consistent color coding, minimalist visual style.
Customer and Market Segmentation
Government & Public Sector
The slide depicts how ordinary citizens are perceived in terms of trustworthiness across countries. Mexico, Indonesia, and Ireland are highest; Japan and Turkey are lowest. The global average sits at 38%.
ordinary citizens, trust metrics, public perception, Ipsos, social trust, survey results
false
Trust in ordinary men/women by countryIPSOS GLOBAL TRUSTWORTHINESS INDEX 2023
Mixed Chart
IPSOS
View slide
Two-part slide: bar charts showing NII sensitivity to ±25bps yield curve shifts across years, with currency breakdown for +25bps in lower section.
Risk Assessment and Management
Financial Services
Evaluates Deutsche Bank’s NII sensitivity to interest rate shifts from 2025–2027. Projects growing positive impact from a +25bps shift. EUR drives the largest exposure. Useful for forecasting interest rate risk and net income variability.
interest rate risk, NII, yield curve, sensitivity, EUR, forecast
false
Net interest income (NII) sensitivityQ2 2024 results
Multiple Chart
Deutsche Bank
View slide
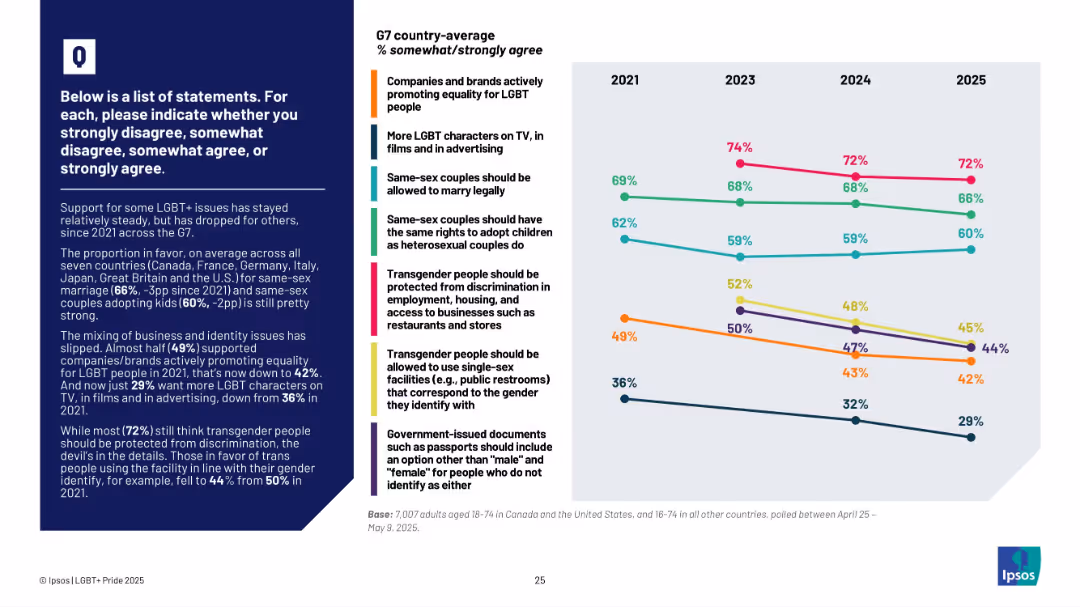
Line graph showing trends from 2021–2025 by issue; text box at left with summary insights
Market Analysis and Trends
Government & Public Sector
This slide tracks changes in public support for LGBT+ rights among G7 countries. It shows declining support in areas like brand promotion of LGBT causes and transgender rights, with the most consistent support for same-sex marriage and anti-discrimination protections.
LGBT+, G7, support trends, policy opinions, transgender, marriage, adoption, brand support, Ipsos
false
G7 country-average % somewhat/strongly agreeIPSOS LGBT+ PRIDE REPORT 2025
Mixed Chart
IPSOS
View slide
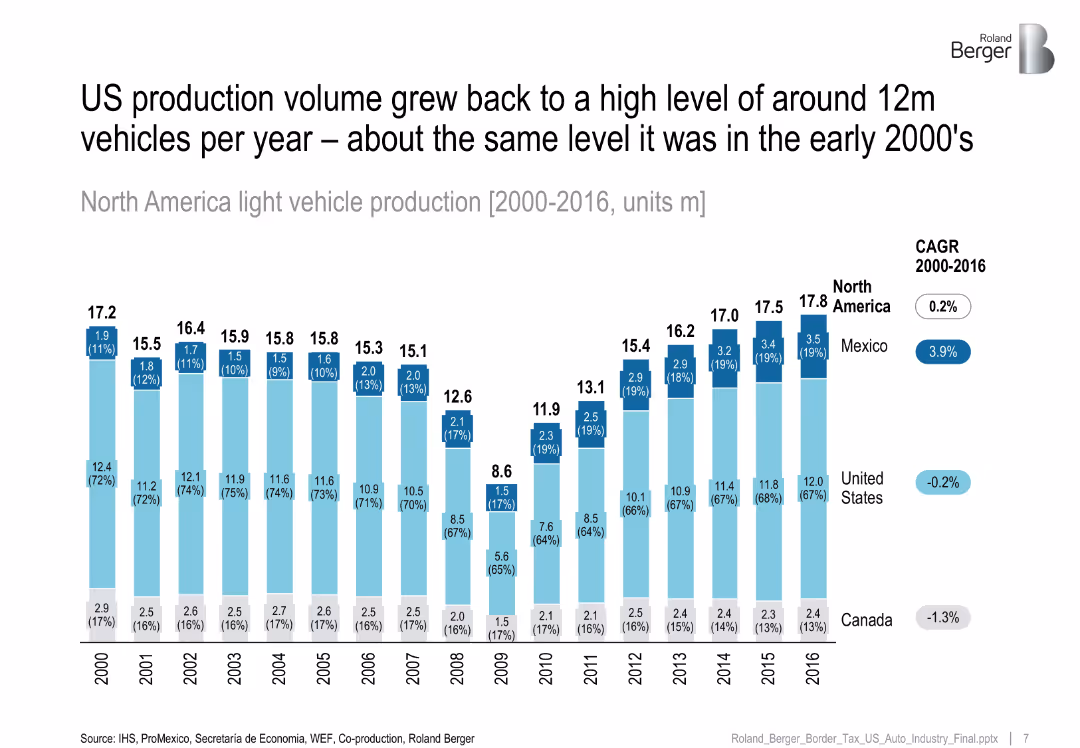
Stacked column chart by country (US, Mexico, Canada) from 2000–2016, CAGR values on right.
Financial Performance
Industrial & Manufacturing
Shows that North American light vehicle production returned to early 2000s levels by 2016, with Mexico seeing positive growth while US and Canada showed stagnation or decline.
US auto industry, vehicle production, Mexico growth, North America, CAGR
false
US production volume grew back to a high level of around 12m vehicles per year – about the same level it was in the early 2000'sNew US tax/tariff proposals and their impact on the US automotive industry
Single Chart
Roland Berger
View slide
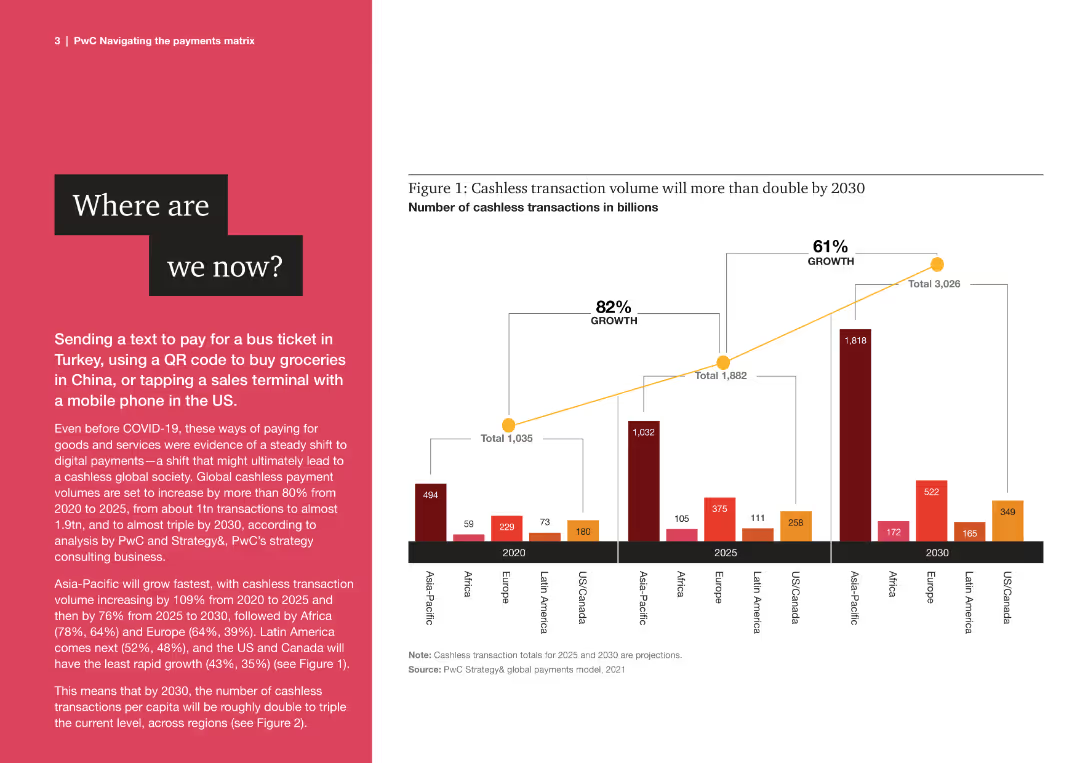
The slide features a column chart with multiple bars representing cashless transaction volumes from 2020 to 2030 across regions.
Market Analysis and Trends
Financial Services
The slide discusses the growth of cashless transactions globally, highlighting projected increases in various regions by 2030.
cashless, transactions, global, growth, projections, financial, trends, 2020, 2030, regions
false
Figure 1: Cashless transaction volume will more than double by 2030Navigating the payments matrix Charting a course amid evolution and revolution
Mixed Chart
PwC/Strategy&
View slide
The slide features an elegant design with a bar chart and professional imagery of a business setting. It compares satisfaction levels within an organization concerning various risk management activities, highlighting differences between more capable and less capable groups.
Strategic Planning
Professional Services
This slide explores the effectiveness of risk management practices across different organizational levels. It contrasts the satisfaction rates between groups with varying capabilities, underscoring the strategic benefits of comprehensive risk management training and integration within business processes. This comparison serves to motivate improvements in company-wide risk awareness and proactive management strategies.
risk management, empowerment, organizational levels, satisfaction rates, training, strategic benefits
false
Risk leaders are empowering the businessHyper-disruption demands constant reinvention
Mixed Chart
Accenture
View slide
Column chart showing the planned rundown of risk-weighted assets over several years with a target for significant reduction.
Strategic Planning
Financial Services
Illustrates the reduction in risk-weighted assets excluding operational risk, outlining the approach for cost reduction and capital release.
rundown, risk-weighted, assets, cost, capital
false
Non-core and Legacy rundown to drive lower costs and efficient capital releaseSecond quarter 2023 Fixed Income investor presentation
Mixed Chart
UBS
View slide
Two large bar charts comparing revenue and EBIT variations of luxury brands from 2014 to 2017, emphasizing the cost of growth.
Financial Performance
Consumer Goods
Highlights the increasing cost of growth for luxury brands over recent years, using revenue and profit metrics to discuss financial sustainability.
Growth, Cost, Luxury Brands
false
GROWTH IS BECOMING MORE EXPENSIVE THAN IN PAST 20 YEARSALTAGAMMA 2017 WORLDWIDE LUXURY MARKET MONITOR
Multiple Chart
Bain
View slide
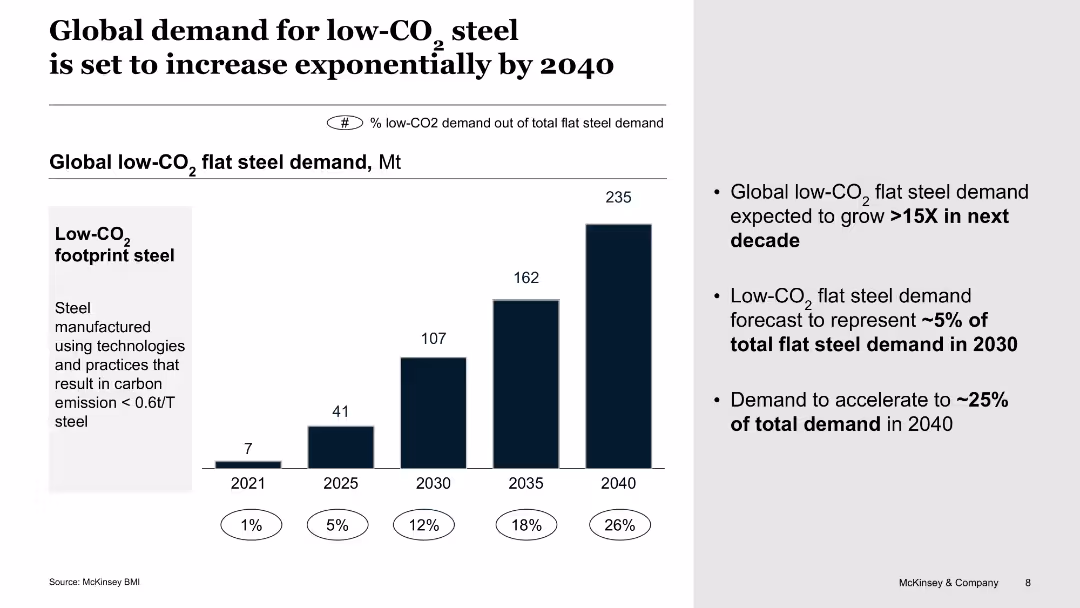
The slide features a column chart predicting global low-CO2 flat steel demand growth, with percentage labels for different years.
Market Analysis and Trends
Environmental Services & Sustainability
This slide forecasts a significant increase in global demand for low-CO2 flat steel by 2040, driven by sustainability efforts and carbon emission reduction technologies.
low-CO2 steel, demand growth, sustainability, carbon reduction, global market
false
Global demand for low-CO2 steel is set to increase exponentially by 2040The future trends in ASEAN steel market
Mixed Chart
McKinsey
View slide
The slide shows a rock climber in a scenic location. Next to it is a column chart listing reasons for Greece’s attractiveness to improve, with yellow bars indicating the percentage of respondents.
Market Analysis and Trends
Professional Services
The slide highlights reasons investors expect Greece’s attractiveness to improve, citing infrastructure quality, availability of skilled talent, sustainability, and R&D opportunities.
attractiveness, improve, Greece, reasons, infrastructure, talent, sustainability
false
Why do you expect Greece’s attractiveness to improve? (selection of all that apply) Sample: 168 respondents, expecting Greece’s attractiveness to improveGreece goes the distance, continuing to win investors’ trust
Multiple Chart
EY
View slide
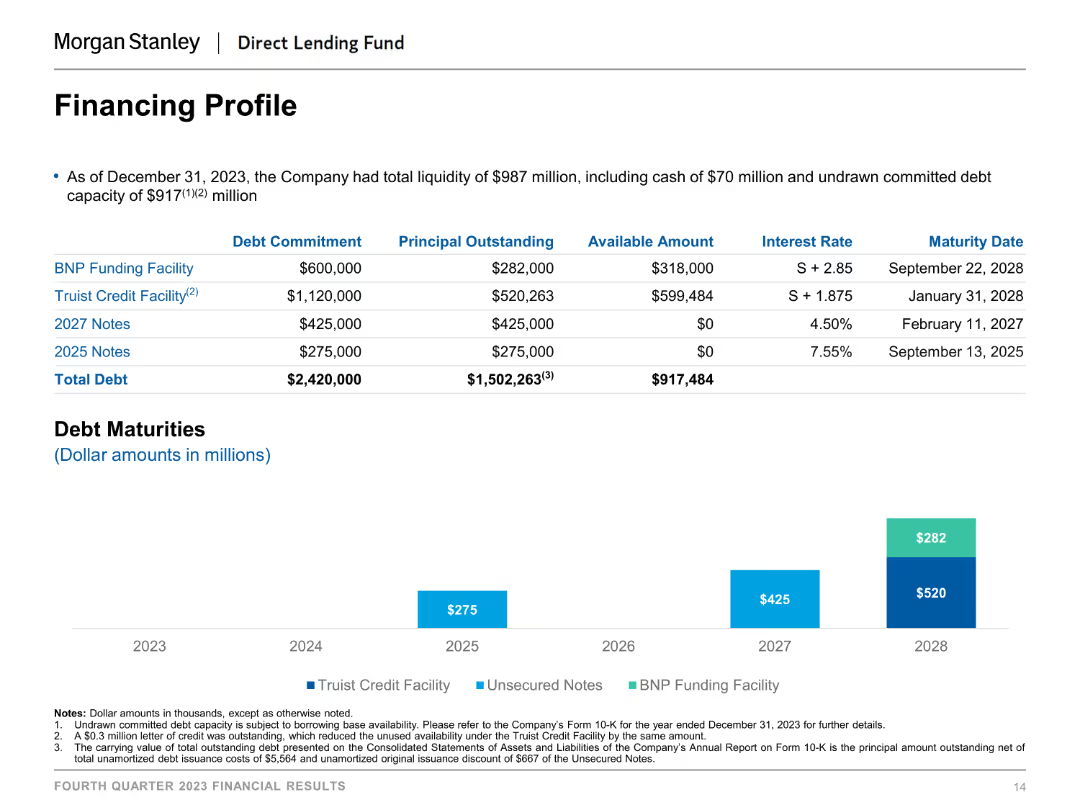
A table detailing debt commitments, principal outstanding, available amounts, interest rates, and maturity dates.
Financial Performance
Financial Services
This slide provides an overview of the company’s financing profile as of December 31, 2023, showing various funding facilities, notes, and debt maturities.
Debt, Financing, Interest Rates, Maturity Dates, Liquidity
false
Financing Profile As of December 31, 2023, the Company had total liquidity of $987 million, including cash of $70 million and undrawn committed debt capacity of $917(1)(2)millionFourth Quarter 2023 Financial Results
Mixed Chart
Morgan Stanley
View slide
Slide uses icons, arrows, and column charts to visualize the growth in Chinese spending on luxury goods from 2015 to 2018, both locally and abroad.
Financial Performance
Retail & E-commerce
Discusses the significant impact of local and international spending by Chinese consumers on the luxury goods market over three years, highlighting the doubling of local spending.
Chinese Market, Spending Growth, Local, International
false
OVER THE LAST 3 YEARS, CHINESE SPENDING IN CHINA HAS CONTRIBUTED TWICE AS MUCH GROWTH AS CHINESE SPENDING ABROADALTAGAMMA 2018 WORLDWIDE LUXURY MARKET MONITOR
Mixed Chart
Bain
View slide
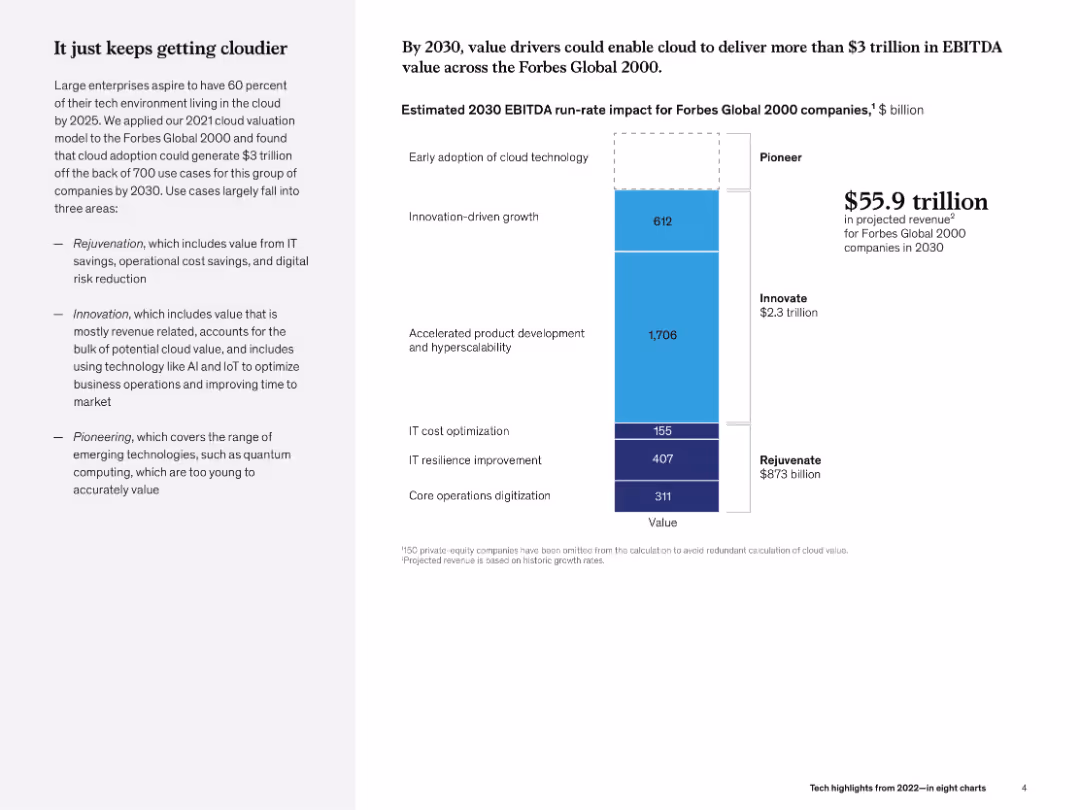
Left narrative and right stacked bar chart showing cloud value drivers by segment. Subtle gradient theme.
Strategic Planning
Technology & Software
The slide projects $3 trillion in EBITDA value from cloud adoption by 2030 among Forbes Global 2000 companies. It categorizes drivers into rejuvenation, innovation, and pioneering, highlighting accelerated product development's role.
cloud, EBITDA, 2030, innovation, hyperscalability, McKinsey, strategic value, digital infrastructure
false
It just keeps getting cloudierTech highlights from 2022—in eight charts
Mixed Chart
McKinsey
View slide
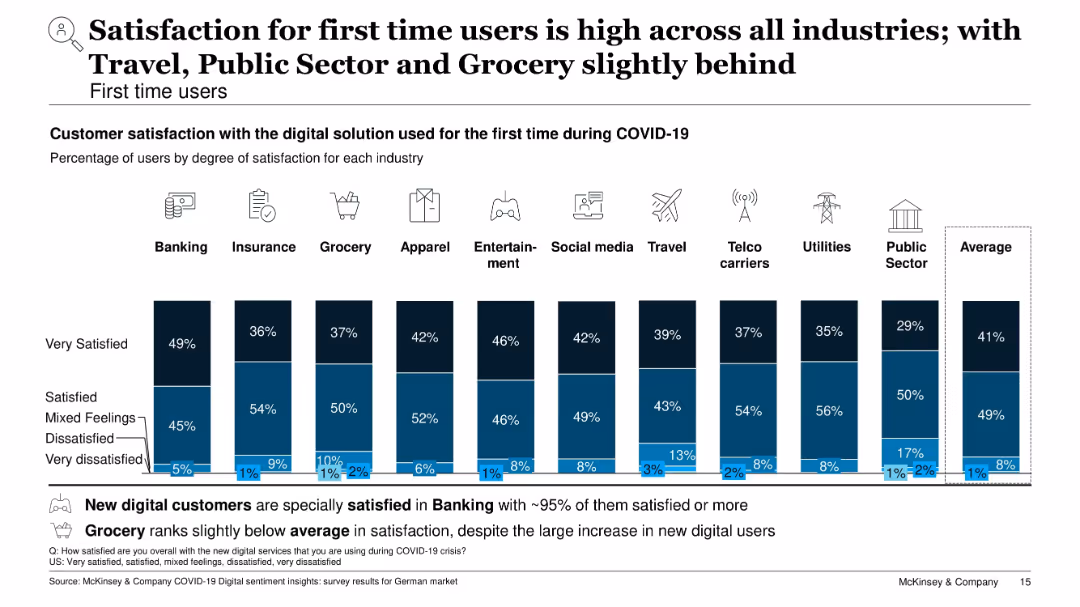
Vertical stacked bar chart showing degrees of satisfaction for first-time users by industry; blue color scheme
Customer and Market Segmentation
Technology & Software
This slide focuses on customer satisfaction among first-time digital users. Banking shows the highest satisfaction (~95%), while Travel, Grocery, and Public Sector lag slightly. Most users report being satisfied or very satisfied, with only a small percentage expressing dissatisfaction.
first-time users, satisfaction, customer experience, digital onboarding, banking, travel, public sector, survey
false
Satisfaction for first time users is high across all industries; with Travel, Public Sector and Grocery slightly behindCOVID-19 Digital sentiment insights
Single Chart
McKinsey
View slide
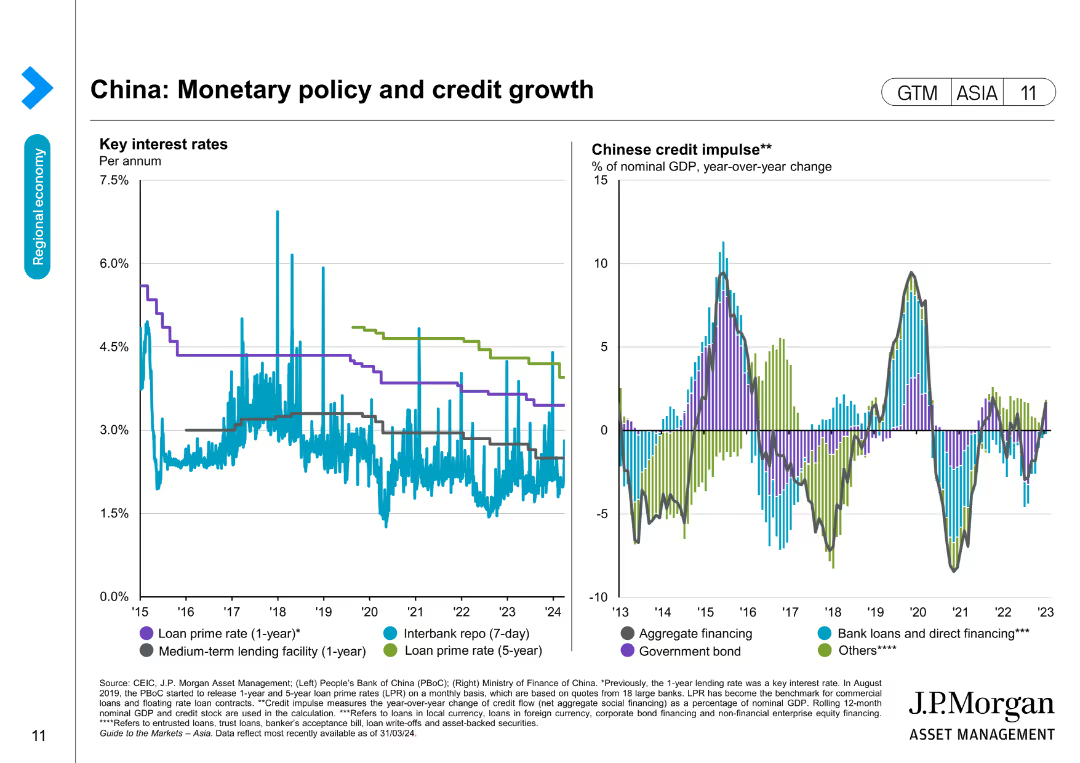
The slide has two line charts detailing key interest rates and Chinese credit impulse, showing changes over several years.
Market Analysis and Trends
Financial Services
Reviews China's monetary policy by tracking interest rates and credit growth, offering insights into financial conditions and economic policy impacts.
Monetary policy, Interest rates, China, Credit growth, Economic trends, Financial data, Forecasting, Banking
false
China: Monetary policy and credit growthGuide to the Markets Asia | 2Q 2024
Multiple Chart
JP Morgan
View slide
Slide includes financial results tables and a column chart showing net revenues from FICC and equities. The layout is data-heavy with a clear distinction between the segments. Blue and grey bars represent the different revenue streams.
Market Analysis and Trends
Financial Services
Analyzes the financial results in global markets, presenting year-over-year and year-to-date comparisons. Useful for evaluating market trends, and understanding performance in FICC and equities for strategic decision-making.
Global Markets, FICC, Equities, Net Revenue
false
Global Markets Financial ResultsSecond Quarter 2022 Earnings Results Presentation
Mixed Chart
Goldman Sachs
View slide
This slide presents a column chart detailing how marketers rate the importance of managing customer privacy in their roles, with additional data breakdowns by industry. The layout is efficient, utilizing colors and labels to enhance readability and ensure quick comprehension of the data. An insights section provides additional analysis and context.
Human Resources and Talent Management
Healthcare & Pharmaceuticals
Highlighting the integration of privacy management in marketing roles, this slide is vital for understanding the emphasis on privacy across different sectors, especially in healthcare. It is useful for training and development sessions focused on enhancing privacy practices within marketing teams.
privacy management, healthcare, marketing roles, industry comparison, training
false
Privacy is considered to be part of most marketers’ jobsThe CMO Survey The Highlights and Insights Report February 2022
Mixed Chart
Deloitte
View slide
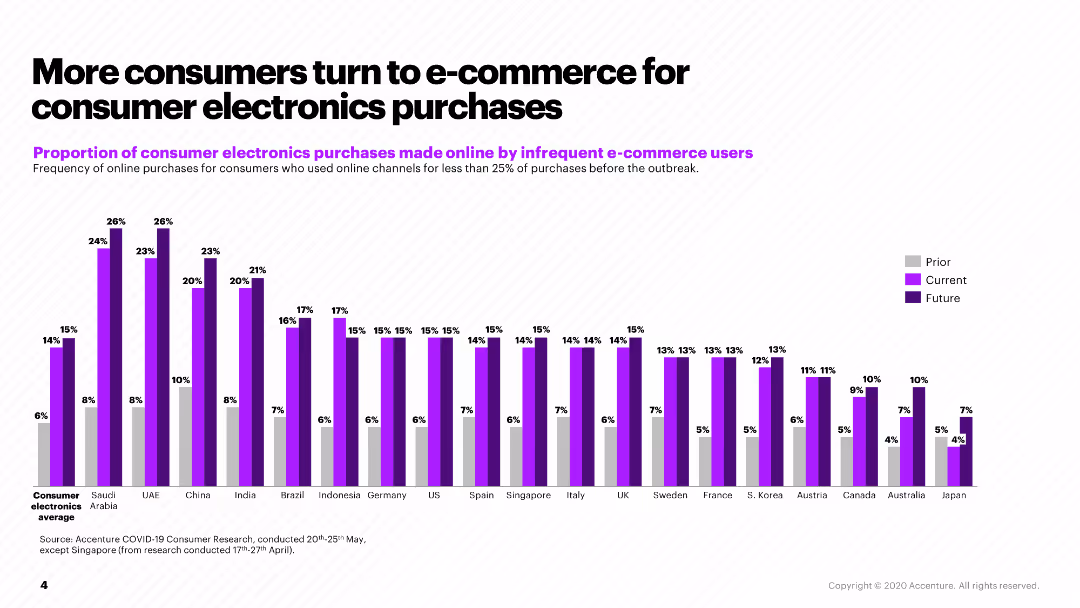
The slide features a column chart displaying the proportion of consumer electronics purchases made online by infrequent e-commerce users across various countries.
Market Analysis and Trends
Retail & E-commerce
The slide discusses the increased shift to e-commerce for consumer electronics, comparing purchase frequencies prior to, during, and expected post-COVID-19 trends.
e-commerce, consumer electronics, online purchases, COVID-19, market trends
false
More consumers turn to e commerce for consumer electronics purchasesHow will COVID-19 change the consumer?
Single Chart
Accenture
View slide
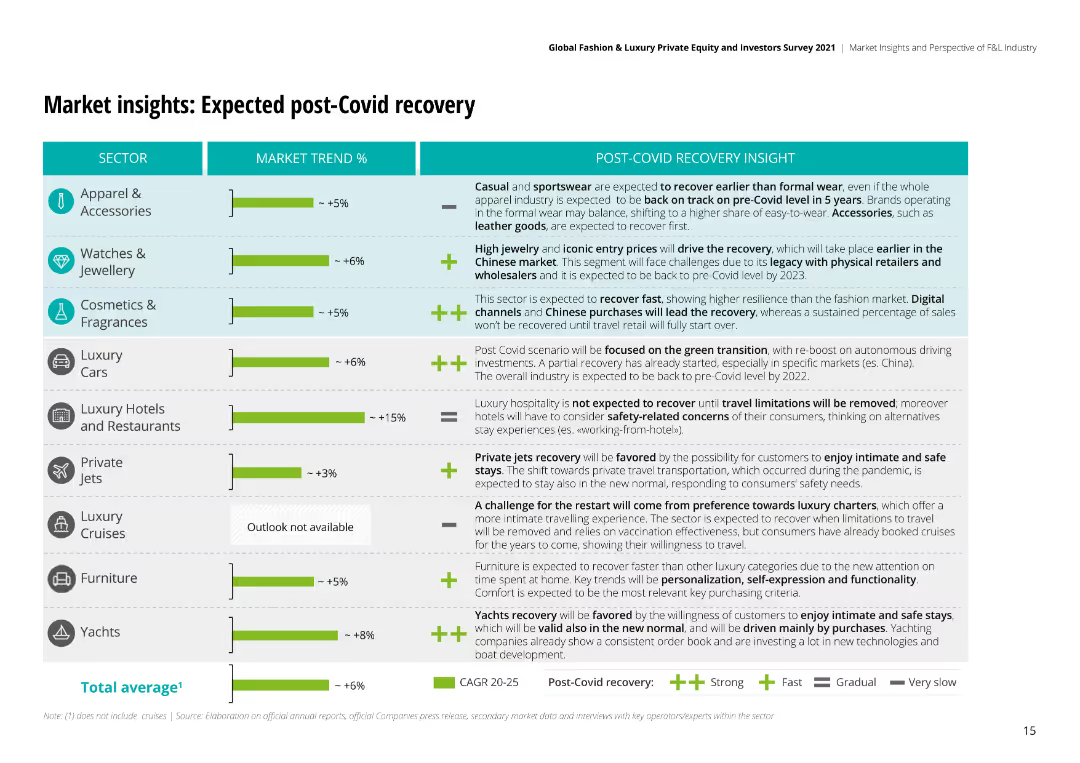
The slide features bar charts and textual analysis to project market recovery trends post-COVID-19, including expected growth rates for different sectors.
Market Analysis and Trends
Retail & E-commerce
Projects the post-COVID recovery of the luxury market, detailing expected recovery rates and key insights across various sectors like apparel and watches.
post-COVID, recovery, market, luxury, retail, e-commerce, growth, projections, sectors
false
Market insights: Expected post-Covid recoveryGlobal Fashion & Luxury Private Equity and Investors Survey 2021
Mixed Chart
Deloitte
View slide
Column chart showing risk-weighted assets changes from 2Q22 to 3Q22 with detailed annotations for different risk categories.
Risk Assessment and Management
Financial Services
The slide outlines the changes in risk-weighted assets, including credit risk, market risk, operational risk, and currency effects.
risk, assets, credit, market, operational
false
Risk-weighted assets Risk-weighted assets bnThird quarter 2022 Financial results
Single Chart
UBS
View slide
The slide has stacked bar graphs representing leaders' economic outlook and expectations for the year ahead, including revenue, profit, and capital expenditure projections.
Financial Performance
Financial Services
Displays business leaders' sentiments on the global and national economic prospects and their company’s performance, indicating general optimism for sales and profits amidst a cautious economic view.
Economic Outlook, Performance, Profit, Sales
false
Economic outlook and expectations2023 Midyear Business Leaders Outlook
Multiple Chart
JP Morgan
View slide
The slide showcases multiple column charts representing various financial metrics over time, with a clear labeling system and visual cues for easy interpretation.
Financial Performance
Financial Services
This slide offers insight into the robustness of the client business, with operating income and client numbers trends. The depiction of regulatory capital also illustrates the financial health and compliance of the division, serving as a basis for analyzing market stability and growth potential.
client business, operating income, regulatory capital, market analysis, financial health, trends
false
Strong underlying client businessMorgan Stanley Virtual Hong Kong Summit
Multiple Chart
Morgan Stanley
View slide
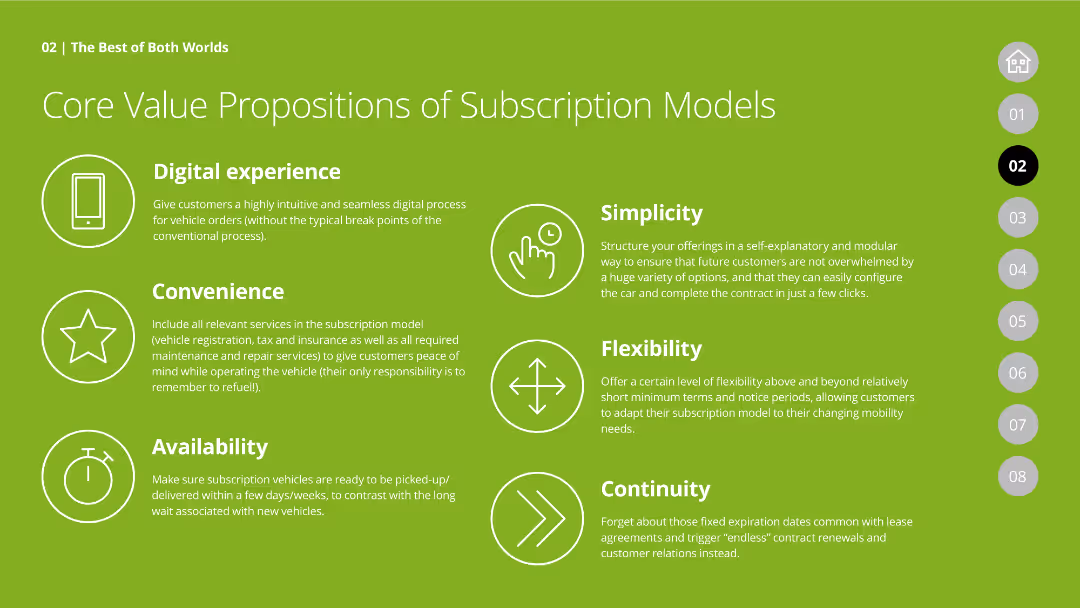
The slide lists core value propositions of subscription models with icons and descriptions for digital experience, convenience, simplicity, flexibility, availability, and continuity, presented on a green background.
Product and Service Analysis
Transportation & Logistics
Outlines the core benefits of subscription models for vehicles, emphasizing aspects like digital experience, convenience, and flexibility to appeal to consumers' changing preferences.
subscription models, core value propositions, digital experience, convenience, flexibility, vehicle subscription
false
Core Value Propositions of Subscription ModelsVehicle-as-a-Service From vehicle ownership to usage-based subscription models
Header Vertical
Deloitte
View slide
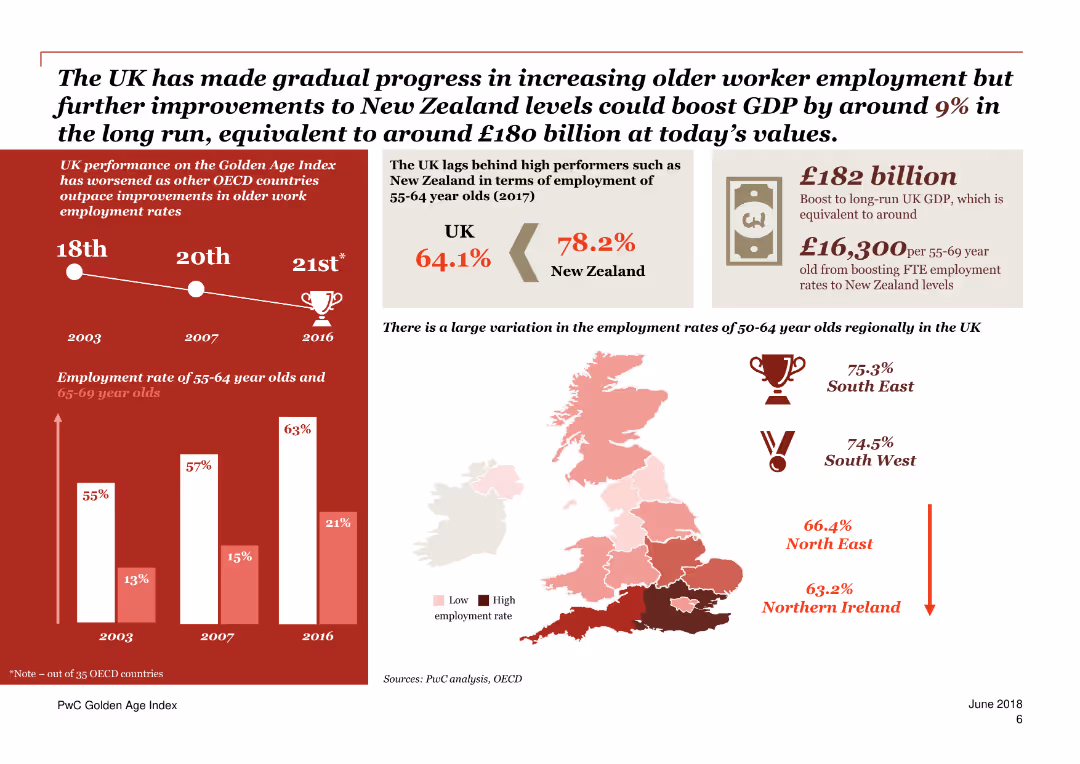
The slide contains a mix of column charts, maps, and text blocks. Predominantly red and white color scheme.
Market Analysis and Trends
Government & Public Sector
This slide compares the employment rates of older workers in the UK with other countries, and discusses potential GDP boosts if employment rates matched those of New Zealand.
employment, GDP, older workers, UK, New Zealand, boost, comparison, trends, OECD, potential
false
The UK has made gradual progress in increasing older worker employment but further improvements to New Zealand levels could boost GDP by around 9% in the long run , equivalent to around £180 billion at today’sPwC Golden Age index Unlocking a potential $3.5 trillion prize from longer working lives
Mixed Chart
PwC/Strategy&
View slide
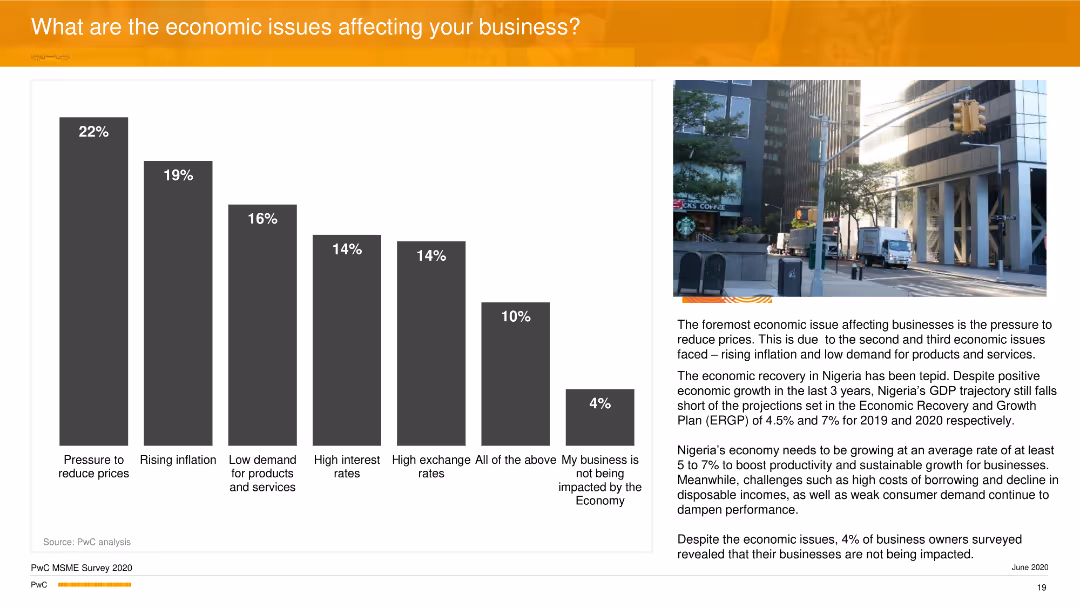
This slide includes a vertical column chart detailing economic issues such as price reduction pressures and inflation. A cityscape image is placed on the right.
Risk Assessment and Management
Financial Services
The slide details economic challenges affecting businesses, with pressure to reduce prices and rising inflation being the most significant. It discusses the overall impact on Nigeria's GDP and business performance.
Economic Issues, Inflation, Business, GDP, PwC
false
What are the economic issues affecting your business?PwC’s MSME Survey 2020 Building to Last
Mixed Chart
PwC/Strategy&
View slide
It has a mix of column charts, a line chart, and text sections. The color red is used to accentuate key figures and headers. Charts are labeled for clarity.
Market Analysis and Trends
Industrial & Manufacturing
Displays the growing revenues and profitability in the Defence Electronics & Security sector, with historical data from 2018 to 2021 and future outlooks based on orders and EBITA.
defence, electronics, security, orders, revenues, EBITA, profitability improvement, financial outlook
false
Defence Electronics & Security Growing Revenues and ProfitabilityGoldman Sachs Investor Meeting
Multiple Chart
Goldman Sachs
View slide
Slide contains a bar chart showing hydrogen production costs over time comparing grey, blue, and green hydrogen.
Investment Analysis
Energy & Utilities
Analyzes cost trends in hydrogen production, emphasizing the economic shift towards green hydrogen as a viable future investment in energy.
hydrogen, green energy, cost trends, investment analysis, energy sector
false
Blue H2 is cheaper today, but Green H2 is the ´new solar´ with costs decreasing rapidlyChilean Hydrogen Pathway
Linear Flow
McKinsey
View slide
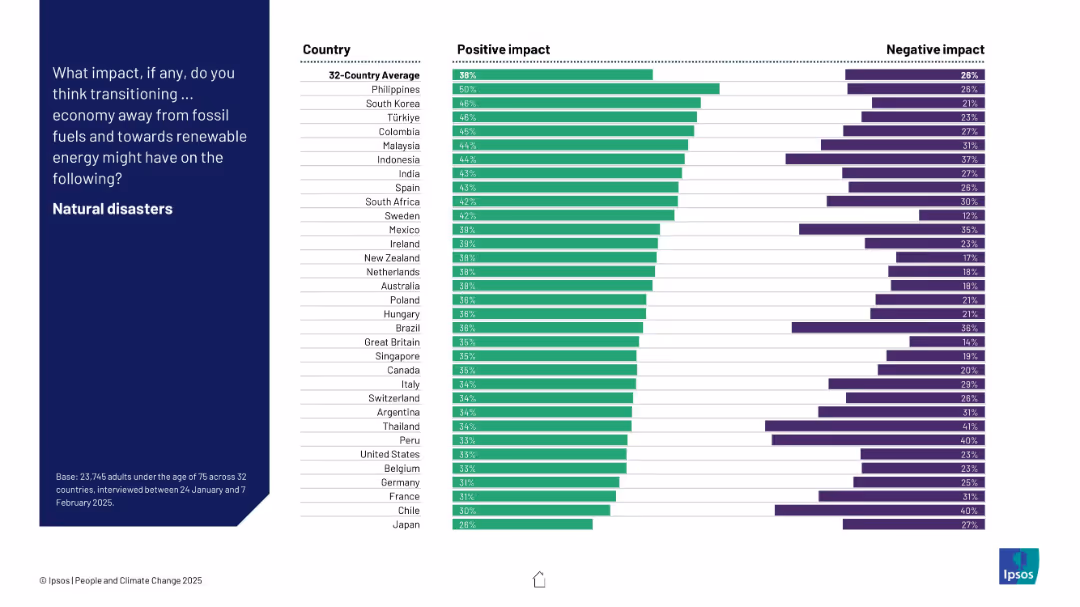
Ranked bar chart displaying countries’ perceptions of renewable energy’s effect on natural disaster occurrence, showing both positive and negative responses.
Technology and Digital Transformation
Environmental Services & Sustainability
This chart shows whether citizens believe switching to renewable energy will reduce natural disasters. Perceptions are mixed but lean slightly positive. The Philippines shows highest optimism, while Japan has the lowest confidence.
natural disasters, energy transition, perception, climate risk, Ipsos, country comparison, survey, renewables
false
What impact, if any... Natural disastersPEOPLE AND CLIMATE CHANGE
Mixed Chart
IPSOS
View slide
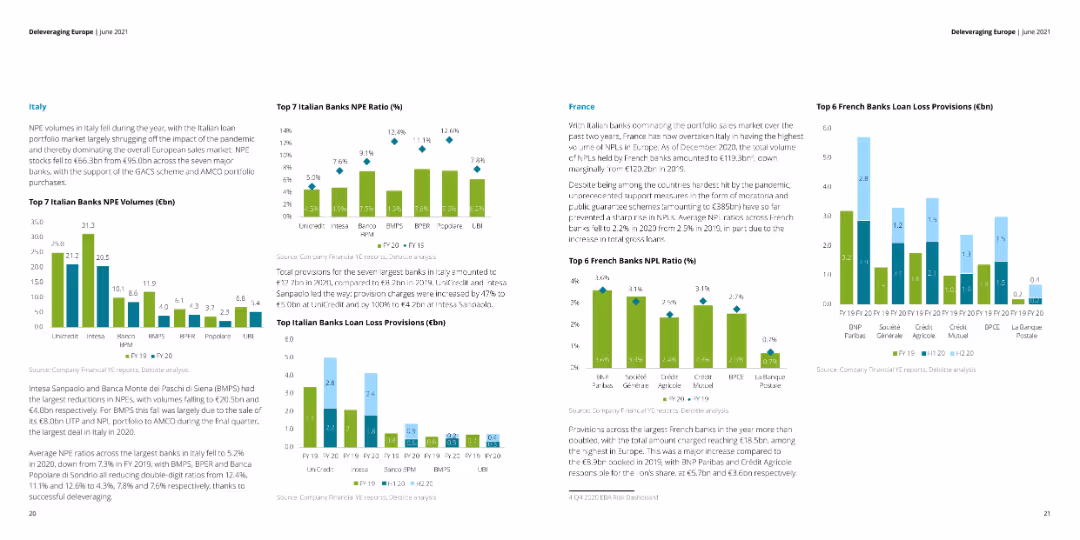
The slide features multiple column charts showing NPE volumes, NPE ratios, and loan loss provisions for top banks in Italy and France. Text sections provide detailed explanations of the charts.
Financial Performance
Financial Services
This slide analyzes the NPE volumes, NPE ratios, and loan loss provisions for the top banks in Italy and France. It discusses the impact of the pandemic and government support schemes on the financial metrics.
NPE volumes, NPE ratios, loan loss, Italy, France
false
Top 7 Italian Banks NPE Ratio (%)Deleveraging Europe
Multiple Chart
Deloitte
View slide
The slide displays a title section and multiple line charts depicting the increase in search volumes for merchant-related queries. The design is clean, with the use of blue shades to represent different countries and time periods, while annotations provide context.
Market Analysis and Trends
Retail & E-commerce
Representing an increase in merchant interest in e-commerce, the slide uses indexed search volume data to show the burgeoning desire to join the digital marketplace across various SEA countries. The comparative analysis underpins the regional e-commerce boom and indicates the digital marketplace's attractive prospects for business owners seeking to expand their reach.
e-commerce, merchant interest, search volumes, digital marketplace, SEA, business expansion
false
More merchants are eager to join the e-commerce rocketshipe-Conomy SEA 2021 Roaring 20s: The SEA Digital Decade
Multiple Chart
Bain
View slide
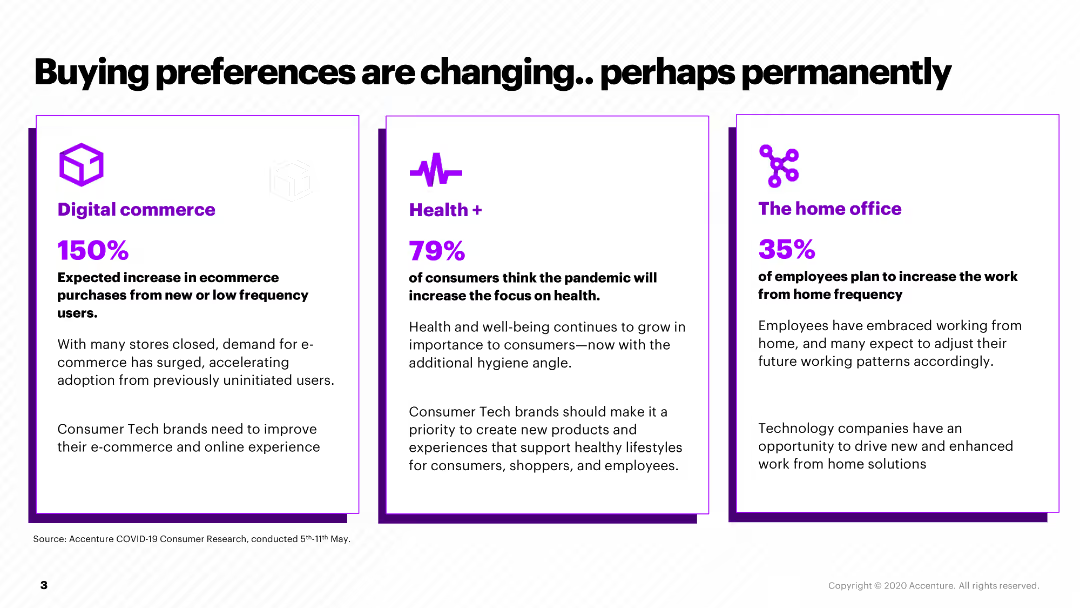
This slide presents three sections comparing changes in consumer preferences: Digital commerce, Health, and Home office, each with a percentage and brief description.
Market Analysis and Trends
Retail & E-commerce
It outlines how consumer buying preferences have shifted due to the pandemic, with increases in digital commerce, health focus, and remote work, suggesting strategic areas for companies to address.
buying preferences, digital commerce, health, home office, pandemic impact
false
Buying preferences are changing.. perhaps permanentlyHow will COVID-19 change the consumer?
Pillar
Accenture
1
...
Next
Load More
Hold On!
We are searching in our database
If nothing, comes up, please try different filters!
Create a FREE account to continue browsing
Receive Instant Access to 1,000+ slides from companies like McKinsey, Google, and Goldman Sachs
First Name
Last Name
Email
Password
I agree to all
Terms & Privacy Policy
Thank you! Your submission has been received!
Oops! Something went wrong while submitting the form.
Have an account?
Sign in
Column Chart
Heatmap
Chevron
Org Chart
Infographic
Callouts
Timeline
List
Graphic
Picture
Process Flow
Diagram
Paragraph
Map
Table
Framework
Subtitle
Takeaway Box
Icon
Other Chart
Radar Chart
Waterfall Chart
Mekko Chart
Pie Chart
Scatter Plot
Line Chart
Bar chart
Bullet points