My Account
My Slides
Search by Category
Templates
View All Templates
Download Template Slides
Leave Feedback
Login
Logout
Get Started
Browse all Slides
Browse all Slides
Create a FREE Account
Instant access to 1,000+ real slides from top companies like McKinsey, BCG, Goldman Sachs, Google and many more!
First Name
Last Name
Email
Password
I agree to all
Terms & Privacy Policy
Thank you! Your submission has been received!
Oops! Something went wrong while submitting the form.
Have an account?
Sign in
Instant access to the internet's best slides
Get access to 40+ advanced filters and more
Advanced Search and Filters
Access to
10,000+ slides
Access to Category Pages
Save/Bookmark Slides
PowerPoint Template Library (New)
Choose your plan
MONTHLY
$12/month
Billed every month, cancel anytime.
YEARLY
$9/month
Billed $108 annually, cancel anytime.
Checkout for $12/month
Checkout for $108/yr
Secured by Stripe | AES-256 bit encryption
Spark Your Next Big Idea with New Presentation Templates
VIEW ALL Templates
Welcome,
Welcome
Upgrade to SlideStart
Pro
Instant access to 15,000+ slides
Show Featured Only
Checkbox 8
Companies
Mckinsey
Bain
BCG
EY
Deloitte
Accenture
PwC/Strategy&
JP Morgan
Goldman Sachs
Morgan Stanley
Citigroup
Deutsche Bank
Barclays
LEK
Kearney
Oliver Wyman
Booz Allen Hamilton
Gartner
IPSOS
Nielsen
Slide type
Header Horizontal
Framework
Vertical Flow
Single Chart
Single Chart
Text Only
Mixed Chart
Header Vertical
Graphic
Pillar
Multiple Chart
Agenda
Title
Table
Linear Flow
Upgrade to SlideStart
Pro
Instant access to 40+ advanced filters
Industry
Upgrade to SlideStart
Pro
Instant access to 40+ advanced filters
Technology
Healthcare
Financial Services
Consumer Goods
Energy & Utilities
Manufacturing
Retail
E-commerce
Logistics
Telecommunications
Real Estate
Professional Services
Education
Media
Entertainment
Hospitatlity
Tourism
Agriculture
Food Production
Government & Public Sector
Environmental
Sustainability
Use Case
Upgrade to SlideStart
Pro
Instant access to 40+ advanced filters
Sales and Business Development
Mergers and Acquisitions
Corporate Finance and Valuation
Performance Metrics and KPIs
Client Case Studies
Competitive Landscape
Product and Service Analysis
Customer and Market Segmentation
Organizational Structure
Human Resources and Talent Management
Industry Overview
Regulatory and Compliance
Risk Assessment and Management
Agriculture & Food Production
Hospitality and Tourism
Government
Environmental
Sustainability
Clear all
Thank you! Your submission has been received!
Oops! Something went wrong while submitting the form.
Show Featured Only
Checkbox 8
Companies
Mckinsey
Bain
BCG
EY
Deloitte
Accenture
PwC/Strategy&
JP Morgan
Goldman Sachs
Morgan Stanley
Citigroup
Deutsche Bank
Barclays
LEK
Kearney
Oliver Wyman
Booz Allen Hamilton
Gartner
IPSOS
Nielsen
Slide type
Text Only
Linear Flow
Vertical Flow
Single Chart
Header Horizontal
Mixed Chart
Header Vertical
Pillar
Multiple Chart
Graphic
Agenda
Title
Table
Framework
Industry
Technology
Healthcare
Financial Services
Consumer Goods
Energy & Utilities
Manufacturing
Retail
E-commerce
Logistics
Telecommunications
Real Estate
Professional Services
Education
Media
Entertainment
Hospitatlity
Tourism
Agriculture
Food Production
Government & Public Sector
Environmental
Sustainability
Use Case
Sales and Business Development
Mergers and Acquisitions
Corporate Finance and Valuation
Performance Metrics and KPIs
Client Case Studies
Competitive Landscape
Product and Service Analysis
Customer and Market Segmentation
Organizational Structure
Human Resources and Talent Management
Industry Overview
Regulatory and Compliance
Risk Assessment and Management
Agriculture & Food Production
Hospitality and Tourism
Government
Environmental
Sustainability
Clear all
Thank you! Your submission has been received!
Oops! Something went wrong while submitting the form.
Tag
View slide
The slide presents bar graphs comparing current and future use of digital services. It has a title, a subtitle, and a source citation at the bottom.
Market Analysis and Trends
Retail & E-commerce
The slide shows the usage of digital services during COVID-19, with an expectation that consumers will continue using these services post-pandemic.
Omnichannel, Retail, COVID-19, Digital Services, Consumer Behavior, Future Trends, Bar Graphs, Usage Statistics
false
Consumers using omnichannel services are likely to continue doing soHow is COVID-19 changing the retail consumer?
Mixed Chart
Accenture
View slide
The slide features a column chart showing FY23 greenhouse gas emissions by category and a text description of the company's efforts to reduce carbon footprint and enhance sustainability.
Regulatory and Compliance
Environmental Services & Sustainability
This slide presents data on Booz Allen's FY23 greenhouse gas emissions, categorized by scope, and discusses initiatives to reduce the company's carbon footprint and enhance sustainability.
Booz Allen, greenhouse gas emissions, sustainability, FY23, carbon footprint
false
We continue to build awareness across the firm about how to further embed climate change into our strategic decision making and to consider the second- and third-tier climate impacts of business decisions.2023 ENVIRONMENTAL, SOCIAL, GOVERNANCE REPORT
Multiple Chart
Booz Allen Hamilton
View slide
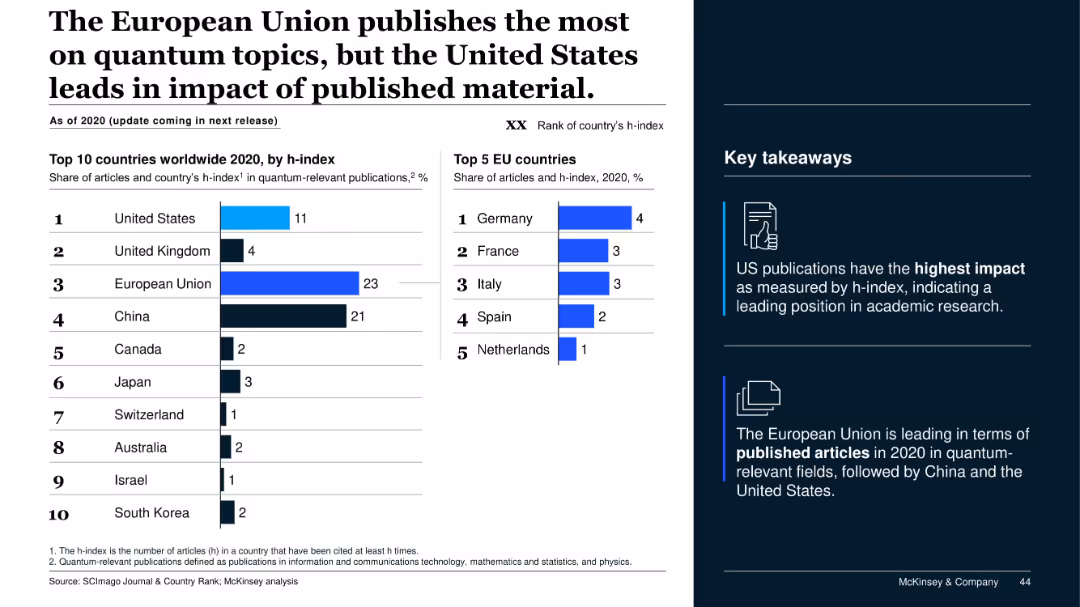
Dual bar graphs ranking countries by h-index and publication share, with special callout for EU countries; supporting key points at right.
Industry Overview
Education & Training
The slide compares publication quantity vs. quality in quantum topics, showing the EU leads in volume while the US leads in impact (h-index). China ranks third in volume. Germany and France top EU contributions.
publications, quantum topics, h-index, research impact, EU, US, China, academic output
false
The European Union publishes the most on quantum topics, but the United States leads in impact of published material.Quantum Technology Monitor June 2022
Mixed Chart
McKinsey
View slide
The slide presents bar graphs comparing the employment duration expectations of women with varying degrees of work flexibility. The color-coded design aids in distinguishing between the groups.
Performance Metrics and KPIs
Professional Services
Highlighting how work flexibility correlates with longer employment duration, this slide is vital for presentations on staff retention strategies and the importance of flexible working conditions.
flexibility, retention, employment, women
false
Women with higher flexibility stay with employers longerWomen @ Work 2023: 4 Women are seeking more flexibility and making career choices accordingly
Multiple Chart
Deloitte
View slide
Comparative pie charts showing revenue mix of UBS versus North American and European GSIB averages, highlighting different business segments.
Strategic Planning
Financial Services
Compares UBS's business model and revenue mix with North American and European GSIB averages, emphasizing unique global asset gathering.
Business Model, Revenue Mix, UBS, GSIB, Comparison
false
Attractive business model with unique global asset gathering businessesThird quarter 2023 Fixed Income investor presentation
Multiple Chart
UBS
View slide
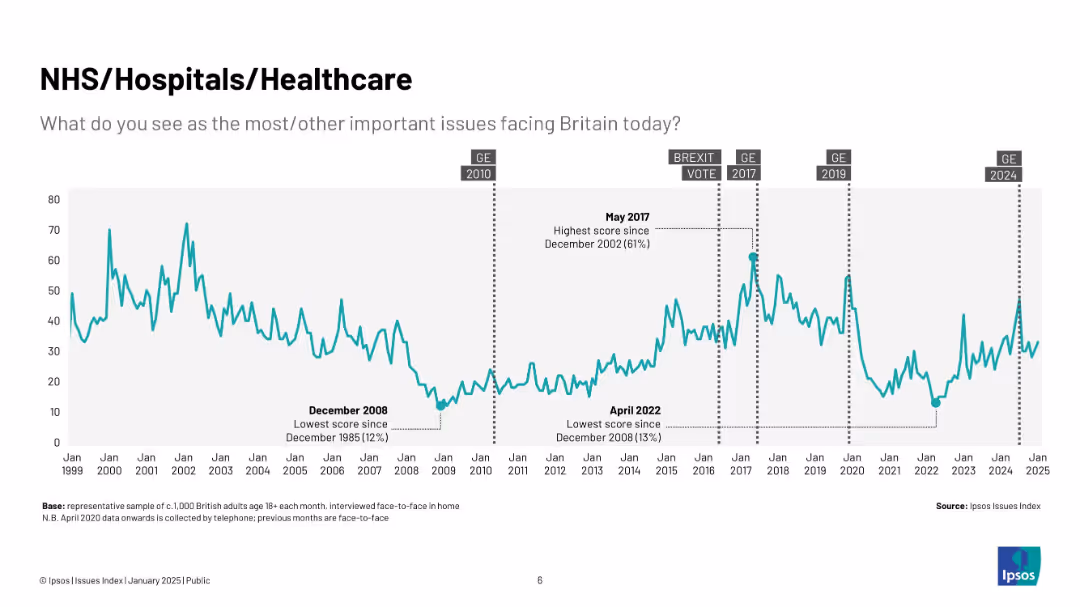
Timeline chart (1999–2025) of NHS concern levels; key points annotated; events like Brexit are noted
Market Analysis and Trends
Government & Public Sector
This slide shows fluctuations in public concern over healthcare from 1999 to 2025, highlighting peaks in 2017 and post-2020. Major political events are annotated for context.
NHS, healthcare, UK, concern, Ipsos, timeline, Brexit, trends, public health, chart
false
NHS/Hospitals/HealthcareIpsos Issues Index January 2025
Single Chart
IPSOS
View slide
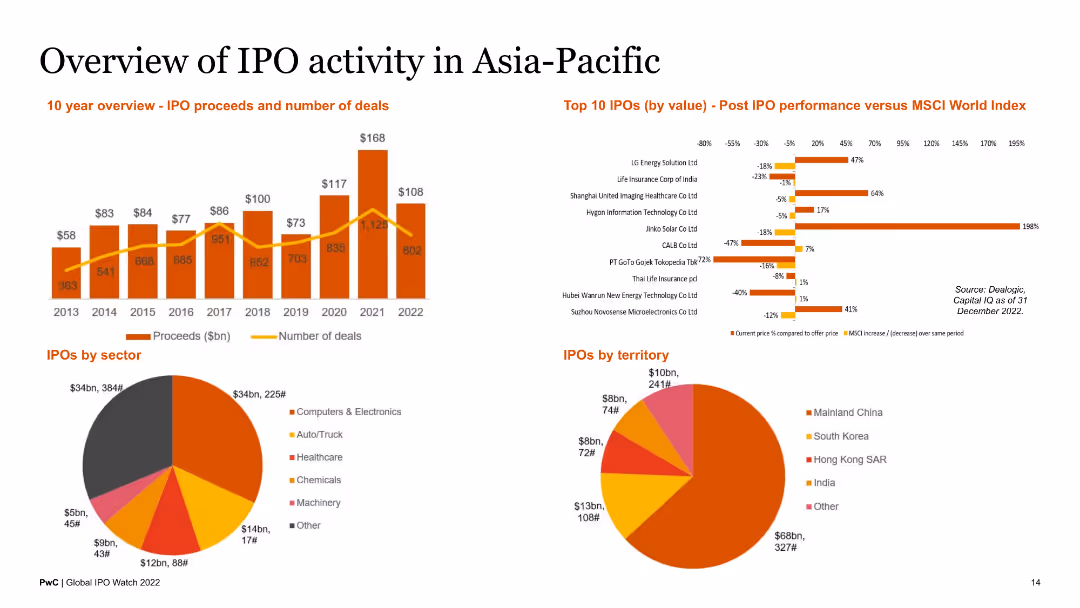
This slide includes a column chart depicting IPO proceeds and number of deals over 10 years, a pie chart for IPOs by sector, another pie chart for IPOs by territory, and a bar chart comparing post IPO performance of top 10 IPOs by value.
Market Analysis and Trends
Financial Services
The slide provides an overview of IPO activities in the Asia-Pacific region, detailing proceeds, number of deals, sector distribution, and geographical distribution. It also highlights post IPO performance.
IPO, Asia-Pacific, proceeds, deals, sector, territory, performance, financial, market
false
Overview of IPO activity in Asia-PacificGlobal IPO Watch 2022
Multiple Chart
PwC/Strategy&
View slide
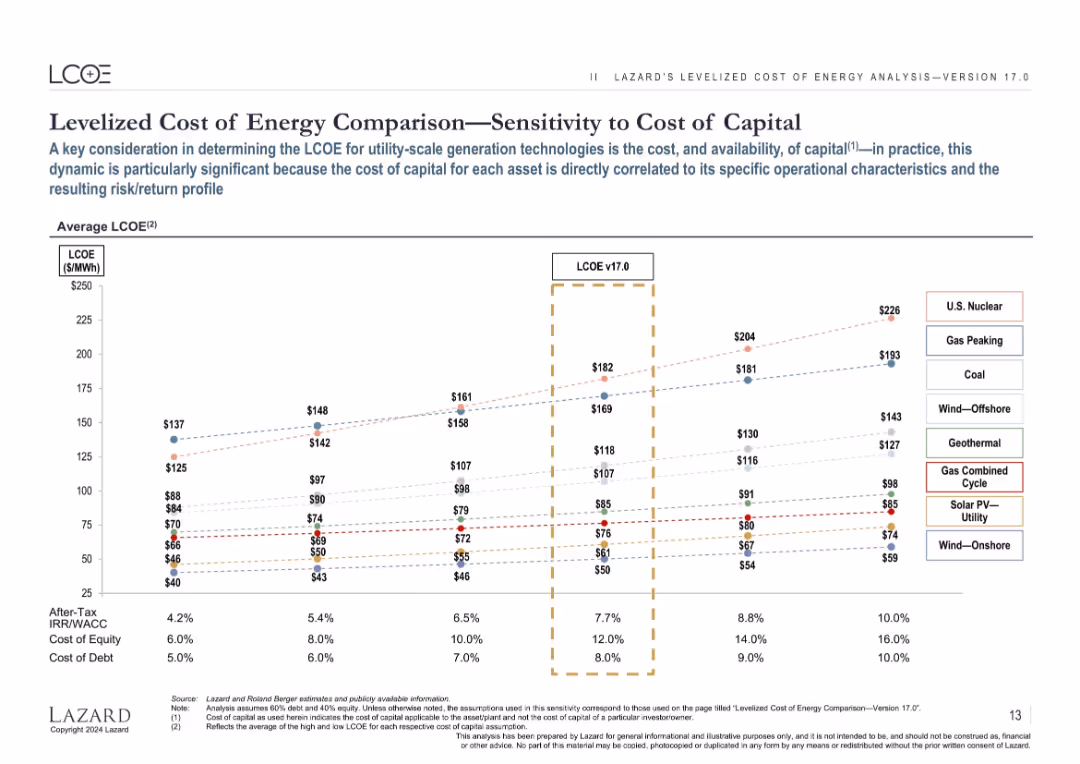
Line chart showing how LCOE varies with cost of capital for each energy source; each line represents one technology.
Investment Analysis
Financial Services
Explores how variations in the cost of capital influence the LCOE of different energy technologies, illustrating that renewables tend to have lower risk and better cost stability under financial fluctuations.
LCOE, cost of capital, IRR, equity, debt, investment, energy financing, WACC
false
Levelized Cost of Energy Comparison—Sensitivity to Cost of CapitalLazard LCOE+
Single Chart
Roland Berger
View slide
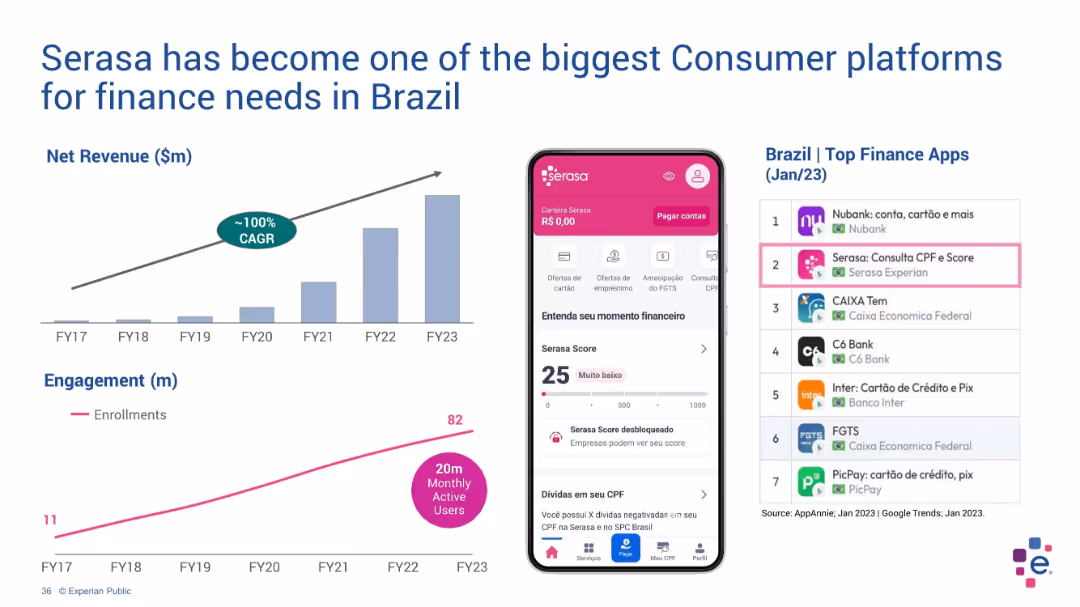
Dual layout with charts on left and mobile app interface + app ranking on right
Customer and Market Segmentation
Technology & Software
Serasa’s consumer platform growth is illustrated via a net revenue chart (FY17–FY23) and user engagement trend. The right side shows the app interface and top rankings in Brazil’s finance app category, demonstrating its high market penetration.
Serasa, Brazil, finance apps, revenue growth, engagement, mobile, CAGR
false
Serasa has become one of the biggest Consumer platformsBarclays Credit Bureau Forum
Multiple Chart
Barclays
View slide
A scatter plot chart showing cumulative number of cases per million population juxtaposed against a ratio of total tests to total cases for various countries, within a gradient green background indicating preparedness.
Market Analysis and Trends
Healthcare & Pharmaceuticals
Analyzes countries' testing rates in relation to COVID-19 cases to evaluate readiness for relaxing lockdown measures, providing insights into public health strategies.
COVID-19, lockdown measures, testing rates, public health, cumulative cases, preparedness, relax lockdown
false
Countries planning to relax lockdown measures and substantially ramp-up testingCOVID-19 BCG Perspectives Publication #5 with a focus on Revamping Organizations for the New Reality
Mixed Chart
BCG
View slide
The slide features three columns, each with an image of a computer screen showcasing different tools, and icons for ON24, CSF-OR, and Salesforce at the bottom. Arrows indicate progress from one tool to the next.
Financial Performance
Financial Services
This slide presents market-leading tools used to engage and train suppliers, detailing features such as webcasts, online registration, and program analytics. It may be used to demonstrate technological support tools.
Engagement, Training, Analytics, Webcasts, ON24, Salesforce, CSF-OR, Supplier Management, Online Registration, Data-Driven
false
Supplier Experience Evolution: Engagement and Training ToolsTrade Working Capital Finance in 2018
Pillar
Citigroup
View slide
The slide includes a vertical bar chart showing levels of concern about the environmental emergency across various demographic groups.
Market Analysis and Trends
Environmental Services & Sustainability
Breakdown of concern about the environmental emergency by gender, age, marital status, education, income, and working status, indicating broad agreement across groups.
Environment, demographics, concern, survey, global trends
false
Concern about the environmental emergency is ubiquitous across demographic groupsA NEW WORLD DISORDER?
Mixed Chart
IPSOS
View slide
A slide with column chart and bullet points detailing quarter-on-quarter and year-on-year expenses. The slide also includes key investment themes and adds context to the financial figures presented.
Operational Efficiency
Financial Services
Details Citigroup's financial expenditures and investments for Q3 2023, allowing for operational assessment and strategic financial planning.
Citigroup, Q3 2023, expenses, investments, quarter-on-quarter, year-on-year, bar graphs, operational efficiency, bullet points, text.
false
3Q23 QoQ and YoY Expenses and Key Investment ThemesEarnings Results Presentation
Mixed Chart
Citigroup
View slide
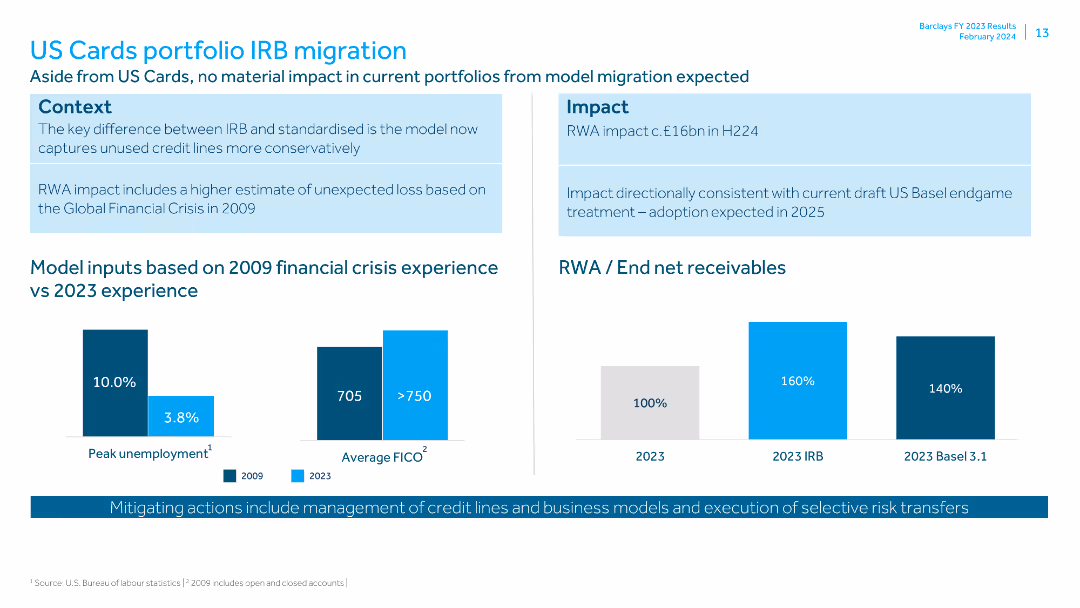
Contains bar charts comparing model inputs from 2009 financial crisis vs 2023, and data on RWA and end net receivables. Context and impact boxes are included.
Risk Assessment and Management
Financial Services
Discusses the impact of IRB migration on the US Cards portfolio, comparing past and current financial conditions. It details the RWA impact and mitigating actions.
IRB migration, US Cards, financial crisis, RWA, receivables, peak unemployment, FICO, liquidity pool, credit lines, risk transfer
false
US Cards portfolio IRB migrationFY23 Fixed Income Investor Call 20th February 2024
Multiple Chart
Barclays
View slide
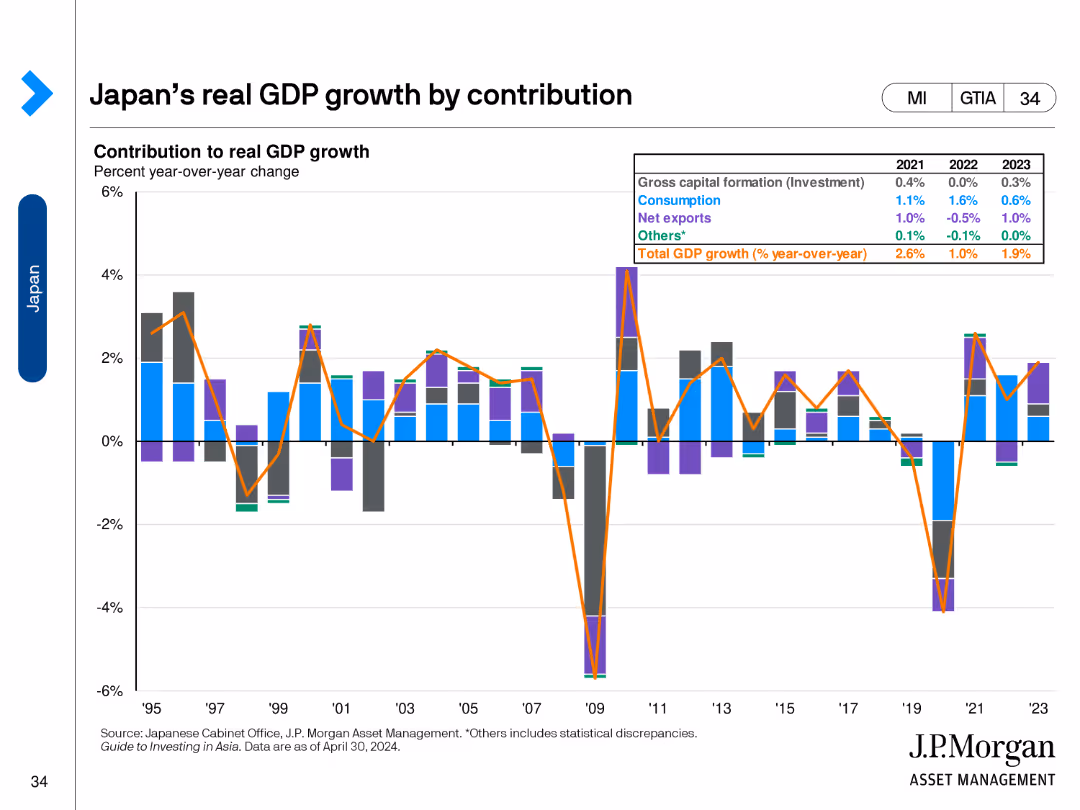
The slide features a stacked column chart illustrating Japan's real GDP growth contributions by investment, consumption, net exports, and other factors over time.
Financial Performance
Financial Services
This slide analyzes Japan's GDP growth contributions from various sectors like investment, consumption, and net exports.
GDP, Japan, Growth, Investment, Consumption
false
Japan’s real GDP growth by contributionGuide to Investing in Asia
Single Chart
JP Morgan
View slide
The slide contains a column chart showing the importance of various aspects like family, work, hobbies, and exercise to Gen Zs and Millennials. It uses a clear layout with balanced text and visual elements.
Human Resources and Talent Management
Professional Services
This slide emphasizes the importance of work in the identity of Gen Zs and Millennials while highlighting the paramount importance of achieving work/life balance. It presents data on what aspects are most important to their sense of identity.
Work identity, balance, Gen Z, Millennials, importance
false
Work is central to Gen Zs and millennials’ identity, but achieving balance is paramount2023 Gen Z and Millennial Survey
Mixed Chart
Deloitte
View slide
A diamond-shaped quadrant with four segments shows Goldman Sachs services, juxtaposed with Orsted’s services on the right.
Organizational Structure and Change
Financial Services
Describes Goldman Sachs' comprehensive service structure and how it supports a local client with global capabilities through different services.
Goldman Sachs, Global Markets, Asset Management, Investment Banking, Client Services, Orsted, Financing, Advising
false
Deliver the Firm: One Goldman SachsGoldman Sachs Investor Day
Header Vertical
Goldman Sachs
View slide
The scatter plot correlates the average years of education completed to GDP per capita PPP across various countries, highlighted by dots labeled with country names.
Market Analysis and Trends
Education & Training
Discussing the correlation between the length of education and economic prosperity measured in GDP per capita PPP in 2020, this slide illustrates significant positive relationships across various countries, with detailed data points.
GDP, education, correlation, economic, prosperity
false
Globally speaking, it pays to stay in education longer Length of education and financial prosperity correlate positively …Roland Berger Trend Compendium 2030: Megatrend 1 People & Society
Single Chart
Roland Berger
View slide
Horizontal bar chart, standard layout similar to previous slides. Bars represent likelihood by country with accompanying change vs 2023.
Risk Assessment and Management
Technology & Software
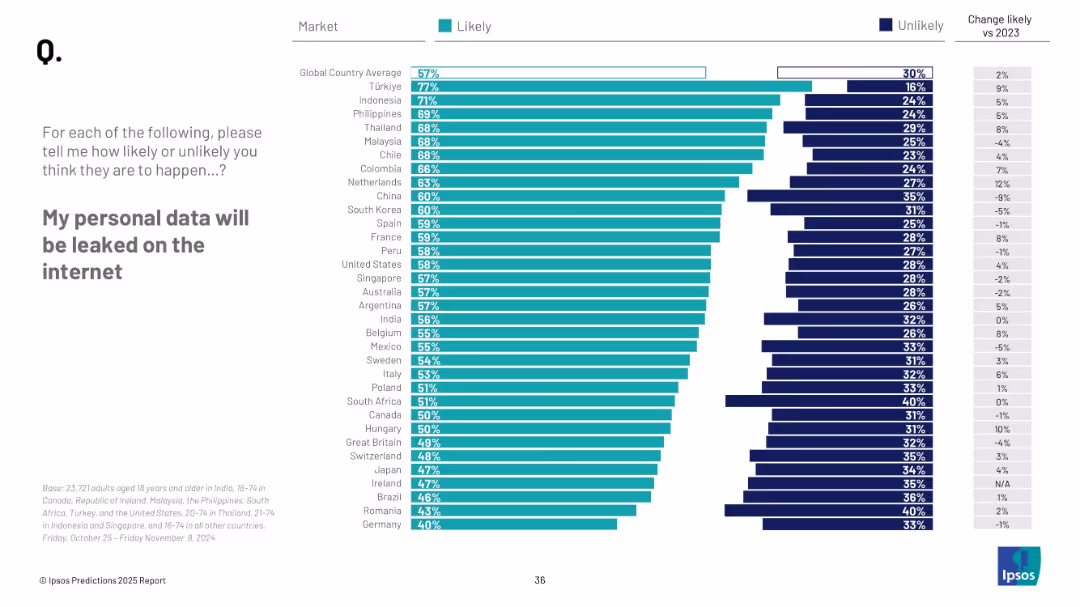
This slide shows concern about personal data breaches across countries. Türkiye, Indonesia, and the Philippines rank highest in concern. The chart indicates a growing trend, with the global average rising slightly compared to 2023.
data breach, cybersecurity, privacy, internet, digital risk
false
My personal data will be leaked on the internetPREDICTIONS 2025 REPORT
Mixed Chart
IPSOS
View slide
The slide features a single, prominent column chart showing growth from 2015 to 2020 with future projections to 2025 for Vietnam's Internet economy, including percentage growth rates.
Market Analysis and Trends
Financial Services
It illustrates the growth of Vietnam's Internet e-Conomy Gross Merchandise Value (GMV), highlighting past performance and future expectations with a Compound Annual Growth Rate (CAGR) analysis.
Internet Economy, Vietnam, Growth, Projections, GMV
false
Vietnam Internet e-Conomy reaches US $14Be-Conomy SEA 2020 At full velocity: Resilient and racing ahead
Single Chart
Bain
View slide
Bold headline, narrative text, CEO quote, and horizontal bar chart of operational priorities
Human Resources and Talent Management
Professional Services
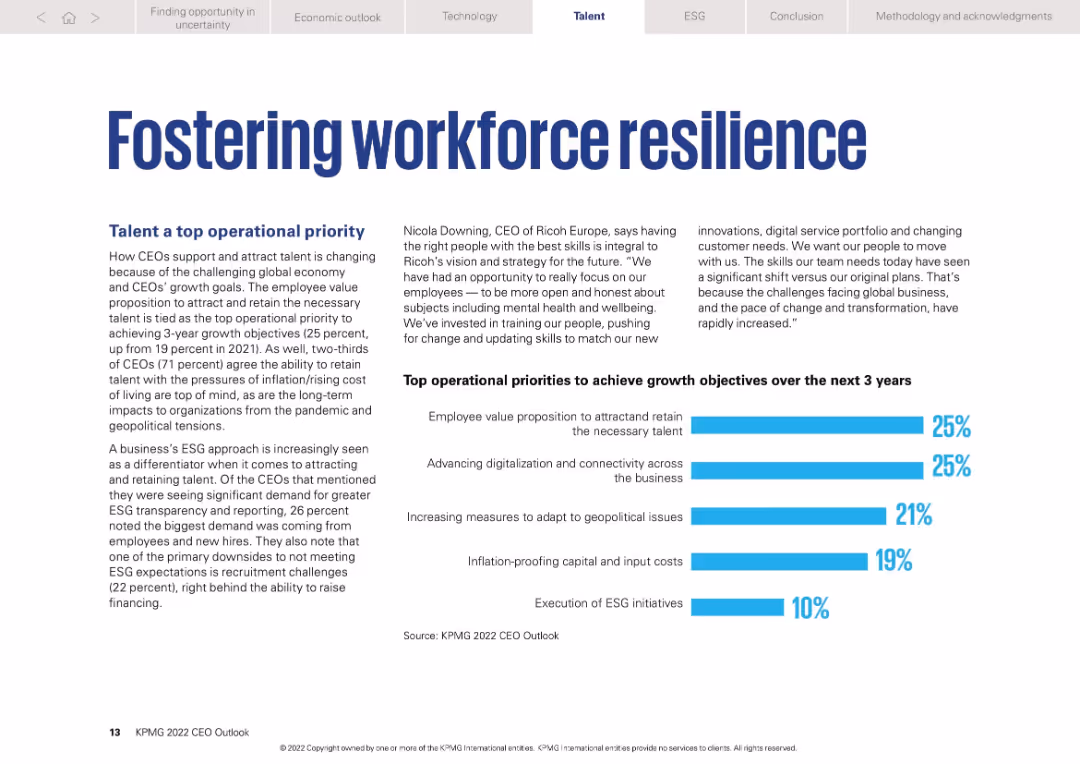
Highlights talent attraction and retention as top CEO priorities. Charts show workforce-related goals (25%) and advancing digitalization (25%) are equally emphasized. Also touches on inflation, ESG, and geopolitics as relevant focus areas.
Workforce resilience, talent strategy, ESG, inflation, CEO priorities
false
Fostering workforce resilienceKPMG 2022 CEO Outlook
Mixed Chart
KPMG
View slide
Horizontal timeline chart showing median and top quartile estimates for various AI capabilities pre- and post-2023; left panel interprets results.
Technology and Digital Transformation
Artificial Intelligence
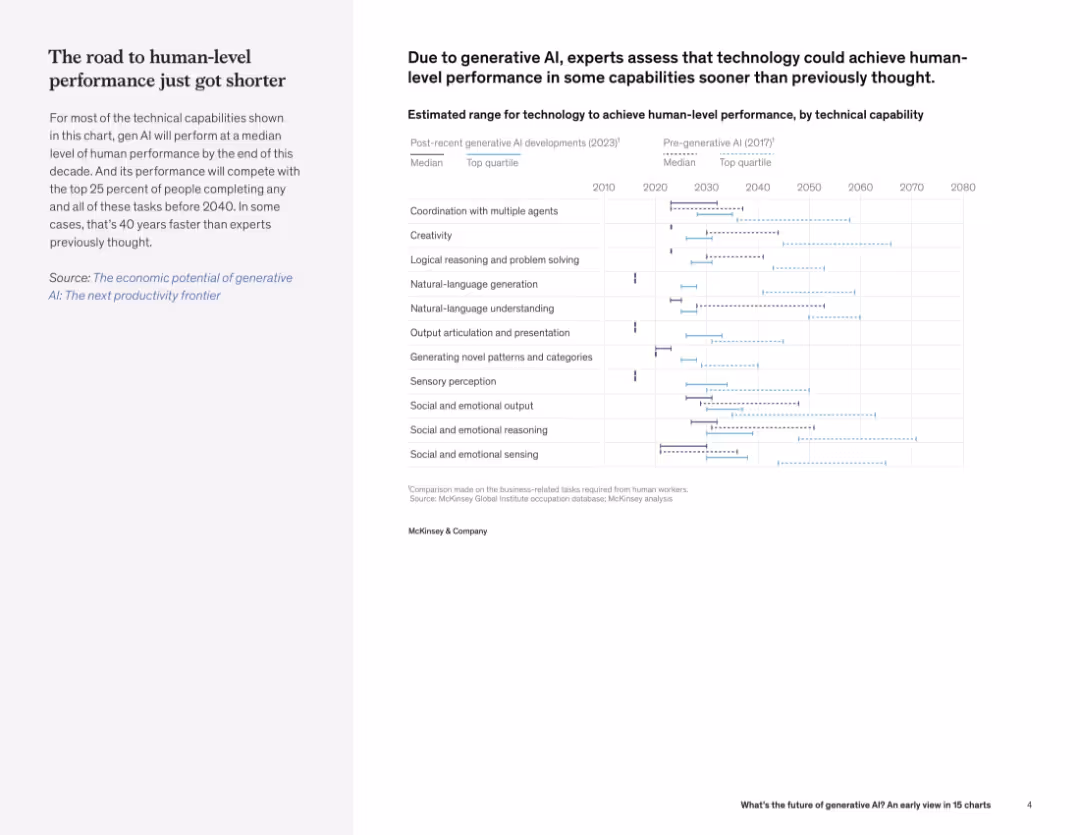
This slide compares projections from 2017 and 2023 regarding when AI will achieve human-level performance in multiple capabilities. It highlights an accelerated timeline due to generative AI advancements.
generative AI, human-level performance, prediction, technical capability, productivity
false
Due to generative AI, experts assess that technology could achieve humanlevel performance in some capabilities sooner than previously thought.What’s the future of generative AI? An early view in 15 charts
Mixed Chart
McKinsey
View slide
The slide includes a column chart that shows the types of risk management roles and functions anticipated to benefit from right-shoring or outsourcing strategies over the next five years.
Operational Efficiency
Financial Services
It discusses which risk management roles and functions, such as quantitative analytics and data management, are expected to be optimized through right-shoring or outsourcing. This slide helps in identifying key areas for operational efficiency improvements.
risk management, roles, functions, right-shoring, outsourcing, efficiency
false
Figure 39. What types of risk management roles and functions do you anticipate will have the greatest opportunity to be optimized through a right-shoring or outsourcing/co-sourcing strategy over the next five years?Risk management in a time of transformation
Mixed Chart
EY
View slide
The slide has a white background with various text boxes and a Venn diagram to illustrate the overlap between nutraceutical, cosmeceutical, and nutra-cosmetical markets.
Market Analysis and Trends
Healthcare & Pharmaceuticals
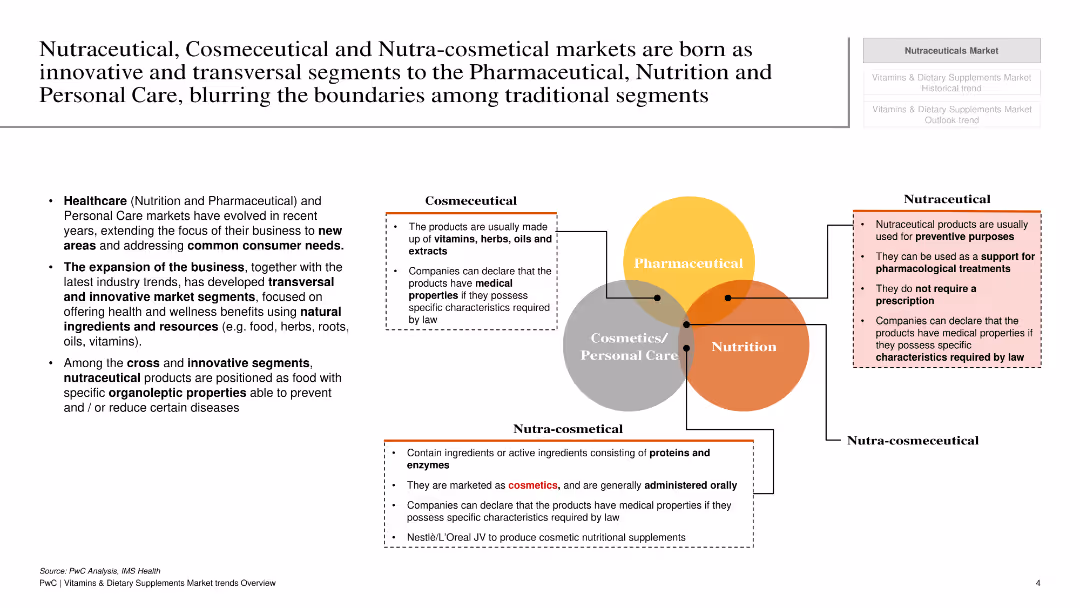
This slide describes the nutraceutical, cosmeceutical, and nutra-cosmetical markets, highlighting their overlap with pharmaceutical, nutrition, and personal care markets.
Nutraceutical, cosmeceutical, markets, healthcare, pharmaceuticals, nutrition, personal care, overlap, segments
false
Nutraceutical, Cosmeceutical and Nutra-cosmetical markets are born as innovative and transversal segments to the Pharmaceutical, Nutrition and Personal Care, blurring the boundaries among traditional segmentsVitamins & Dietary Supplements Market trends - Overview
Diagram
PwC/Strategy&
View slide
The slide showcases a column chart displaying a decrease in branch transactions against an increase in other channel transactions, along with a list of technological levers and movement to more efficient channels.
Operational Efficiency
Financial Services
It contrasts the decline in branch transactions with growth in digital channel usage, underscoring the efficiency driven by technology in banking operations. Ideal for analyzing technology's role in operational efficiency.
Efficiency, Digital Channels, Branch Transactions, Technological Levers, Automation, Process Improvement
false
Technology Driving EfficiencyBBVA - Thinking Ahead Morgan Stanley European Financials Conference 2016
Multiple Chart
Morgan Stanley
View slide
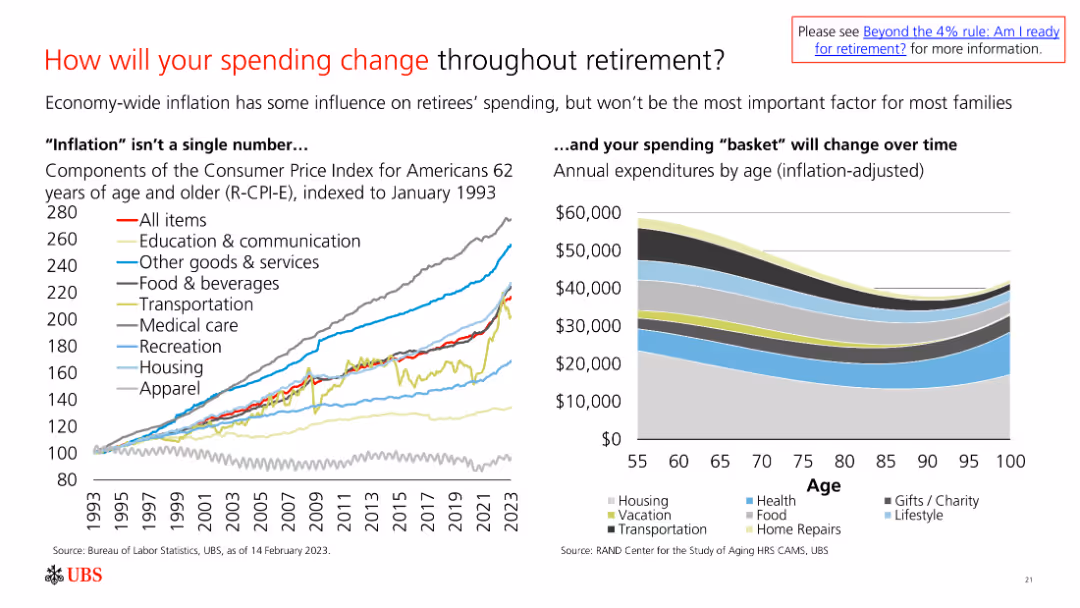
The slide features a line chart showing the Consumer Price Index for different expense categories over time and a bar chart of annual expenditures by age.
Market Analysis and Trends
Financial Services
The slide analyzes spending changes in retirement, influenced by inflation and shifts in expenditure categories, to guide financial planning for retirees.
Retirement, Spending, Inflation, Expenses, Financial Planning
false
How will your spending change throughout retirement?2024 Retirement guidebook
Multiple Chart
UBS
View slide
Tables depict asset distribution by class and region, accompanied by column chart showing asset and net flow changes over time.
Investment Analysis
Financial Services
The slide breaks down firmwide assets under supervision by segment, asset class, and region, with highlights on annual changes. It is useful for assessing investment distributions and monitoring long-term net asset flows.
Assets Under Supervision, Investment, Equity, Fixed Income, Regional Distribution, Net Flows, Asset Class, Financial Analysis, Firmwide Assets
false
Firmwide Assets Under SupervisionFull Year and Fourth Quarter 2019 Earnings Results Presentation
Multiple Chart
Goldman Sachs
View slide
The slide includes three line charts showing Canada y/y real GDP (2012-25F), Canada unemployment rate (2012-25F), and Canada y/y CPI (2012-25F). The charts display historical data and future projections with clear labels and demarcations for important time points.
Market Analysis and Trends
Financial Services
The slide forecasts a slowdown in the Canadian economy through mid-2024, highlighting constraints due to elevated debt servicing costs and cost fatigue. It analyzes trends in GDP, unemployment, and CPI, discussing their implications for economic activity.
Canadian economy, GDP, unemployment, CPI, forecast
false
The Canadian economy is expected to experience a continued slowdown through mid 2024, constrained by elevated debt servicing costs and cost fatigueGlobal economic outlook: finding balance in 2024
Multiple Chart
EY
View slide
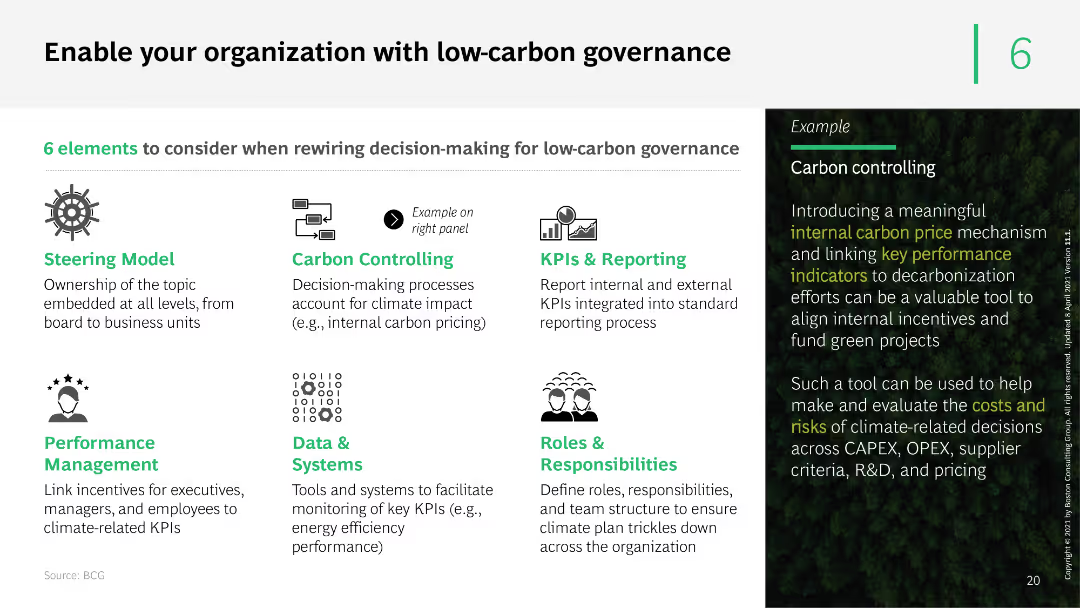
The slide features a series of icons and text boxes outlining six elements of low-carbon governance. It uses a clean layout with green accents to highlight key points and examples of carbon controlling mechanisms.
Organizational Structure and Change
Professional Services
The slide presents six elements to consider for low-carbon governance, including steering models, carbon controlling, KPIs, performance management, data systems, and roles. It provides a practical example of implementing internal carbon pricing.
low-carbon governance, carbon controlling, KPIs, performance management, data systems
false
Enable your organization with low-carbon governanceThe time for climate action is now
Boxed
BCG
View slide
Features logos of various start-ups in the SME services market, categorized by service type, against a cityscape background.
Competitive Landscape
Financial Services
The slide provides a snapshot of the start-up environment in the SME services sector, highlighting the market entry of specialized service providers. It's valuable for discussing the evolving competitive landscape and potential investment opportunities within the SME services space.
SME Services, Start-ups, Market Landscape, Service Providers, Investment Opportunities
false
At the same time, dedicated SME services start-ups are also pursuing the market.Unlocking the next wave of digital growth: beyond metropolitan Indonesia
Header Vertical
Kearney
View slide
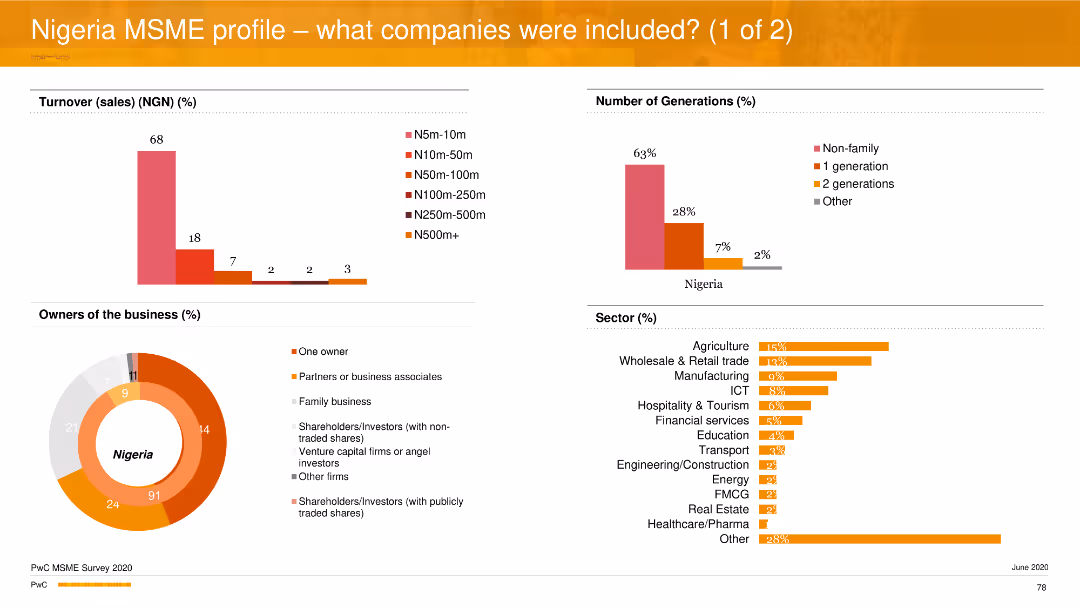
The slide contains multiple column charts and a pie chart to represent various data points about MSMEs in Nigeria. The color scheme is orange, red, and gray, with minimal text.
Market Analysis and Trends
Financial Services
The slide provides an analysis of the Nigerian MSME sector, including turnover, ownership, generations involved in business, and sector distribution.
MSME, Nigeria, turnover, ownership, sectors
false
Nigeria MSME profile what companies were included? (1 of 2)PwC’s MSME Survey 2020 Building to Last
Multiple Chart
PwC/Strategy&
View slide
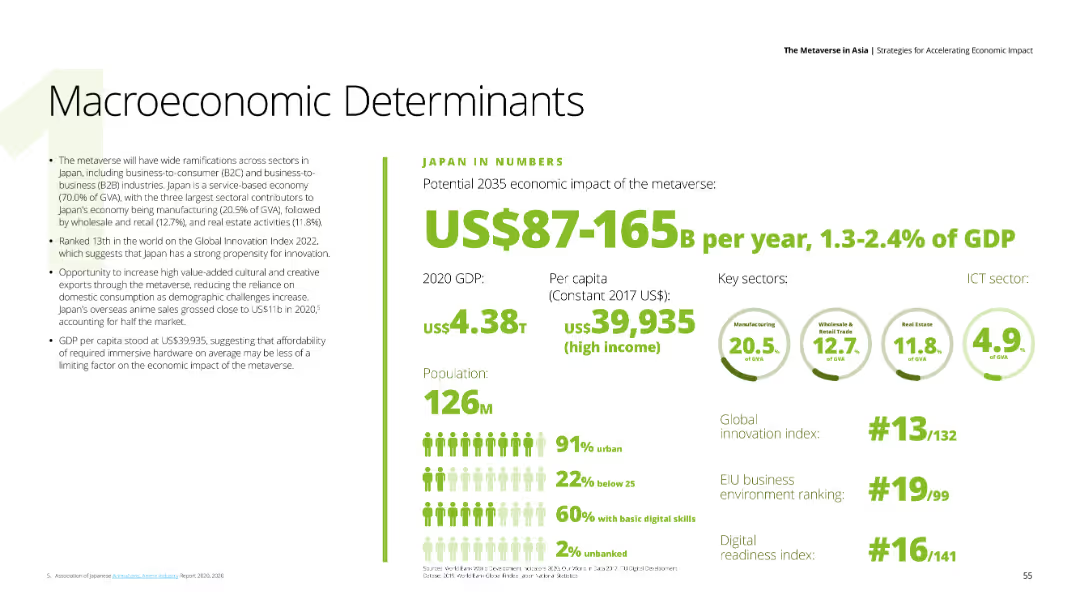
This slide features text on the left detailing economic impacts of the metaverse on Japan, and a section on the right with numerical data and key sectors like manufacturing, wholesale and retail trade, and real estate. The background is white, and the text is in black and green.
Market Analysis and Trends
Financial Services
Highlights the potential economic impact of the metaverse on Japan's GDP by 2035, providing data on GDP, per capita income, and key sectors contributing to the economy.
Japan, metaverse, GDP, economic impact, key sectors
false
Macroeconomic Determinants JAPAN IN NUMBERSThe Metaverse in Asia Strategies for Accelerating Economic Impact
Mixed Chart
Deloitte
View slide
Slide contains a scatter plot with circles representing various banking roles and their potential for automation and productivity gains from AI.
Financial Performance
Financial Services
Analyzes the impact of AI on specific banking roles, highlighting which positions could see the most significant efficiency improvements and automation potential.
banking, AI impact, productivity, automation, financial roles
false
Figure 1: How the top 20 banking industry roles are like to benefit from generative AI.The age of AI: Banking’s new reality
Single Chart
Accenture
View slide
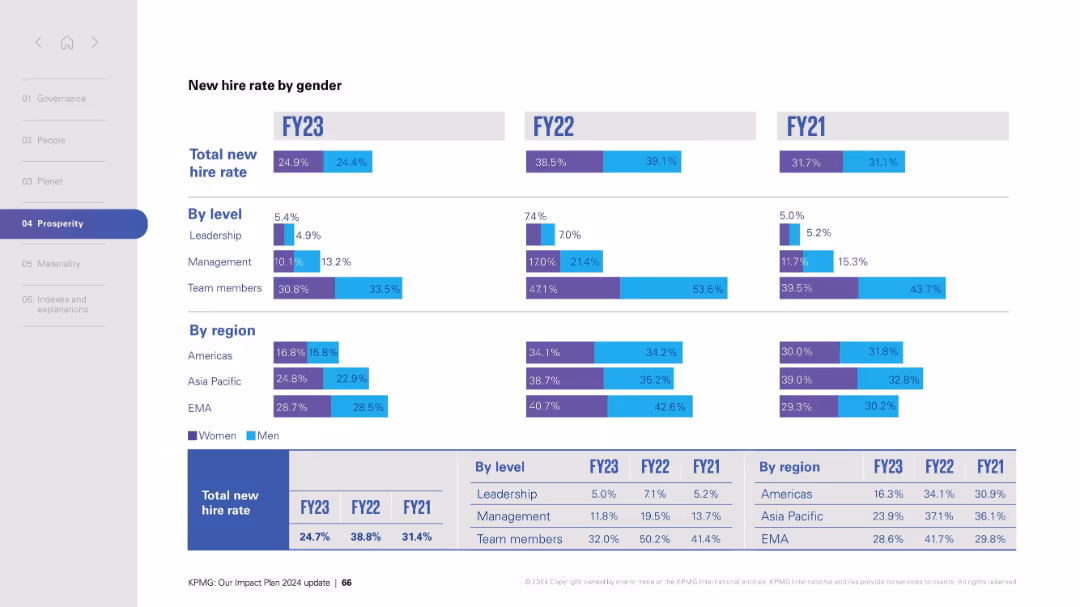
Similar design to previous: horizontal bar graphs by FY, segmented by role and region; rates shown with values.
Human Resources and Talent Management
Professional Services
Breaks down the rate of new hires by gender for three fiscal years. The data is grouped by leadership, management, and team members, and by geographic region. Includes overall new hire rate by gender. Helps track hiring trends and equality initiatives.
new hire rate, gender, inclusion, regions, FY metrics, leadership, hiring trends, HR
false
New hire rate by genderKPMG: Our Impact Plan 2024 update
Mixed Chart
KPMG
View slide
A slide with two sections identifying industries that could be most affected by space technology trends, with icons for visual emphasis.
Technology and Digital Transformation
Telecommunications
Identifies telecommunications and aerospace and defense as key industries affected by space tech, and explores emerging use cases across various sectors.
telecommunications, aerospace, defense, industry impact, space technology use cases
false
What industries could be most affected by the trend?McKinsey Technology Trends Outlook 2022 Future of space technologies
Boxed
McKinsey
View slide
The slide presents a comparative analysis of priorities across various industries, with bar charts showing certainty levels for different priorities per industry.
Strategic Planning
Professional Services
It provides a summary of the key priorities in different industries, comparing the levels of certainty for each priority, offering a strategic planning overview.
Priorities, industries, comparative analysis, certainty, strategic planning, overview
false
Summary of priorities across industries Priorities in 2019 by industry (1/10th Operations Efficiency Radar
Multiple Chart
Roland Berger
View slide
The slide includes a line graph tracking investor sentiment over time. It contrasts views on the stock market and the economy, with textual annotations explaining key trends and dates.
Market Analysis and Trends
Financial Services
Analyzes investor sentiment shifts regarding the stock market and economy, noting particularly low bullishness. Useful for market trend analysis and investment strategy planning.
Investor Sentiment, Bearish Trends, Bullish Sentiment, Stock Market, Economy, Market Analysis, Investment Strategy, Trend Tracking, Economic Outlook, Sentiment Change
true
Investors are more bearish on the stock market and economy, with bullish sentiment among its lowest levelsBCG Investor Perspective Series: Pulse Check #21
Single Chart
BCG
View slide
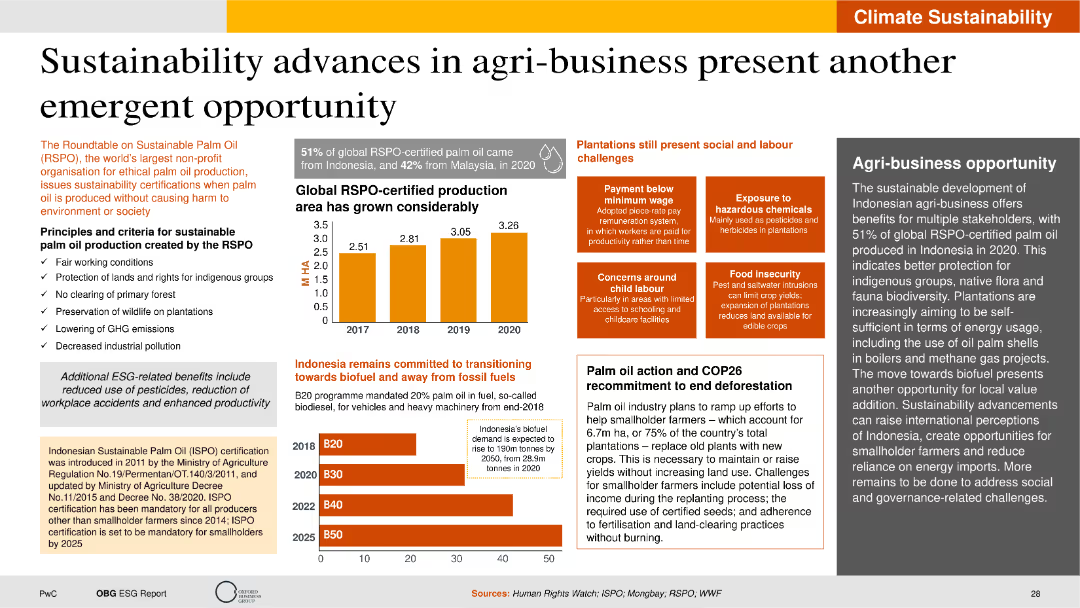
This slide includes column charts and text boxes with a clear and structured layout. Visual elements focus on RSPO-certified palm oil production growth and associated benefits and challenges.
Market Analysis and Trends
Agriculture & Food Production
The slide discusses the advancements in sustainability within Indonesia's agri-business sector, specifically focusing on the production of RSPO-certified palm oil. It provides data on production growth, the principles and criteria for sustainable palm oil production, and the benefits of ESG-related practices. The slide also highlights the challenges faced by plantations, such as payment below minimum wage and exposure to hazardous chemicals, along with future commitments towards biofuel.
Sustainability, agri-business, RSPO certification, palm oil, ESG practices
false
Sustainability advances in agri-business present another emergent opportunityIndonesia’s Sustainable Transformation
Multiple Chart
PwC/Strategy&
View slide
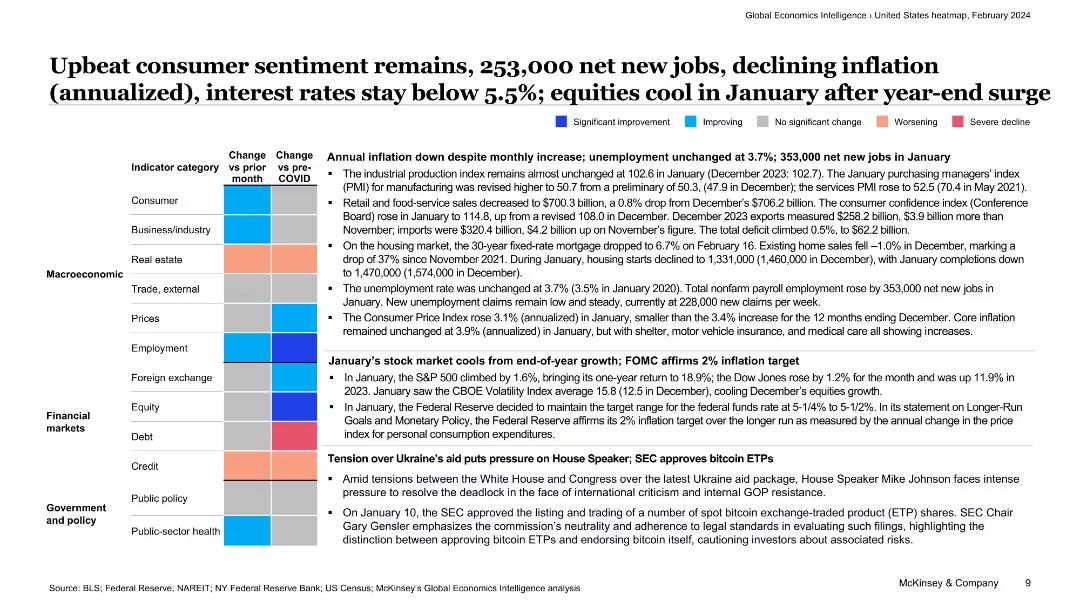
The slide features a colorful table summarizing key economic indicators with text providing context on consumer sentiment, job creation, and inflation trends.
Market Analysis and Trends
Financial Services
This slide presents an overview of the US economy, highlighting consumer sentiment, job creation, and inflation, supported by a detailed table of economic indicators.
consumer sentiment, jobs, inflation, economy, financial services, overview, trends, economic indicators, analysis, market conditions
false
Upbeat consumer sentiment remains, 253,000 net new jobs, declining inflation (annualized), interest rates stay below 5.5%; equities cool in January after year-end surgeGlobal Economics Intelligence January 2024
Table
McKinsey
View slide
Moderate visual complexity with a mix of text, numerical data, and an engaging photo.
Market Analysis and Trends
Financial Services
Highlights Southeast Asia's lead in adopting future tech and fintech, and how investments are trending upwards, which serves as a guide for investment decisions.
fintech, technology, investment, Southeast Asia, growth
false
Southeast Asia’s GDP outpacing most other markets and holding steady against inflationSoutheast Asia's digital consumers: A new stage of evolution
Multiple Chart
Bain
View slide
Bar charts displaying the increase in marketing spending on Diversity, Equity, and Inclusion (DE&I) across different company sizes and sectors, with annotations for top and bottom industry sectors.
Customer and Market Segmentation
Professional Services
Analyzes the spending trends on diversity, equity, and inclusion within marketing departments, highlighting increased investment particularly in larger companies and certain sectors. Offers a breakdown by company size and sector.
DE&I, Marketing, Spending Increase, Column Chart, Company Size, Industry Sectors, Investment Trends
false
Companies spend more on DE&I in marketing across the board, with big companies making the biggest increasesThe CMO Survey Marketing in a Post Covid Era
Multiple Chart
Deloitte
View slide
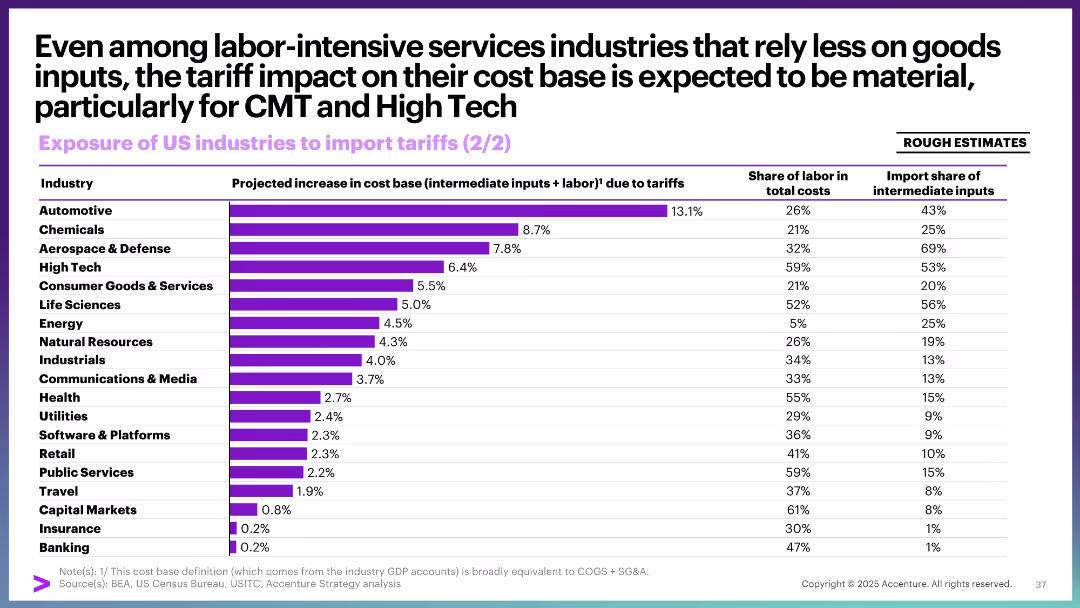
Horizontal bar chart with three data columns: cost impact, labor share, import share
Risk Assessment and Management
Industrial & Manufacturing
This slide analyzes the broader cost base impact of tariffs, even for labor-intensive sectors. It includes data on cost increases, labor share of total costs, and the import share of inputs. High Tech, Aerospace, and Automotive show significant cost increases.
cost base, tariffs, labor-intensive, input costs, import dependency, industry impact
false
Even among labor-intensive services industries that rely less on goods inputs, the tariff impact on their cost base is expected to be material, particularly for CMT and High TechApril Macro Brief: Special edition Tariff distress
Single Chart
Accenture
View slide
Contains multiple bar graphs and textual analysis. Utilizes a clean, professional layout focusing on M&A trends in the Philippines, including top bidders and deal values.
Mergers and Acquisitions
Financial Services
Provides a detailed analysis of domestic and inbound M&A in the Philippines, including major deals and sector breakdown for top bidders from 2018 to 2020.
M&A, Philippines, domestic, inbound, deal analysis, sectors, bidders
false
Domestic The Philippine M&A space continues to be dominated by domestic investors, although local deals are at their lowest in a three-year period, closing at 21 deals.Doing business in the Philippines 2021
Mixed Chart
Deloitte
View slide
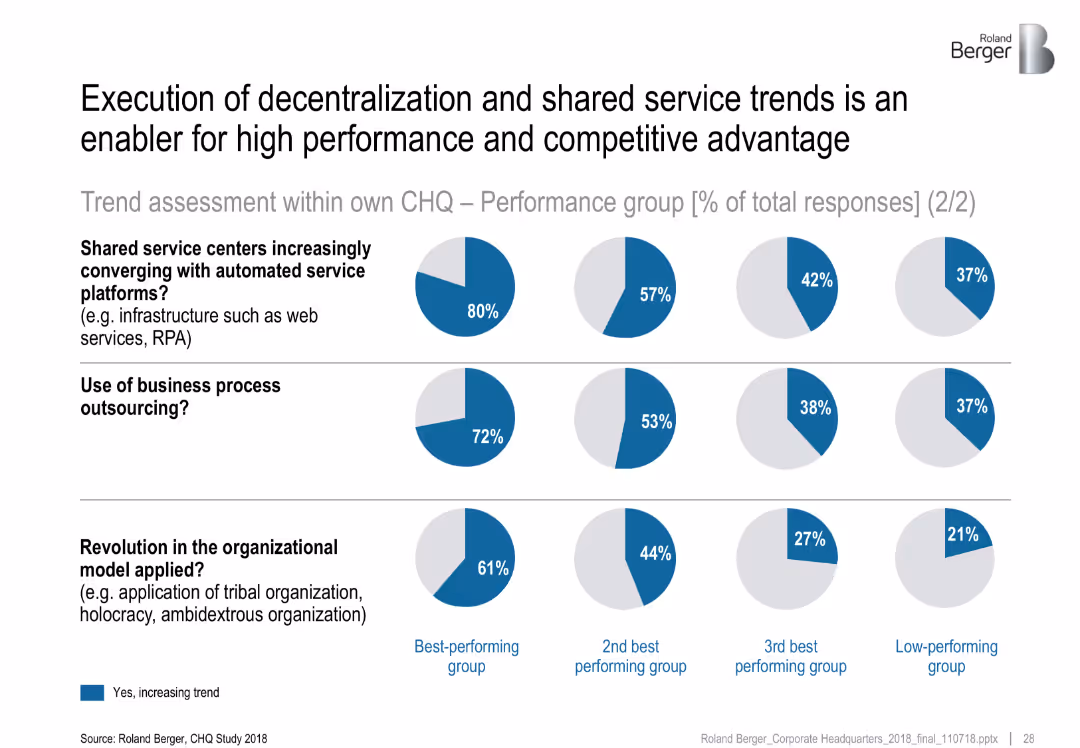
Continuation of prior slide format with three rows comparing trend adoption across performance groups. Blue pie charts indicate perceived increases.
Strategic Planning
Professional Services
This slide reinforces the link between strategic CHQ trends and high performance. It shows that top-performing companies are significantly more likely to adopt automated service platforms, business process outsourcing, and innovative organizational models.
decentralization, competitive advantage, RPA, CHQ, shared services, organizational change
false
Execution of decentralization and shared service trends is an enabler for high performance and competitive advantageCorporate Headquarters Study 2018
Multiple Chart
Roland Berger
View slide
This slide presents a clear title, a large column chart depicting growth in the home improvement market, and additional circular icons with percentages and brief descriptions. The design utilizes a consistent green and gray color scheme to aid in data presentation.
Market Analysis and Trends
Consumer Goods
Analyzes the temporary growth and expected decline in the home improvement sector during and post-COVID-19. It highlights the surge in market activity during 2020 due to increased consumer spending on home upgrades, with projections for normalization as the pandemic impact diminishes.
home improvement, market trends, COVID-19, consumer spending, retail impact, growth analysis, data chart
false
Home improvement: demand surged in 2020 as consumers "forward bought," followed by 2021 decline – market likely to recover by next yearHow COVID-19 Changed the Consumer
Mixed Chart
BCG
View slide
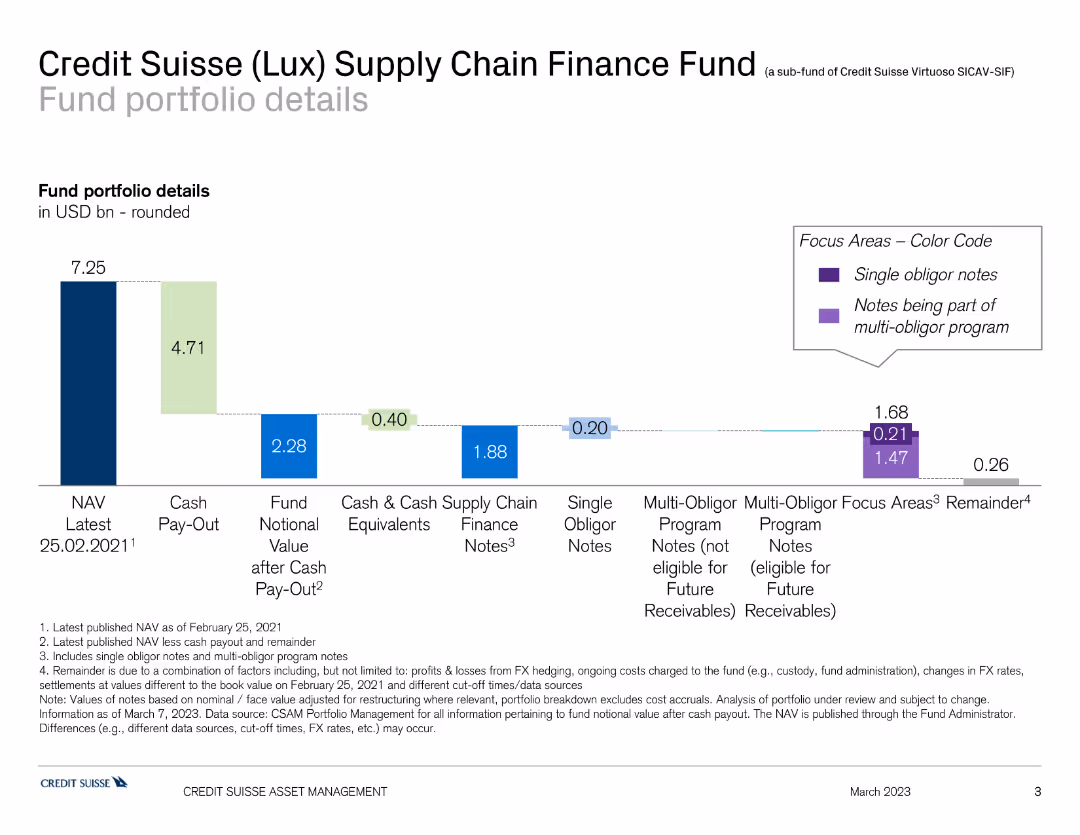
This slide shows a bar chart detailing the fund portfolio of the Credit Suisse Supply Chain Finance Fund, with different colors indicating various components such as NAV, cash pay-out, and finance notes.
Investment Analysis
Financial Services
The slide provides an overview of the Credit Suisse Supply Chain Finance Fund's portfolio, showing asset allocation and financial status. It is used for fund analysis and investment review.
finance, supply chain, portfolio, Credit Suisse, fund analysis
false
Credit Suisse (Lux) Supply Chain Finance FundSupply Chain Finance Funds (SCFF)
Single Chart
Credit Suisse
View slide
Combines U.S. map, column chart, and bullet points to discuss growth strategies in wealth management.
Sales and Business Development
Financial Services
Details JPMorgan's approach to capturing U.S. wealth management market potential, highlighting growth from digital solutions and advisors.
Wealth management, US market, growth opportunity, digital solutions, client advisors, market capture
false
U.S. Wealth Management: Growing from a position of strengthAsset & Wealth Management 2020
Mixed Chart
JP Morgan
View slide
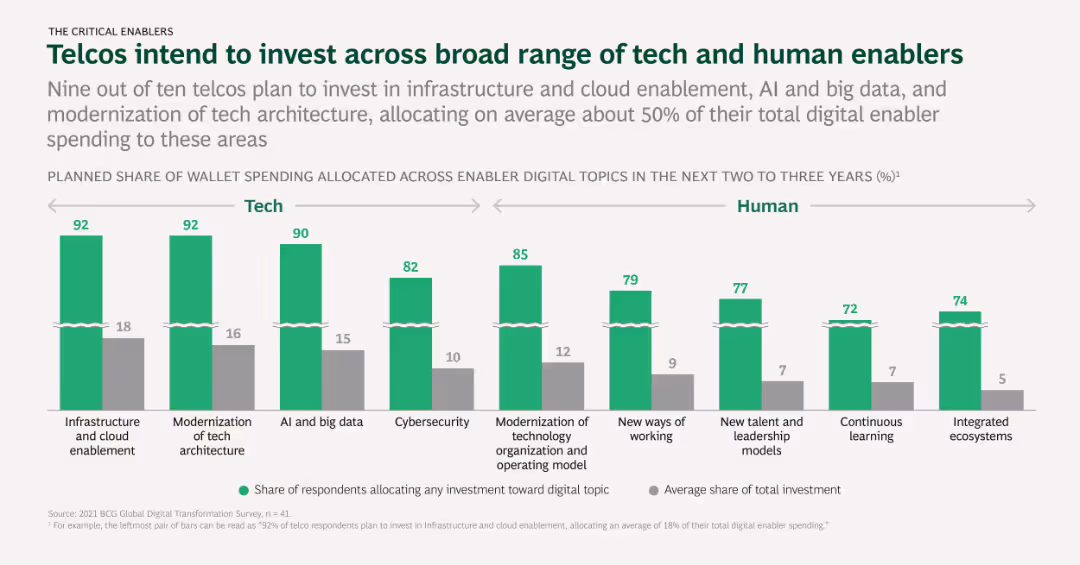
Column chart illustrating telcos' planned investments across tech and human enablers, with percentages indicating allocation and average investment shares.
Investment Analysis
Telecommunications
The slide presents telcos' planned investments in various tech and human enablers over the next two to three years, such as AI, big data, and talent development.
Tech investment, Human enablers, AI, Big data, Talent development
false
Telcos intend to invest across broad range of tech and human enablersTELECOMMUNICATIONS The Rates of Success, Goals, and Future Priorities of Digital Transformations, by Sector
Mixed Chart
BCG
View slide
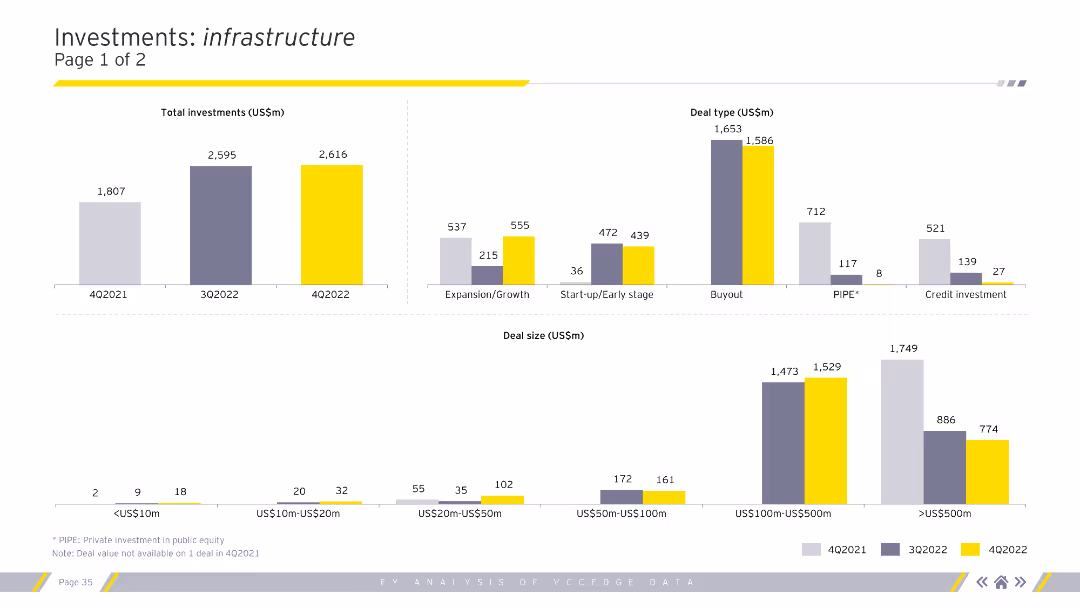
The slide contains column charts showing total investments, deal types, and deal sizes specifically for the infrastructure sector across different quarters. Charts are color-coded for clarity.
Market Analysis and Trends
Financial Services
This slide focuses on infrastructure investments, detailing the total amount invested, types of deals, and sizes, providing a comprehensive view of investment trends in this sector.
Infrastructure, investments, deal types, deal sizes
false
Investments: infrastructurePage 1 of 2Is private equity rewriting what value means? Explore the emergence of NextWaveprivate equity and its impact on the economy and society
Multiple Chart
EY
View slide
Light background with yellow title banner, text-heavy content, and a bubble chart comparing 2023 IPO markets with the 5-year average.
Market Analysis and Trends
Financial Services
This slide examines the rise of new IPO markets like Indonesia, Malaysia, and Turkey, while traditional markets like Hong Kong face challenges. It includes a bubble chart visualizing IPO market performance relative to the 5-year average.
IPO markets, high-growth, traditional markets, performance, 2023
false
New hotspot markets outpaced traditional IPO powerhousesWith the market in flux, how can your IPO journey stay the course?
Mixed Chart
EY
View slide
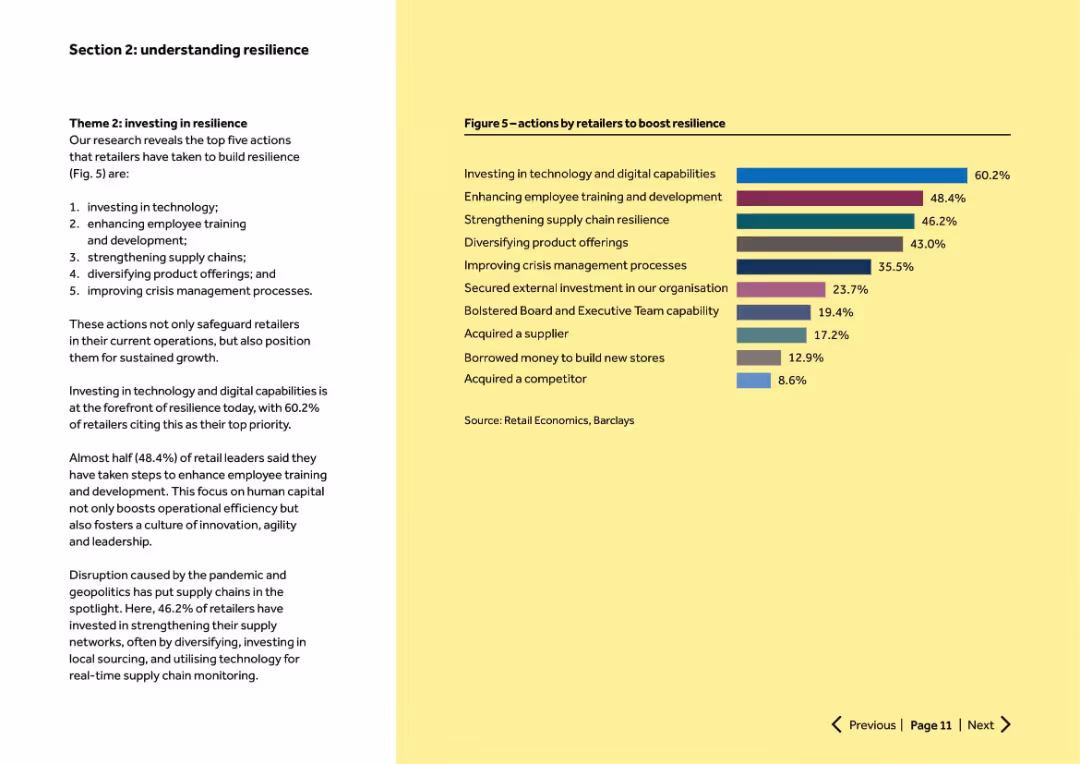
Left column text outlines top 5 resilience actions. Right side has a horizontal bar chart showing % adoption of actions.
Human Resources and Talent Management
Retail & E-commerce
Highlights top retailer resilience strategies: investing in technology, employee training, supply chain strengthening, product diversification, and crisis management. Shows relative importance of each initiative via survey percentages.
resilience, training, tech investment, crisis management, supply chain
false
Section 2: understanding resilience – Theme 2Retail resilience How well does your business navigate through challenges?
Mixed Chart
Barclays
View slide
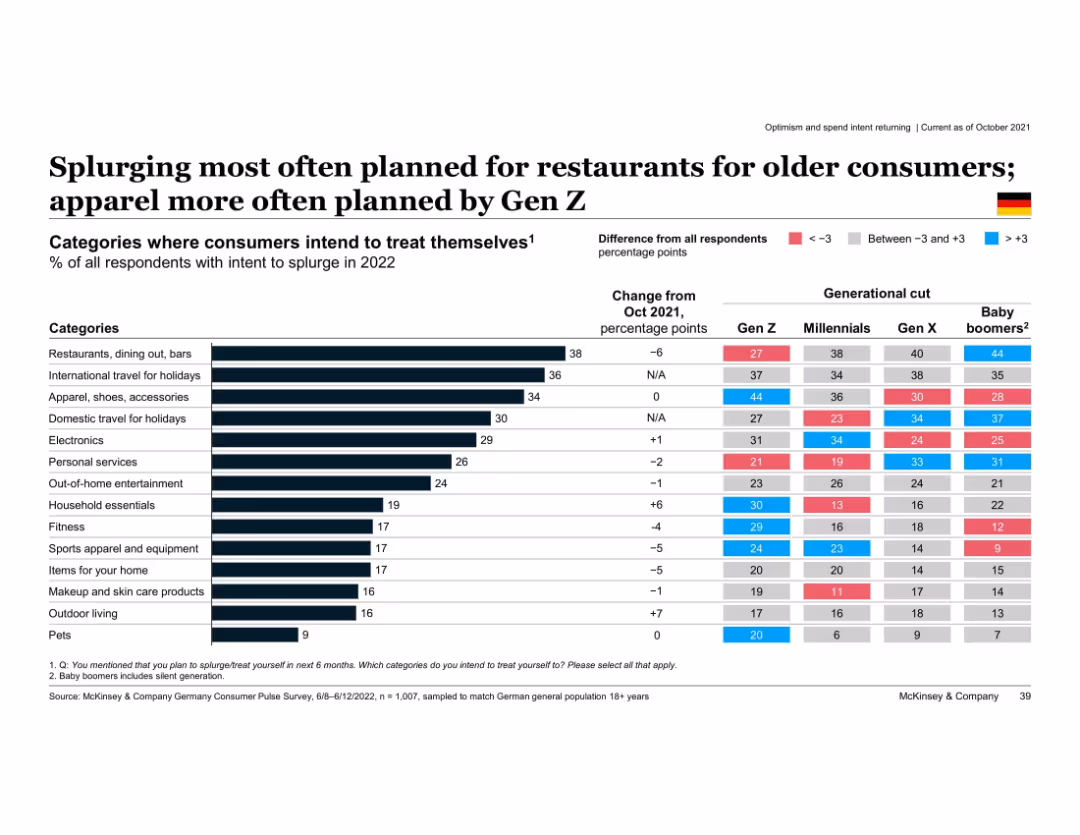
Horizontal bar chart with category-wise splurge intent; includes generational differences
Customer and Market Segmentation
Consumer Goods
Shows intended splurge categories for 2022 by generation. Older groups prioritize restaurants and holidays, while Gen Z favors apparel. Color-coded differences indicate deviation from average.
splurge intent, restaurants, apparel, generational differences, Gen Z, Baby Boomers, Germany, 2022 spending plans
false
Splurging most often planned for restaurants for older consumers; apparel more often planned by Gen ZEuropean Consumer Sentiment Survey: How current events in Europe are shaping consumer behavior
Multiple Chart
McKinsey
View slide
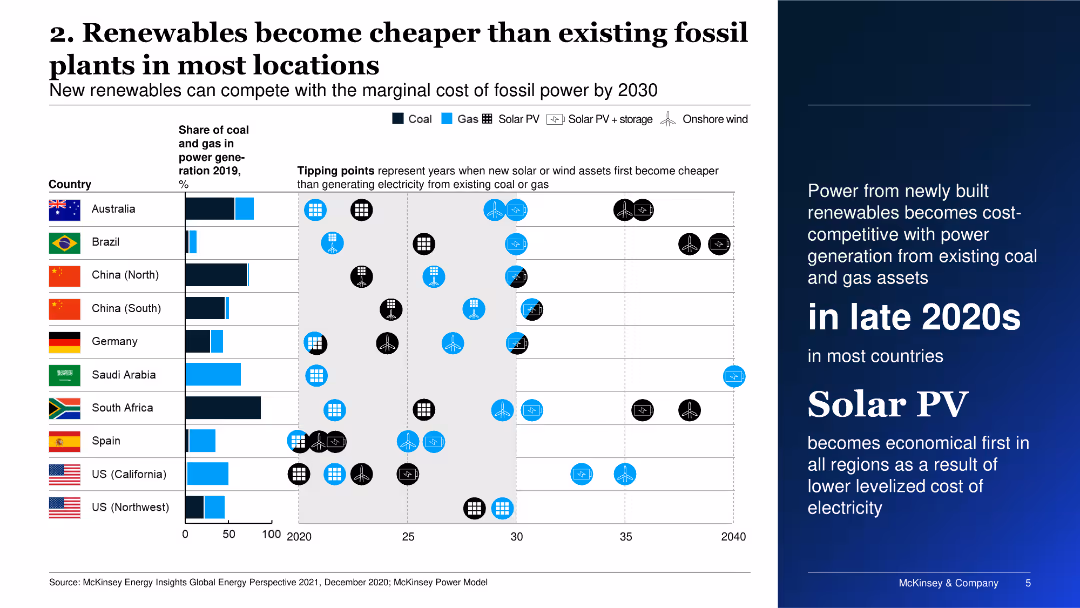
The slide includes a bar chart showing the break-even production cost of clean hydrogen versus incumbent technology across various sectors.
Technology and Digital Transformation
Energy & Utilities
The slide evaluates the cost-competitiveness of clean hydrogen in different sectors, emphasizing the potential for hydrogen to become competitive by 2030.
clean hydrogen, cost-competitive, sectors, 2030, energy
false
2. Renewables become cheaper than existing fossil plants in most locationsGlobal Energy Perspective 2021
Mixed Chart
McKinsey
View slide
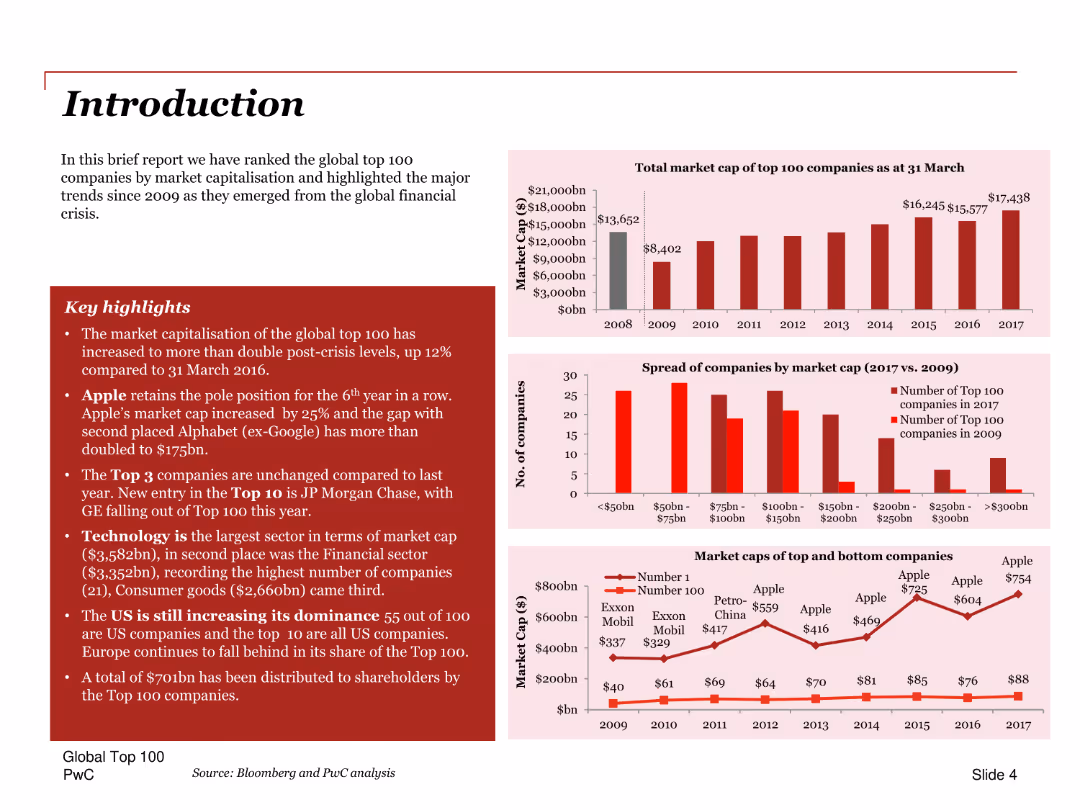
A title slide with an introduction to a report, featuring key highlights and column charts showing market capitalization trends.
Industry Overview
Technology & Software
Introduces the report on the global top 100 companies by market capitalization, highlighting key trends and changes since 2009. Includes insights on technology sector dominance.
Introduction, market capitalization, trends, global top 100, key highlights, technology, financial crisis, market trends
false
Introduction In this brief report we have ranked the global top 100 companies by market capitalisation and highlighted the major trends since 2009 as they emerged from the global financial crisis.Global Top 100 Companies by market capitalisation
Multiple Chart
PwC/Strategy&
View slide
Features line charts comparing mobility and spending trends in states that reopened early versus late during the pandemic.
Risk Assessment and Management
Transportation & Logistics
Highlights the impact of early versus late reopening on state mobility and spending, suggesting greater variability in spending with earlier reopening schedules.
Reopening, Mobility, Spending, COVID-19, Variability
false
Early reopen states saw rise in mobility, but greater variability in spendingCovid 19: Briefing Materials
Multiple Chart
McKinsey
View slide
Column chart showing agreement percentages for simplicity and solitude by age groups.
Market Analysis and Trends
Government & Public Sector
This slide examines the importance of simplicity and solitude, noting a decline in the desire for solitude with age.
simplicity, solitude, age differences, lifestyle, emotional trends
false
Simplicity is important to everyone, though the desire for solitude declines with ageA NEW WORLD DISORDER?
Multiple Chart
IPSOS
View slide
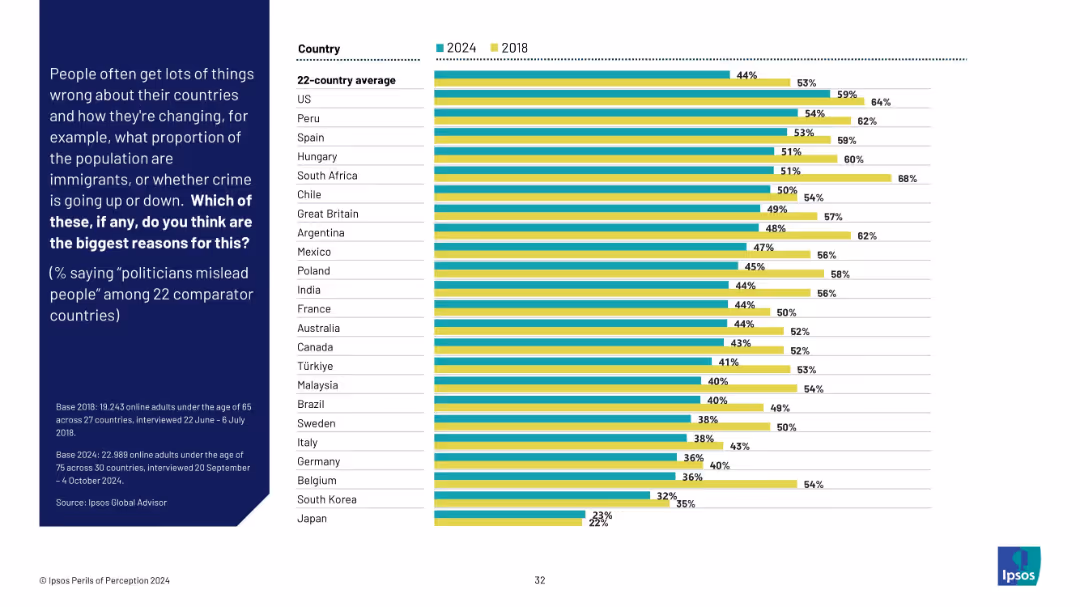
Grouped bar chart of 2024 vs 2018 showing belief that politicians mislead people. Ranked by country with noticeable shifts.
Market Analysis and Trends
Government & Public Sector
This slide tracks belief that politicians are misleading the public. While the global average decreased slightly from 2018, high distrust remains prominent in countries like the US, Peru, and Spain.
political trust, misinformation, public opinion, trend analysis, survey data, Ipsos, international governance
false
% saying "politicians mislead people" among 22 comparator countriesPERILS OF PERCEPTION
Mixed Chart
IPSOS
View slide
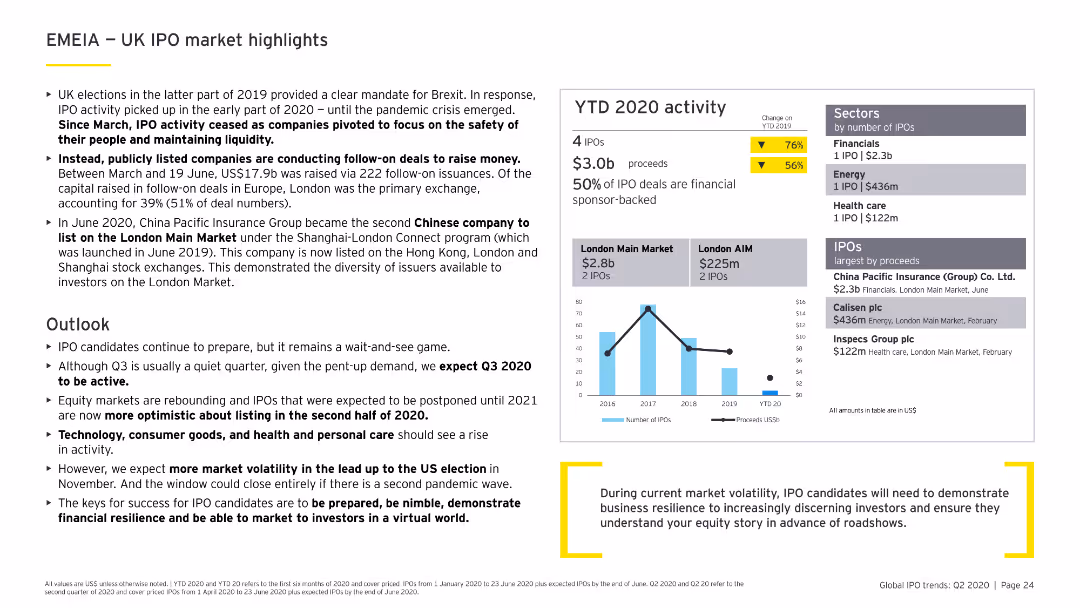
Features column charts, data tables, and bullet points. The slide is moderately dense with a clear layout, focusing on the UK's IPO market activities and highlights.
Market Analysis and Trends
Financial Services
Discusses the impact of Brexit and COVID-19 on the UK IPO market, including sector performance, major IPOs, and future market expectations for the latter half of 2020.
UK, IPO, Brexit, COVID-19, market highlights
false
Europe, Middle East, India and Africa IPO market outlook We expect to see a rebound in IPO activityin the second half of 2020.Is your equity story adapting to the new norm?
Multiple Chart
EY
View slide
A split design with infographics and key statistics.
Technology and Digital Transformation
Professional Services
The slide presents a comparative analysis of how technology is changing work practices and the implications for organizations.
Future of Work, Technology, Organizations, Change, Comparative Analysis
false
The Future of How work gets doneFuture of Work - How work is enabled?
Framework
Deloitte
View slide
Features a central circular graphic, with color coding to differentiate segments. The design is clear and emphasizes market share growth and key metrics, with distinct sections for clarity.
Strategic Planning
Financial Services
The slide illustrates Goldman Sachs’ market share growth and key growth initiatives within their client franchise. It is useful for strategic presentations or investor relations, showcasing performance and outlining strategic goals.
client franchise, market share, growth, Goldman Sachs, investment banking, global markets
false
Premier Client Franchise Driving Share Gains and GrowthGoldman Sachs Strategic Update
Framework
Goldman Sachs
View slide
Slide contains column chart and data points representing financial performance metrics for FY23.
Financial Performance
Financial Services
Detailed annual financial performance review of FY23, focusing on key metrics such as RoTE, income, and costs, beneficial for financial analysis and shareholder reports.
financial, performance, RoTE, income, costs
false
FY23: Group RoTE of 10.6%1 with profit before tax of £7.5bn1FY 2023 Results Announcement
Mixed Chart
Barclays
View slide
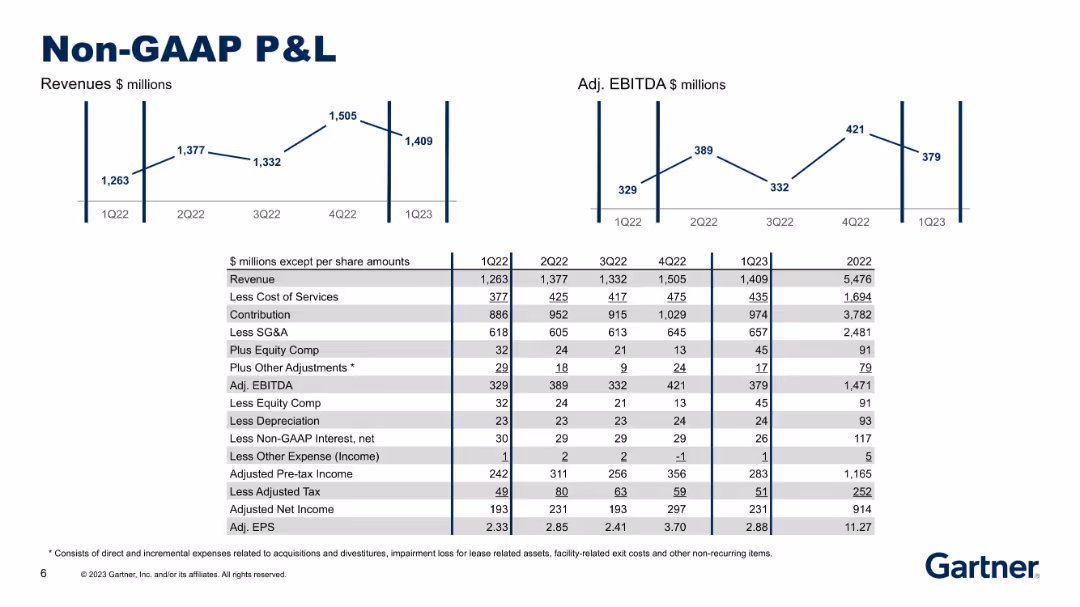
Two simple charts (Revenue, EBITDA) on top, detailed income statement table below showing adjustments to derive Non-GAAP metrics.
Financial Performance
Technology & Software
Illustrates a Non-GAAP profit and loss view with adjustments for SG&A, equity comp, and other items. Breaks down income from revenue to EPS, showing EBITDA as a key metric and providing a bridge to adjusted earnings.
non-GAAP, EBITDA, P&L, revenue, adjusted EPS, SG&A, financials
false
Non-GAAP P&LFirst Quarter 2023 Results
Multiple Chart
Gartner
View slide
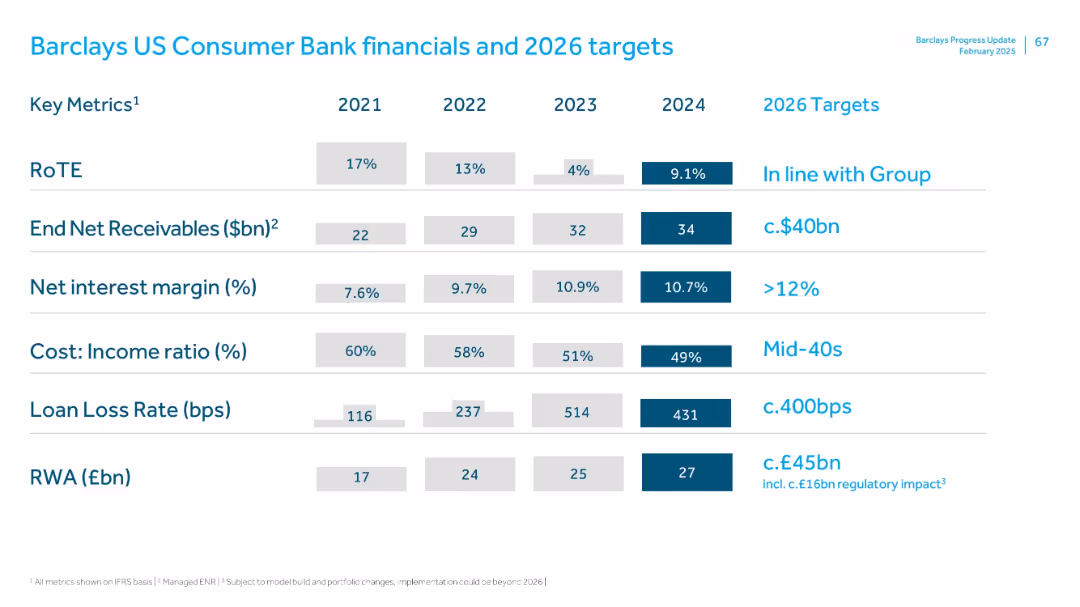
Key metrics table (2021–2024), color-coded with emphasis on 2024 and 2026 targets; blue and white minimalist layout
Financial Performance
Financial Services
The slide reviews US Consumer Bank metrics like RoTE, net receivables, net interest margin, cost-income ratio, loan loss rate, and RWA. 2026 targets aim for margin >12%, lower cost ratios, and manageable loan loss rates. Consistent growth in net receivables and RWA is shown.
US Consumer Bank, receivables, net interest margin, RoTE, loan loss, RWA
false
Barclays US Consumer Bank financials and 2026 targetsFY 2024 Results Presentation
Single Chart
Barclays
View slide
Contains a two-column layout with a column chart for dividends per year on the left and a block of text with figures on share buybacks on the right.
Financial Performance
Financial Services
Displays dividend payments from 2020 to 2023 and details on share buyback in 2023, emphasizing shareholder value creation through dividends and share buybacks.
dividends, shareholder value, buyback, financials, growth
false
VALUE CREATION FOR OUR SHAREHOLDERSINTRODUCTION TO IPSOS
Mixed Chart
IPSOS
View slide
The slide uses a structured format with headers and bullet points under each of the seven steps, describing the actions associated with each phase of social impact reporting.
Regulatory and Compliance
Telecommunications
This slide outlines a structured seven-step approach for assessing social impact, using NBN Co as a case study, highlighting industry-referenced frameworks.
social impact, NBN Co, frameworks, reporting, case study, structured approach
false
The seven-step approach, based on industry referenced frameworks, guides NBN Co through necessary stages to report on its social impactThe economic and social impact of investment in the nbn network Methodology Report
Linear Flow
Accenture
View slide
Two-column layout with bar and line charts showing real GDP growth in selected economies and the higher for longer inflation scenario.
Strategic Planning
Financial Services
Discusses the risks of delayed monetary easing and sticky inflation trends leading to potential recessionary conditions in advanced economies.
monetary easing, inflation trends, recession, advanced economies, central banks
false
A “higher for longer” scenario: A delayed easing cycle by central banks amid sticky inflation trends could lead to recessionary conditions in key advanced economiesMacroeconomic outlook and impact on businesses
Multiple Chart
EY
View slide
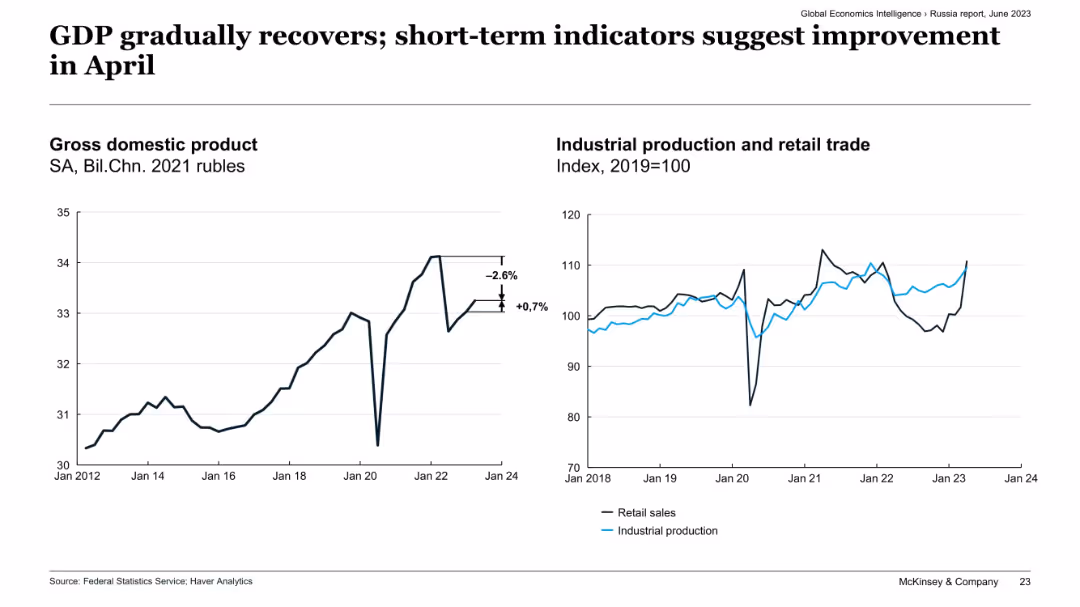
Side-by-side charts: GDP trend (left) and indexed industrial production vs. retail trade (right), Russia.
Market Analysis and Trends
Government & Public Sector
The slide shows a slight recovery in Russia's GDP and industrial output, following prior contractions. Retail sales and industrial production indicators show signs of improvement as of April, suggesting short-term economic stabilization despite previous volatility.
Russia economy, GDP recovery, industrial production, retail trade, short-term indicators, April improvement, economic stabilization
false
GDP gradually recovers; short-term indicators suggest improvement in AprilGlobal Economics Intelligence June 2023
Multiple Chart
McKinsey
View slide
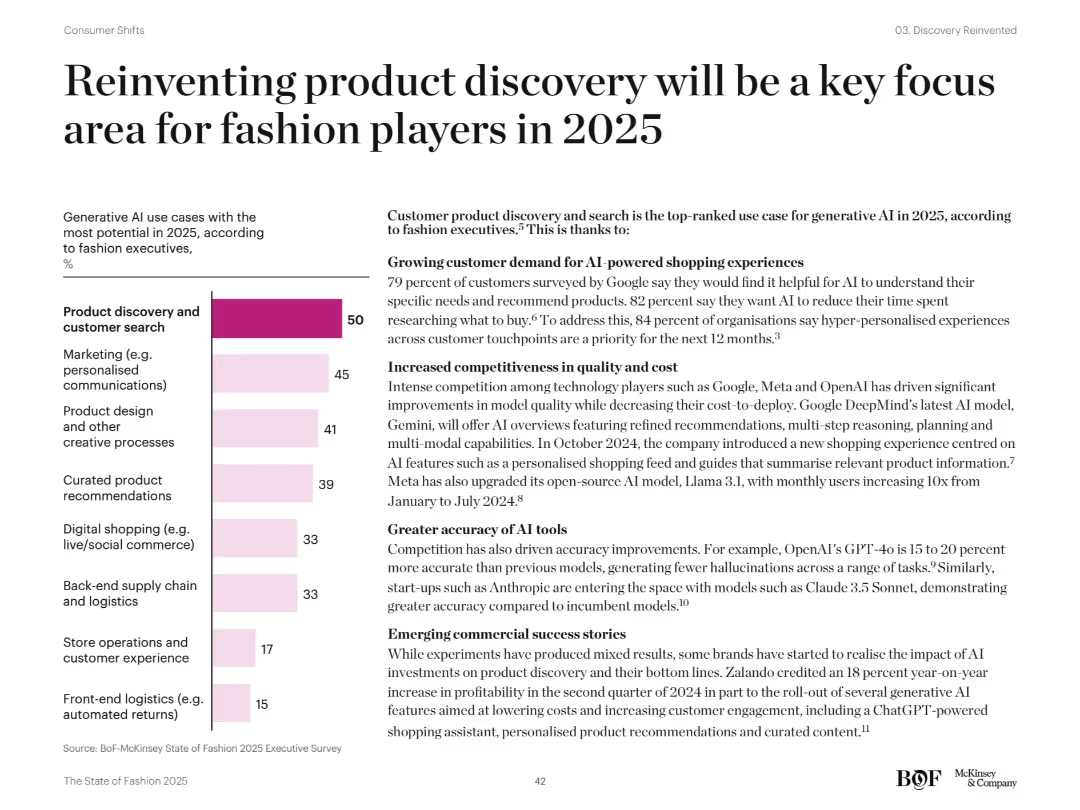
Two-column layout with left bar chart and right-aligned text. Uses black and pastel colors. Bar chart ranks AI use cases by importance. Right side includes detailed bullet points with bolded subheadings.
Technology and Digital Transformation
Retail & E-commerce
Discusses AI use cases in fashion, highlighting "product discovery and customer search" as the top priority. Explains customer demand, AI improvements, competitive tech developments, and emerging commercial success stories for 2025.
AI in fashion, product discovery, personalization, generative AI, Gemini, Claude, GPT-4o
false
Reinventing product discovery will be a key focus area for fashion players in 2025The State of Fashion 2025
Mixed Chart
McKinsey
View slide
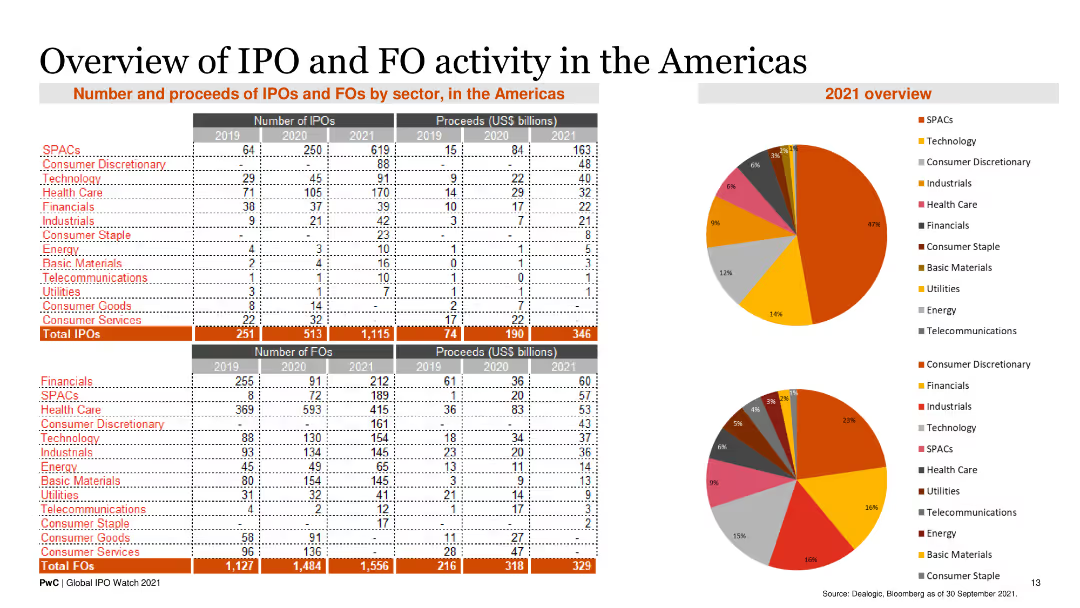
The slide includes tables and pie charts detailing the number and proceeds of IPOs and FOs by sector in the Americas for 2019, 2020, and 2021, along with sector breakdowns.
Market Analysis and Trends
Financial Services
It provides detailed data on IPO and FO activities in the Americas, broken down by sector, helping to understand market dynamics and sector performance.
IPOs, FOs, sector analysis, Americas, financial data
false
Number and proceeds of IPOs and FOs by sector, in the AmericasGlobal IPO Watch 2021 A PwC Global IPO Centre publication
Multiple Chart
PwC/Strategy&
View slide
Slide includes pie charts and textual analysis on the state of tax functions within financial services, focusing on structure and optimization.
Operational Efficiency
Financial Services
Discusses the evolution and optimization of tax functions in financial services, suggesting trends towards more robust functions.
tax functions, financial services, optimization, pie chart, analysis, trends
false
Current state of tax functions in the FS IndustryTax Function Effectiveness
Multiple Chart
PwC/Strategy&
View slide
Includes a large pie chart with statistical data and a list of three strategic actions for CEOs with associated icons.
Human Resources and Talent Management
Professional Services
This slide emphasizes the importance of leadership in the successful integration of SDGs into business strategy, presenting statistical evidence and actionable recommendations for CEOs to foster a sustainability-focused culture at all organizational levels.
Leadership, Sustainability, SDGs, Strategic Recommendations, Business Strategy
false
CEO, board, and owners should take leadership and embody the SDG strategy and transformation to ensure successSDG Guide for Business Leaders
Mixed Chart
McKinsey
View slide
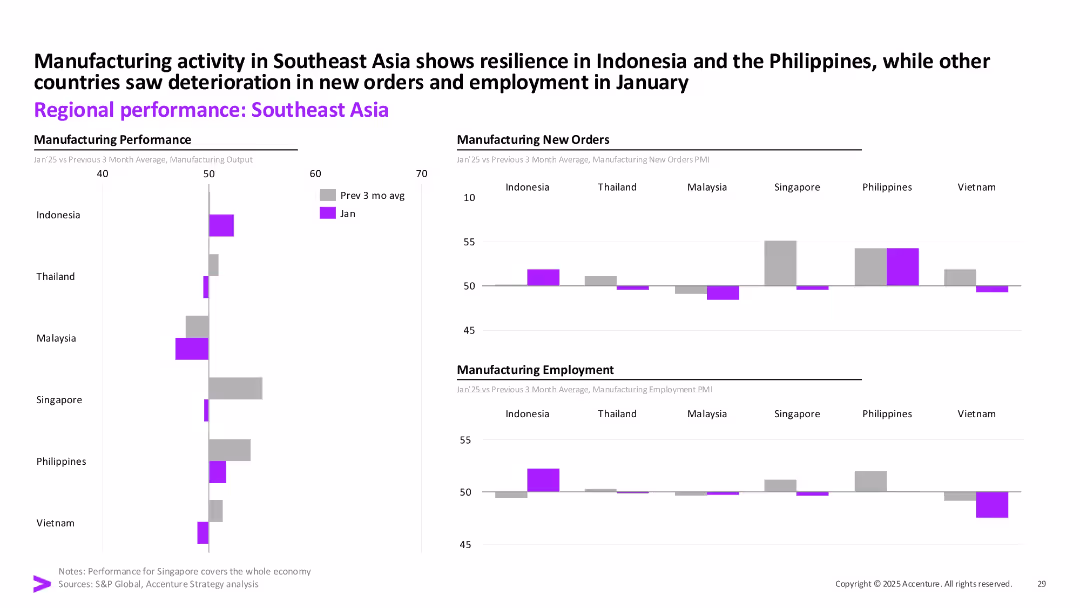
Three-column layout with bar charts comparing manufacturing output, new orders, and employment across Southeast Asian countries.
Performance Metrics and KPIs
Industrial & Manufacturing
Highlights January’s manufacturing trends across Southeast Asia. Indonesia and the Philippines showed strength, while others like Vietnam and Thailand experienced declines in orders and employment.
Southeast Asia, Manufacturing, Employment, PMI, Output, New Orders, January 2025, Industry Trends
false
Manufacturing activity in Southeast Asia shows resilience in Indonesia and the Philippines, while other countries saw deterioration in new orders and employment in JanuaryFebruary Macro Brief
Multiple Chart
Accenture
View slide
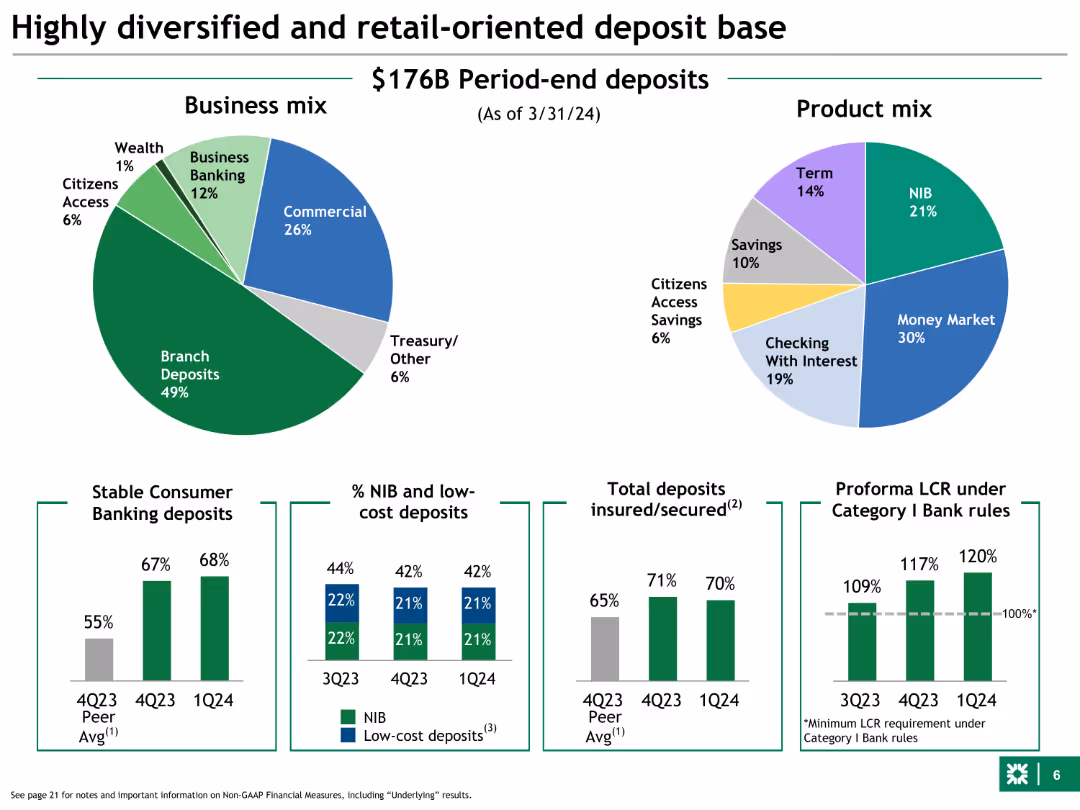
Pie charts showing business mix and product mix, along with bar charts for deposit metrics. Uses various colors to distinguish different segments.
Market Analysis and Trends
Financial Services
This slide illustrates the bank's diverse deposit base, breaking down business and product mix, and showing stability and growth in consumer banking deposits.
deposits, diversification, product mix, stability, growth
false
Highly diversified and retail-oriented deposit baseBarclays Americas Select Franchise Conference
Multiple Chart
Barclays
View slide
A bar graph depicting the global top ten vehicles sold between 2010-2019 with a side image of the F-Series.
Client Case Studies
Transportation & Logistics
Asserts the F-Series as the top-selling pickup globally over the past ten years.
F-Series, best-selling, pickup truck, global market
true
The F-Series is the best-selling pickup truck in the world over the last ten yearsThe Economic Impact of Ford and the F-Series
Single Chart
BCG
View slide
Column chart comparing the levelized cost of energy for large-scale LDES technologies, showing costs with and without subsidies for electrochemical, mechanical, and thermal systems.
Financial Performance
Energy & Utilities
The slide compares the costs of various long-duration energy storage technologies, highlighting differences in costs under subsidized and unsubsidized conditions.
LDES, Cost analysis, Energy storage, Subsidies, Technology comparison
false
Levelized Cost of Energy—Illustrative LDES at ScaleLazards Lcoeplus
Single Chart
Roland Berger
View slide
Similar flow diagram to previous slide, but based on unit counts instead of tonnes, with same structure and annotations
Operational Efficiency
Environmental Services & Sustainability
This slide mirrors the previous one but tracks the same aluminium can material flows in billions of units rather than kilotonnes. It reaffirms the flow of waste through CDS, sorting, and exports while emphasizing export destinations and sources of material inefficiencies.
aluminium units, flow chart, recycling units, CDS export, waste tracking, sustainability, Australia
false
Material flows of aluminium cans, 2020-21 [b units2)3), (% of total POM volume)]Aluminum Cans Market Assessment - Australia
Mixed Chart
Roland Berger
View slide
Includes a grid analysis of different sectors based on carbon abatement potential and various investment criteria like economics and public sentiment.
Risk Assessment and Management
Environmental Services & Sustainability
Evaluates sectors for investment based on carbon abatement potential and attractiveness up to 2030.
carbon abatement, investment attractiveness, sector analysis, SEA
false
Potential investable sectors were screened for (1) carbon abatement potential and (2) multiple investment criteria, to arrive at a holistic view of relative attractivenessSoutheast Asia’s Green Economy 2022 Report
Table
Bain
View slide
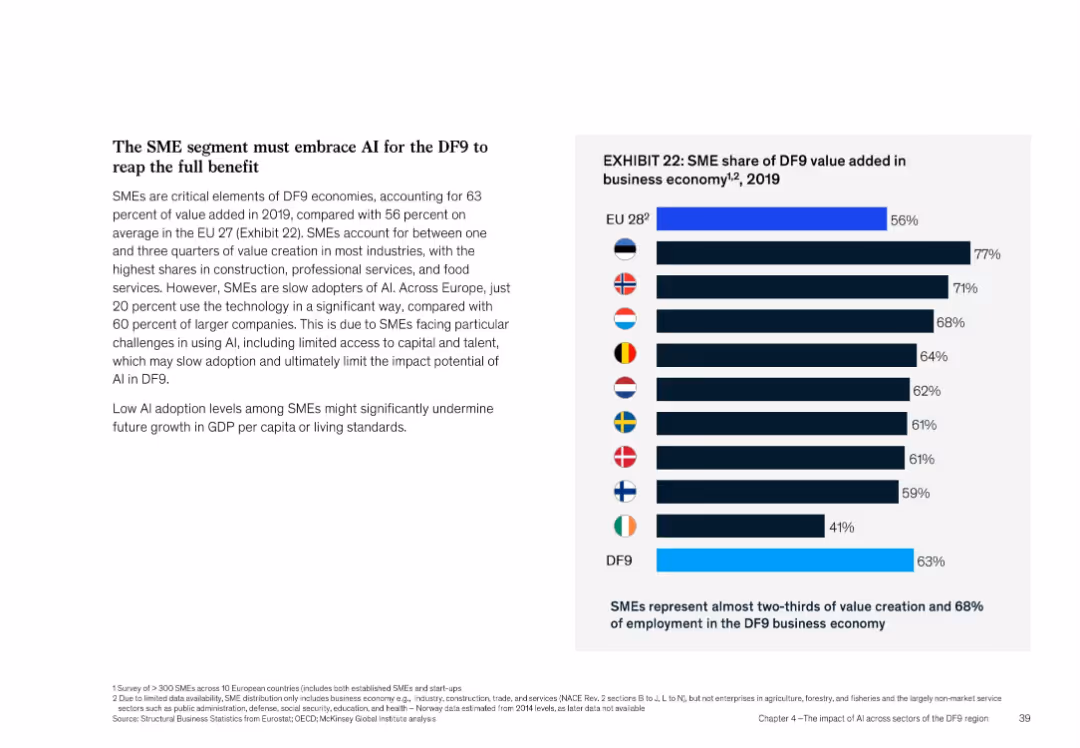
Bar chart comparing SME contribution in DF9 with EU countries, supported by narrative text on left
Organizational Structure and Change
Artificial Intelligence
Describes the role of SMEs in DF9 economies, highlighting their large contribution to value creation (63%) and employment (68%). Notes that SME AI adoption is low (~20%), which could hinder growth. Bar chart ranks SME contributions across EU nations.
SMEs, AI adoption, DF9, EU comparison, value creation, employment
false
EXHIBIT 22: SME share of DF9 value added...How nine digital frontrunners can lead on AI in Europe
Mixed Chart
McKinsey
View slide
With a deep purple backdrop, the slide includes vertical bar graphs illustrating pre and post-COVID-19 online activity changes.
Market Analysis and Trends
Technology & Software
Highlights the amplified use of telehealth, online learning, shopping, and government services on the nbn network as a result of COVID-19.
COVID-19, digital alternatives, nbn network, online activities, telehealth, online learning, government services
false
COVID-19 amplified the use of the nbnTM network for essential activities such as telehealth, online learning, online shopping and online government servicesAccenture Consumer Value Report 2021
Multiple Chart
Accenture
View slide
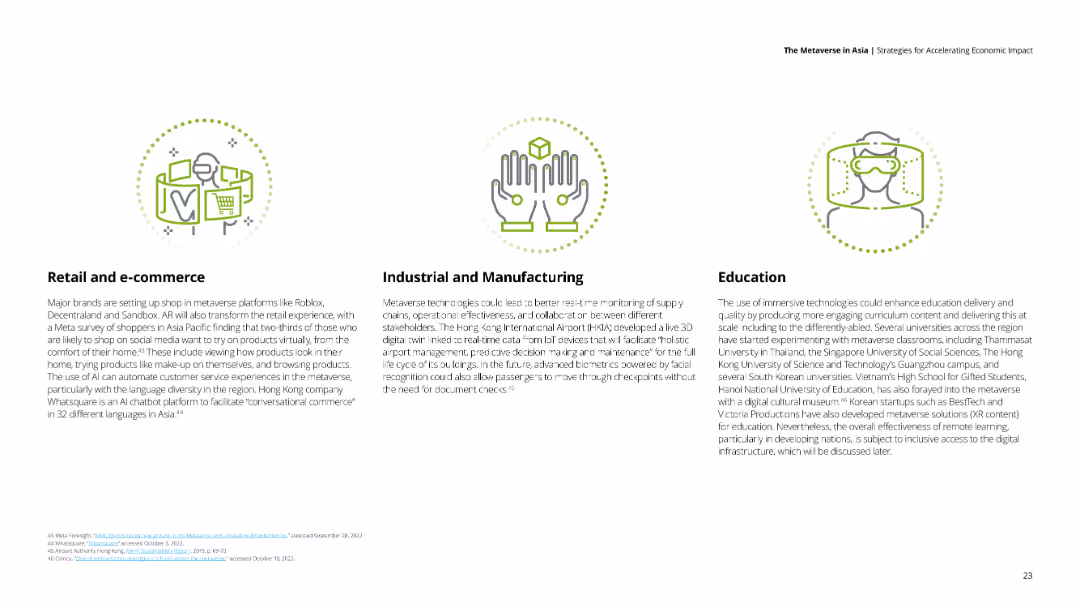
Three sections with icons representing retail, manufacturing, and education, each with descriptive text.
Market Analysis and Trends
Technology & Software
The slide covers the impact of the metaverse on retail, industrial, manufacturing, and education sectors.
metaverse, retail, manufacturing, education, market trends
false
Retail and e-commerceThe Metaverse in Asia Strategies for Accelerating Economic Impact
Pillar
Deloitte
View slide
The slide displays a table listing different CO2-based products, their compounds, and the current status of deployment, categorized into commercial, lab-scale, and demonstration stages. It uses color coding for each category.
Product and Service Analysis
Energy & Utilities
The slide provides a detailed overview of various CO2-based chemical products, their current development stages, and potential applications, highlighting the maturity levels of different pathways.
CO2-based products, chemical compounds, deployment status, maturity stages
false
Different CO2-based products and the current status of deploymentCarbon Capture Utilization and Storage
Table
Kearney
View slide
Features split design with icons: potential of AI on the left, challenges of AI adoption on the right.
Technology and Digital Transformation
Technology & Software
Highlights AI's potential for success and disruptive capability, alongside the challenges faced by organizations in adopting and scaling AI solutions.
AI, leadership, potential, challenges, adoption, success
false
Why should leaders pay attention?McKinsey Technology Trends Outlook 2022 Industrializing machine learning
Text Only
McKinsey
View slide
Features a quote from Namibia's Minister of Finance, an image of a person at a desk, and three highlighted goals represented by vertical bars of varying colors (yellow, grey, red), each with a brief label. The design is clean, utilizing ample whitespace and balanced text placement.
Strategic Planning
Government & Public Sector
Outlines the strategic goals of Namibia's national budget for 2024/25, focusing on stimulating domestic demand, investing in infrastructure, and fiscal prudence. Aims to communicate governmental fiscal priorities and public sector planning.
National Budget, Fiscal Planning, Namibia, Public Sector, Economic Strategy
false
National Budget 2024/25National Budget 2024/25 For Our Humanity: Now's the time to work together.
Pillar
PwC/Strategy&
View slide
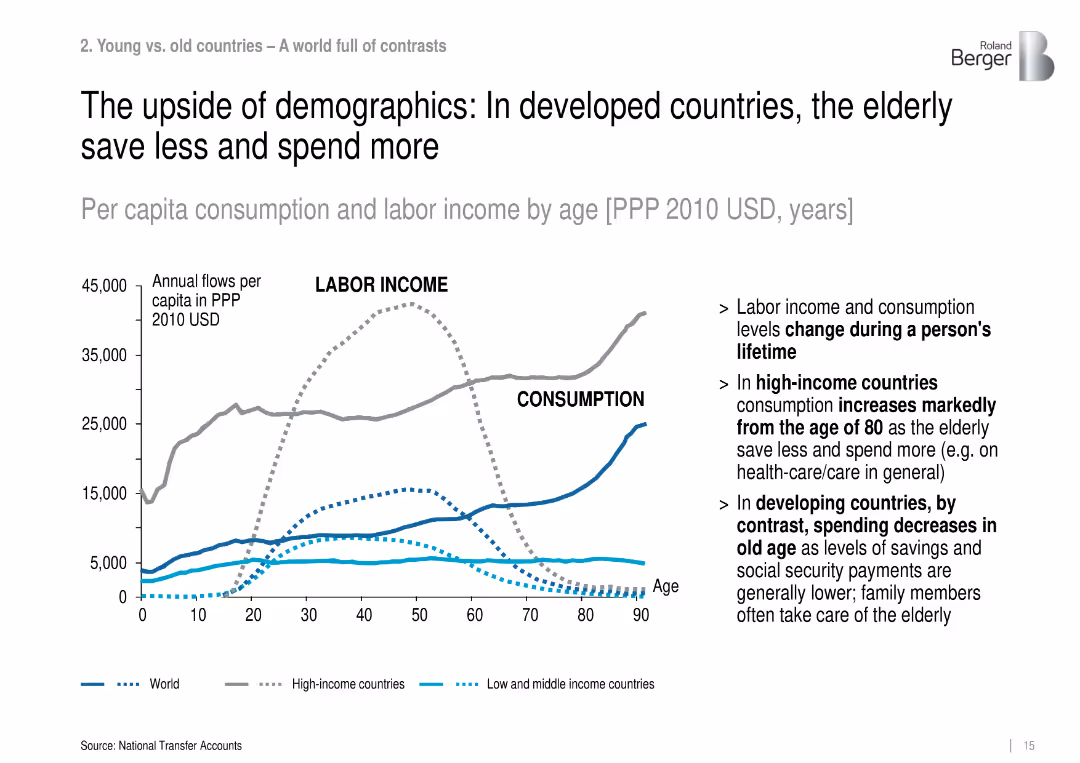
Line graph showing labor income vs. consumption by age across different country income levels (World, High, Low-Mid).
Market Analysis and Trends
Government & Public Sector
The slide presents per capita labor income and consumption over age, revealing that elderly populations in high-income countries consume more and save less, especially after age 80, contrasting with developing regions.
consumption, labor income, aging, high-income, developing countries, elderly spending, economic behavior
false
The upside of demographics: In developed countries, the elderly save less and spend moreRoland Berger Trend Compendium 2030 Megatrend 1 Demographic dynamics
Mixed Chart
Roland Berger
View slide
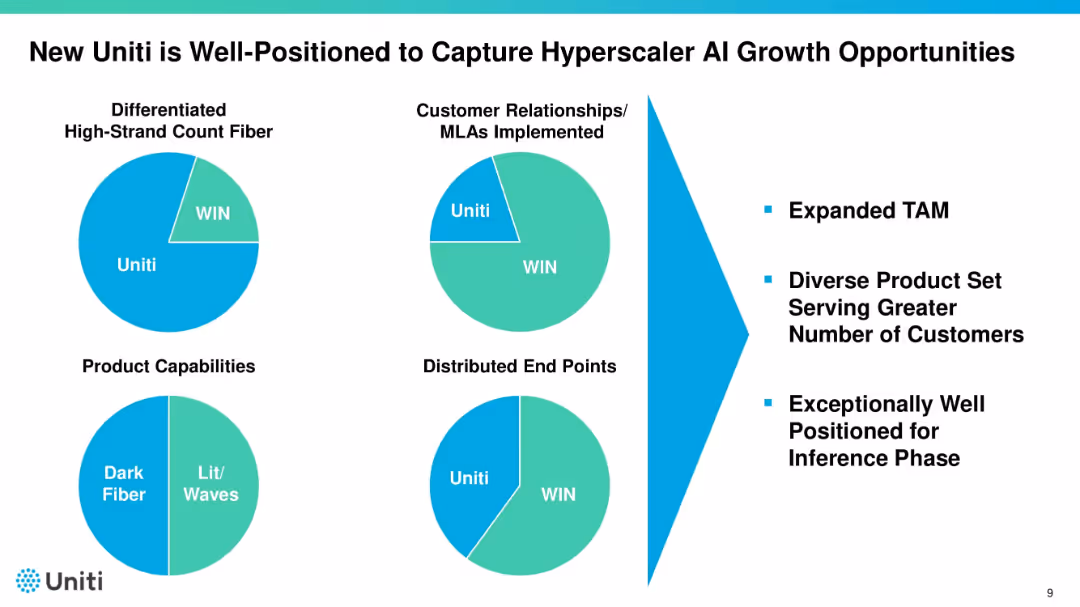
Four pie charts illustrating Uniti vs. WIN across different categories. Right side lists benefits such as expanded TAM and customer diversity. Uses bold black titles and teal highlights.
Sales and Business Development
Telecommunications
Highlights Uniti’s competitive advantages over WIN in fiber, relationships, product capabilities, and endpoints. Uses pie charts to show comparative share. Emphasizes positioning to benefit from AI-driven infrastructure growth.
Uniti, AI growth, fiber, market position, customer base
false
New Uniti is Well-Positioned to Capture Hyperscaler AI Growth OpportunitiesTenth Annual Leveraged Finance and Credit Conference
Mixed Chart
Goldman Sachs
View slide
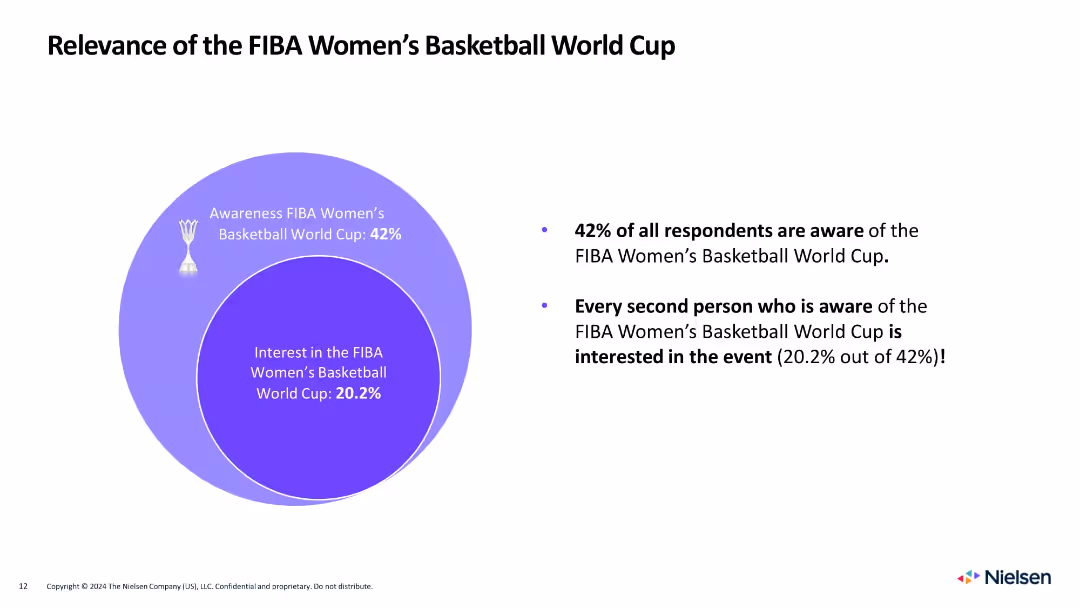
Circle diagram on left showing awareness and interest, with bulleted summary on the right
Market Analysis and Trends
Media & Entertainment
Shows that 42% are aware of the Women's World Cup, and 20.2% are interested, with half of those aware expressing engagement.
women's basketball, awareness, interest, FIBA, gender, sports engagement, fan behavior, Venn diagram, Nielsen
false
Relevance of the FIBA Women’s Basketball World CupNielsen Fan Insights
Mixed Chart
Nielsen
View slide
Displays a world map highlighting various socio-economic trends by region, including population, GDP, and average age. Markers indicate trends like urbanization and shrinking household size.
Market Analysis and Trends
Professional Services
Explores global socio-economic trends driving technology adoption, useful for strategic planning in areas like marketing and product development across different regions.
socio-economic trends, global analysis, technology adoption, urbanization, population, GDP, world map
false
New technology trends will be driven by changing social-economic dynamics…Technology’s role in mineral criticality
Table
McKinsey
View slide
Features two graphs: a line graph representing M&A activity and a column chart depicting IPO activity, both against a historical average. It has a straightforward design with clear labels and a legend.
Investment Analysis
Technology & Software
The slide provides insights into market trends for mergers, acquisitions, and IPOs in the tech sector, offering a comparative analysis of past and projected activities, which can guide strategic decisions in finance.
M&A, IPO, market trends, tech sector, strategic planning, financial analysis, VC-backed, buyout activity
false
Hopes of an exit in 2024 rests on M&A?The Innovation Economy Outlook
Multiple Chart
JP Morgan
View slide
This slide features three column charts comparing the "Worst case," "Base case," and "Best case" scenarios for 2019 with data points and percentages.
Market Analysis and Trends
Consumer Goods
Analyzes different growth scenarios for the luxury goods market in 2019 based on the holiday season's performance, Hong Kong's situation, and the US/China trade war.
Market scenarios, Growth impact, Trade war
false
SOLID BASE CASE SCENARIO FOR 2019, WITH THE COMING HOLIDAY SEASON POTENTIALLY IMPACTING ANNUAL GROWTHBAIN-ALTAGAMMA 2019 WORLDWIDE LUXURY MARKET MONITOR
Multiple Chart
Bain
View slide
Multi-layered flowchart with color gradients representing the phases of COVID-19 impact over time, focusing on various societal and economic responses.
Regulatory and Compliance
Government & Public Sector
Analyzes the phased responses to the COVID-19 pandemic, including initial containment efforts and future economic recovery strategies, with implications for policy and societal changes.
COVID-19, recovery, pandemic, policy, phases
false
The COVID-19 recovery will be driven by disease progression, de-averaged economic impact, government policies, and business and public responsesVaccines & Therapeutics Outlook Part I: Timelines and Success Factors
Linear Flow
BCG
1
...
Next
Load More
Hold On!
We are searching in our database
If nothing, comes up, please try different filters!
Create a FREE account to continue browsing
Receive Instant Access to 1,000+ slides from companies like McKinsey, Google, and Goldman Sachs
First Name
Last Name
Email
Password
I agree to all
Terms & Privacy Policy
Thank you! Your submission has been received!
Oops! Something went wrong while submitting the form.
Have an account?
Sign in
Column Chart
Heatmap
Chevron
Org Chart
Infographic
Callouts
Timeline
List
Graphic
Picture
Process Flow
Diagram
Paragraph
Map
Table
Framework
Subtitle
Takeaway Box
Icon
Other Chart
Radar Chart
Waterfall Chart
Mekko Chart
Pie Chart
Scatter Plot
Line Chart
Bar chart
Bullet points


![Material flows of aluminium cans, 2020-21 [b units2)3), (% of total POM volume)]](https://cdn.prod.website-files.com/654e70fb59937215cac87b19/689997460727c755a84b1b56_l0hZ3kB9Q_LwuRdExYq8z5mX-iOzLyBOemY7QuSpKTk.avif)