My Account
My Slides
Search by Category
Templates
View All Templates
Download Template Slides
Leave Feedback
Login
Logout
Get Started
Browse all Slides
Browse all Slides
Create a FREE Account
Instant access to 1,000+ real slides from top companies like McKinsey, BCG, Goldman Sachs, Google and many more!
First Name
Last Name
Email
Password
I agree to all
Terms & Privacy Policy
Thank you! Your submission has been received!
Oops! Something went wrong while submitting the form.
Have an account?
Sign in
Instant access to the internet's best slides
Get access to 40+ advanced filters and more
Advanced Search and Filters
Access to
10,000+ slides
Access to Category Pages
Save/Bookmark Slides
PowerPoint Template Library (New)
Choose your plan
MONTHLY
$12/month
Billed every month, cancel anytime.
YEARLY
$9/month
Billed $108 annually, cancel anytime.
Checkout for $12/month
Checkout for $108/yr
Secured by Stripe | AES-256 bit encryption
Spark Your Next Big Idea with New Presentation Templates
VIEW ALL Templates
Welcome,
Welcome
Upgrade to SlideStart
Pro
Instant access to 15,000+ slides
Show Featured Only
Checkbox 8
Companies
Mckinsey
Bain
BCG
EY
Deloitte
Accenture
PwC/Strategy&
JP Morgan
Goldman Sachs
Morgan Stanley
Citigroup
Deutsche Bank
Barclays
LEK
Kearney
Oliver Wyman
Booz Allen Hamilton
Gartner
IPSOS
Nielsen
Slide type
Header Horizontal
Framework
Vertical Flow
Single Chart
Single Chart
Text Only
Mixed Chart
Header Vertical
Graphic
Pillar
Multiple Chart
Agenda
Title
Table
Linear Flow
Upgrade to SlideStart
Pro
Instant access to 40+ advanced filters
Industry
Upgrade to SlideStart
Pro
Instant access to 40+ advanced filters
Technology
Healthcare
Financial Services
Consumer Goods
Energy & Utilities
Manufacturing
Retail
E-commerce
Logistics
Telecommunications
Real Estate
Professional Services
Education
Media
Entertainment
Hospitatlity
Tourism
Agriculture
Food Production
Government & Public Sector
Environmental
Sustainability
Use Case
Upgrade to SlideStart
Pro
Instant access to 40+ advanced filters
Sales and Business Development
Mergers and Acquisitions
Corporate Finance and Valuation
Performance Metrics and KPIs
Client Case Studies
Competitive Landscape
Product and Service Analysis
Customer and Market Segmentation
Organizational Structure
Human Resources and Talent Management
Industry Overview
Regulatory and Compliance
Risk Assessment and Management
Agriculture & Food Production
Hospitality and Tourism
Government
Environmental
Sustainability
Clear all
Thank you! Your submission has been received!
Oops! Something went wrong while submitting the form.
Show Featured Only
Checkbox 8
Companies
Mckinsey
Bain
BCG
EY
Deloitte
Accenture
PwC/Strategy&
JP Morgan
Goldman Sachs
Morgan Stanley
Citigroup
Deutsche Bank
Barclays
LEK
Kearney
Oliver Wyman
Booz Allen Hamilton
Gartner
IPSOS
Nielsen
Slide type
Text Only
Linear Flow
Vertical Flow
Single Chart
Header Horizontal
Mixed Chart
Header Vertical
Pillar
Multiple Chart
Graphic
Agenda
Title
Table
Framework
Industry
Technology
Healthcare
Financial Services
Consumer Goods
Energy & Utilities
Manufacturing
Retail
E-commerce
Logistics
Telecommunications
Real Estate
Professional Services
Education
Media
Entertainment
Hospitatlity
Tourism
Agriculture
Food Production
Government & Public Sector
Environmental
Sustainability
Use Case
Sales and Business Development
Mergers and Acquisitions
Corporate Finance and Valuation
Performance Metrics and KPIs
Client Case Studies
Competitive Landscape
Product and Service Analysis
Customer and Market Segmentation
Organizational Structure
Human Resources and Talent Management
Industry Overview
Regulatory and Compliance
Risk Assessment and Management
Agriculture & Food Production
Hospitality and Tourism
Government
Environmental
Sustainability
Clear all
Thank you! Your submission has been received!
Oops! Something went wrong while submitting the form.
Tag
View slide
Bubble chart displaying Scandinavian revenue growth in various media segments from 2018 to 2023. Bubbles of different sizes represent revenue growth in millions USD.
Market Analysis and Trends
Media & Entertainment
This slide analyzes revenue growth across different media segments in Scandinavia, focusing on the significant growth in OTT video and internet access.
revenue growth, Scandinavian market, OTT video, video games, 2018-2023
false
New spending will flow into rapidly growing segments such as OTT video and video gamesGlobal Entertainment and Media Outlook 2019-2023
Multiple Chart
PwC/Strategy&
View slide
Comprises a vertical column chart showcasing deal values over years and the number of deals, with a marked increase in the first half of 2021.
Investment Analysis
Financial Services
Indicates a surge in investment deal values in Indonesia within the first half of 2021, exceeding the past four years’ totals.
Indonesia, Investments, Deal Value, 2021, H1, Growth, Financial Analysis
false
Indonesia H1 2021 alone has already surpassed the deal values of each of the last four yearse-Conomy SEA 2021 Roaring 20s: The SEA Digital Decade
Single Chart
Bain
View slide
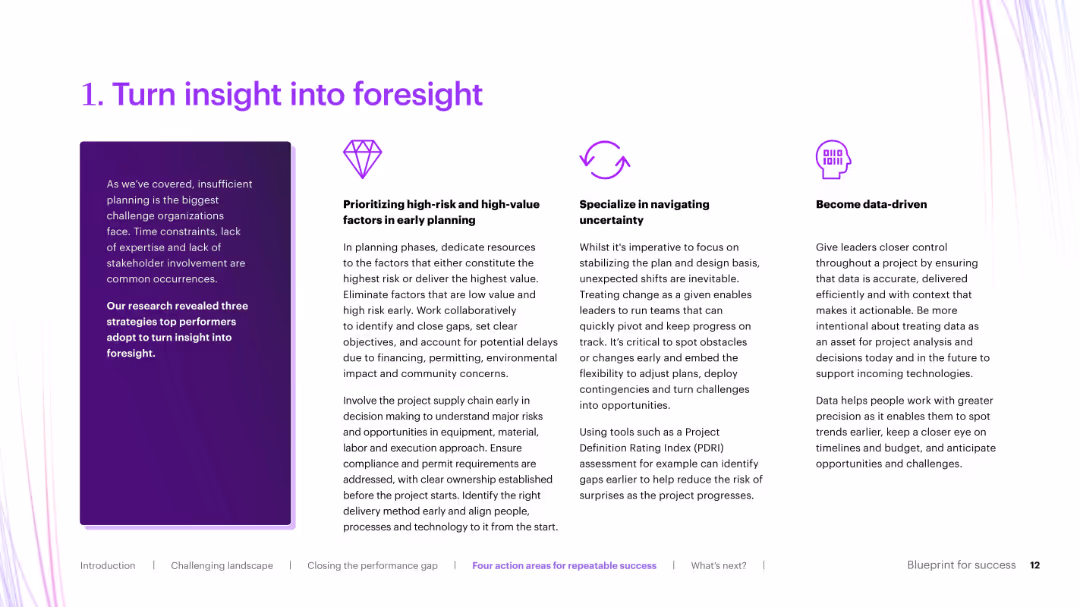
Three-column layout with icons and bold section titles, explaining strategies like data-driven planning and early risk identification.
Strategic Planning
Real Estate & Construction
Elaborates on the first action area from the previous slide: turning insight into foresight. It breaks down how organizations can improve planning through prioritizing risks, navigating uncertainty, and becoming data-driven.
foresight, early planning, risk mitigation, data-driven, uncertainty
false
1. Turn insight into foresightBlueprint for success
Pillar
Accenture
View slide
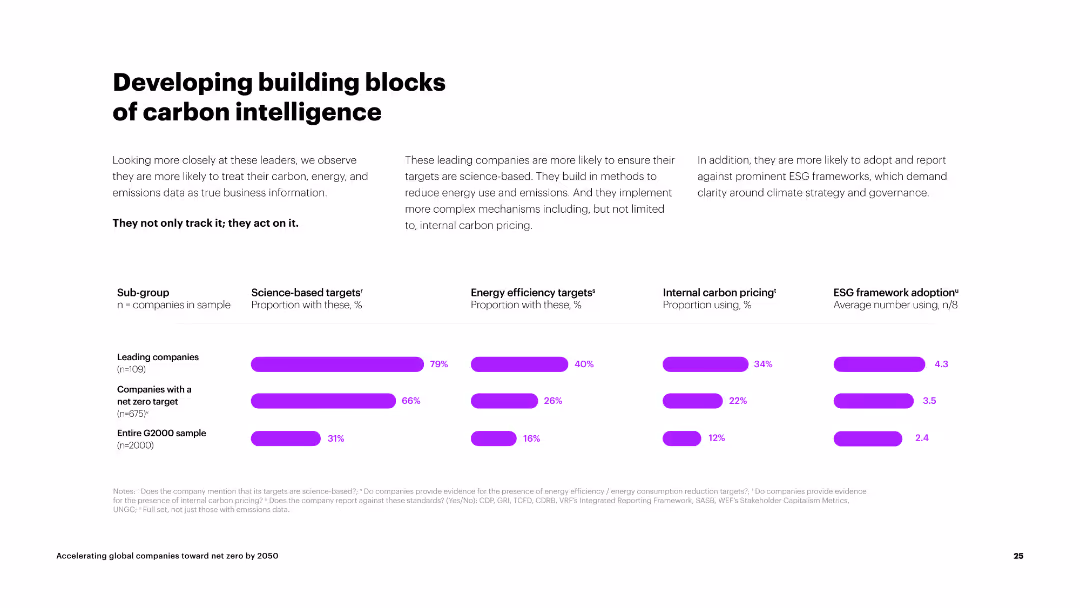
The slide is divided into three sections, each with an icon and text block. The background is white with purple accents, creating a clean and organized look.
Strategic Planning
Energy & Utilities
The slide outlines steps for companies at different stages of carbon intelligence: setting targets, prioritizing investments, and placing bold bets. It provides guidance for companies at various stages of their journey.
carbon targets, investments, energy efficiency, milestones, carbon pricing
false
Developing building blocks of carbon intelligenceAccelerating global companies toward net zero by 2050
Multiple Chart
Accenture
View slide
Column chart comparing the unsubsidized capital costs of retrofitted gas combined cycle plants with CCS and new-build power plants with CCS.
Financial Performance
Energy & Utilities
The slide provides a comparison of capital costs for CCS systems, contrasting retrofit and new-build scenarios without subsidies.
CCS, Capital cost, Retrofit, New-build, Unsubsidized
false
Carbon Capture & Storage Systems—Capital Cost Comparison (Unsubsidized)Lazards Lcoeplus
Single Chart
Roland Berger
View slide
A balanced layout with two distinct sections: textual content on the left explaining reasons for brand switching and a comparative visual on the right indicating these reasons across different Southeast Asian countries.
Customer and Market Segmentation
Retail & E-commerce
The slide provides insights into the primary factors influencing brand-switching decisions, such as reliability and value for money, and compares these factors across different Southeast Asian markets, emphasizing the role of perceived value and product quality.
brand reliability, value for money, consumer insights, brand switching, Southeast Asia, market comparison, product quality, consumer decisions
false
New norms = new purchasing habitsDigital Consumers of Tomorrow, Here Today: A SYNC SOUTHEAST ASIA REPORT
Boxed
Bain
View slide
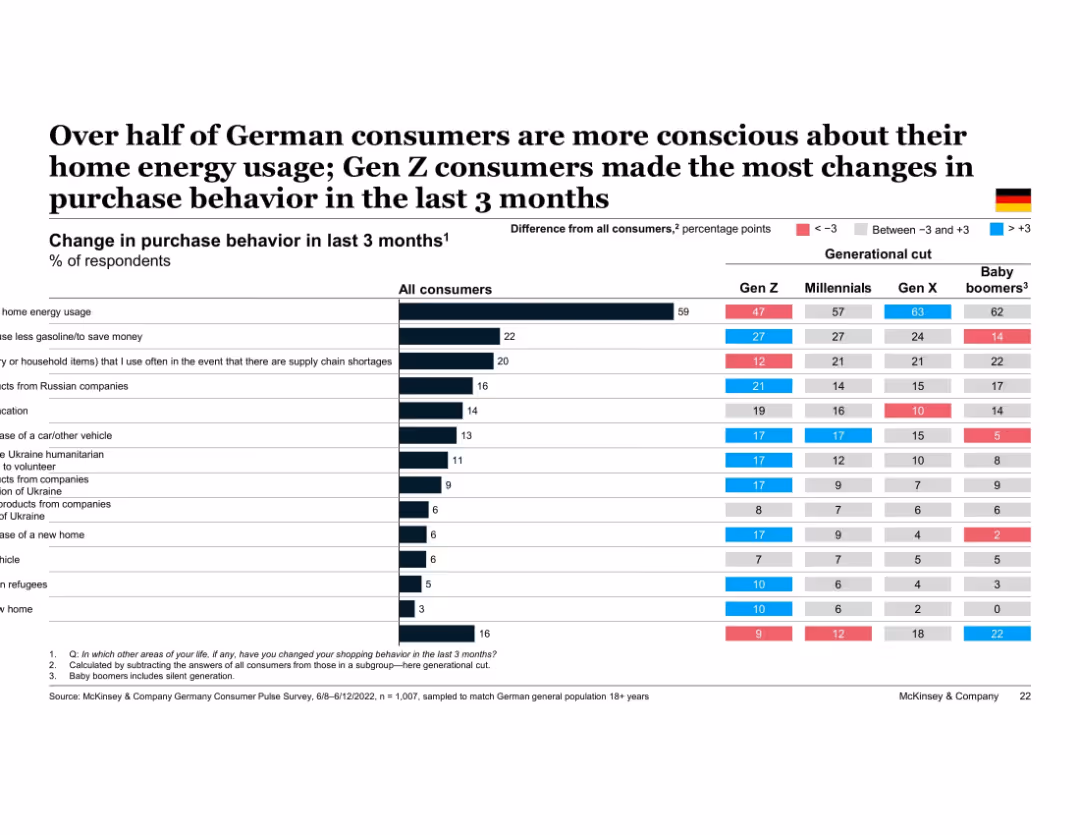
Table chart showing % of German consumers changing various behaviors, broken down by generation. Color coding indicates deviation from average. Most actions relate to energy savings, budgeting, or avoiding Russia-linked products.
Customer and Market Segmentation
Financial Services
This slide tracks behavioral adjustments made by German consumers in response to economic and geopolitical events. The most common change is reducing home energy use, particularly among Gen X and Baby Boomers. Gen Z shows the most widespread behavioral adaptation across categories.
behavioral change, energy savings, Germany, generational behavior, inflation response, geopolitical impact, Gen Z, purchase habits
false
Over half of German consumers are more conscious about their home energy usage; Gen Z consumers made the most changes in purchase behavior in the last 3 monthsEuropean Consumer Sentiment Survey: How current events in Europe are shaping consumer behavior
Multiple Chart
McKinsey
View slide
The slide includes three charts: a line chart of unemployment rates, a column chart of employment cost index and private average hourly earnings growth, and a line chart of labor demand versus supply. The layout is clean with a blue and white color scheme, and key points are highlighted.
Market Analysis and Trends
Professional Services
The slide discusses the challenges of a tight labor market, rising compensation costs, and shifting employee expectations, supported by data on unemployment rates, employment costs, and labor supply versus demand.
labor market, employment, compensation, mobility, talent
false
Labor: Navigating a tight and fast moving labor market with a shrinking pool of talent, shifting employee expectations and increased mobility of the workforce2023 Global Macroeconomic Outlook
Multiple Chart
EY
View slide
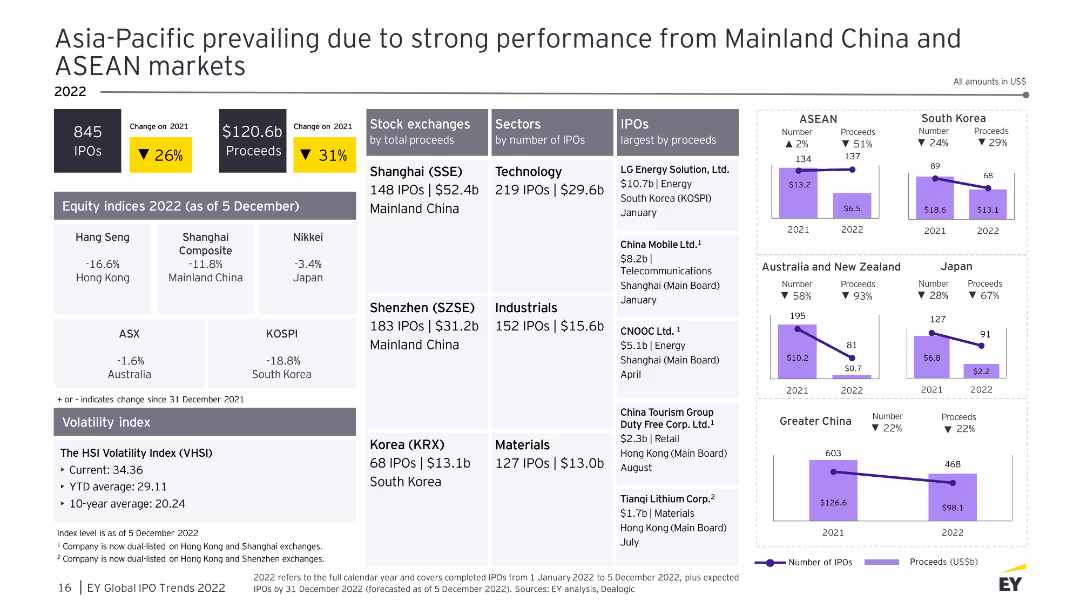
The slide features multiple column charts and data tables showing IPO performance across major Asia-Pacific stock exchanges, sectors, and countries. The visuals are well-organized and detailed.
Market Analysis and Trends
Financial Services
This slide summarizes the IPO market performance in the Asia-Pacific region, highlighting strong performance from Mainland China and ASEAN markets, with detailed breakdowns by stock exchange and sector.
Asia-Pacific, IPO, stock exchange, performance, 2022
false
Asia Pacific prevailing due to strong performance from Mainland China and ASEAN marketsHow can you prepare to seize the right moment?
Multiple Chart
EY
View slide
A bar graph on the right compares the number of new digital services adopted by consumers during the pandemic years. The left side details the increase in purchases made in digital services.
Financial Performance
Technology & Software
Examines the growing number of digital service purchases made by existing consumers, indicating market growth and the potential for new service development.
consumer purchases, digital services, pandemic, market growth, service development, adoption rates
false
Usage frequency and spend on digital services have mostly increasede-Conomy SEA 2021 Roaring 20s: The SEA Digital Decade
Single Chart
Bain
View slide
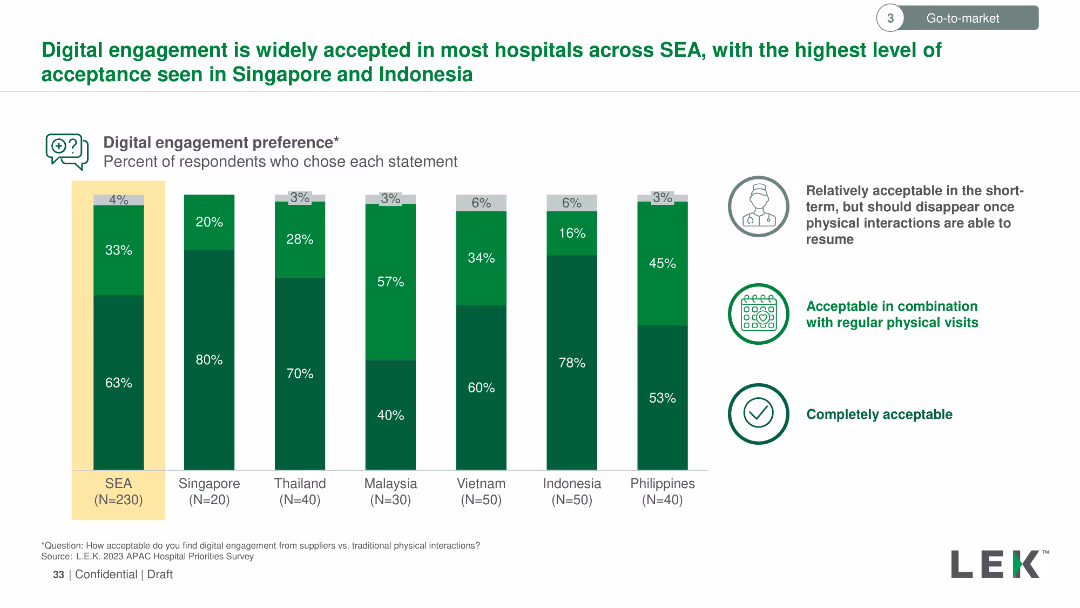
The slide uses a column chart to represent the percentage of respondents' acceptance of digital engagement in hospitals across various countries. Green shades indicate different levels of acceptance.
Market Analysis and Trends
Healthcare & Pharmaceuticals
The slide shows the acceptance levels of digital engagement in hospitals in Southeast Asia, highlighting the highest acceptance in Singapore and Indonesia. Data segments responses into three categories: short-term, regular physical visits, and completely acceptable.
Digital, engagement, hospitals, acceptance, Southeast Asia, Singapore, Indonesia, percentage, short-term, visits, acceptable
false
Digital engagement is widely accepted in most hospitals across SEA, with the highest level of acceptance seen in S ingapore and Indonesia2023 SEA Hospital Insights Survey Findings Summary materials
Mixed Chart
LEK
View slide
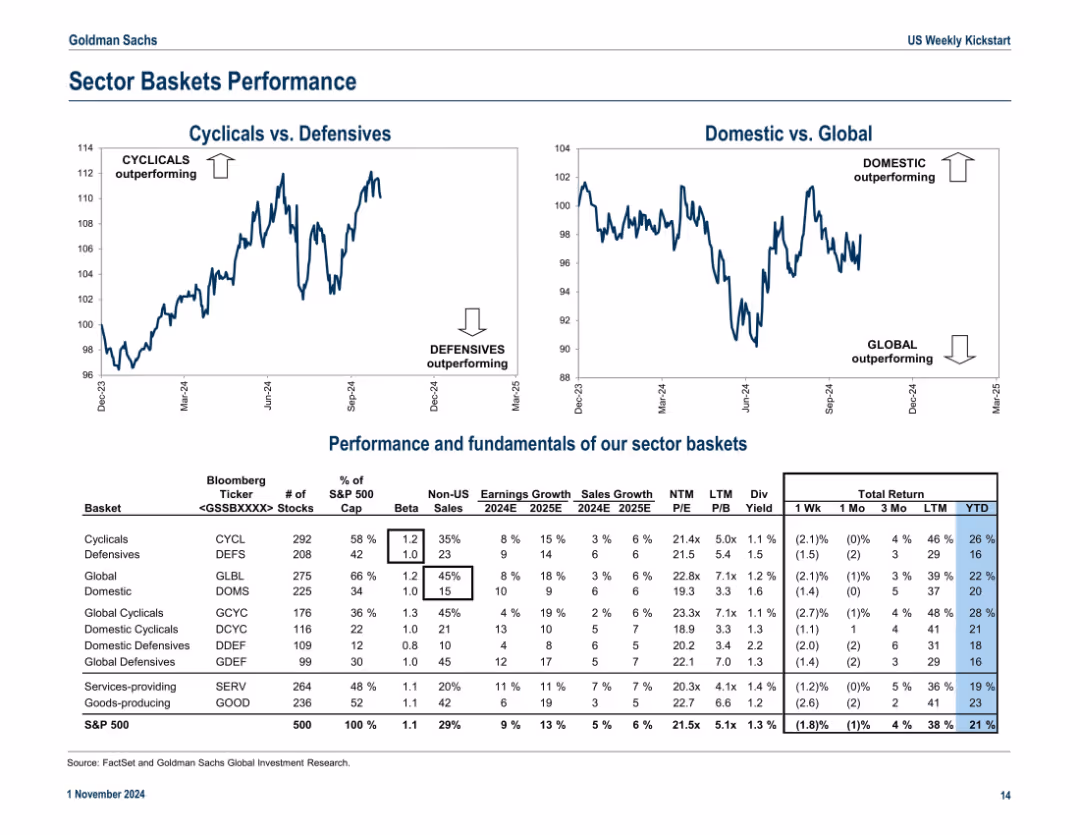
Dual line charts (Cyclicals vs. Defensives and Domestic vs. Global) with supporting table showing sector basket fundamentals and returns; structured and data-rich layout
Product and Service Analysis
Financial Services
This slide contrasts performance trends between cyclical vs. defensive and domestic vs. global equity baskets, supplemented by a detailed table showing earnings, sales growth, valuation metrics, and total returns.
cyclical stocks, defensive stocks, global vs domestic, basket returns, sector fundamentals
false
Sector Baskets PerformanceUS Weekly Kickstart The rise of passive ownership
Multiple Chart
Goldman Sachs
View slide
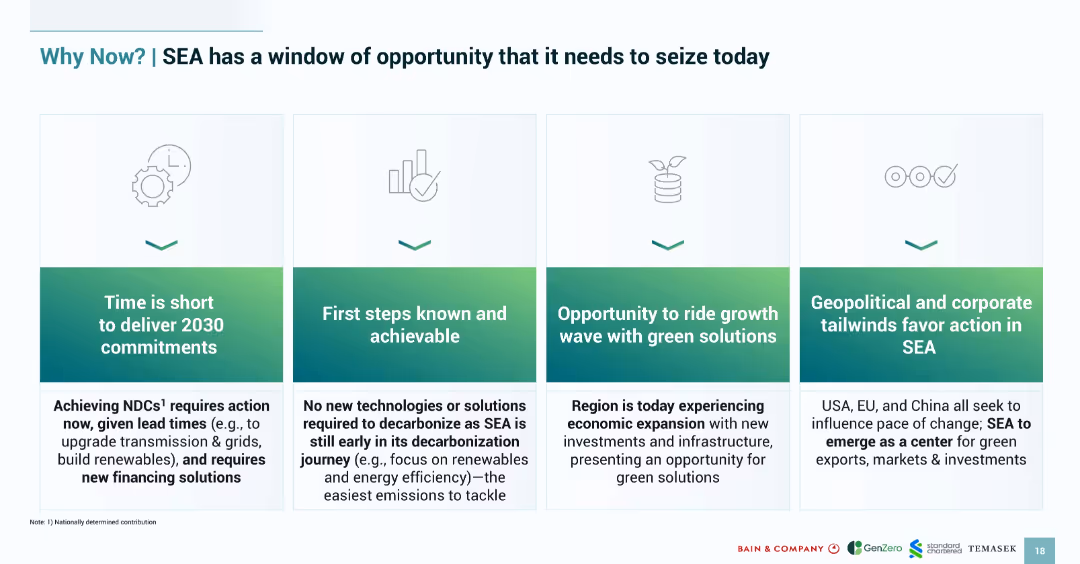
Four-tile layout with icons and captions outlining urgent reasons for SEA to act on green transition; soft green gradient background.
Strategic Planning
Environmental Services & Sustainability
Lays out four reasons why Southeast Asia must act now on decarbonization: short timelines, actionable steps, economic growth synergy, and geopolitical support. Emphasizes urgency and achievability.
SEA, decarbonization, urgency, opportunity, strategic timing, green transition
false
Why Now? | SEA has a window of opportunity that it needs to seize todaySOUTHEAST ASIA’S GREEN ECONOMY 2024
Pillar
Bain
View slide
Three interconnected circular nodes with icons, titled 'The Future of Enterprise', 'The Future of the Workforce', and 'How Work Gets Done'. The slide has a futuristic and clean design.
Technology and Digital Transformation
Professional Services
Presents an interconnected analysis of the future of enterprises, workforce, and work processes, with emphasis on disruptive forces and innovation.
future, enterprise, workforce, work processes, disruptive innovation
false
The world is changing and the future is arriving nowFuture of Work - How work is enabled?
Linear Flow
Deloitte
View slide
This slide contains two pie charts and two column charts displaying various percentages of employee characteristics related to willingness to travel post-COVID-19.
Market Analysis and Trends
Professional Services
Highlights employee willingness to travel for business post-COVID-19, focusing on productivity measurement, job satisfaction, gender differences, and leadership roles.
Willingness to travel, Job satisfaction, Productivity, Gender differences, Leadership roles
false
Employees in leadership roles and those who retain a high level of job satisfaction are among the most willing to travelGlobal Employee Survey - Key findings and implications for ICMIF
Multiple Chart
EY
View slide
Slide features a central graphic summarizing ESG commitments with icons and lists around it, highlighting different aspects of ESG initiatives.
Regulatory and Compliance
Environmental Services & Sustainability
Showcases Permian Resources' dedication to ESG through various initiatives like minimizing impact, reducing emissions, and ensuring diversity and inclusion, aiming at holistic ESG excellence.
ESG, environmental impact, emissions reduction, diversity, shareholder alignment, community benefit
false
Commitment to ESG ExcellenceBarclays CEO Energy-Power Conference
Framework
Barclays
View slide
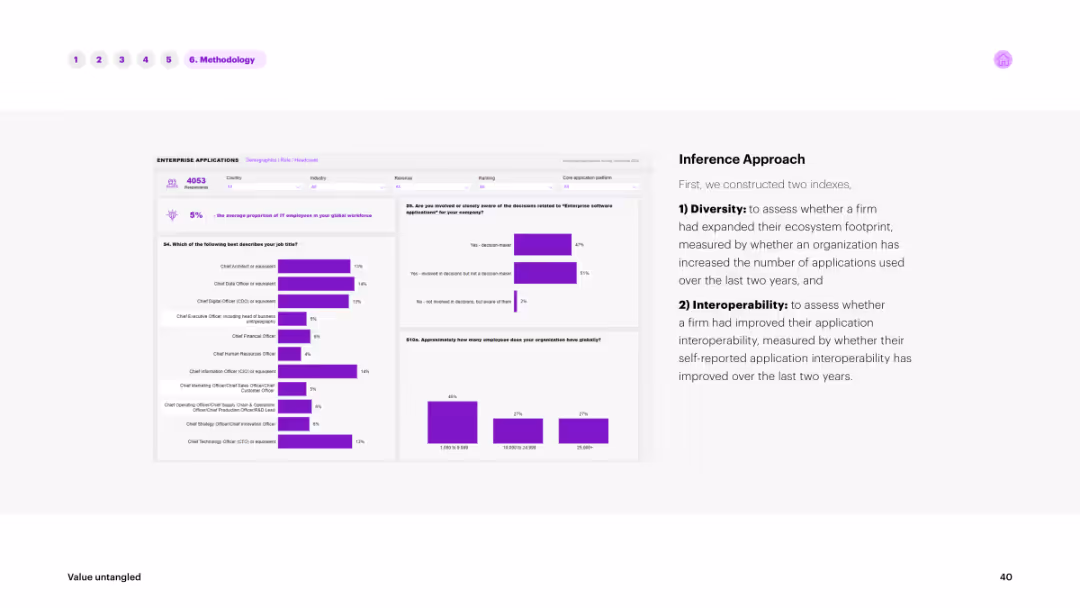
The slide includes text on the right explaining the inference approach and multiple bar charts on the left showing data distributions. The charts and text are in shades of purple against a white background.
Market Analysis and Trends
Technology & Software
Describes the inference approach used in the survey, focusing on diversity and interoperability indices. The bar charts show the distribution of responses, providing insights into ecosystem footprints and application interoperability improvements.
inference, approach, survey, diversity, interoperability
false
Inference Approach First, we constructed two indexesValue untangled Accelerating radical growth through interoperability
Multiple Chart
Accenture
View slide
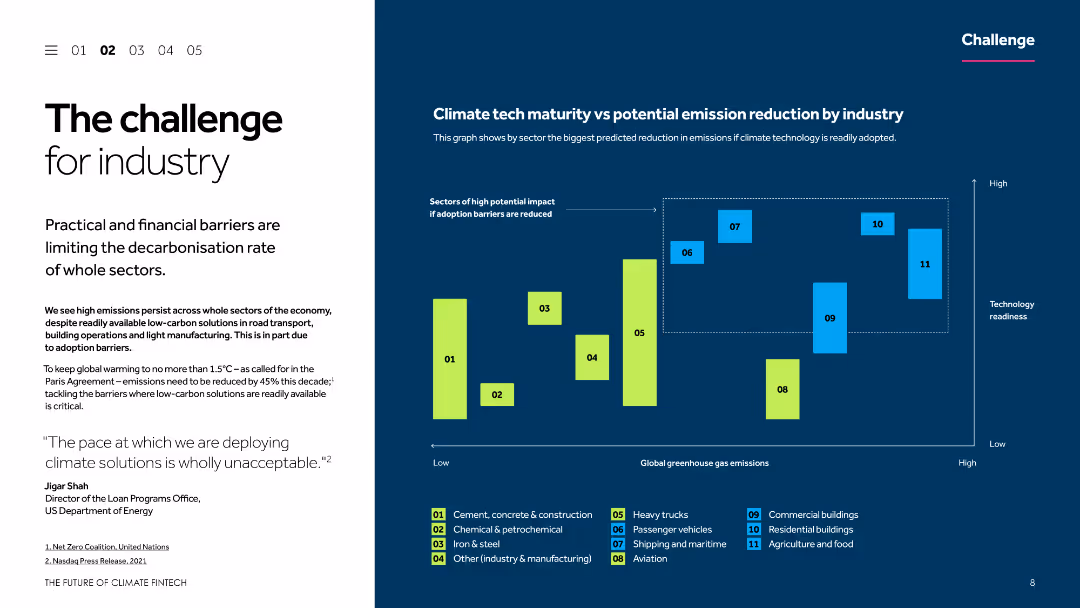
This slide uses a two-column layout with a text section on the left and a column chart on the right. The text describes the challenges faced by industries in decarbonization, while the chart illustrates the potential emission reduction by industry and technology readiness.
Risk Assessment and Management
Environmental Services & Sustainability
The slide discusses the practical and financial barriers limiting the decarbonization rate of various sectors. It includes a comparison of climate tech maturity versus potential emission reduction across different industries, emphasizing the need for overcoming adoption barriers.
Decarbonization, climate tech, emission reduction, industry challenges, technology readiness
false
Climate tech maturity vs potential emission reduction by industryClimate FinTech AN INNOVATION THESIS
Mixed Chart
Barclays
View slide
The slide features multiple column charts on a dark background, focusing on technology-enhanced healthcare preferences.
Technology and Digital Transformation
Healthcare & Pharmaceuticals
It discusses the consumer openness to personalized medicine, genetic testing, and wearable health technology.
technology, personalized care, genetic testing, survey, England
false
‘I am open to technology enhanced care for more personalized care and better health care experiences.’ Consumers: EnglandHealth care consumer views on value
Mixed Chart
EY
View slide
This slide presents a column chart showing a progressive increase over four years with an upward arrow, two pie charts with percentages, and bullet point descriptions. The color scheme includes blue and grey tones with minimal text, facilitating a clear visual representation of data. The pie charts are simplistic, using contrasting colors to highlight different segments.
Market Analysis and Trends
Industrial & Manufacturing
The slide portrays the company's growing order book over the years, emphasizing the current year's strong momentum. It details the portion of the order book dedicated to zero-emission vehicles and the geographical diversification of orders. It could be used in a strategy meeting or investor briefing to highlight commercial success and future opportunities, particularly in the sustainable and global markets.
Momentum, Order Book, Zero-Emission Vehicles, Geographical Diversification, Column Chart, Pie Chart, Industrial, Sustainable
false
Strong momentum in commercial successes Adressing all types of powertrain15TH ANNUAL AUTO CONFERENCE GOLDMAN SACHS
Multiple Chart
Goldman Sachs
View slide
Slide includes horizontal bar graphs in purple, detailing automation levels across different premium segments and lines of business.
Operational Efficiency
Financial Services
Explores the extent of automation in underwriting processes across various segments and business lines.
automation, underwriting, business lines, premiums
false
AUTOMATION Q9: For the following premium (USD) segments, what percentage of the underwriting process is automated? Overall2021 P&C Underwriting Survey
Single Chart
Accenture
View slide
The slide presents a timeline-style layout with icons and percentages. The visual elements are straightforward and focus on the impact of digital platforms in job creation and business opportunities. The blue and teal color scheme is consistent and professional.
Market Analysis and Trends
Retail & E-commerce
The slide argues for the positive impacts of digital platforms, such as job creation and improved livelihood, as perceived by digital merchants. Statistical data is used to emphasize the significant role of digital platforms in sustaining revenue and creating opportunities during the pandemic, suggesting a reliance on these platforms for economic stability.
online platforms, impact, job creation, revenue, business opportunities, pandemic, digital merchants
false
Digital merchants believe that online platforms deliver positive impact - from job creation to business opportunitiese-Conomy SEA 2021 Roaring 20s: The SEA Digital Decade
Pillar
Bain
View slide
A column chart showing the reduction in cost per private transaction over time, with significant drops from the prototype stage to Nightfall introduction and further with batching. Includes bullet points about the technological progress and regulatory compliance features.
Technology and Digital Transformation
Technology & Software
Details the technological advancements made in reducing transaction costs on public blockchains, highlighting significant milestones and the role of regulatory compliance.
Technological progress, private transactions, business agreements, public blockchains, cost reduction, regulatory compliance
false
Finally, we made enormous technological progress in 2019 around enabling private transactions and business agreements on public blockchainsGoing Public EY Global Blockchain Summit 2020
Mixed Chart
EY
View slide
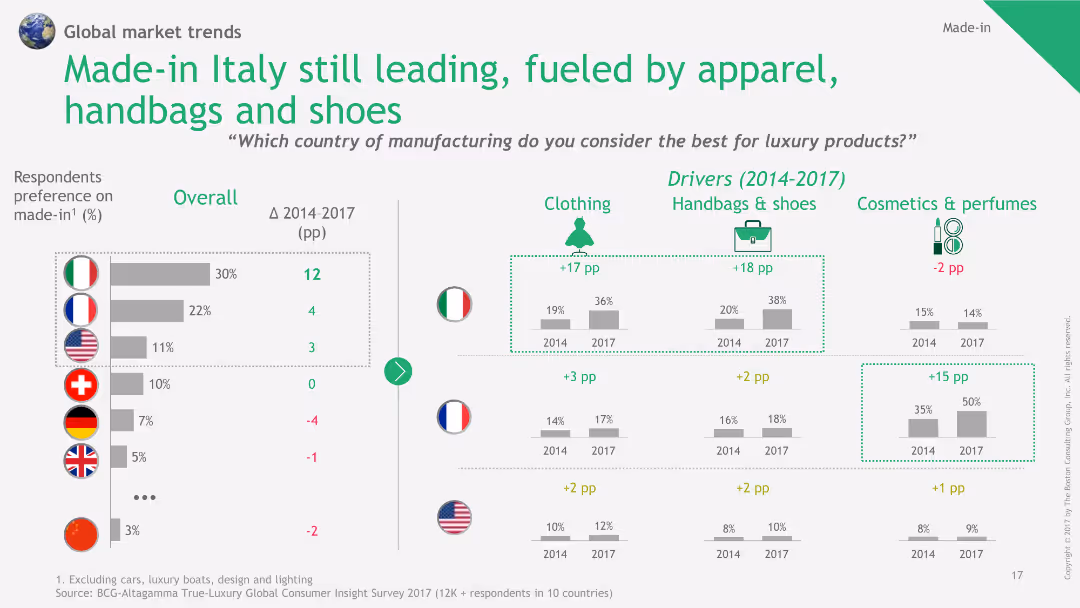
This slide features a combination of column charts and tables to show the preference for "Made-in Italy" products over time, across different product categories.
Market Analysis and Trends
Consumer Goods
The slide illustrates the leading preference for Italian-made luxury products, particularly in apparel, handbags, and shoes, supported by historical data and trends from 2014 to 2017.
Made-in Italy, luxury products, product categories, column chart, preference trends
false
Made-in Italy still leading, fueled by apparel, handbags and shoes2018 True-Luxury Global Consumer Insight
Multiple Chart
BCG
View slide
This slide is a compilation of tables and icons presenting detailed data on infrastructure projects by sector and agency. It includes budget and project status information.
Market Analysis and Trends
Transportation & Logistics
Analyzes the budgeting and implementation of infrastructure projects across different sectors, highlighting spending and project statuses.
infrastructure, budget, projects, sectors, implementation
false
Following the impact of COVID-19, several revisions were made to the list.Doing business in the Philippines 2021
Table
Deloitte
View slide
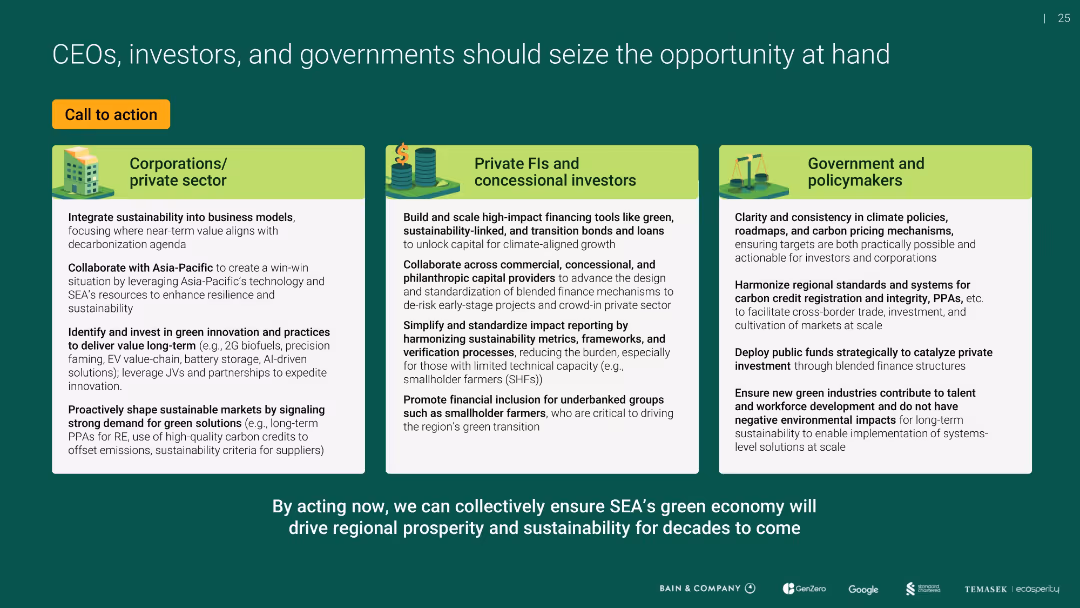
Three-column layout with icons for corporations, investors, and policymakers; light green boxes with bulleted text; bolded headers for each sector
Strategic Planning
Environmental Services & Sustainability
Outlines a call to action for different stakeholders—corporates, investors, and governments—to support Southeast Asia’s green transition through financing, innovation, policy consistency, and sustainable market development.
sustainability, green economy, policy, private sector, financing, SEA, transition, investors, governments
false
CEOs, investors, and governments should seize the opportunity at handSoutheast Asia's Green Economy
Pillar
Bain
View slide
Two-column layout comparing somatic and germline gene editing, detailing the processes, risks, next generation impact, and consensus for each.
Technology and Digital Transformation
Healthcare & Pharmaceuticals
The slide compares somatic and germline gene editing, outlining the potential benefits, risks, and ethical considerations associated with each. It highlights the significant promises and ongoing research in the field of genetic editing, particularly focusing on the CRISPR technology.
Gene Editing, CRISPR, Somatic, Germline
false
… such as Nobel Prize winning gene editing process CRISPR – Concerns remain mainly in areas of germline gene editingMegatrend 5 - Technology & Innovation
Table
Roland Berger
View slide
This slide uses a Venn diagram centered around "Collective action" with segments detailing the roles of "Communities", "Investors", "Governments", and "Businesses". Each segment includes an image and brief descriptive text
Industry Overview
Environmental Services & Sustainability
The slide presents the concept of a sustainable SEA (Southeast Asia), highlighting the necessary individual and collective actions across different societal sectors to achieve sustainability goals.
sustainability, SEA, collective action, governments, businesses
false
A sustainable SEA needs both individual and collective actionSoutheast Asia’s Green Economy 2021 Report: Opportunities on the Road to Net Zero
Framework
Bain
View slide
Contains a list of US proprietary data assets and their uses, paired with textual descriptions of AI advantages in Equifax’s operations, emphasizing the integration of AI technologies and data assets.
Technology and Digital Transformation
Technology & Software
The slide provides an overview of how Equifax leverages its proprietary data alongside advanced AI capabilities to enhance decision-making processes and product development, highlighting the strategic use of technology in business.
AI capabilities, proprietary data, technology, Equifax
false
EFX driving leading AI capabilities leveraging EFXCloud and EFX unique proprietary dataBarclays Credit Bureau Day
Header Horizontal
Barclays
View slide
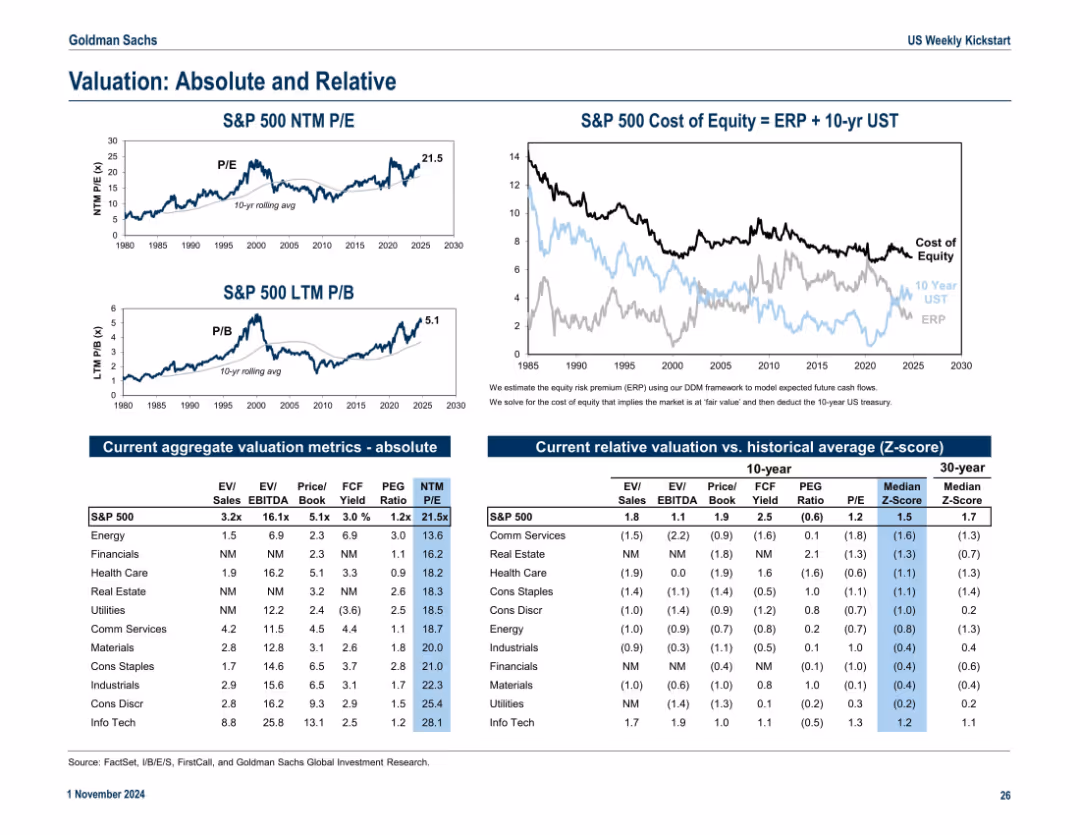
Split into top graphs and lower tables. Top shows S&P 500 valuation metrics (P/E, P/B) over time. Bottom has tables comparing sector metrics and Z-scores across 10- and 30-year horizons.
Financial Performance
Financial Services
This slide presents both absolute and relative valuation metrics for the S&P 500 and sectors. It compares metrics like EV/EBITDA and P/E ratios, highlighting sector dispersion and relative over/undervaluation via Z-scores.
valuation, P/E, P/B, sectors, Z-score, EV/EBITDA, financial ratios, S&P 500
false
Valuation: Absolute and RelativeUS Weekly Kickstart The rise of passive ownership
Multiple Chart
Goldman Sachs
View slide
Three sets of vertical bar charts for cumulative cost savings, operating expenses, and integration-related costs. Data is shown by year.
Operational Efficiency
Financial Services
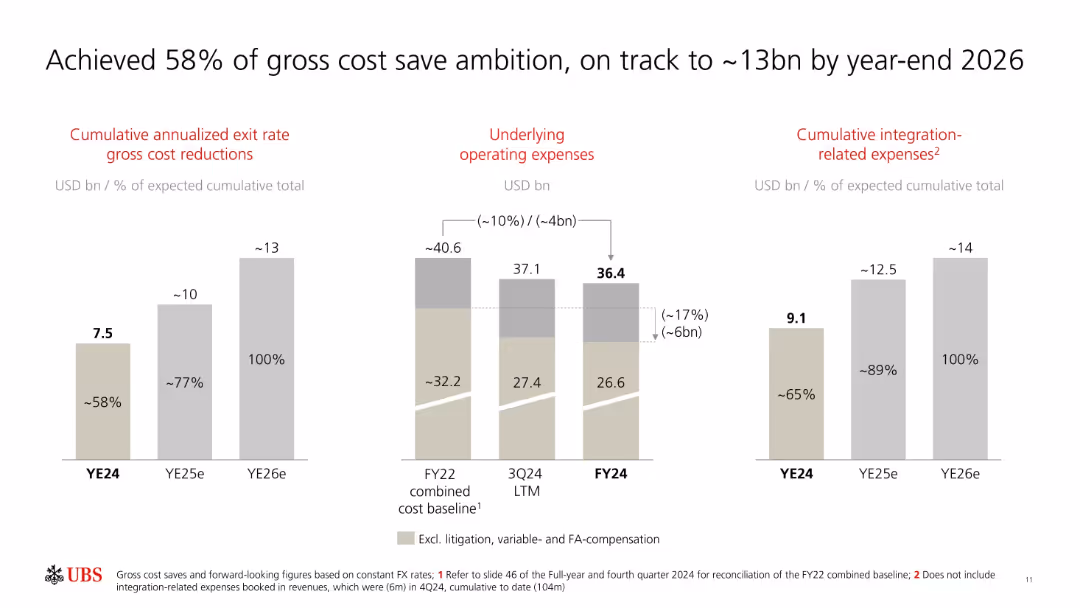
UBS reports achieving 58% of its cost save target by YE24 and projects reaching 13bn in savings by YE26. The slide details declines in operating expenses and outlines cumulative integration costs.
UBS, cost savings, integration, operating expenses, YE24, YE26, targets, financial strategy, efficiency
false
Achieved 58% of gross cost save ambition, on track to ~13bn by year-end 2026Full-year and fourth quarter 2024 Fixed Income investor presentation
Multiple Chart
UBS
View slide
Tabular data on wholesale lending exposure, coverage ratios by sector, and two line charts displaying UK and US cards arrears over time for 30-day and 90-day periods.
Risk Assessment and Management
Financial Services
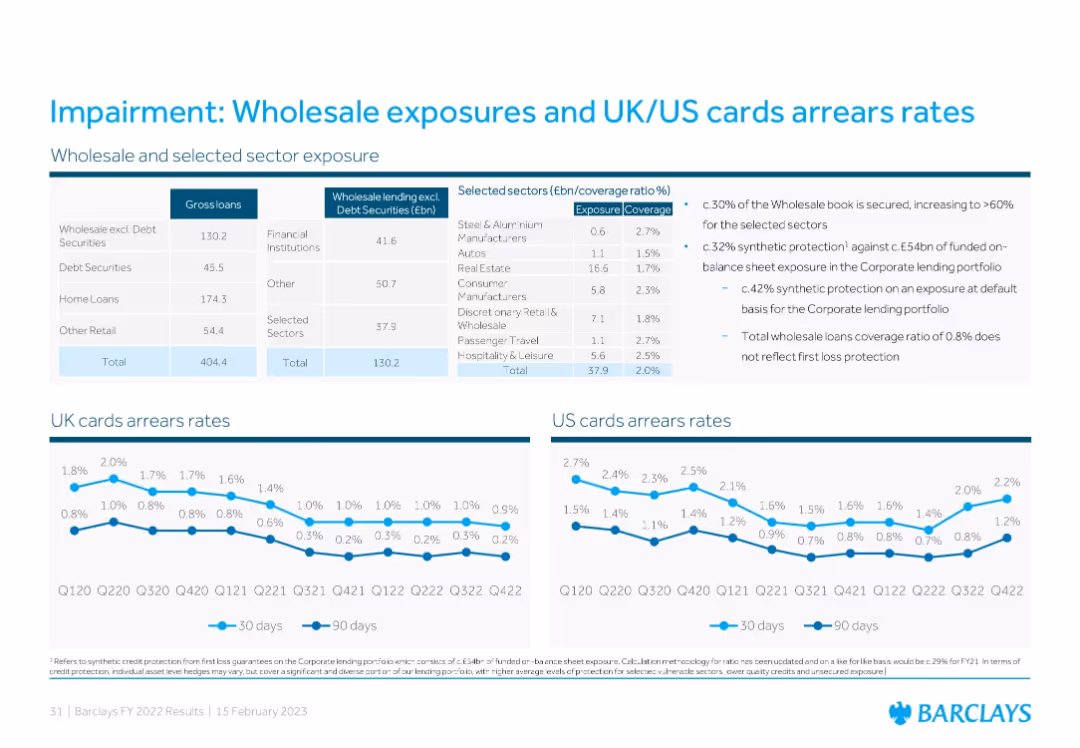
The slide outlines Barclays’ wholesale and sector loan exposures and impairment coverage, showing UK and US credit card arrears trends. It notes the secured portion of the wholesale book, synthetic protections, and impairment rate stabilization, illustrating credit quality and risk management efforts.
impairment, wholesale loans, arrears rates, coverage, credit risk
false
Impairment: Wholesale exposures and UK/US cards arrears ratesBarclays PLC FY 2022 Results
Multiple Chart
Barclays
View slide
Side-by-side comparison of Web2 and Web3, with visual elements and text to illustrate differences.
Technology and Digital Transformation
Technology & Software
Explains the transition from Web2 to Web3, including shifts in data ownership, business models, and technological infrastructure.
Web2 vs Web3, tech trend, data ownership, business model, technical infrastructure
false
What is the tech trend about?McKinsey Technology Trends Outlook 2022 Web3
Boxed
McKinsey
View slide
This slide shows the distribution of food loss across different stages of the agricultural value chain in Nigeria, using column charts to highlight the significant economic impact of these losses.
Strategic Planning
Agriculture & Food Production
The slide details the economic toll of food loss in Nigeria, mapping the journey of food from production to retail and illustrating how losses at each stage contribute to a substantial reduction in GDP. It emphasizes the need for strategic interventions in the agricultural sector.
Food Loss, GDP, Agriculture, Nigeria, Economic Impact
false
Nigeria loses 80M tons of food annually along the value chain; equivalent to 9% of its GDPSocio-economic case for deepening solar PV deployment in Nigeria
Mixed Chart
BCG
View slide
Horizontal bar chart ordered by sector TSR with width indicating market cap
Financial Performance
Financial Services
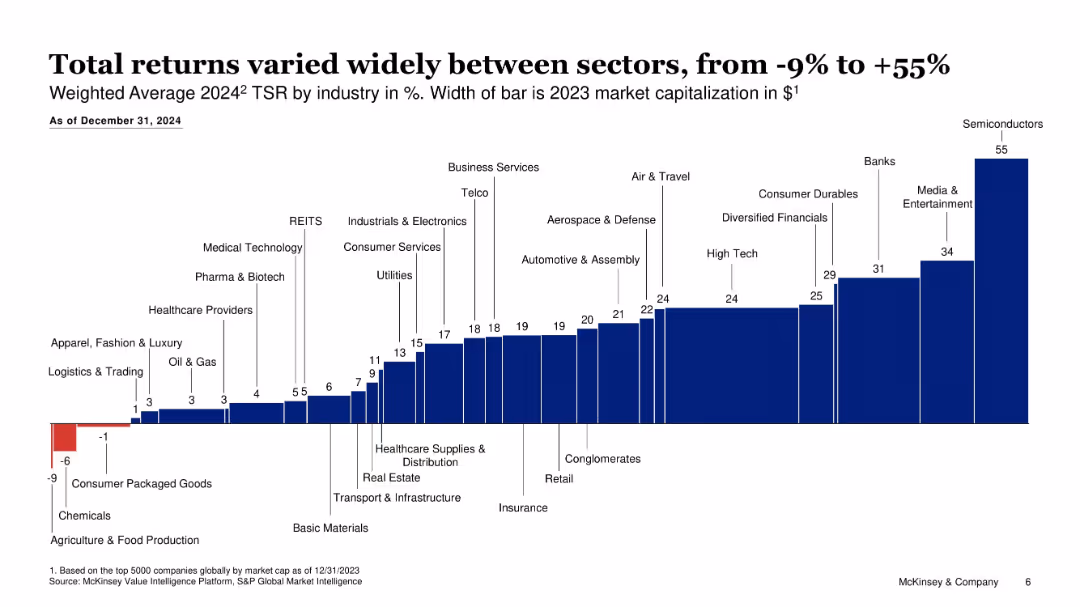
Analyzes 2024 TSR by sector, with semiconductors leading at 55% and consumer packaged goods underperforming at -6%; reveals broad variance across sectors.
TSR, industry returns, sector performance, capital markets, variance, semiconductors
false
Total returns varied widely between sectors, from -9% to +55%Review of 2024 capital markets performance
Single Chart
McKinsey
View slide
Side-by-side bar charts comparing domestic vs. foreign investment shares in APAC and SEA
Investment Analysis
Environmental Services & Sustainability
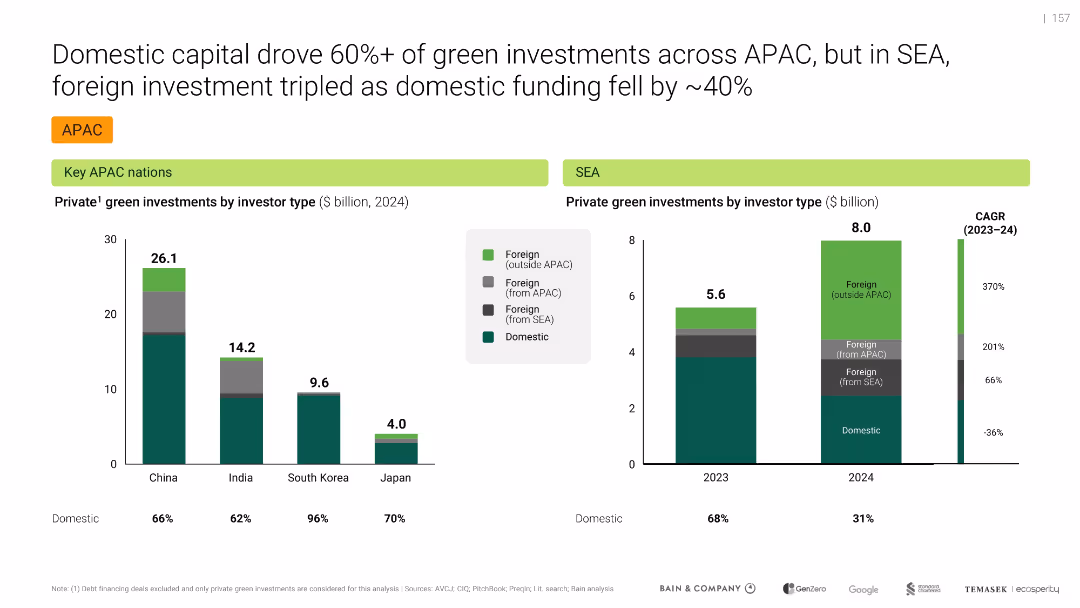
Shows a shift in SEA green investment sources: foreign capital (especially outside APAC) tripled in 2024, while domestic funding fell. Highlights domestic-heavy profiles for countries like South Korea.
Foreign investment, Domestic capital, SEA, APAC, Green funds, 2024, Capital flows, Infrastructure, Foreign vs domestic
false
Domestic capital drove 60%+ of green investments across APAC, but in SEA, foreign investment tripled as domestic funding fell by ~40%Southeast Asia's Green Economy
Multiple Chart
Bain
View slide
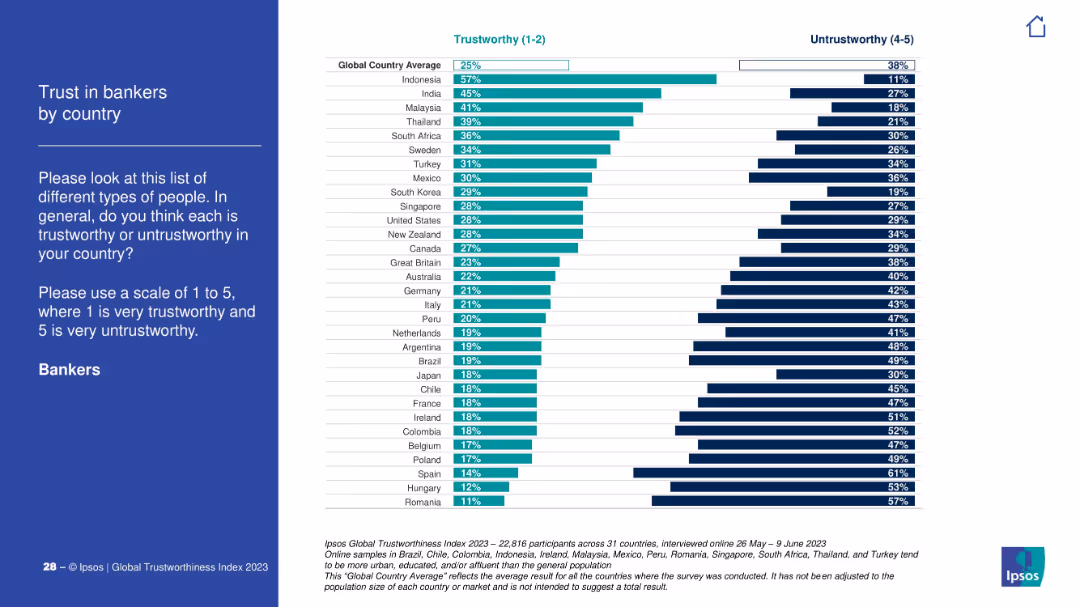
Traditional layout with explanation on left and bar comparison chart on right. Depicts trust scores of bankers by country.
Financial Performance
Financial Services
This slide shows how much people trust bankers globally. Indonesia and India lead in trustworthiness; Romania and Hungary have the lowest trust levels.
finance, bankers, trust score, country index, Ipsos, global, public perception, banking sector
false
Trust in bankers by countryIPSOS GLOBAL TRUSTWORTHINESS INDEX 2023
Mixed Chart
IPSOS
View slide
Line charts showing US y/y average hourly earnings and inflation, and real consumption expenditures and disposable income trends.
Market Analysis and Trends
Consumer Goods
Shows how growth in real disposable income sustains consumer spending, even as the labor market cools.
disposable income, consumer spending, earnings, inflation, consumption, line chart, US economy, labor market, income trends
false
Continued growth in real disposable income is keeping consumer spending on a positive track; this tailwind should persist even as the labor market coolsMacroeconomic outlook and impact on businesses
Multiple Chart
EY
View slide
The slide presents tables and bullet points to illustrate financial data, with contrasting colors for different categories and emphasis on key figures.
Financial Performance
Financial Services
Outlines the financial results of Macquarie Asset Management, detailing various income and expense categories, and highlighting performance fee contributions.
Asset Management, Income, Fees, AUM, Profit
false
Macquarie Asset ManagementMorgan Stanley Virtual Hong Kong Summit
Table
Morgan Stanley
View slide
Includes a projection bar chart of GHG emissions from generators up to 2030, segmented by residential, commercial, and industrial contributions, in a clear and straightforward visual format.
Regulatory and Compliance
Environmental Services & Sustainability
Projects future greenhouse gas emissions from generators in Nigeria, providing insights for policy and infrastructure planning to mitigate these emissions.
GHG projections, 2030, Nigeria, policy planning, emissions mitigation
false
Based on current trajectory, total GHG emissions from generator is expected to increase by 45% in 2030, with residential segment contributing 19%Socio-economic case for deepening solar PV deployment in Nigeria
Single Chart
BCG
View slide
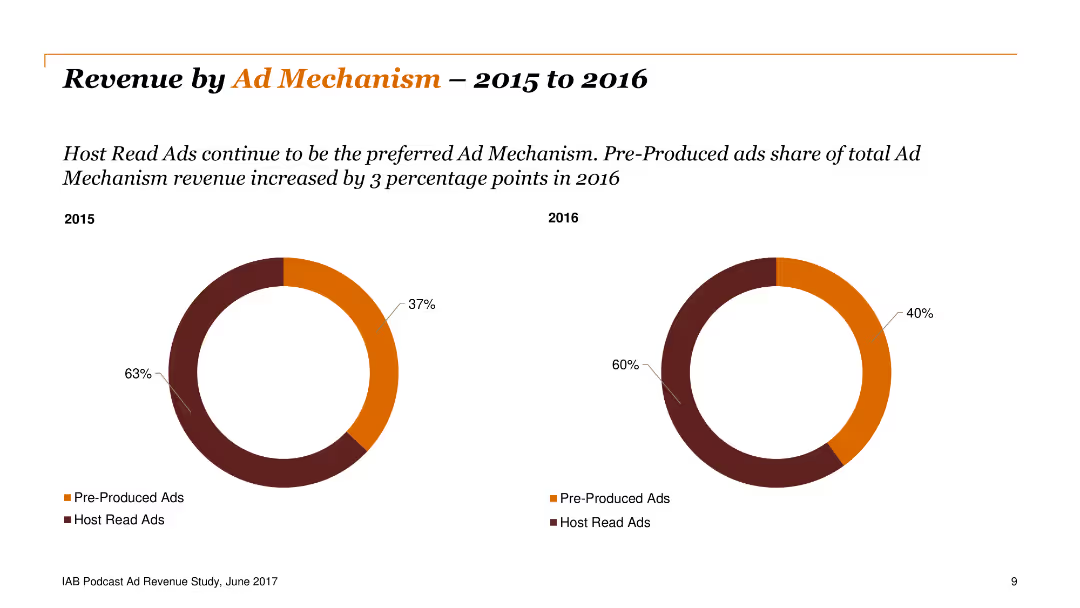
Two doughnut charts showing the distribution of revenue by ad mechanism, indicating a preference shift from host-read ads to pre-produced ads between 2015 and 2016.
Financial Performance
Media & Entertainment
This slide shows the change in ad revenue distribution by mechanism, noting a shift towards pre-produced ads. Important for understanding changes in advertising preferences.
revenue, ad, mechanism, host, pre-produced
false
Revenue by Ad Mechanism –2015 to 2016IAB Podcast Ad Revenue Study: An Analysis of the Largest Players in the Podcasting Industry
Multiple Chart
PwC/Strategy&
View slide
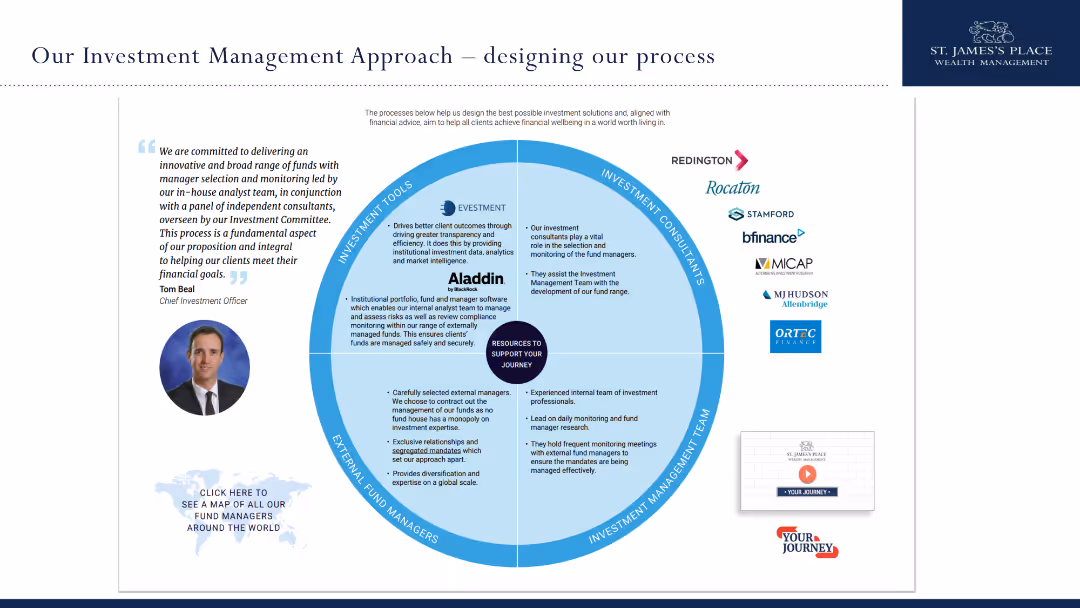
The slide has a circular diagram showing the different components of the investment management approach at St. James's Place.
Strategic Planning
Financial Services
It details the investment management process at St. James's Place, including tools, consultants, teams, and managers that contribute to delivering client financial goals.
investment, management, approach, St. James's Place, process
false
Our Investment Management Approach designing our processExternal Asset Manager (EAM) Conference
Diagram
Deloitte
View slide
Contains a timeline and bar graphs showing investment amounts for top FoodTech deals in Europe over three years, with flag icons for company countries.
Investment Analysis
Agriculture & Food Production
Provides details on significant 2020 FoodTech deals in Europe, such as investments in Karma and Oatly. Highlights a shift from food delivery to upstream value chains like AgTech and Food Science, with a focus on sector investment trends.
FoodTech, Europe, 2020, Investment Trends, Top Deals, AgTech, Food Science
false
Top European FoodTech Deals in 2020The Swiss FoodTech Ecosystem 2021
Multiple Chart
Accenture
View slide
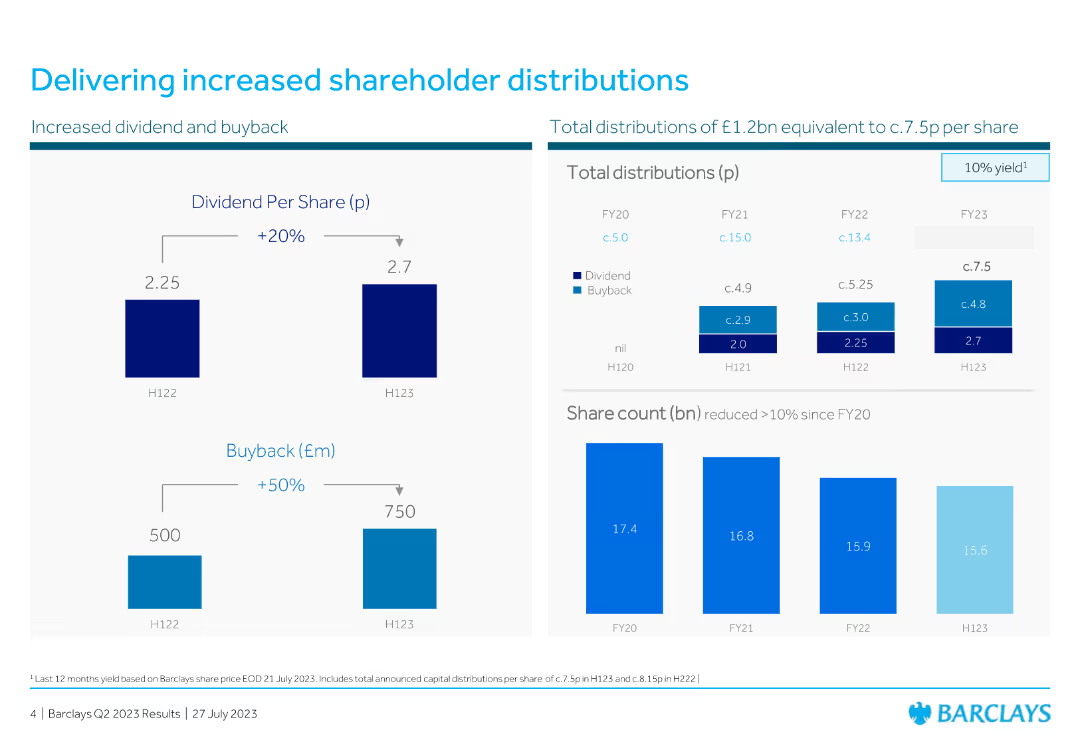
The slide features two vertical bar charts and one horizontal bar chart showing dividend per share, buyback amounts, and share count.
Financial Performance
Financial Services
This slide provides data on shareholder distributions, including dividends and buybacks over different periods, demonstrating an increase in both areas.
dividend, buyback, shareholder, distribution, financial, performance, bar chart, vertical bar, column chart, horizontal bar chart
false
Delivering increased shareholder distributionsBarclays PLC Q2 2023 Results Presentation
Multiple Chart
Barclays
View slide
A textual slide with headers and bullet points. It divides the ecommerce market into two segments, with company logos to represent examples.
Product and Service Analysis
Retail & E-commerce
Discusses the segmentation of the SEA ecommerce market into first-hand and second-hand goods, including the business models and monetization strategies of each, along with market size data and notable companies in the region.
eCommerce, SEA, market segments, first-hand goods, second-hand goods
false
The eCommerce market is split into two key segments, each with a different operating and monetization modele-Conomy SEA Unlocking the $200 billion digital opportunity in Southeast Asia
Header Vertical
Bain
View slide
Mixed chart and commentary layout. Bar graph on left side, supporting commentary on right with highlighted callout box and quotes at the bottom. Follows dotted grid background.
Product and Service Analysis
Retail & E-commerce
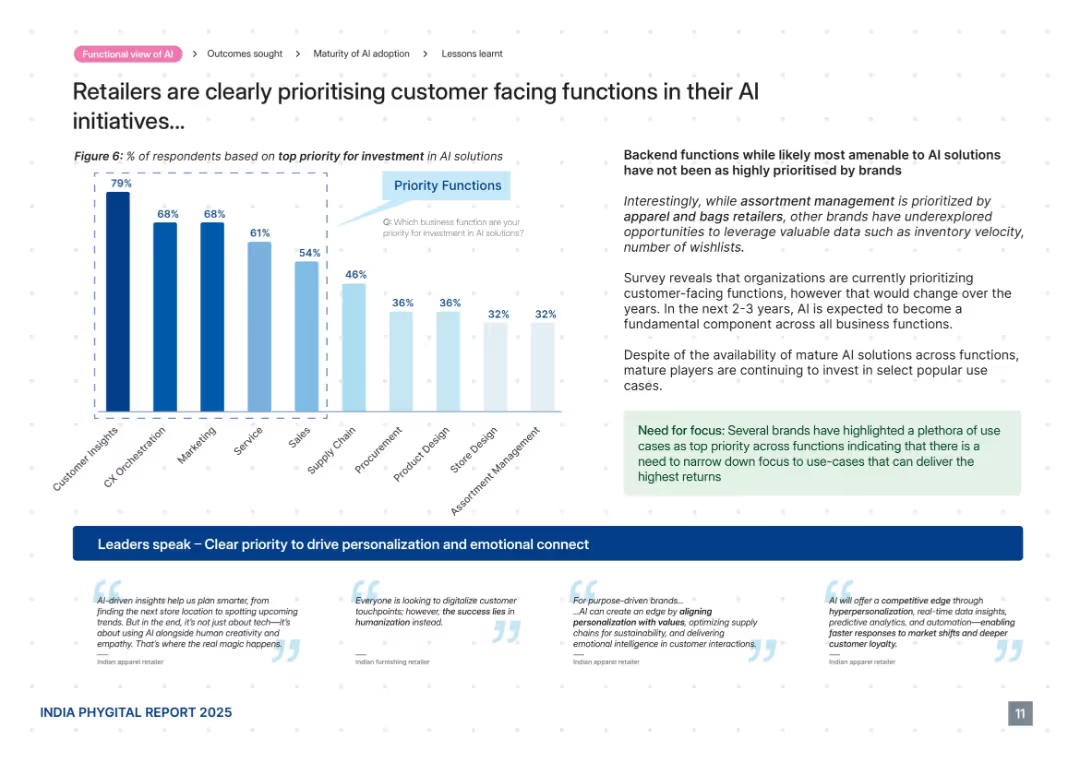
This slide reveals that retailers are prioritizing customer-facing AI functions such as customer insights, CX orchestration, and marketing over backend operations. It highlights the trend of using AI for personalization and emotional connection. Despite backend potential, most investments are going toward functions with visible customer impact and faster returns.
AI investment, customer insights, marketing, CX orchestration, personalization, emotional connect, priorities
false
Retailers are clearly prioritising customer facing functions in their AI initiatives...AI in Retail
Mixed Chart
PwC/Strategy&
View slide
Features two line charts comparing wage inflation measures and core inflation trends, with annotations for clarity. It uses a dual-axis for percentage comparison.
Financial Performance
Financial Services
Discusses the discrepancy between wage and price inflation, emphasizing their high rates, possibly used in financial reviews or policy discussions.
wage inflation, price inflation, economic trends, financial reviews, policy discussions
false
Wage and price inflation is running too highTHE ECONOMY AND ITS IMPACT ON AFFORDABLE HOUSING
Multiple Chart
Citigroup
View slide
This slide includes a bar chart showing the percentage of respondents standardizing the purchase of various medical supplies and equipment across regions.
Operational Efficiency
Healthcare & Pharmaceuticals
This slide highlights the trend of hospitals standardizing purchasing practices for medical consumables and equipment, with a regional comparison of priorities.
purchasing standardization, medical supplies, diagnostic equipment, hospital priorities, regional comparison
false
Hospitals prioritize standardizing purchasing in medical consumables, diagnostic imaging equipment, and support appliances more than last year2023 APAC Hospital Insights Survey Findings for Healthcare Providers
Single Chart
LEK
View slide
The slide features a column chart comparing revenue developments of major card schemes and payment service providers, and another showing return on capital employed (ROCE) for these entities. Text discusses revenue and profitability trends.
Financial Performance
Financial Services
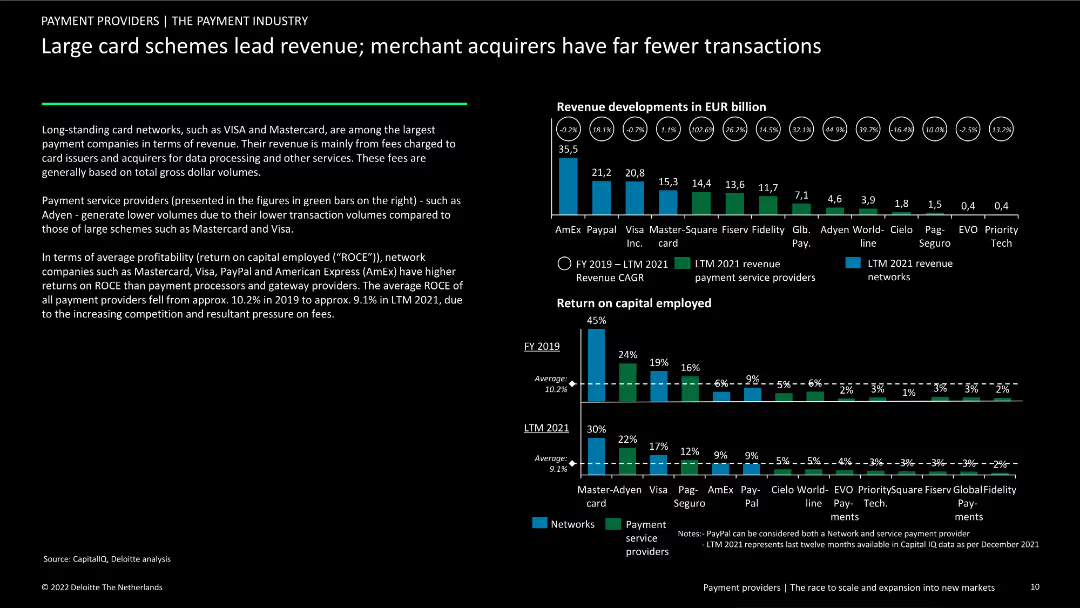
This slide compares the revenue and profitability of large card schemes like Visa and Mastercard with payment service providers such as PayPal. It highlights differences in transaction volumes and return on capital employed (ROCE).
card schemes, revenue, payment service providers, ROCE, trends
false
Large card schemes lead revenue; merchant acquirers have far fewer transactionsPayment providers | The race to scale and expansion into new markets
Multiple Chart
Deloitte
View slide
Two-panel layout: bar chart on peer comparison + vertical bar on client rankings
Competitive Landscape
Financial Services
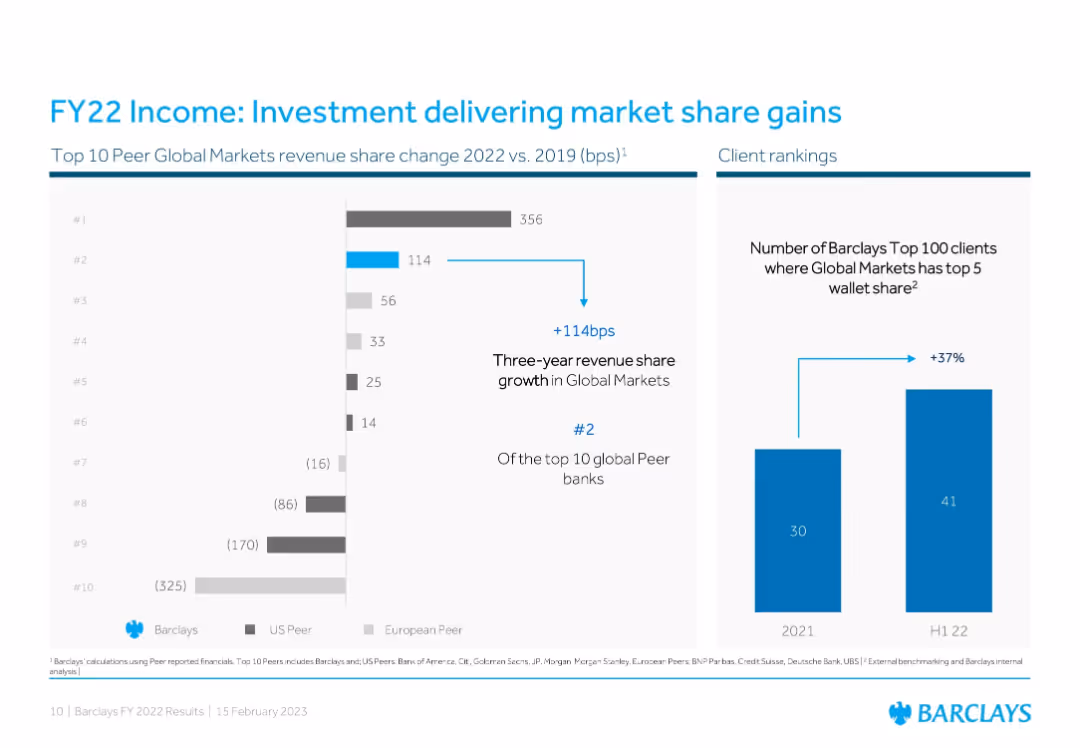
Demonstrates Barclays’ improvement in Global Markets revenue share and client penetration. A bar chart shows Barclays gaining 114 bps since 2019, ranking #2 among peers, while a second graph shows a 37% rise in top-client share penetration.
Market Share, Barclays, Client Ranking, Global Markets, Peer Comparison, Revenue, FY22
false
FY22 Income: Investment delivering market share gainsBarclays PLC FY 2022 Results
Multiple Chart
Barclays
View slide
The slide features a white background with text and a column chart showing company-level ESR ratios for Japan. It discusses Japan's transition to a new capital regime (ESR) by 2025, including changes to regulatory intervention points and the use of company-level data for initial calibration of the ESR scalar.
Regulatory and Compliance
Financial Services
This slide provides an example of a regime change in Japan, focusing on the move to an economic value-based capital regime (ESR) and the use of company-level data for calibration. It highlights the upward trend in ESR ratios and the expected analysis refresh in 2025.
Japan, regime change, ESR, capital regime, calibration
false
REGIME CHANGE EXAMPLE: JAPANScalar calibration For Life insurance business
Mixed Chart
Oliver Wyman
View slide
The slide features an image of a microchip and text discussing the risks associated with AI and ML. The right side lists actions taken by organizations to manage these risks.
Technology and Digital Transformation
Technology & Software
The slide explores the risks of AI and ML in the insurance industry, including governance structures and controls to ensure responsible use.
AI risks, ML, governance, responsible use, insurance
false
When it comes to environmental risks, far more survey respondents in the Asia-Pacific region (62%) and EMEIA (54%) cite it as a top emerging risk vs. only 29% in the Americas.Risk management in a time of transformation
Multiple Chart
EY
View slide
Text-heavy layout with two supporting bar charts below. Left text outlines the challenges and opportunities in modular construction. The first chart shows current use, the second projects future adoption across firm types.
Strategic Planning
Real Estate & Construction
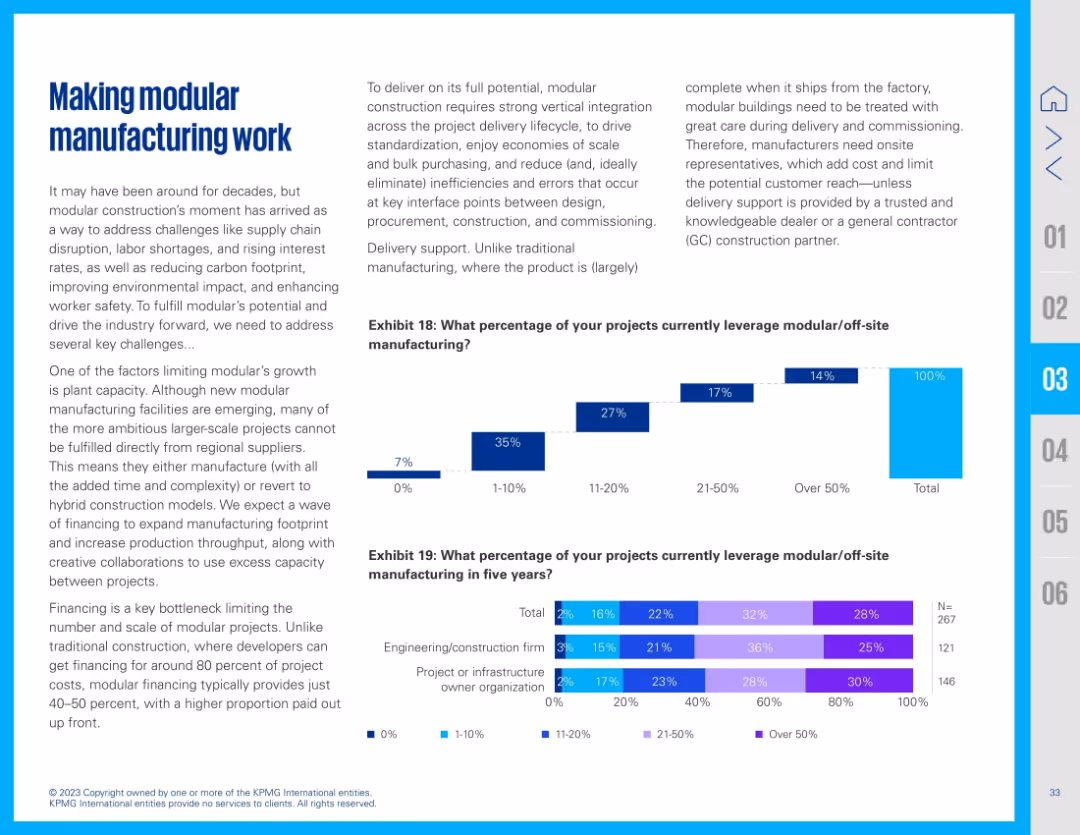
Describes the strategic push toward modular/off-site manufacturing. It addresses current adoption barriers like plant capacity and financing, while showing increased expectations for usage over the next five years across engineering and infrastructure firms.
modular construction, off-site, prefab, financing, plant capacity, engineering, infrastructure
false
Making modular manufacturing workFamiliar challenges - new approaches
Multiple Chart
KPMG
View slide
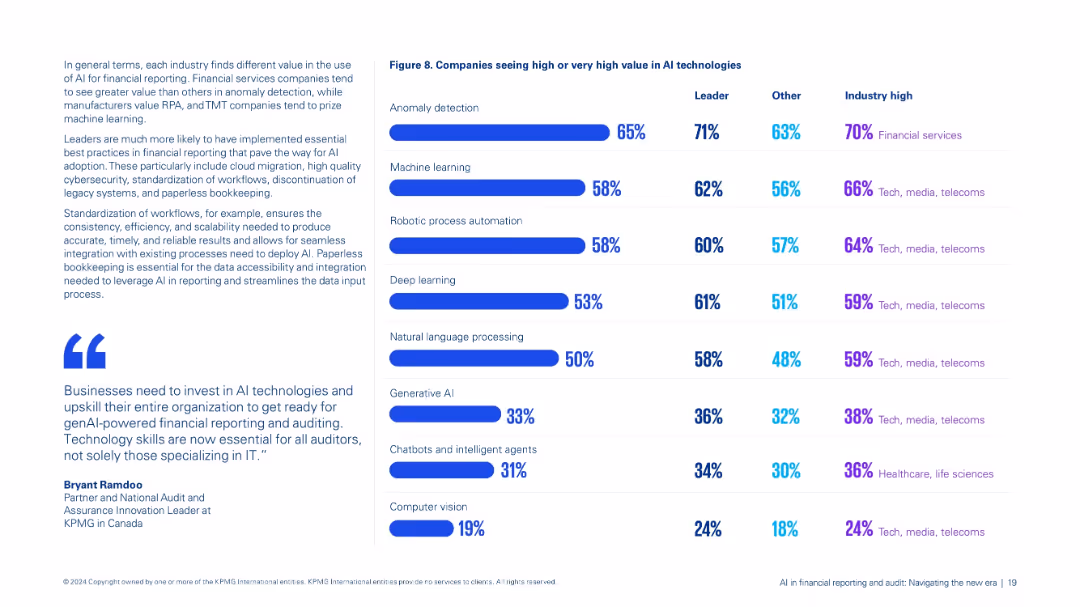
Dual-column layout: left contains contextual text and quotes; right features a bar chart comparison (Figure 8) of AI technology value perceptions.
Market Analysis and Trends
Financial Services
Compares perceived value across AI technologies like anomaly detection, machine learning, and genAI by leaders and others, highlighting industry-specific trends, especially in financial services and TMT sectors.
AI technologies, anomaly detection, machine learning, industry trends, value perception
false
Companies seeing high or very high value in AI technologiesAI infinancial reporting and audit: Navigating the new era
Mixed Chart
KPMG
View slide
Contains a series of column chart detailing alternative investment asset under supervision and fees, with an emphasis on blue tones. There are also numerical lists presenting additional data on on-balance sheet investments.
Investment Analysis
Financial Services
Highlights the firm's alternative investment strategies, including assets under supervision and associated fees, designed for financial consultants or potential investors looking at alternative investment opportunities and their performance.
Alternative Investments, AUS, Fees, Strategy
false
Asset & Wealth Management – Alternative InvestmentsFull Year and Fourth Quarter 2022 Earnings Results Presentation
Mixed Chart
Goldman Sachs
View slide
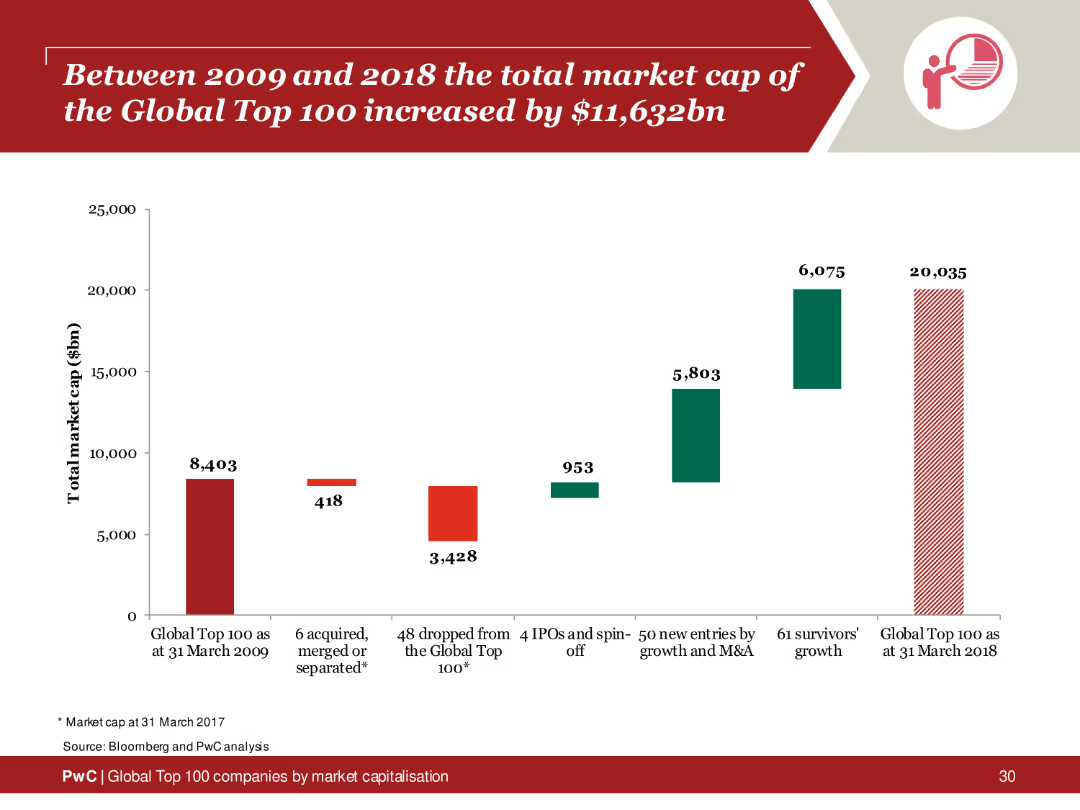
Column chart depicting the total market cap increase of the Global Top 100 companies from 2009 to 2018, highlighting growth areas and key contributors.
Financial Performance
Financial Services
Analysis of the market cap increase of the Global Top 100 companies over a decade, emphasizing significant growth and contributing factors.
market cap, global top 100, 2009, 2018, increase
false
Between 2009 and 2018 the total market cap of the Global Top 100 increased by $11,632bnGlobal Top 100 companies by market capitalisation
Single Chart
PwC/Strategy&
View slide
The slide features two line charts with time-series data from 2007 to 2023. The charts depict the JPMorgan Global Purchasing Managers’ Index for Manufacturing and Services. The visual elements are placed on a white background with a top header in blue containing the slide title and source information.
Market Analysis and Trends
Industrial & Manufacturing
This slide presents the stability of the global manufacturing sector and the visible expansion in services as of July, with a detailed analysis of the JPMorgan Global PMI. It could be used to discuss market trends and economic outlooks.
PMI, Manufacturing, Services, Economic Outlook, Stability, Expansion, JPMorgan, Index, Global Sector, July
false
Global manufacturing sector remained stable in July, while some slowdown in expansion was also visible in servicesGlobal Economics Intelligence (August 2023)
Mixed Chart
McKinsey
View slide
This slide contains multiple pie charts, a column chart, and detailed text sections.
Financial Performance
Financial Services
The slide presents a financial comparison of firmwide assets and management fees, along with asset mix and regional distribution.
Assets, Management, Wealth, Distribution, Pie Chart, Column Chart, Financial, Regional, Supervision, Fees
false
Asset Management and Consumer & Wealth Management DetailsSecond Quarter 2022 Earnings Results Presentation
Multiple Chart
Goldman Sachs
View slide
Contains line charts depicting the growth in exports and FDI outflows for several country groups, presented with a clean and organized layout.
Market Analysis and Trends
Financial Services
This slide explores the projection of export capabilities and FDI flows, crucial for understanding future economic interactions and investments.
exports, FDI flows, economic analysis, BRICS, investment opportunities
false
Following economic growth, rising annual disposable income will gradually help to establish a middle class in developing countriesRoland Berger Trend Compendium 2030 Megatrend 2 Globalization & future markets
Mixed Chart
Roland Berger
View slide
The slide contains a line chart comparing the volume of wheat exports from Canada, Australia, and Ukraine from 1999 to 2018. It also includes key data points and CAGR.
Market Analysis and Trends
Agriculture & Food Production
The slide illustrates the significant growth in wheat exports from Ukraine compared to Canada and Australia, with data highlighting Ukraine's competitive edge in recent years.
Wheat exports, Canada, Australia, Ukraine, CAGR, market trends, export volume, agriculture, food production, growth rate
false
Canada and Ukraine are rapidly increasing exports compared with Australia, with Ukraine in particular experiencing fast volume growth ratesInternational Comparison of Australia’s Freight and Supply Chain Performance
Mixed Chart
LEK
View slide
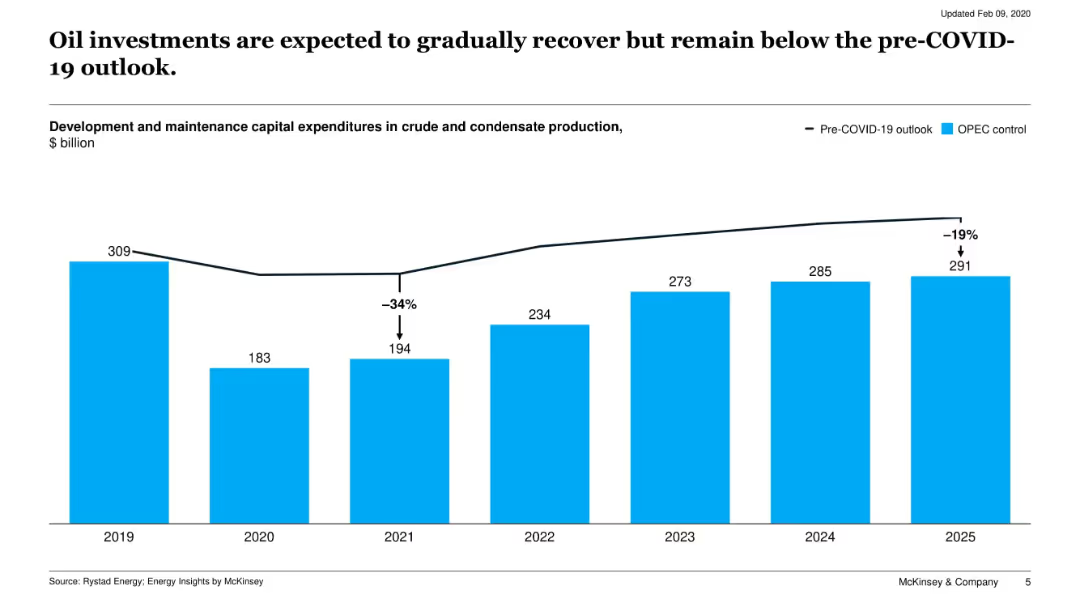
Bar chart of capital expenditures in crude and condensate production from 2019 to 2025, contrasting actual vs. pre-COVID-19 projections.
Investment Analysis
Energy & Utilities
The slide examines oil sector investment trends, showing a steep drop in 2020 followed by gradual recovery through 2025. It highlights the gap between actual spending and pre-COVID expectations.
oil investment, capex, COVID-19, recovery, energy outlook, production costs
false
Oil investments are expected to gradually recover but remain below the pre COVID 19 outlook.Global oil outlook to 2040
Single Chart
McKinsey
View slide
This slide features multiple line charts tracking performance forecasts across three categories: passenger cars/light trucks, trucks, and specialties. Each chart includes two lines representing the years 2022 and 2023 with shaded areas between them, illustrating projections and past performance. Icons represent each category and textual annotations provide additional context and previous forecast comparisons.
Market Analysis and Trends
Transportation & Logistics
The slide presents a market scenario for fiscal year 2023, with slight improvements in passenger cars/light trucks and ongoing destocking in trucks. It includes a detailed analysis of trends in various sub-categories of the tire industry such as mining, aircraft, and two-wheel tires. It aims to provide an updated market outlook and forecast changes, suggesting industry trends and market conditions.
market, forecast, tires, performance, trend, passenger, truck, specialty, projections, destocking
false
2023 FY markets scenario: slight market improvement in PC/LT, ongoing destocking in TruckRoad Show US West Coast Morgan Stanley
Multiple Chart
Morgan Stanley
View slide
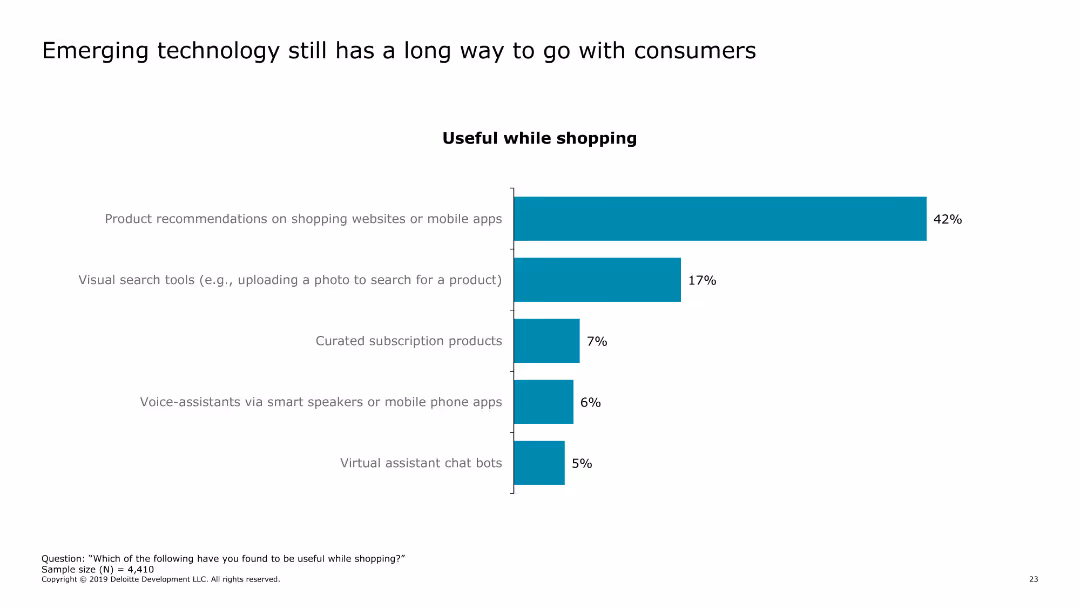
This slide features a column chart showing the usefulness of various shopping technologies. The chart includes categories like product recommendations, visual search tools, curated subscription products, voice assistants, and virtual assistant chat bots.
Technology and Digital Transformation
Technology & Software
The slide presents data on consumer perceptions of emerging shopping technologies, highlighting the percentage of users who find each technology useful while shopping. It emphasizes the gaps in technology adoption and usefulness.
shopping technology, consumer technology, retail tech, product recommendations, visual search
false
Emerging technology still has a long way to go with consumers2019 Holiday Survey of Consumers Keeping the good times rolling
Single Chart
Deloitte
View slide
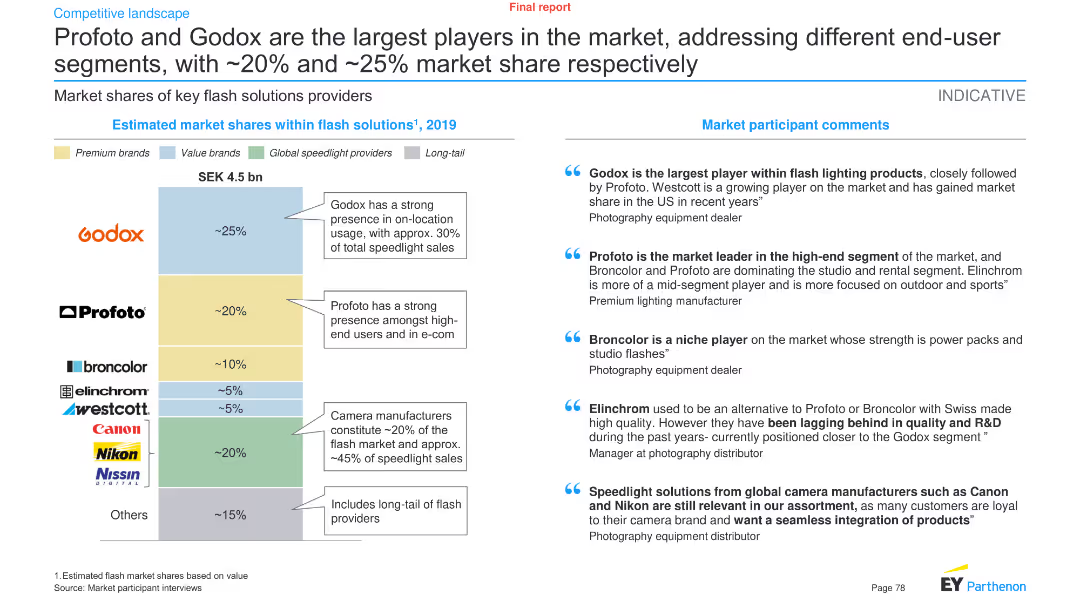
This slide contains a column chart and text boxes comparing the market shares of key flash solution providers, along with participant comments.
Competitive Landscape
Technology & Software
It shows the market share distribution within flash solutions for 2019, highlighting the dominance of Godox and Profoto, along with insights from market participants.
Market share, flash solutions, Godox, Profoto, key players, segments, market, technology, analysis, trends
false
Profoto and Godox are the largest players in the market, addressing different end-user segments, with ~20% and ~25% market share respectivelyProject Spiritus Final report Market Study
Mixed Chart
EY
View slide
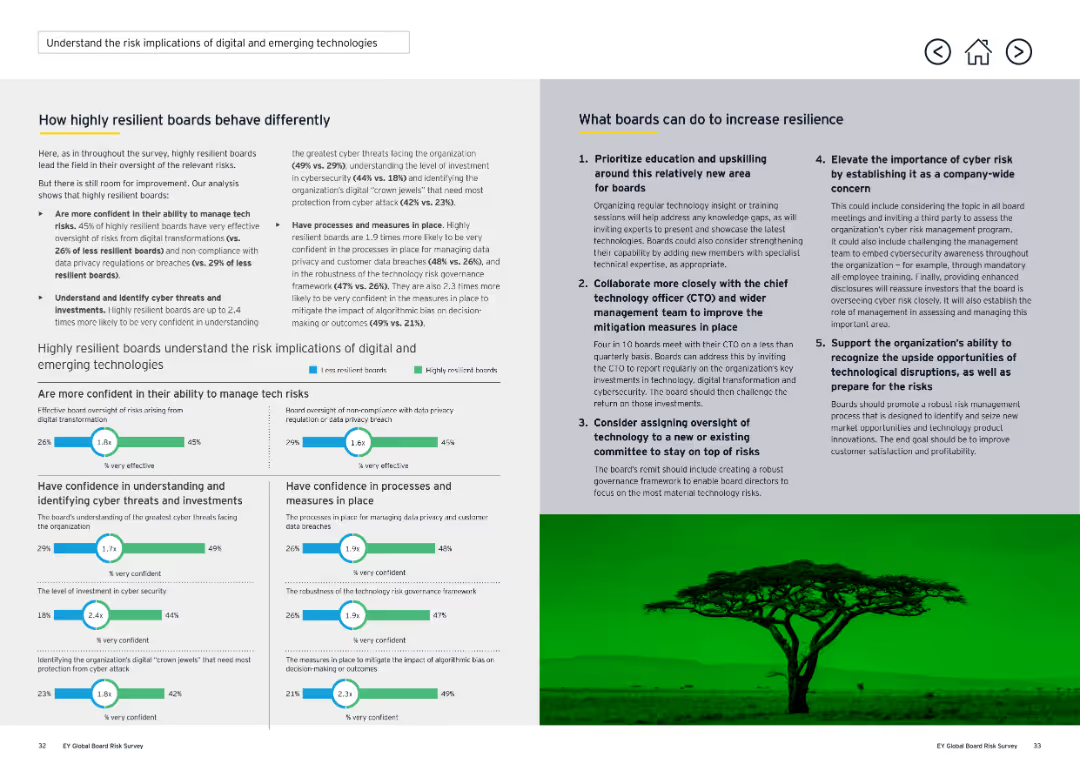
This two-column slide contains detailed text on both sides, with a horizontal line separating sections. It includes several comparative statistics and recommendations. The visual complexity is moderate.
Risk Assessment and Management
Technology & Software
The slide details how highly resilient boards manage tech risks better and what boards can do to increase resilience. It compares the confidence levels of different boards in managing technology risks and provides strategies for improvement, such as prioritizing education and upskilling.
Digital, Risk, Technology, Resilience, Boards
false
Here, as in throughout the survey, highly resilient boards lead the field in their oversight of the relevant risks.How can boards prioritize resilience to build trust and create value?
Multiple Chart
EY
View slide
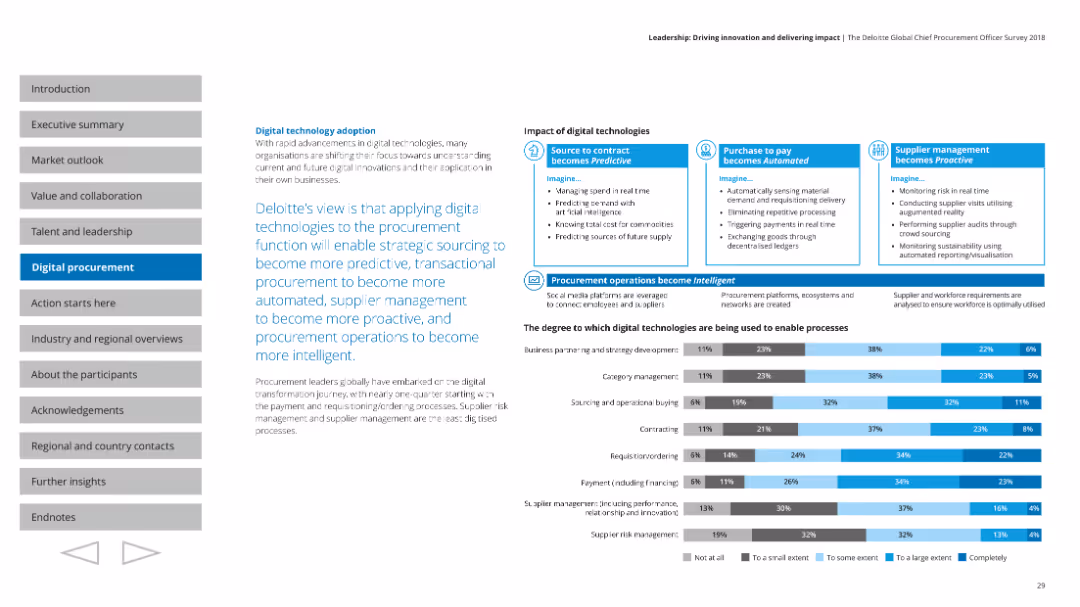
Contains a combination of charts and descriptive text blocks, highlighting the impact of digital technologies on procurement processes and strategies.
Technology and Digital Transformation
Professional Services
Describes the role of digital technologies in transforming procurement functions, making them more predictive, automated, and proactive.
Digital adoption, procurement, strategy, technology impact
false
Digital technology adoptionLeadership: Driving innovation and delivering impact The Deloitte Global Chief Procurement Officer Survey 2018
Mixed Chart
Deloitte
View slide
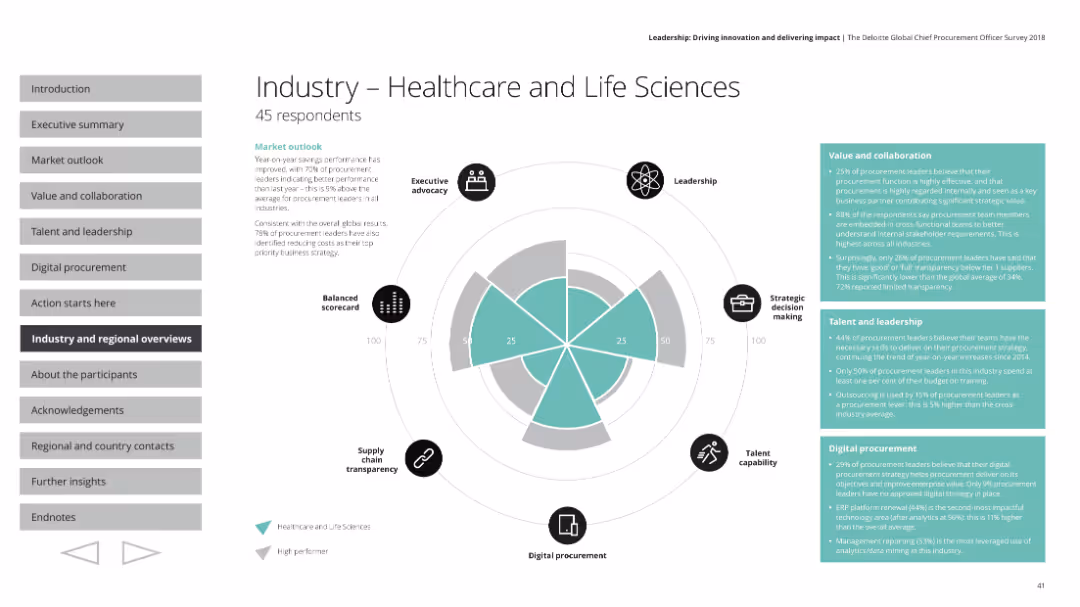
The slide shows a radar chart with various performance indicators, along with text boxes containing detailed survey results and small icons for each metric.
Industry Overview
Healthcare & Pharmaceuticals
This slide provides insights into the healthcare and life sciences industry's procurement performance from a survey. It discusses executive advocacy, leadership, strategic decision making, talent capability, digital procurement, and supply chain transparency, with market outlook and specific metrics on value, collaboration, talent, and leadership.
Healthcare, life sciences, procurement, radar chart, survey results
false
Industry - Healthcare and Life SciencesLeadership: Driving innovation and delivering impact The Deloitte Global Chief Procurement Officer Survey 2018
Mixed Chart
Deloitte
View slide
Text and image layout with multiple sections detailing strategies for Global Wealth Management, Personal & Corporate Banking, Asset Management, and Investment Bank.
Strategic Planning
Financial Services
Outlines UBS's strategic plans to enhance client franchises and capabilities across different business areas, aiming for growth and scale.
Strategy, Client Franchises, UBS, Growth, Capabilities
false
Accelerating our strategy by enhancing client franchises, capabilities and scaleThird quarter 2023 Fixed Income investor presentation
Multiple Chart
UBS
View slide
Dual-column layout with bar chart and bullet-point comparison of two growth scenarios
Strategic Planning
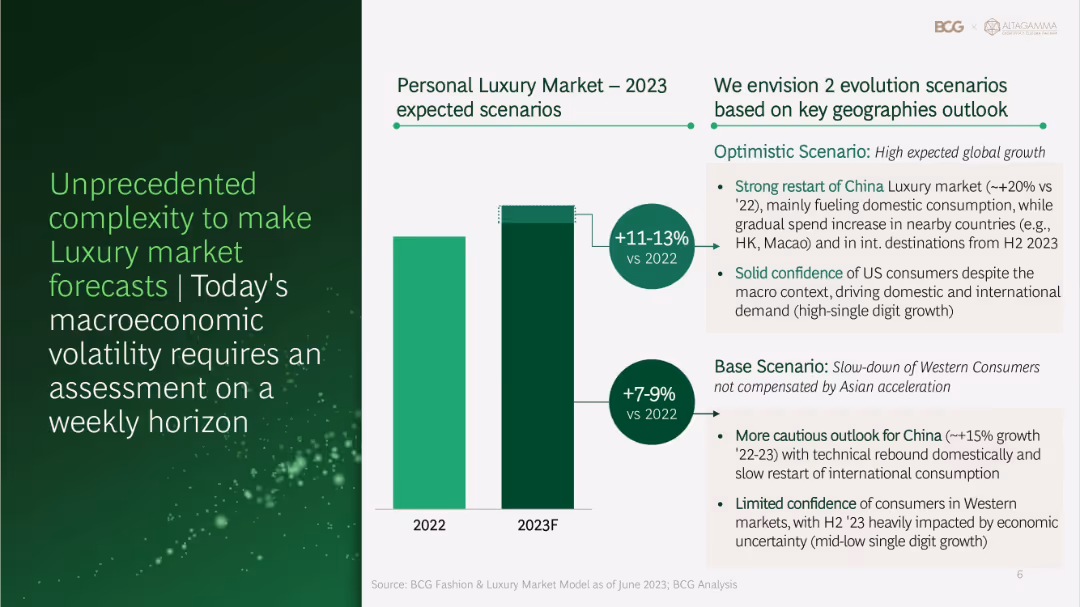
Consumer Goods
The slide presents two 2023 outlook scenarios for the personal luxury market: optimistic and base case. Each is supported by forecasts and macroeconomic drivers such as China's consumption rebound and Western consumer sentiment. A bar graph compares expected growth.
luxury market, forecast, China, consumer behavior, economic outlook, growth scenario, macroeconomic trends
false
Unprecedented complexity to make Luxury market forecastsTrue-Luxury Global Consumer Insights
Mixed Chart
BCG
View slide
Basic visual complexity, contrasting textual information with a relatable image.
Strategic Planning
Professional Services
Discusses the need for businesses to adapt to changes and disruptions, hinting at strategies for maintaining competitiveness and relevance.
business strategy, adaptability, global trends, disruptions
false
The region’s long-term prospects are promising, driven by structural factorsSoutheast Asia's digital consumers: A new stage of evolution
Mixed Chart
Bain
View slide
Central diamond-shaped diagram with four quadrants, each labeling a business division, paired with a side panel listing client types.
Financial Performance
Financial Services
Highlights the company's comprehensive approach to client services across different business divisions, aligning with strategic client management.
Client Focus, Goldman Sachs, Business Divisions, Client Services, Strategy, Diagram
false
Our Client Focus: Deliver One Goldman SachsGoldman Sachs Investor Day
Framework
Goldman Sachs
View slide
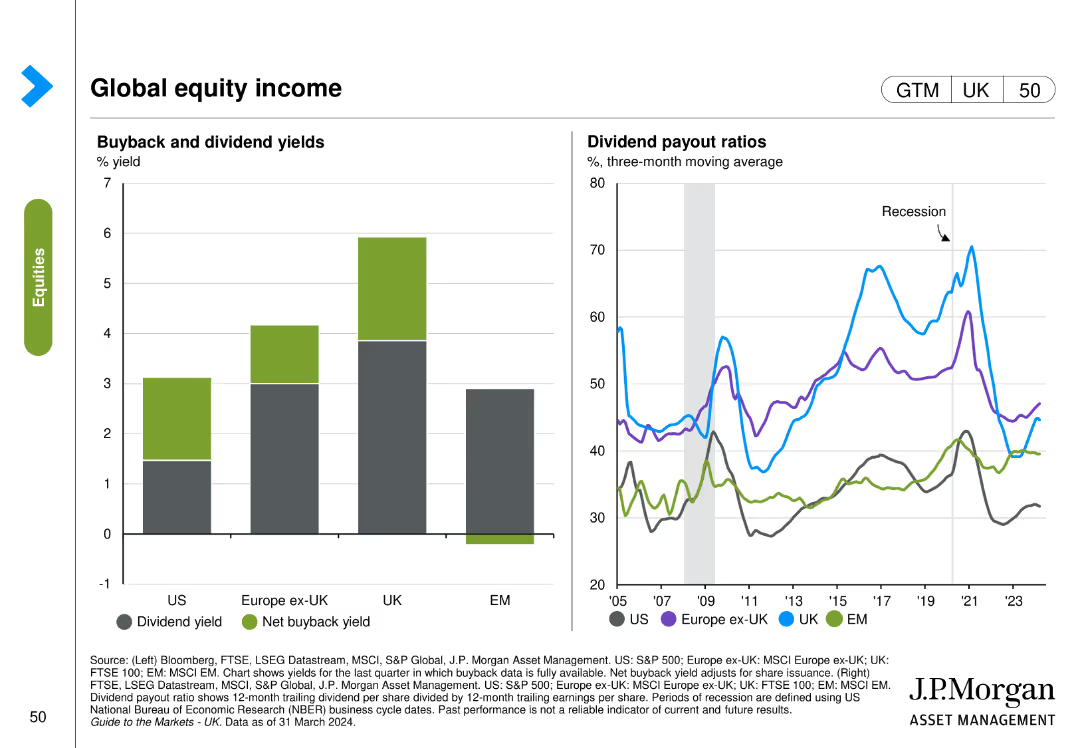
The slide includes two visual elements: a column chart on the left displaying buyback and dividend yields, and a line chart on the right showing dividend payout ratios over time.
Financial Performance
Financial Services
The slide examines global equity income by comparing buyback and dividend yields across regions and tracking dividend payout ratios over time.
dividend yield, buyback yield, payout ratios, equity income, global, financial performance
false
Global equity incomeGuide to the Markets UK | Q2 2024
Multiple Chart
JP Morgan
View slide
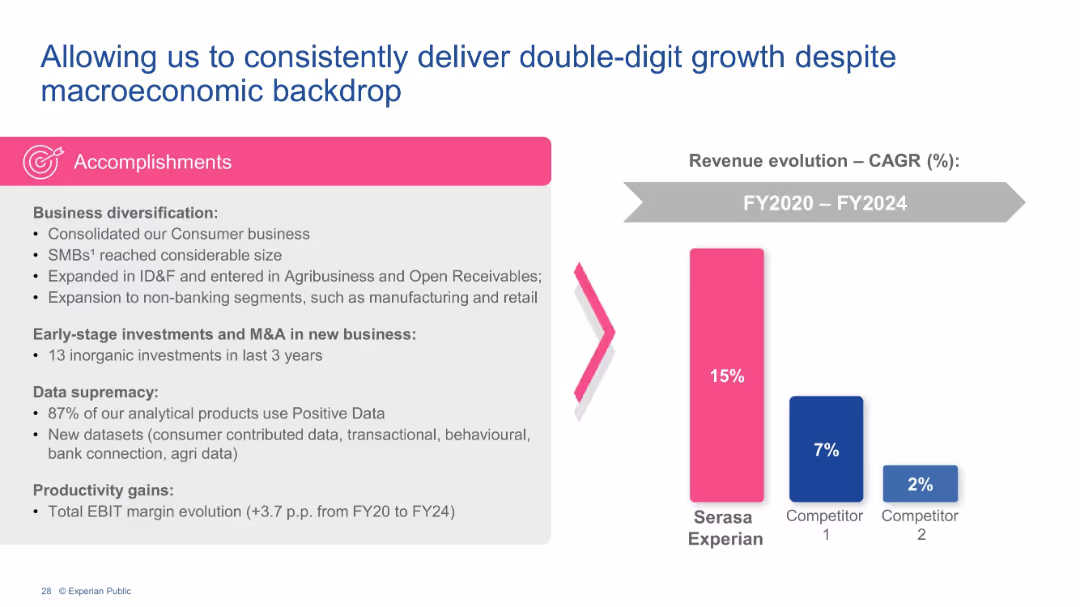
Two-column layout with business diversification text and a vertical bar chart comparing CAGR of Experian vs competitors.
Strategic Planning
Financial Services
Emphasizes Experian’s consistent double-digit revenue growth (15% CAGR FY20–FY24) versus competitors. Cites diversification, SMB growth, non-banking expansion, M&A, and use of Positive Data as key drivers.
CAGR, Experian, revenue growth, diversification, SMB, data analytics, M&A, macroeconomics
false
Allowing us to consistently deliver double-digit growth despite macroeconomic backdropBarclays Global Credit Bureau Forum
Mixed Chart
Barclays
View slide
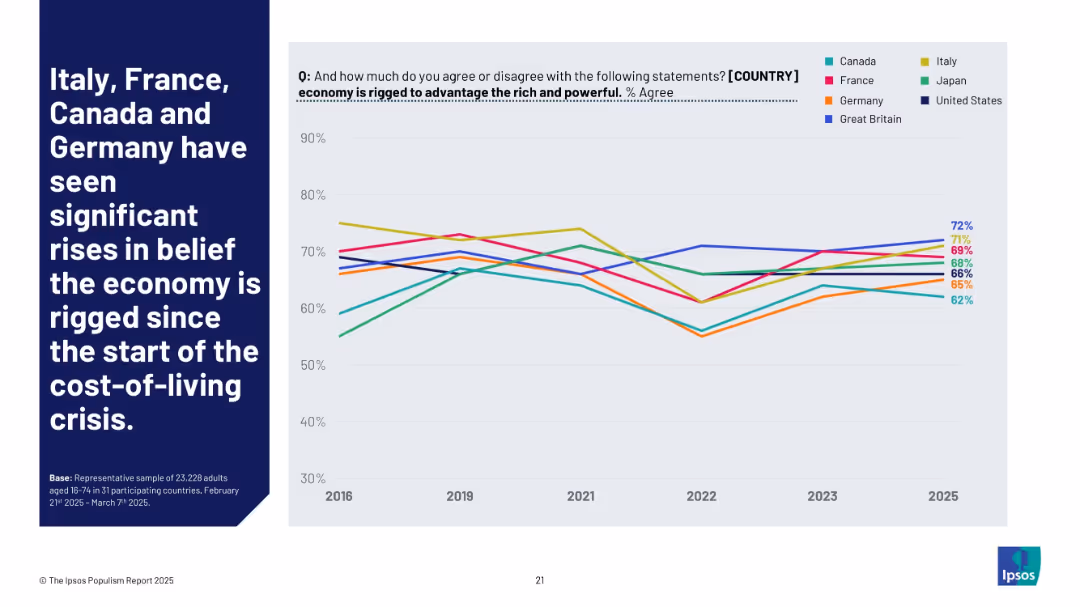
Line graph (2016–2025) showing how belief in economic rigging has trended across selected countries. Each country is shown with a distinct color-coded line.
Market Analysis and Trends
Government & Public Sector
This chart illustrates rising belief that national economies are biased in favor of elites. Italy, France, Canada, and Germany show sharp upward trends—especially since 2021—suggesting an impact from inflation and affordability concerns.
inflation, economy rigged, cost-of-living, public sentiment, trend data, Ipsos, inequality
false
Italy, France, Canada and Germany have seen significant rises in belief the economy is rigged since the start of the cost-of-living crisis.THE IPSOS POPULISM REPORT 2025
Mixed Chart
IPSOS
View slide
The slide presents a 6-step process infographic with SDG icons, detailed steps descriptions, and a side column of CSR results over the years in a table format. There are images of emulsifiers and a dessert on the right, symbolizing product output.
Client Case Studies
Environmental Services & Sustainability
This slide outlines Palsgaard's approach to Sustainable Development Goals (SDGs), focusing on energy, water, and CO2 emissions management, highlighted through a process chart and yearly CSR results demonstrating progress and targets for sustainable practices.
sustainability, CSR, CO2 emissions, energy, water
false
Palsgaard is an example of how to track the impact of the SDG initiatives and how to communicate itSDG Guide for Business Leaders
Vertical Flow
McKinsey
View slide
The slide includes column charts for the UK, Spain, France, Italy, and Germany, depicting the growth in tax-free shopping by tourists during 2016-2017. The bars are in shades of gray, and each country's performance is noted along with changes in transaction volumes and average ticket sizes.
Market Analysis and Trends
Consumer Goods
Provides data on the increase in tax-free shopping in Europe due to returning long-haul tourists. Highlights significant growth in countries like the UK and Spain, while noting a decline in Germany, aiding in understanding market recovery and tourist spending trends post-crisis.
tourism, Europe, luxury goods, tax-free shopping, market growth
false
LONG-HAUL TOURISTS BACK IN EUROPE WITH INCREASED VOLUMES IN MOST COUNTRIESALTAGAMMA 2017 WORLDWIDE LUXURY MARKET MONITOR
Single Chart
Bain
View slide
Text-heavy slide with a clear title and several bullet points; includes a timeline highlighting diversity milestones.
Organizational Structure and Change
Professional Services
Discusses the commitment to diversity, equity, and inclusion, showcasing programs and milestones, with the intent of building an inclusive and diverse workforce.
diversity, equity, inclusion, DEI, milestones, talent development, client service, corporate culture
false
Diversity, equity, and inclusionAccelerating Sustainable and Inclusive Growth
Table
McKinsey
View slide
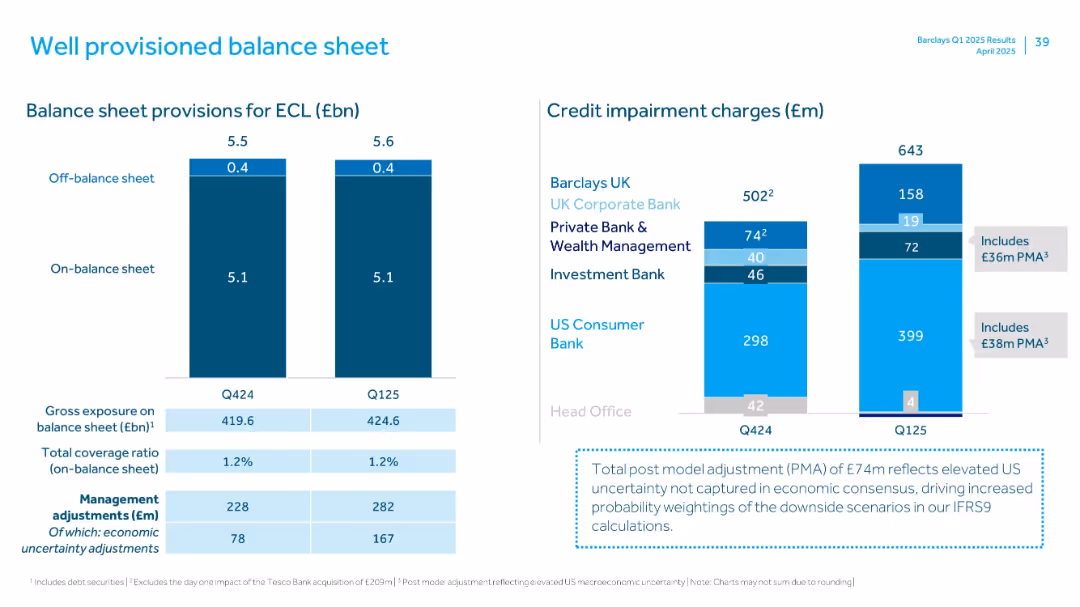
Dual panel with bar charts showing provisions for expected credit loss (ECL) and credit impairment by business
Risk Assessment and Management
Financial Services
Displays Barclays’ provisions for expected credit loss and credit impairments across business divisions, emphasizing stable coverage ratios and increased post model adjustments reflecting macroeconomic uncertainty.
ECL, impairments, balance sheet, PMA, credit risk
false
Well provisioned balance sheetQ1 2025 Results Presentation
Multiple Chart
Barclays
View slide
Two column charts detailing sources of return for global equities and global valuations, including EPS, multiples, and dividends for various regions.
Investment Analysis
Financial Services
This slide provides an analysis of the sources of return and valuation metrics for global equities, comparing performance across different regions and indicators.
global equities, return sources, valuations, EPS, multiples, dividends
false
Global equities: Source of return and valuationsGuide to the Markets Australia | 2Q 2024
Multiple Chart
JP Morgan
View slide
Column chart with additional ratio comparisons
Customer and Market Segmentation
Hospitality & Tourism
Analyzes preferred activities of high-end travelers in Europe compared to global averages, highlighting interests in food, wine, nature, and history.
travel, preferences, Europe, activities, comparison
false
High-end travellers prefer and visit Europe for a variety of reasons and activitiesHigh-end Tourism - a strong driver for Europe
Single Chart
Bain
View slide
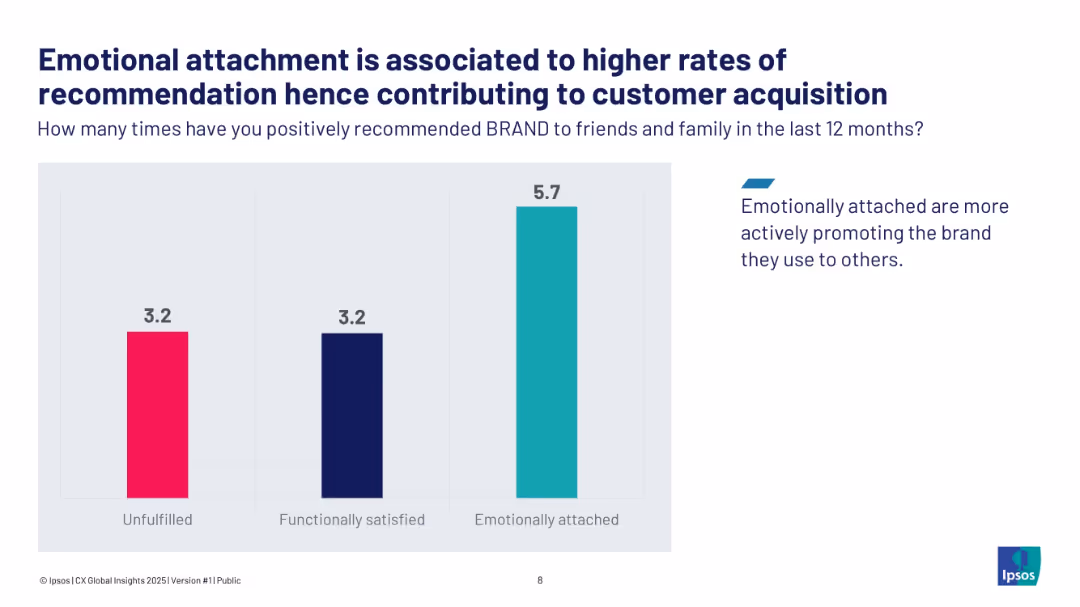
Vertical bar chart comparing unfulfilled, functionally satisfied, and emotionally attached brand recommend rates.
Customer and Market Segmentation
Consumer Goods
The slide illustrates how emotional brand attachment drives more positive customer recommendations, with emotionally attached customers recommending 5.7 times vs. 3.2 for others. This emotional engagement enhances acquisition through advocacy.
brand loyalty, emotional attachment, customer acquisition, advocacy
false
Emotional attachment is associated to higher rates of recommendation hence contributing to customer acquisitionCX GLOBAL INSIGHTS 2025
Single Chart
IPSOS
View slide
This slide contains a bar graph showing weighted average year-to-date local currency shareholder returns by industry, with varying bar widths representing market cap sizes. It has a clear title, a source line, and annotations for data points.
Market Analysis and Trends
Financial Services
The slide presents market capitalization trends across various industries, indicating a decline with varying degrees. It serves to compare sectors and provide insights into the economic impact on market values.
Market capitalization, Industry comparison, Shareholder returns, Economic trends, Data analysis
false
Market capitalization has declined across sectors, with significant variation to the extent of the decline Weighted average year-to-date local currency shareholder returns by industry in percent.1 Width of bars is starting market cap in $COVID-19: Briefing Note
Single Chart
McKinsey
View slide
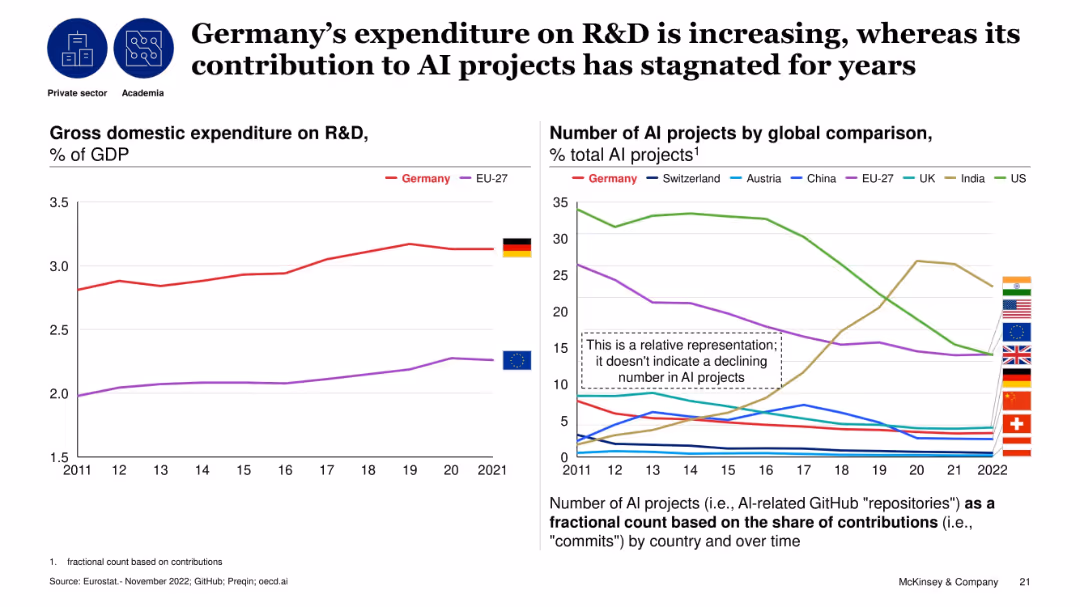
Dual line charts: left for R&D as % of GDP, right for AI project contribution by country over time; comparative analysis.
Technology and Digital Transformation
Artificial Intelligence
The slide contrasts Germany’s rising R&D investment with a stagnant contribution to global AI projects. It shows Germany surpassing EU-27 in R&D spending, but its relative AI contribution has not improved, highlighting a disconnect between investment and AI output.
R&D, AI projects, Germany, contribution, stagnation, investment, technology, research
false
Germany’s expenditure on R&D is increasing, whereas its contribution to AI projects has stagnated for yearsEffects of GenAI on the German labor market
Multiple Chart
McKinsey
View slide
Slide divided into three vertical sections showing a progression from left to right. The left and right sections feature images of nature and stacked coins respectively. Middle section contains a query icon with questions.
Market Analysis and Trends
Environmental Services & Sustainability
This slide compares the current status of green capital deployment and its untapped potential against future revenue and investment needs by 2030 in Southeast Asia's green sector, emphasizing economic opportunities and requirements.
green investment, capital, SEA, 2030, revenue, economic opportunity, cumulative investment
false
From $15B green capital deployed since 2020Southeast Asia’s Green Economy 2022 Report
Boxed
Bain
View slide
Shows a series of column charts detailing the year-to-date growth of mobile banking apps in different Southeast Asian countries, with a clear legend for reference.
Market Analysis and Trends
Financial Services
Examines the increase in app engagement among leading financial institutions across Southeast Asia, detailing user growth percentages by country.
Mobile Banking, User Growth, Financial Institutions, SEA
false
Leading financial institutions enhanced their apps and saw engagement increasee-Conomy SEA 2020 At full velocity: Resilient and racing ahead
Single Chart
Bain
View slide
A table outlines the top criteria LGBT+ talents consider when choosing an employer in various countries.
Human Resources and Talent Management
Professional Services
Prioritizes the aspects most important to LGBT+ talents in their employment decisions.
LGBT+, employment criteria, employer choice, top criteria
false
LGBT+ friendly culture is LGBT+ talent top 1 criteria to chose a company in Germany/Austria/SwitzerlandOut @ Work Barometer
Table
BCG
View slide
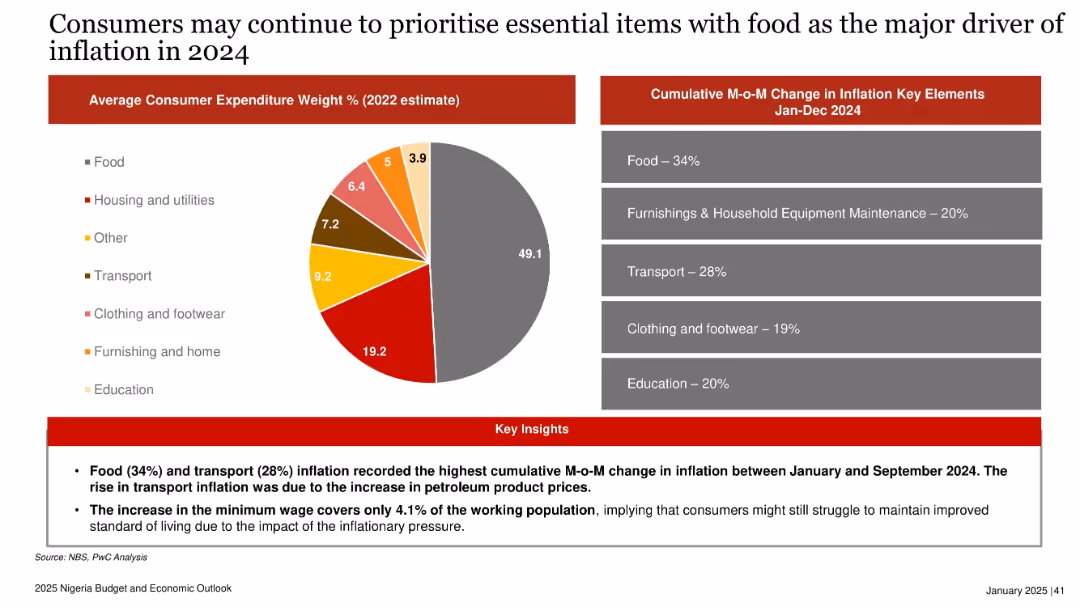
Pie chart of 2022 expenditure weights; bar-style panel of 2024 inflation contributors; insights below in red.
Market Analysis and Trends
Consumer Goods
Highlights that food and transport costs drove inflation in 2024. Consumers focused on essential items, and the new minimum wage had limited impact, covering just 4.1% of the workforce. Inflationary pressure likely to continue shaping spending behavior in 2025.
inflation, consumer spending, food, transport, minimum wage, Nigeria, 2024, price pressure, essential goods
false
Consumers may continue to prioritise essential items...2025 Nigeria Budget and Economic Outlook
Mixed Chart
PwC/Strategy&
View slide
The slide contains a column chart showing 2023 issuances and redemptions along with a detailed table listing various bonds, their ISIN, instrument type, currency, and other metrics.
Financial Performance
Financial Services
This slide presents data on UBS's bond issuances and redemptions for 2023, detailing instrument types, currencies, and financial metrics, aimed at financial analysis.
UBS, 2023 issuances, bonds, financial metrics, redemptions
false
2023 issuancesFourth quarter 2023 Fixed Income investor presentation
Mixed Chart
UBS
View slide
This slide displays four key strategy areas, each accompanied by an icon and brief description, and central metrics such as ROTCE target and CET1 ratio. The layout is clear and spacious, with ample white space and large, readable fonts, creating a visually accessible summary of strategic commitments.
Strategic Planning
Financial Services
Reiterating its commitment to customers, Slide 19 summarizes JPMorgan Chase & Co.'s strategic targets and performance metrics, emphasizing a robust, client-focused approach across global markets.
Strategy, Commitment, ROTCE, CET1 Ratio, Client Focus, Global, Performance Metrics
false
We remain committed to serving our clients and customers with the full breadth of our offering, while producing strong returns for all our constituentsInverstors Day 2023
Boxed
JP Morgan
View slide
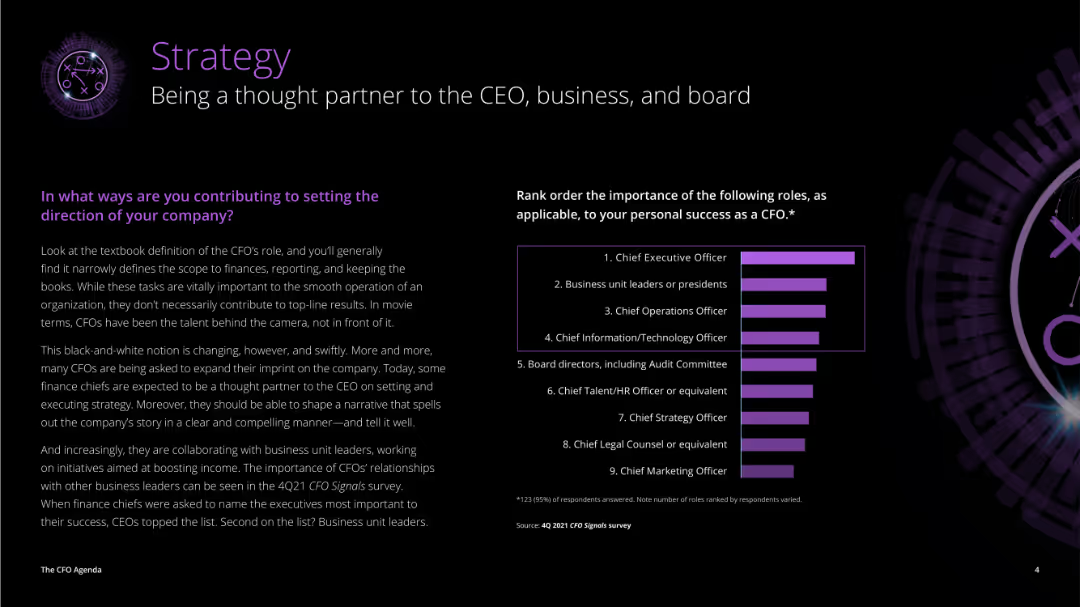
The slide is divided into two sections: a detailed text on the left discussing CFO roles, and a column chart on the right showing the importance of various roles to CFOs' success.
Strategic Planning
Professional Services
The slide highlights the evolving role of CFOs as strategic partners, detailing how they contribute to setting company direction and the importance of their relationships with other business leaders.
strategy, CFO, CEO, business, board, roles, importance, success, direction, strategic partner
false
In what ways are you contributing to setting the direction of your company?The CFO Agenda 2023
Mixed Chart
Deloitte
1
...
Next
Load More
Hold On!
We are searching in our database
If nothing, comes up, please try different filters!
Create a FREE account to continue browsing
Receive Instant Access to 1,000+ slides from companies like McKinsey, Google, and Goldman Sachs
First Name
Last Name
Email
Password
I agree to all
Terms & Privacy Policy
Thank you! Your submission has been received!
Oops! Something went wrong while submitting the form.
Have an account?
Sign in
Column Chart
Heatmap
Chevron
Org Chart
Infographic
Callouts
Timeline
List
Graphic
Picture
Process Flow
Diagram
Paragraph
Map
Table
Framework
Subtitle
Takeaway Box
Icon
Other Chart
Radar Chart
Waterfall Chart
Mekko Chart
Pie Chart
Scatter Plot
Line Chart
Bar chart
Bullet points