🎉 Black Friday Sale!
- Save 20% on SlideStart Pro Annual plan! CODE:
BLACKFRIDAY
My Account
My Slides
Search by Category
Templates
View All Templates
Download Template Slides
Leave Feedback
Login
Logout
Get Started
Browse all Slides
Browse all Slides
Create a FREE Account
Instant access to 1,000+ real slides from top companies like McKinsey, BCG, Goldman Sachs, Google and many more!
First Name
Last Name
Email
Password
I agree to all
Terms & Privacy Policy
Thank you! Your submission has been received!
Oops! Something went wrong while submitting the form.
Have an account?
Sign in
Instant access to the internet's best slides
Get access to 40+ advanced filters and more
Advanced Search and Filters
Access to
10,000+ slides
Access to Category Pages
Save/Bookmark Slides
PowerPoint Template Library (New)
Choose your plan
MONTHLY
$12/month
Billed every month, cancel anytime.
YEARLY
$9/month
Billed $108 annually, cancel anytime.
Checkout for $12/month
Checkout for $108/yr
Secured by Stripe | AES-256 bit encryption
Spark Your Next Big Idea with New Presentation Templates
VIEW ALL Templates
Welcome,
Welcome
Upgrade to SlideStart
Pro
Instant access to 15,000+ slides
Show Featured Only
Checkbox 8
Companies
Mckinsey
Bain
BCG
EY
Deloitte
Accenture
PwC/Strategy&
JP Morgan
Goldman Sachs
Morgan Stanley
Citigroup
Deutsche Bank
Barclays
LEK
Kearney
Oliver Wyman
Booz Allen Hamilton
Gartner
IPSOS
Nielsen
Slide type
Header Horizontal
Framework
Vertical Flow
Single Chart
Single Chart
Text Only
Mixed Chart
Header Vertical
Graphic
Pillar
Multiple Chart
Agenda
Title
Table
Linear Flow
Upgrade to SlideStart
Pro
Instant access to 40+ advanced filters
Industry
Upgrade to SlideStart
Pro
Instant access to 40+ advanced filters
Technology
Healthcare
Financial Services
Consumer Goods
Energy & Utilities
Manufacturing
Retail
E-commerce
Logistics
Telecommunications
Real Estate
Professional Services
Education
Media
Entertainment
Hospitatlity
Tourism
Agriculture
Food Production
Government & Public Sector
Environmental
Sustainability
Use Case
Upgrade to SlideStart
Pro
Instant access to 40+ advanced filters
Sales and Business Development
Mergers and Acquisitions
Corporate Finance and Valuation
Performance Metrics and KPIs
Client Case Studies
Competitive Landscape
Product and Service Analysis
Customer and Market Segmentation
Organizational Structure
Human Resources and Talent Management
Industry Overview
Regulatory and Compliance
Risk Assessment and Management
Agriculture & Food Production
Hospitality and Tourism
Government
Environmental
Sustainability
Clear all
Thank you! Your submission has been received!
Oops! Something went wrong while submitting the form.
Show Featured Only
Checkbox 8
Companies
Mckinsey
Bain
BCG
EY
Deloitte
Accenture
PwC/Strategy&
JP Morgan
Goldman Sachs
Morgan Stanley
Citigroup
Deutsche Bank
Barclays
LEK
Kearney
Oliver Wyman
Booz Allen Hamilton
Gartner
IPSOS
Nielsen
Slide type
Text Only
Linear Flow
Vertical Flow
Single Chart
Header Horizontal
Mixed Chart
Header Vertical
Pillar
Multiple Chart
Graphic
Agenda
Title
Table
Framework
Industry
Technology
Healthcare
Financial Services
Consumer Goods
Energy & Utilities
Manufacturing
Retail
E-commerce
Logistics
Telecommunications
Real Estate
Professional Services
Education
Media
Entertainment
Hospitatlity
Tourism
Agriculture
Food Production
Government & Public Sector
Environmental
Sustainability
Use Case
Sales and Business Development
Mergers and Acquisitions
Corporate Finance and Valuation
Performance Metrics and KPIs
Client Case Studies
Competitive Landscape
Product and Service Analysis
Customer and Market Segmentation
Organizational Structure
Human Resources and Talent Management
Industry Overview
Regulatory and Compliance
Risk Assessment and Management
Agriculture & Food Production
Hospitality and Tourism
Government
Environmental
Sustainability
Clear all
Thank you! Your submission has been received!
Oops! Something went wrong while submitting the form.
Tag
View slide
Tabular matrix chart with ideas, sectors, and screening criteria (abatement, feasibility, interest); clean, grid-based layout.
Strategic Planning
Environmental Services & Sustainability
Evaluates various decarbonization ideas based on abatement impact, technical feasibility, and commercial interest. Highlights improved farming, nature offsets, green fuel, and efficient transport as top short-listed ideas.
decarbonization, farming, feasibility, green fuel, nature-based, investment, SEA, emissions
false
[Backup] Investable Ideas Assessment: Decarbonization opportunities prioritized based on assessment of attractiveness, technical feasibility, and commercial interest to dateSOUTHEAST ASIA’S GREEN ECONOMY 2024
Single Chart
Bain
View slide
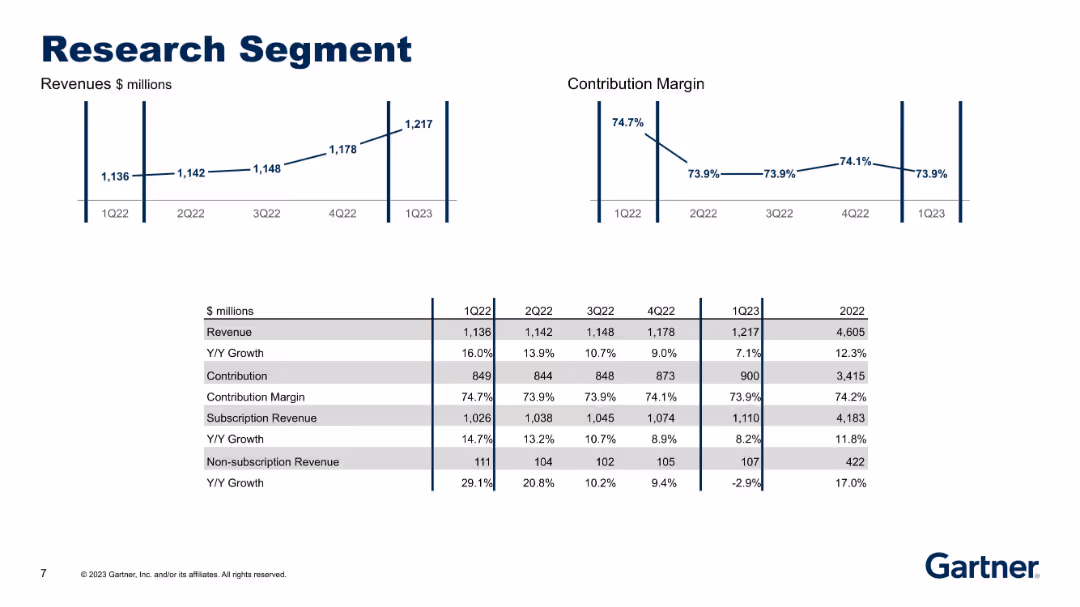
Two line graphs (Revenue and Contribution Margin) and a comparison table for revenue, contribution, subscription performance over 5 quarters.
Performance Metrics and KPIs
Technology & Software
This slide focuses on financial details of the Research segment, including steady growth in revenue and margins over time. Subscription revenue trends and Y/Y growth rates are provided for both subscription and non-subscription income streams.
research, segment analysis, subscription revenue, contribution margin
false
Research SegmentFirst Quarter 2023 Results
Multiple Chart
Gartner
View slide
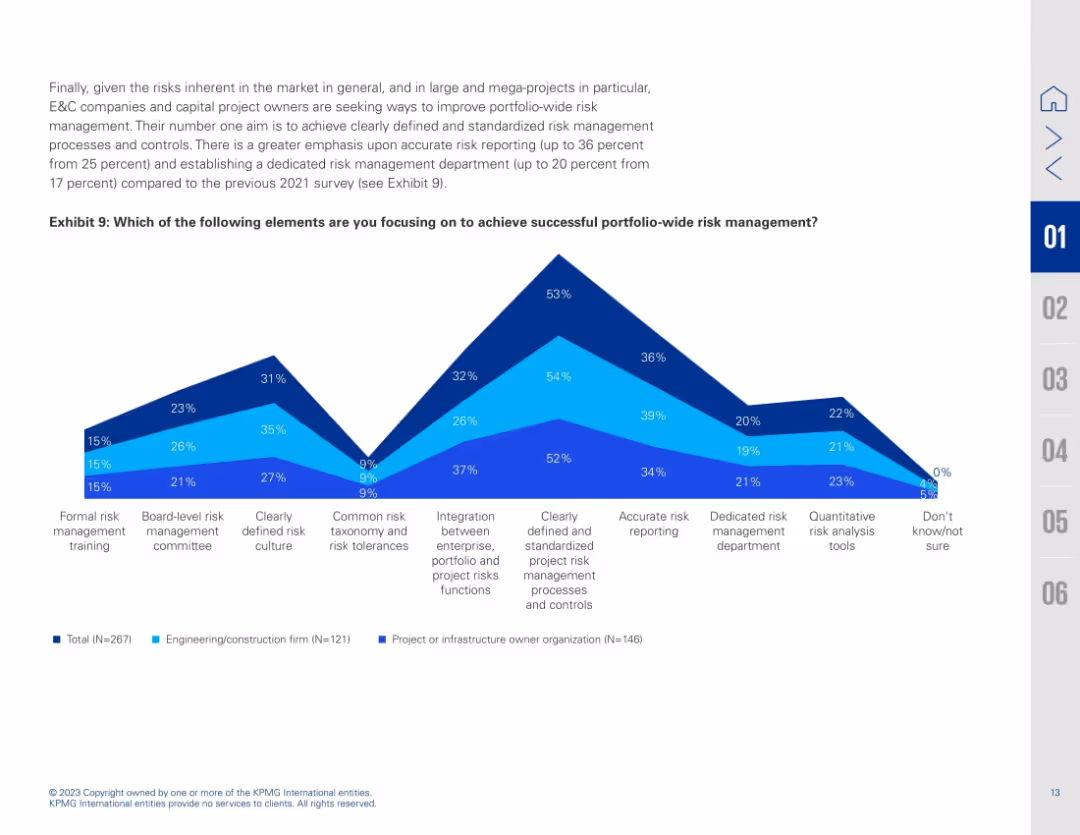
Wide line chart with percentage focus on various portfolio-wide risk management strategies. X-axis contains strategy elements; Y-axis shows percentage focus. Color-coded by organization type.
Risk Assessment and Management
Real Estate & Construction
This slide identifies areas of focus to achieve effective portfolio-wide risk management. The top strategy cited is having clearly defined and standardized processes (53%), followed by accurate risk reporting and integration across functions. The data reflects efforts to mature risk management frameworks in response to increasing project complexity and volatility.
risk reporting, standardization, portfolio management, integration, risk department, training, construction governance
false
(No title visible; focuses on Exhibit 9)Familiar challenges - new approaches
Mixed Chart
KPMG
View slide
The slide has a purple-themed color scheme with two main visual elements. On the left, there's a hexagonal flow chart with text labels like "Identify Consumer Demand". On the right, a radial graph shows various business impacts in shades of purple indicating different impact levels.
Strategic Planning
Technology & Software
The slide emphasizes the importance of an end-to-end approach to business planning and intelligent manufacturing. It maps interventions across the value chain and their degree of impact, serving as a strategic planning tool for assessing business processes and performance frontiers.
Value Chain, Business Planning, Manufacturing, Strategic Planning, End-to-End, Performance, Intelligent Manufacturing, Impact Levels, Fullfillment Capabilities, Optimization
false
Building full value chain business planning and intelligent manufacturing and fulfillment capabilities at the performance frontier requires an end-to-end approachTotal Enterprise Reinvention
Single Chart
Accenture
View slide
Column chart depicting agreement levels by different age groups that they need to do more for their mental well-being, with color-coded segments showing various levels of agreement.
Customer and Market Segmentation
Healthcare & Pharmaceuticals
Focuses on the challenges of mental health across age groups, emphasizing that younger individuals feel a more acute need to address mental well-being compared to older age groups.
mental health, age groups, challenges, survey, agreement
false
While mental health is a challenge for all ages, it is the young who feel this most acutelyA NEW WORLD DISORDER?
Mixed Chart
IPSOS
View slide
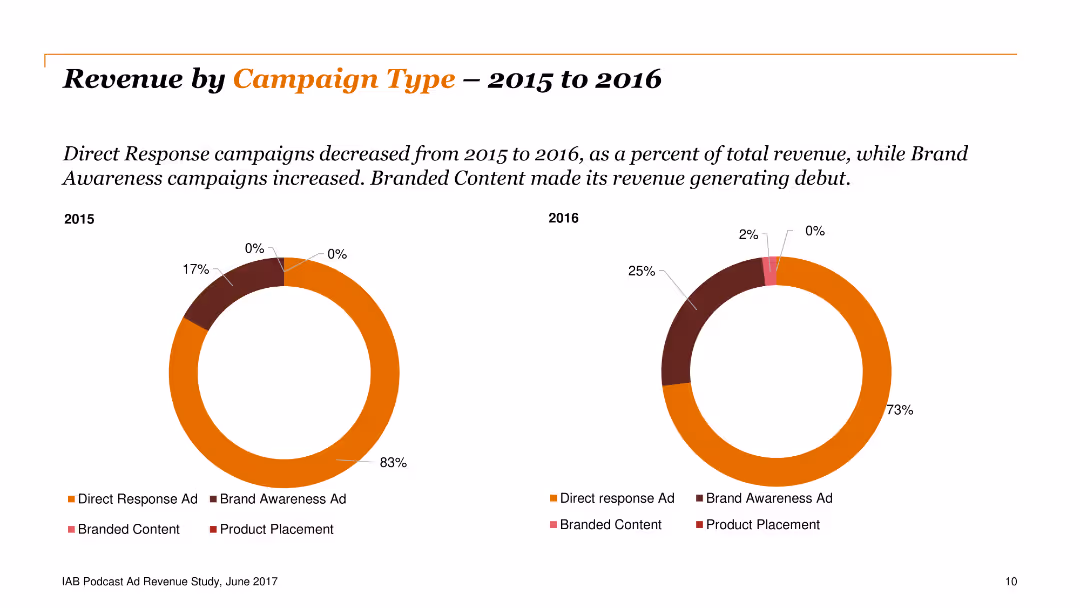
Two doughnut charts comparing campaign types from 2015 to 2016, showing a decline in direct response ads and a rise in brand awareness ads, with branded content emerging.
Financial Performance
Media & Entertainment
The slide analyzes revenue distribution by campaign type, indicating a decrease in direct response ads and an increase in brand awareness and branded content ads. Useful for marketing strategies.
revenue, campaign, type, direct response, brand
false
Revenue by Campaign Type –2015 to 2016IAB Podcast Ad Revenue Study: An Analysis of the Largest Players in the Podcasting Industry
Multiple Chart
PwC/Strategy&
View slide
The slide includes a column chart illustrating concentration levels across different access modes, similar to slide 8201 but under a different approach. Bars are vertically oriented and labeled accordingly.
Market Analysis and Trends
Media & Entertainment
This slide presents an alternative analysis of concentration levels across various access modes, treating all subsequent visits as direct.
concentration, direct visits, column chart, media, alternative analysis
false
Alternative approach 3: Any source within last 5 steps, subsequent visits identified as direct Concentration levels across different access modesIpsos Iris passive monitoring data analysis
Single Chart
IPSOS
View slide
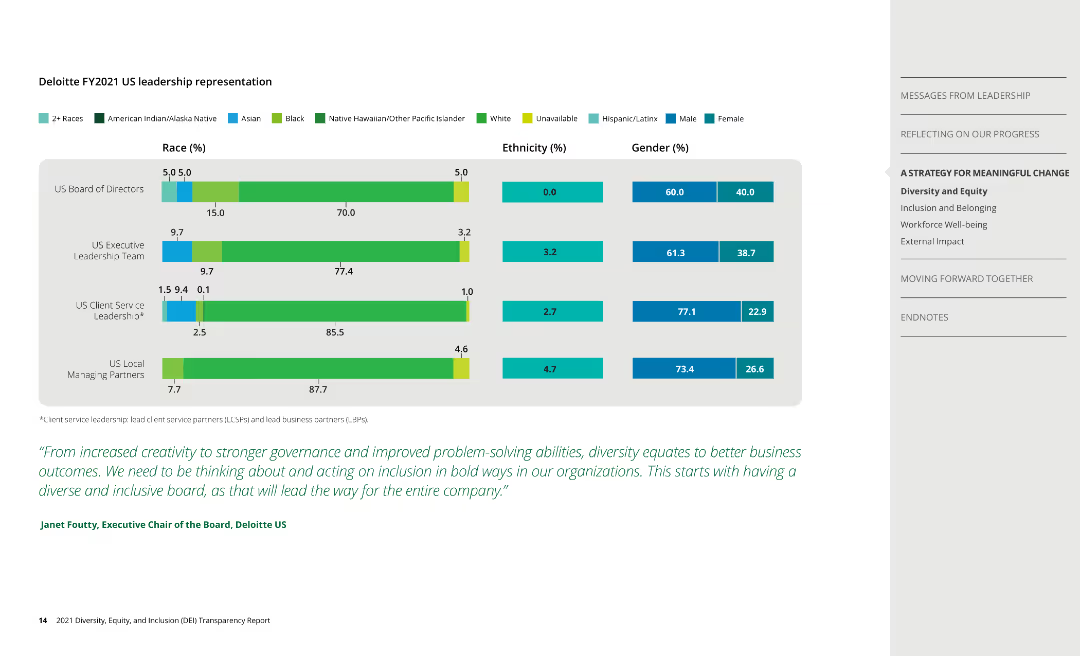
Column charts show representation by race, ethnicity, and gender within Deloitte's leadership teams.
Human Resources and Talent Management
Professional Services
Analyzes diversity in leadership positions, emphasizing the need for improved representation.
leadership, diversity, race, ethnicity, gender
false
Deloitte FY2021 US leadership representation2021 Diversity, Equity, and Inclusion (DEI) Transparency Report
Mixed Chart
Deloitte
View slide
This slide features a combined line and column chart comparing "Global GDP growth" and "Change in CEO confidence" from 2008 to 2019. The background is white with a gray overlay on recent years, emphasizing the latest data points.
Market Analysis and Trends
Financial Services
The slide illustrates the correlation between CEO confidence and global economic growth, suggesting predictive power of CEO outlook over actual economic outcomes. It is used for economic forecasting discussions.
GDP growth, CEO confidence, economic forecasting, predictive analysis, correlation, economic indicators, global outlook.
false
CEOs look in the mirror… and see the worldPwC's 22nd Annual Global CEO Survey
Mixed Chart
PwC/Strategy&
View slide
The slide presents three columns of information, each titled and color-coded (green, yellow, pink). Each section contains lists and a checkmark icon for key points.
Market Analysis and Trends
Healthcare & Pharmaceuticals
Discusses three possible future scenarios for pandemic recovery, detailing differences in vaccine efficacy, rollout speeds, and public health responses under each scenario.
pandemic, vaccines, scenarios, rollout, public health
false
Three potential pandemic scenarios going forwardCOVID-19 BCG Perspectives State of the World
Table
BCG
View slide
Combines U.S. map, column chart, and bullet points to discuss growth strategies in wealth management.
Sales and Business Development
Financial Services
Details JPMorgan's approach to capturing U.S. wealth management market potential, highlighting growth from digital solutions and advisors.
Wealth management, US market, growth opportunity, digital solutions, client advisors, market capture
false
U.S. Wealth Management: Growing from a position of strengthAsset & Wealth Management 2020
Mixed Chart
JP Morgan
View slide
Two columns comparing "Crypto perceptions" vs. "Crypto realities" with icons and lists highlighting misconceptions and facts about cryptocurrencies.
Risk Assessment and Management
Financial Services
Debunks common misconceptions about cryptocurrencies, contrasting them with real data. Valuable in educational settings or discussions on the legitimacy and risks of crypto investments.
Cryptocurrency, Misconceptions, Facts, Risks, Investments, Perceptions, Realities
false
Misconceptions have continued to circulate over recent yearsBlockchain and Digital Assets
Boxed
McKinsey
View slide
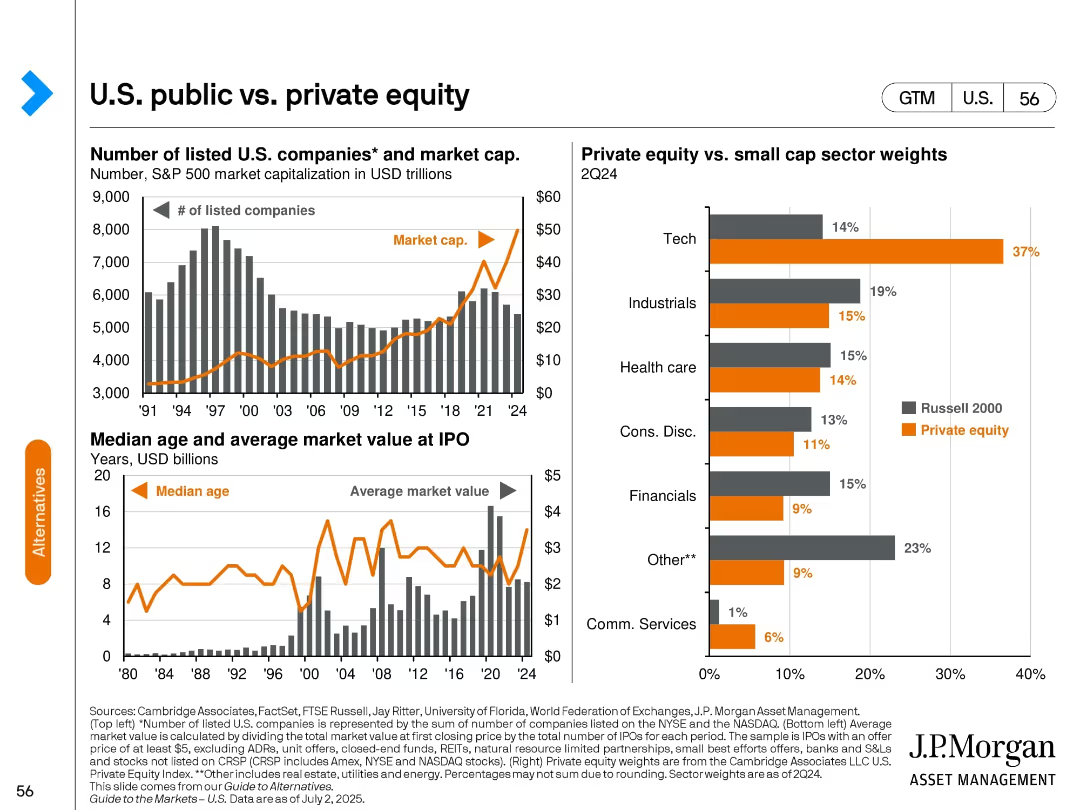
Three-part chart: Top—listed companies & market cap; Bottom Left—IPO age & value; Right—sector weights (private vs. small-cap).
Market Analysis and Trends
Financial Services
Compares the landscape of public and private equity in the U.S. through metrics like number of companies, IPO trends, and sector weightings. Highlights growing influence of private equity in sectors like tech and differences vs. public markets.
private equity, public companies, IPO trends, market cap, sector allocation, U.S. equities
false
U.S. public vs. private equityGuide to the Markets U.S. 3Q 2025
Multiple Chart
JP Morgan
View slide
Features a maturity score chart across industries like aerospace, high-tech, and automotive, showing levels of resiliency maturity using a horizontal bar graph with a scoring scale.
Risk Assessment and Management
Industrial & Manufacturing
Provides a comparative analysis of resiliency maturity scores by industry, showing variations and benchmarks, and stressing the need for advanced capabilities in handling disruptions.
resiliency, industry analysis, maturity scores, benchmarking, capability advancement, disruption handling, Accenture Research
false
Figure 3: Resiliency maturity scores by industryResiliency in the making
Mixed Chart
Accenture
View slide
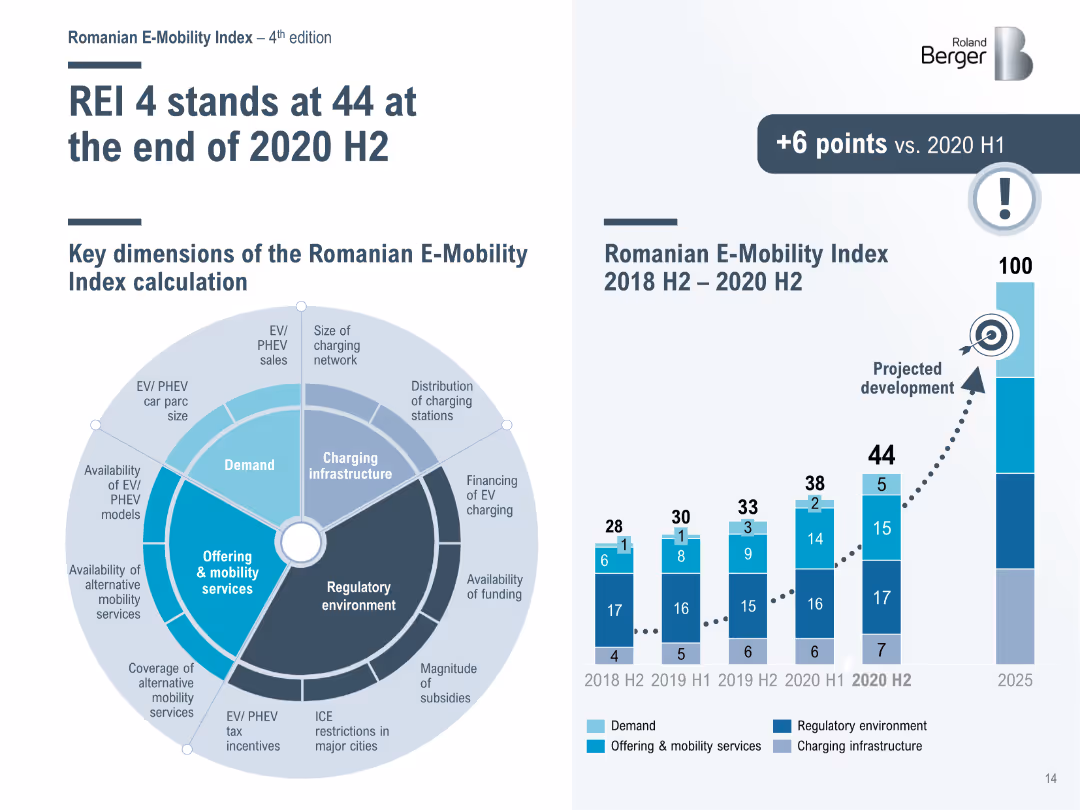
Bar chart and radar chart showing the Romanian E-Mobility Index (REI) and its key dimensions from 2018 H2 to 2020 H2, with a projection for future development.
Performance Metrics and KPIs
Transportation & Logistics
Analyzes the Romanian E-Mobility Index, detailing the progress and key dimensions of the index, including demand, infrastructure, and regulatory environment.
E-Mobility Index, Romania, performance, development
false
REI 4 stands at 44 at the end of 2020 H 2Romanian E Mobility Index REI 4 (Fourth Edition)
Mixed Chart
Roland Berger
View slide
The slide features a large title at the top with three proportional circle diagrams beneath, showing the increasing number of internet users from 2019 to 2022. It includes percentages and numerical data, labeled clearly to show growth over the years. The colors range from light to dark blue.
Industry Overview
Technology & Software
This slide visually demonstrates the growth in the number of internet users over a three-year span, highlighting the impact of the pandemic on digital adoption. It's useful for illustrating market growth in technology use and for identifying digital expansion trends in Southeast Asia.
internet users, SEA, pandemic, market growth, technology adoption, digital expansion, 2019-2022, circle diagrams
false
100M additional internet users have come online in the last three yearse-Conomy SEA 2022 Through the waves, towards a sea of opportunity
Multiple Chart
Bain
View slide
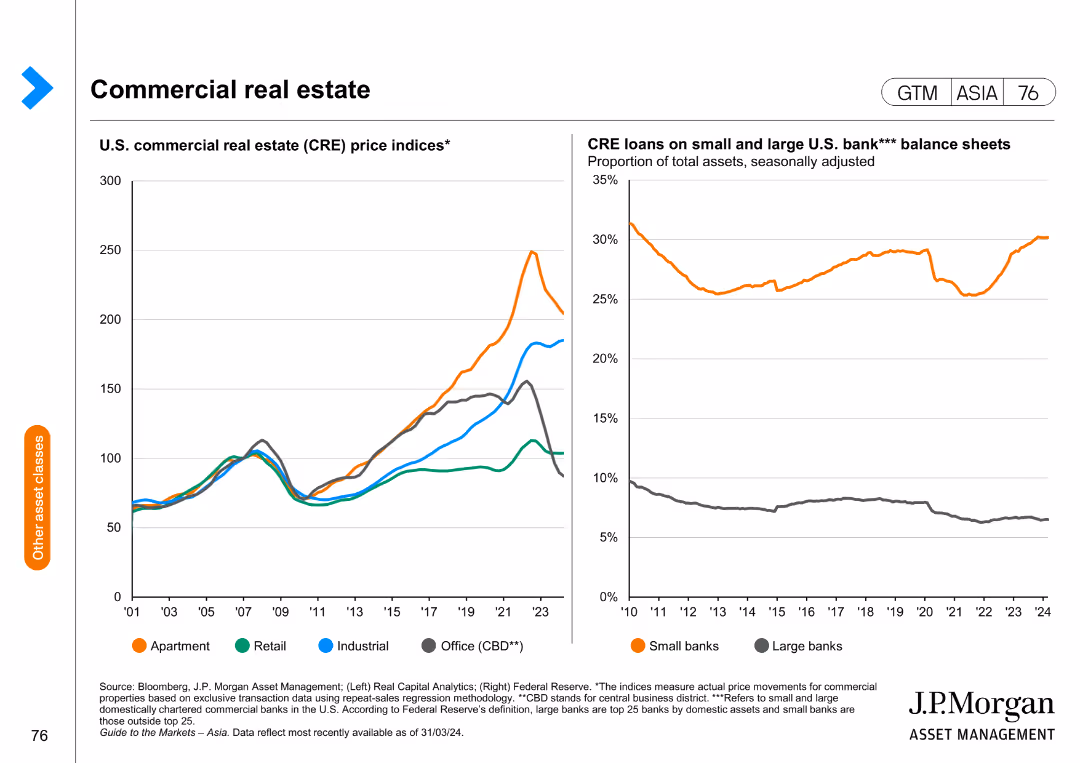
The slide features two line charts; one shows price indices for different types of U.S. commercial real estate, and the other shows the proportion of CRE loans on small and large banks' balance sheets.
Market Analysis and Trends
Real Estate & Construction
This slide analyzes trends in commercial real estate prices and the distribution of related loans, providing insights into market health and lending practices.
commercial real estate, price indices, loans, banking, market trends
false
Commercial real estate U.S. commercial real estate (CRE) price indices*Guide to the Markets Asia | 2Q 2024
Multiple Chart
JP Morgan
View slide
The slide features a dartboard chart and bar graphs representing the various actions CEOs are taking to reconfigure supply chains and source local alternatives.
Operational Efficiency
Transportation & Logistics
The slide highlights the strategies CEOs are employing to reconfigure supply chains and find local alternatives to mitigate disruptions.
supply chains, local alternatives, disruptions, reconfiguration, CEO strategies
false
CEOs are reconfiguring their supply chains and sourcing local alternatives to combat the impact of disruptionsHow will you reframe your future?
Mixed Chart
EY
View slide
The slide features five business cases from Europe, the US, and China, demonstrating the diverse applications of biomass, including waste-to-energy in the UK, bio jet fuel in the US, biomethane in China, renewable diesel in the US, and co-firing in the cement industry.
Client Case Studies
Energy & Utilities
This slide showcases five business cases highlighting the diverse potential applications of biomass energy across different regions and industries, emphasizing the innovative solutions and benefits of biomass utilization.
biomass applications, business cases, waste-to-energy, bio jet fuel, biomethane, renewable diesel, co-firing, cement industry
false
Five business cases studied in Europe, the US, and China show the diversity of biomass potential applicationsDeveloping sustainable carbon circularity Looking at advanced applications and business models
Linear Flow
Kearney
View slide
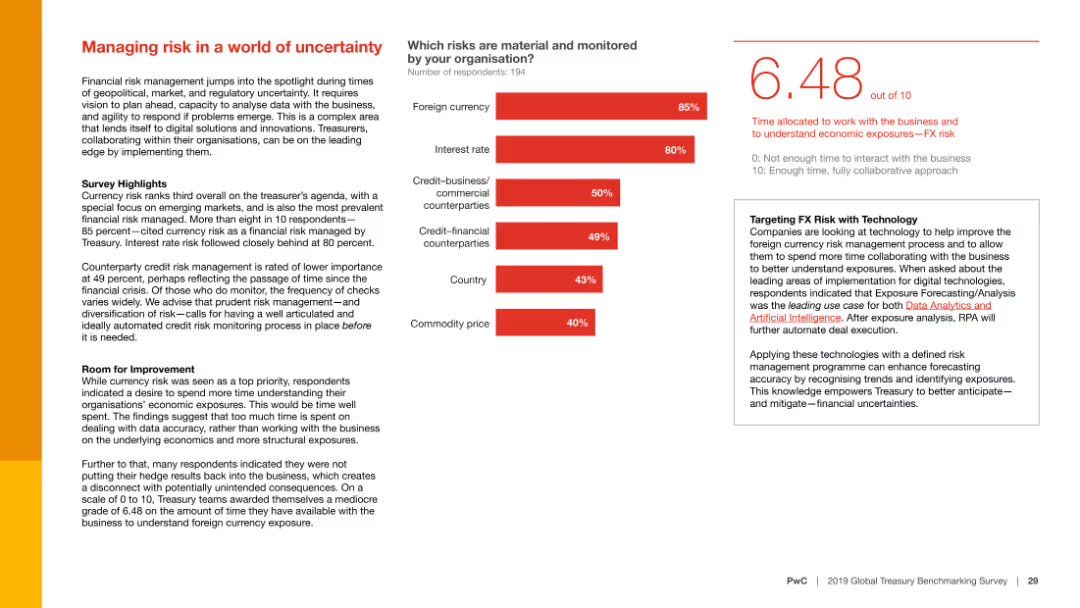
The slide features a column chart showing the material risks monitored by organizations and text discussing survey highlights, room for improvement, and targeting FX risk with technology.
Risk Assessment and Management
Financial Services
This slide focuses on the importance of managing financial risks, particularly currency risk, in uncertain times, and discusses the use of technology to improve foreign currency risk management.
Risk management, uncertainty, currency risk, financial services, survey highlights, room for improvement, technology, FX risk, financial risks, market trends
false
Managing risk in a world of uncertaintyDigital Treasury-It takes two to tango 2019 Global Treasury Benchmarking Survey
Mixed Chart
PwC/Strategy&
View slide
Features multiple stacked column charts showing the breakdown of GHG emissions by sector in Nigeria, with detailed legends and annotations for clarity.
Regulatory and Compliance
Environmental Services & Sustainability
Analyzes the distribution of greenhouse gas emissions across different sectors within Nigeria, emphasizing the significant impact of the energy sector.
GHG emissions, energy sector, Nigeria, environmental analysis, emission breakdown
false
The Energy Sector is the largest source of GHG emissions contributing ~60% to total emissions; with a sizeable share from fuel generators…Socio-economic case for deepening solar PV deployment in Nigeria
Multiple Chart
BCG
View slide
Displays a pie chart representing the origin of investment projects into the UK in 2021, with segments for different contributing countries.
Market Analysis and Trends
Financial Services
This slide highlights the countries contributing to investment projects in the UK in 2021, providing insight into international investment sources.
investment origin, UK, 2021, pie chart, countries
false
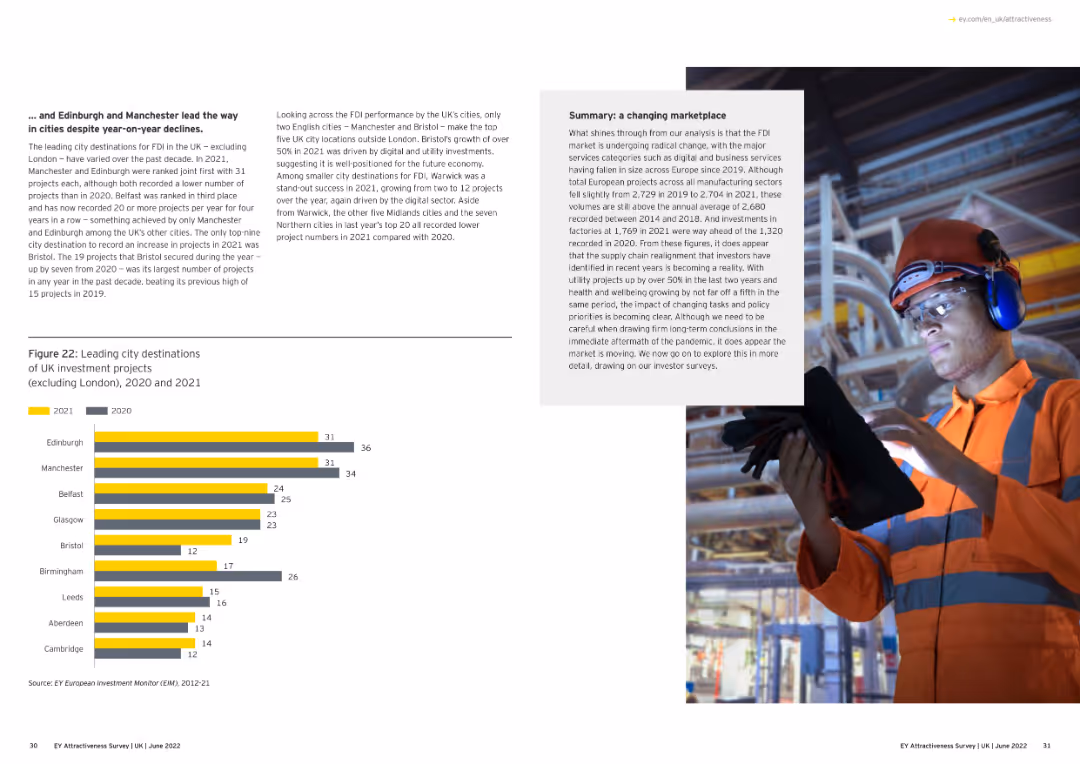
… and Edinburgh and Manchester lead the way in cities despite year-on-year declines.Adapting to a changed world EY Attractiveness Survey
Mixed Chart
EY
View slide
Horizontal timeline bar graph showing RoTCE growth trajectory from FY 2023 to long-term target; annotated with revenue, expense, and capital factors; clean design with linear progress depiction.
Financial Performance
Financial Services
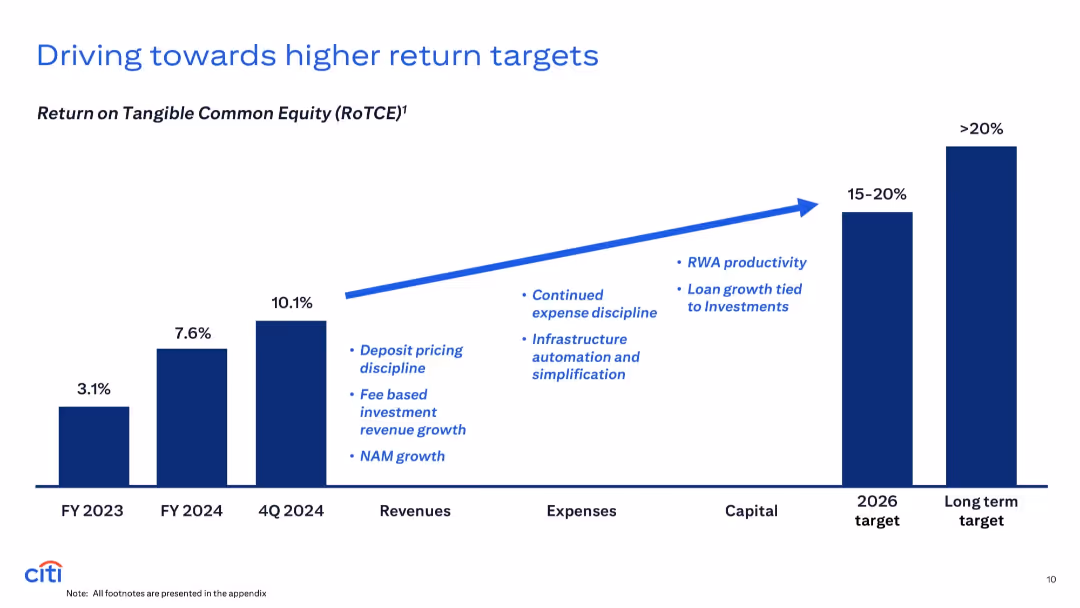
Projects return on tangible common equity (RoTCE) improving from 3.1% in FY 2023 to over 20% in the long term. Drivers include revenue growth from investments and NAM, disciplined expense management, and optimized capital allocation.
RoTCE, equity return, revenue, capital, target growth
false
Driving towards higher return targetsCiti’s Wealth Business Update
Single Chart
Citigroup
View slide
This slide presents a mix of column charts and customer response statistics comparing Citigroup's new card products against competitors, depicted in varying shades of blue. Includes customer conversion rates and quotes from magazines highlighting product features, offering a balanced mix of text and graphics.
Product and Service Analysis
Financial Services
Analyzes the impact of new branded card products on consumer choice and engagement, showcasing how these cards have become the primary choice over competitors. It details customer retention rates, primary card replacement rates, and market feedback on new product features, serving as a compelling case study on product success and consumer acceptance.
consumer response, product launch, market feedback, credit cards, customer retention
false
U.S. Branded Cards: New Products Are Breaking Through With ConsumersGlobal Consumer Banking
Multiple Chart
Citigroup
View slide
The slide features a column chart showing changes in assets under management over time, with callout boxes indicating specific factors contributing to the increases or decreases, and an annotation explaining equity movements. The chart uses shades of blue and gray for visual differentiation.
Financial Performance
Financial Services
This slide presents the movements in Macquarie Infrastructure and Real Assets (MIRA) Equity Under Management (EUM), highlighting the impact of new equity raised, listed security price movements, and foreign exchange movements, suitable for financial analysis and investor presentations.
MIRA, EUM, equity, investment, financial analysis, Macquarie, bar graph, performance, capital, foreign exchange
false
MIRA EUM movement Increase of 5% primarily due to new equity raisedGoldman Sachs 16thAnnual Australia and New Zealand Investment Forum
Single Chart
Goldman Sachs
View slide
Green themed slide showcasing circular statistics about organizational views on sustainability and its impact on workers and society.
Regulatory and Compliance
Environmental Services & Sustainability
Discusses the growing focus on sustainability in business strategies and the readiness of organizations to implement sustainable practices.
sustainability, organizational readiness, human element, societal impact, business strategy
false
Advancing the human element of sustainability Human sustainability rises to the fore of organizations’ sustainability strategies The readiness gapDeloitte 2023 Global Human Capital Trends Report: New fundamentals for a boundaryless world
Multiple Chart
Deloitte
View slide
Column chart showing changes in central bank policy rates for developed and emerging markets. Another chart shows expectations for future rates.
Market Analysis and Trends
Financial Services
Analyzes historical changes in central bank policy rates and provides expectations for future changes, comparing developed and emerging markets.
policy rate changes, central bank, developed markets, emerging markets
false
Changes in central banks’ policy ratesGuide to the Markets Australia | 2Q 2024
Multiple Chart
JP Morgan
View slide
This slide features column charts showing issuances and redemptions from 2022 to 2028, with key highlights in text format on the right.
Financial Performance
Financial Services
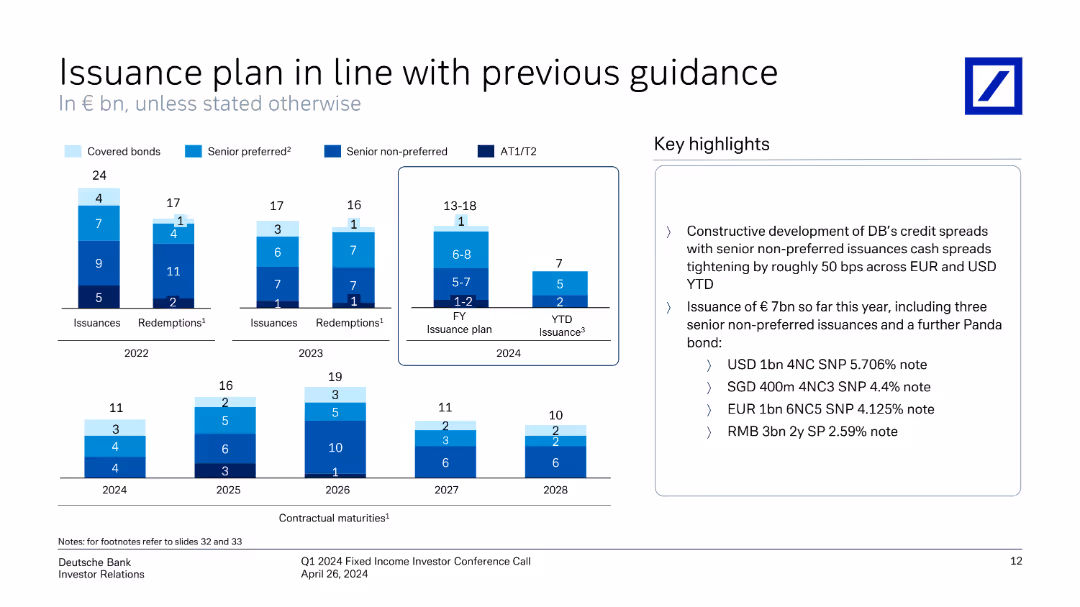
The slide outlines Deutsche Bank's issuance and redemption plans from 2022 to 2028, detailing bond types and key highlights.
issuance, plan, bonds, financial, highlights, redemption, chart, guidance, key points, Deutsche Bank
false
Issuance plan in line with previous guidance In € bn, unless stated otherwiseQ1 2024 Fixed Income Investor Conference Call
Multiple Chart
Deutsche Bank
View slide
Stylized timeline graph with a curved gradient background showing AI progression from Descriptive to Generative across decades. Includes annotations under each AI type.
Industry Overview
Artificial Intelligence
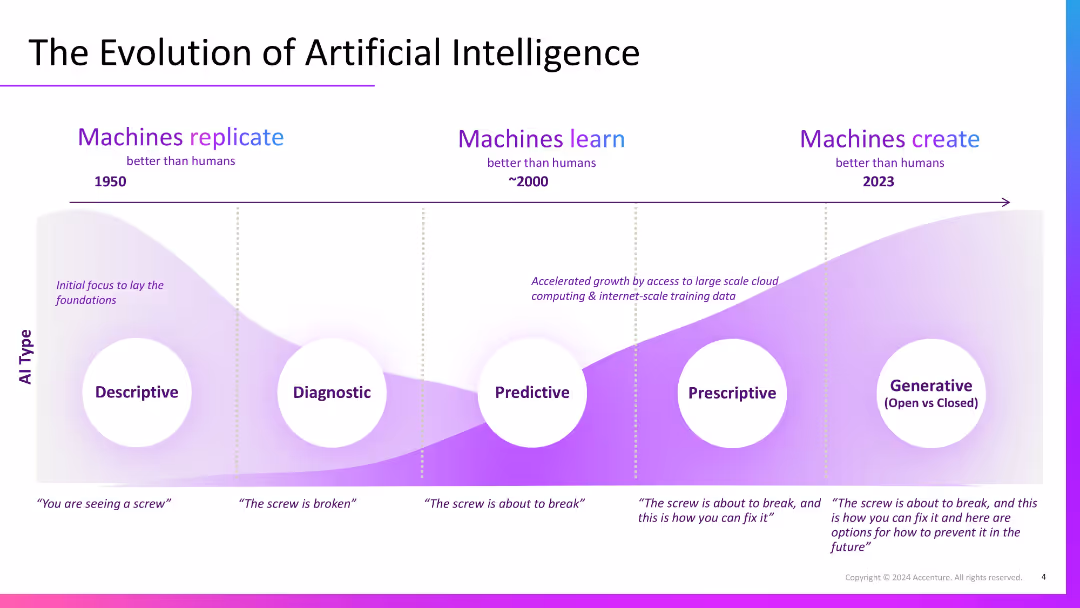
Outlines AI evolution from descriptive to generative stages. Shows how AI capabilities have grown over time, with modern AI capable of generating solutions and foresight, building on foundational descriptive and diagnostic insights.
AI evolution, generative AI, descriptive, predictive, timeline, machine learning
false
The Evolution of Artificial IntelligenceREINVENTION WITH GENERATIVE AI: CalPERS
Single Chart
Accenture
View slide
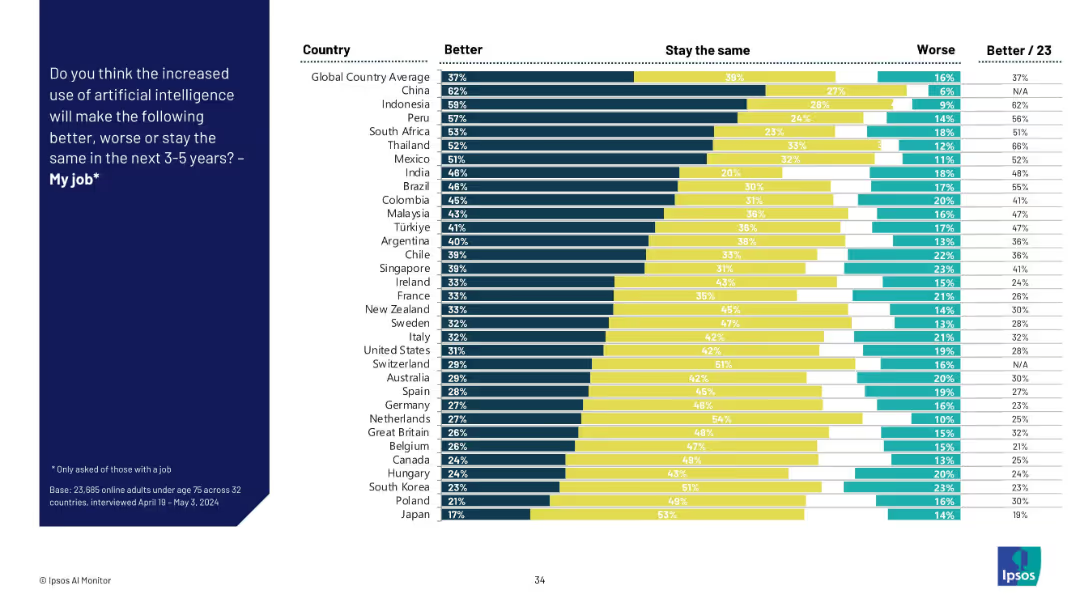
Stacked bar chart by country showing "Better," "Stay the same," and "Worse" views on AI’s job impact. Colors separate the three opinions.
Human Resources and Talent Management
Artificial Intelligence
This slide captures perceptions across countries about whether AI will improve, worsen, or not affect their job over the next 3–5 years. Optimism is highest in Asia and Latin America, while skepticism is more prevalent in Western Europe.
AI job impact, country analysis, workplace outlook, sentiment distribution, talent management, job improvement, technology shift
false
Do you think the increased use of artificial intelligence will make the following better, worse or stay the same in the next 3–5 years? – My jobTHE IPSOS AI MONITOR 2024
Mixed Chart
IPSOS
View slide
A bar chart showing the economic risks impacting investment plans in Europe, with highlighted percentages and a detailed explanatory text box.
Risk Assessment and Management
Financial Services
The slide highlights the ongoing economic challenges and risks that will impact investment plans in Europe in 2023, such as rising interest rates and inflation.
economic risks, investment, Europe, 2023
false
The economic shocks of 2022 will continue through 2023How can Europe turn on the taps of foreign investment?
Single Chart
EY
View slide
A visually balanced slide with text sections and a central infographic illustrating the organization's strategy. The graphic is divided into three main areas, each with concise bullet points.
Strategic Planning
Government & Public Sector
The slide presents a strategic framework focusing on environmental, social, and governance aspects. It could be utilized to communicate a firm’s comprehensive strategy for sustainable and inclusive growth.
ESG, Environmental, Social, Governance, Strategy, Sustainable Growth
false
Our ESG frameworkAccelerating Sustainable and Inclusive Growth
Framework
McKinsey
View slide
This slide is divided into four sections with a combination of column charts and bullet points. It utilizes a blue, white, and red color scheme and includes award logos and a circular diagram to represent the different business sectors discussed.
Strategic Planning
Technology & Software
Showcasing strategic business advancements in banking, highlighting key innovations, market leadership, and technology integration across several sectors.
innovation, fintech, market leadership, digital platform, banking, treasury management
false
Customer-centric, technology-led product innovation and developmentGoldman Sachs U.S. Financial Services Conference
Table
Goldman Sachs
View slide
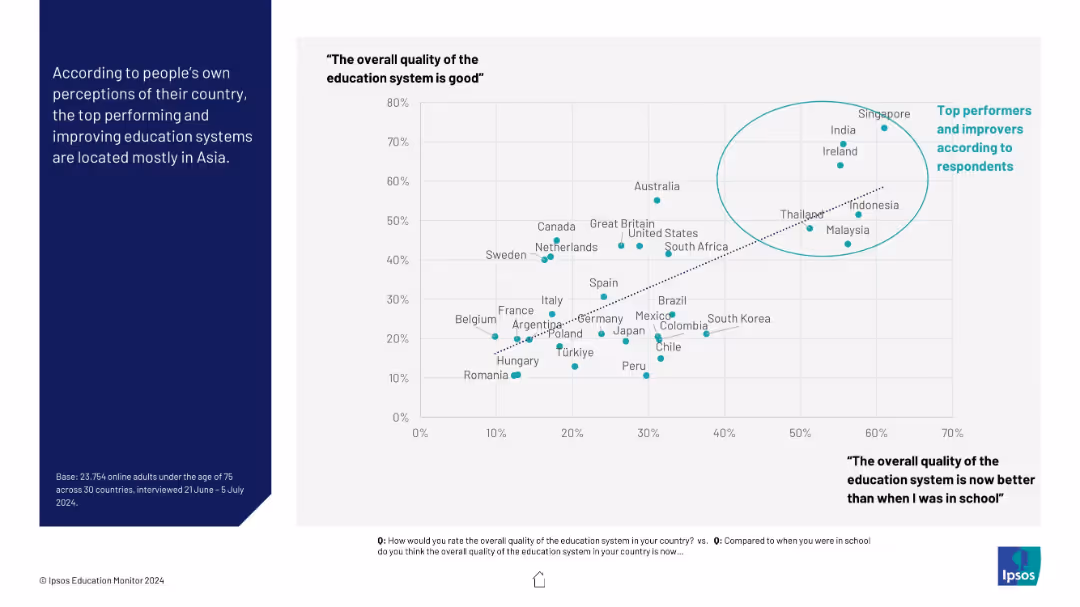
Scatter plot comparing countries on how good and improved their education systems are perceived to be. Countries like Singapore and India are highlighted in a circle as top performers.
Performance Metrics and KPIs
Education & Training
This slide shows the relationship between current perception of education quality and perceived improvement over time. It highlights countries that rank high in both, predominantly in Asia, suggesting cultural and systemic strengths.
education systems, top performers, perception, improvement, Ipsos, Asia, public opinion
false
Top performers in education perceptionIPSOS EDUCATION MONITOR 2024
Mixed Chart
IPSOS
View slide
The slide presents two side-by-side column charts, showing current and potential future portfolio distributions. Categories such as 'Grade A Office' and 'Logistics' are color-coded. There are descriptive boxes with percentages, arrows indicating the transition from the current to the future state, and a disclaimer at the bottom left corner.
Investment Analysis
Real Estate & Construction
Shows a real estate investment fund's strategic asset allocation plan, indicating divestments and developments, aimed at portfolio enhancement over the coming years.
Asset Allocation, Divestments, Real Estate Investment, Portfolio Enhancement, Strategic Development, Financial Planning
false
Divestments and developments to enhance the portfolioMorgan Stanley Conference Investor presentation
Single Chart
Morgan Stanley
View slide
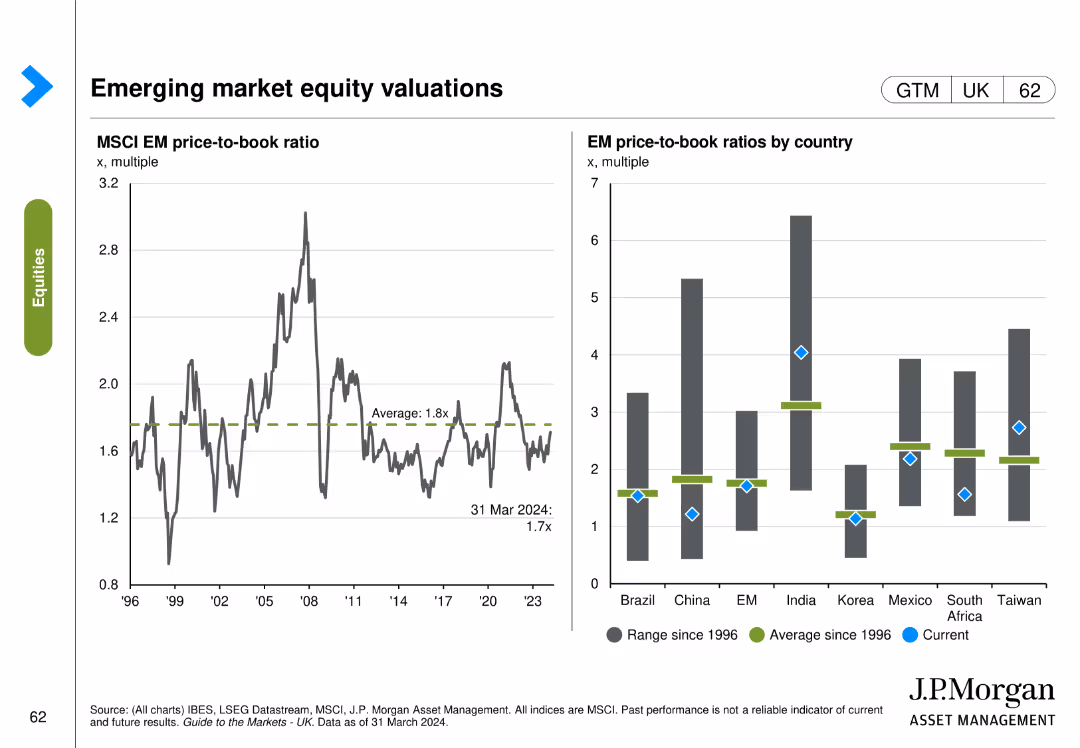
This slide contains two charts: a line chart showing the MSCI EM price-to-book ratio over time, and a column chart comparing EM price-to-book ratios by country.
Market Analysis and Trends
Financial Services
The slide provides an analysis of the MSCI EM price-to-book ratio and a comparison across various emerging markets, useful for market trend analysis.
emerging markets, equity, valuations, MSCI, price-to-book ratio, countries
false
Emerging market equity valuationsGuide to the Markets UK | Q2 2024
Multiple Chart
JP Morgan
View slide
This slide features a column chart comparing SACU receipts over three fiscal years. The columns are color-coded in orange, and the monetary values and fiscal years are clearly labeled above each column.
Financial Performance
Government & Public Sector
This slide shows the trends in SACU receipts over recent years, useful for discussions in economic or budgetary presentations focused on regional economic contributions within the Southern African Customs Union.
SACU, revenue trends, economic contributions, fiscal analysis
false
2021/22 Annual Budget Speech: SACU ReceiptsDissecting the 2021/22 Annual Budget Speech
Single Chart
PwC/Strategy&
View slide
The slide uses a simple design with text and icons. It presents key recommendations for marketers to improve measurement confidence, such as leveraging technology and staying agile.
Strategic Planning
Professional Services
This slide provides actionable recommendations for marketers to enhance measurement confidence by using technology, remaining agile, and optimizing throughout the marketing funnel.
recommendations, marketers, measurement, confidence, strategy
false
Key recommendations for marketers For measurement confidenceEra of alignment
Header Vertical
Nielsen
View slide
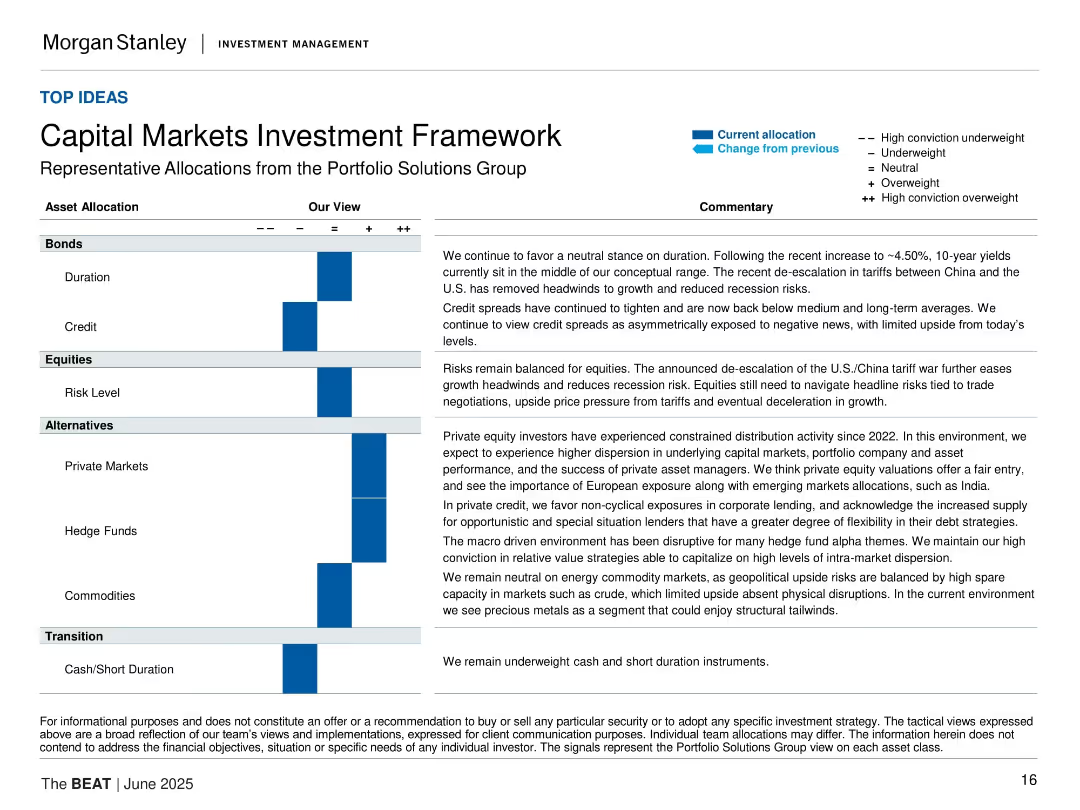
Matrix of asset allocation views with horizontal bars and textual commentary; structured, corporate layout.
Strategic Planning
Financial Services
The slide presents the Portfolio Solutions Group’s tactical asset allocation views across bonds, equities, alternatives, and cash. Commentary explains each allocation decision within a macroeconomic context.
capital markets, investment strategy, asset allocation, portfolio, tactical view, duration, credit, equities, alternatives
false
Capital Markets Investment FrameworkThe BEAT June 2025
Table
Morgan Stanley
View slide
The slide uses a balanced combination of text and dual bar charts to compare perspectives of Millennials and Gen Zs on systemic racism. It includes a quote, a descriptive text, and two bar charts with contrasting green shades.
Risk Assessment and Management
Technology & Software
The slide compares how Millennials and Gen Z view efforts against systemic racism, indicating a disparity between perceived potential and actual effort in various sectors.
discrimination, systemic racism, Millennials, Gen Z, survey, societal change
false
Fighting discrimination firsthandThe Deloitte Global 2021 Millennial and Gen Z Survey
Mixed Chart
Deloitte
View slide
Slide features a column chart showing the historical share of desktop vs. mobile ad revenues from 2012 to 2020, indicating a plateau in 2020.
Market Analysis and Trends
Media & Entertainment
Discusses the stabilization of revenue share between desktop and mobile platforms in 2020, suggesting a potential shift towards more balanced growth across devices.
advertising, revenue, desktop, mobile, stabilization, 2020, media, technology, trends
false
2020 marked the first timeDesktop vs. Mobile revenue share split plateauInternet Advertising Revenue Report 2020 full year results
Single Chart
PwC/Strategy&
View slide
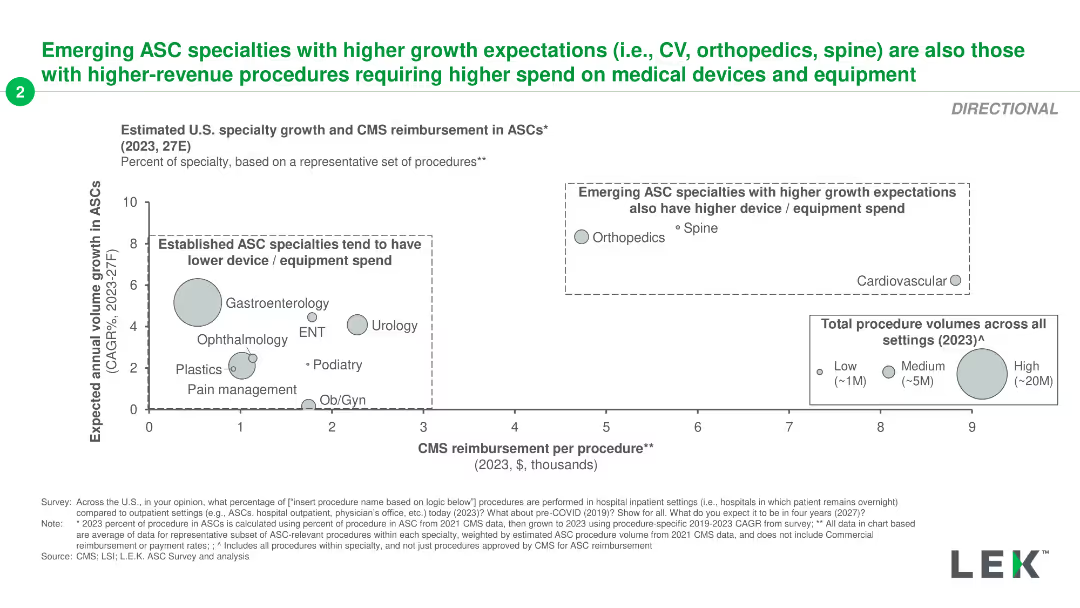
The slide features a scatter plot comparing CMS reimbursement per procedure with expected growth for different ASC specialties.
Market Analysis and Trends
Healthcare & Pharmaceuticals
It examines the relationship between CMS reimbursement and growth expectations for ASC specialties, noting higher spend for emerging specialties like orthopedics.
ASC, specialties, growth, reimbursement, CMS
false
Emerging ASC specialties with higher growth expectations (i.e., CV, orthopedics, spine) are also those with higher-revenue procedures requiring higher spend on medical devices and equipmentL.E.K. ASC Insights Study MedTech Publication Deck
Single Chart
LEK
View slide
The slide contains a column chart showing GDP breakdown by industry for 2023 and two bar charts. The left bar chart presents real GDP growth from 2014 to 2023, and the right bar chart shows GDP per capita for various ASEAN countries.
Market Analysis and Trends
Financial Services
This slide provides an overview of GDP growth across ASEAN countries, comparing industry contributions, real GDP growth rates, and GDP per capita to analyze regional economic performance.
ASEAN, GDP growth, industry breakdown, real GDP growth, GDP per capita
false
ASEAN: GDP growthGuide to Investing in Asia
Multiple Chart
JP Morgan
View slide
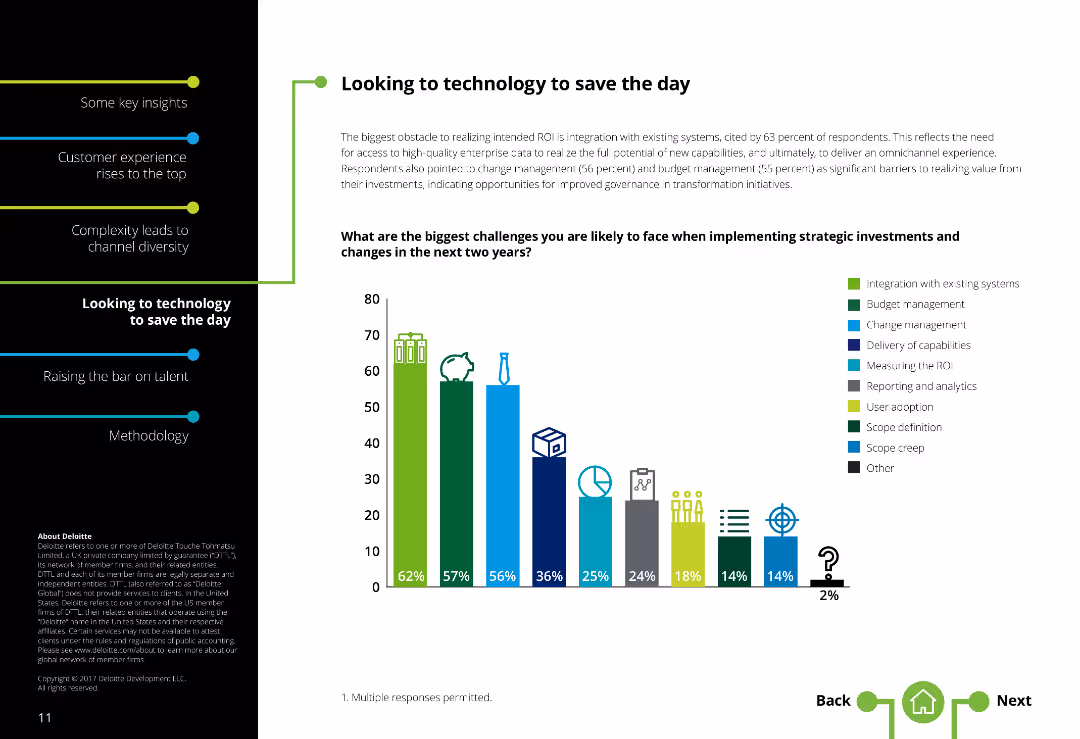
Two-column layout with text on the left and a column chart illustrating challenges on the right. There is moderate text density.
Market Analysis and Trends
Technology & Software
Highlights challenges in implementing strategic investments in contact centers, such as system integration, change management, and budget constraints.
Technology challenges, Contact centers, System integration, Change management, Budget constraints, Strategic investments
false
The biggest obstacle to realizing intended RO! is integration with existing systemsGlobal Contact Center Survey
Single Chart
Deloitte
View slide
Complex layout with flow charts and diagrams similar to slide 6091.
Market Analysis and Trends
Retail & E-commerce
Reiterates the methodology for retail sales calculations, combining various sources of revenue to assess total market sales.
retail, methodology, sales, market analysis, charts
false
METHODOLOGY OF THE STUDY • Revenues at retail value represent total sales valued at retail price.LUXURY GOODS WORLDWIDE MARKET STUDY, SPRING 2019
Mixed Chart
Bain
View slide
Features multiple line graphs with color coding to differentiate between sectors. Includes a sidebar with explanations and a dashed line indicating the normal state.
Market Analysis and Trends
Government & Public Sector
Shows sector-wise activity across time with a focus on the impact of COVID-19 on industrial sectors and their recovery phase.
sector activity, industrial recovery, COVID-19 impact, line graphs
false
Transportation and automotive sectors most impacted; materials and process industries have recoveredCOVID-19 BCG Perspectives Series Global Restart: Key Dynamics
Single Chart
BCG
View slide
The slide lists various crypto trading platforms used by Canadians, with corresponding percentages shown in column charts. The layout is moderately complex.
Market Analysis and Trends
Financial Services
This slide lists the most commonly used crypto trading platforms among Canadians, with Coinbase, Wealthsimple Crypto, and Binance being the top three. It aims to identify preferred platforms for trading.
crypto trading, platforms, usage, Canadians, popular
false
Crypto Trading Platforms UsedCRYPTO ASSET SURVEY
Multiple Chart
IPSOS
View slide
This slide has two comparative diagrams contrasting the verticals of healthcare and connected cars, with related icons and key statistics.
Strategic Planning
Technology & Software
Illustrates J.P.Morgan's targeted vertical solutions with strategic investments in healthcare payments and connected car services.
Healthcare, Connected Cars, Vertical Solutions, Strategic Investments, J.P.Morgan
false
We are rolling out unique vertically-aligned solutions with acquisitions and strategic investments to accelerate our roadmapCorporate & Investment Bank 2022
Table
JP Morgan
View slide
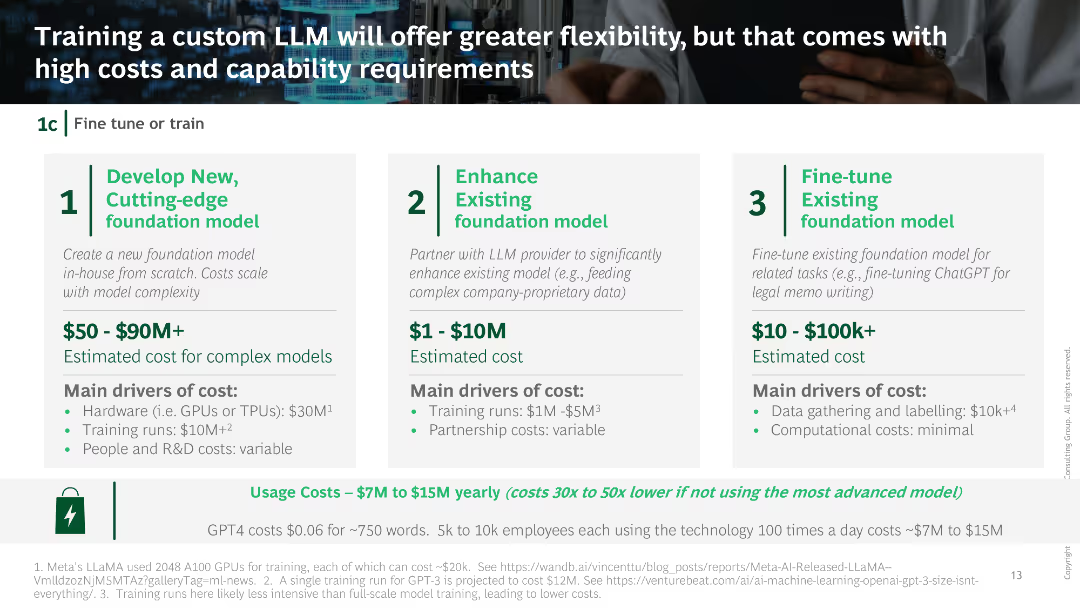
Comparison of costs and drivers for developing new, enhancing existing, and fine-tuning foundation models, with detailed cost estimates and main cost factors.
Technology and Digital Transformation
Technology & Software
The slide compares different approaches to training custom language models, detailing the associated costs, benefits, and key cost drivers for each approach.
Custom LLM, Training costs, Model enhancement, Cost drivers, Flexibility
false
Training a custom LLM will offer greater flexibility, but that comes with high costs and capability requirementsWomen-led startups losing across the board: from creation to funding, in all key European markets
Linear Flow
BCG
View slide
Features column charts, with icons and data points detailing job creation and income boost figures. Emphasizes savings through color contrasts and visual hierarchy in design.
Market Analysis and Trends
Telecommunications
Details how the nbn network has facilitated job creation, increased incomes through remote work, and provided cost savings by enabling cheaper online alternatives to traditional services.
nbn, Jobs, Savings, Remote Work, Business Creation
false
The nbn network has enabled job and business creation, whilst also enabling users to boost their income and save money by using online alternativesThe economic and social impact of investment in the nbn network Key Insights Report
Multiple Chart
Accenture
View slide
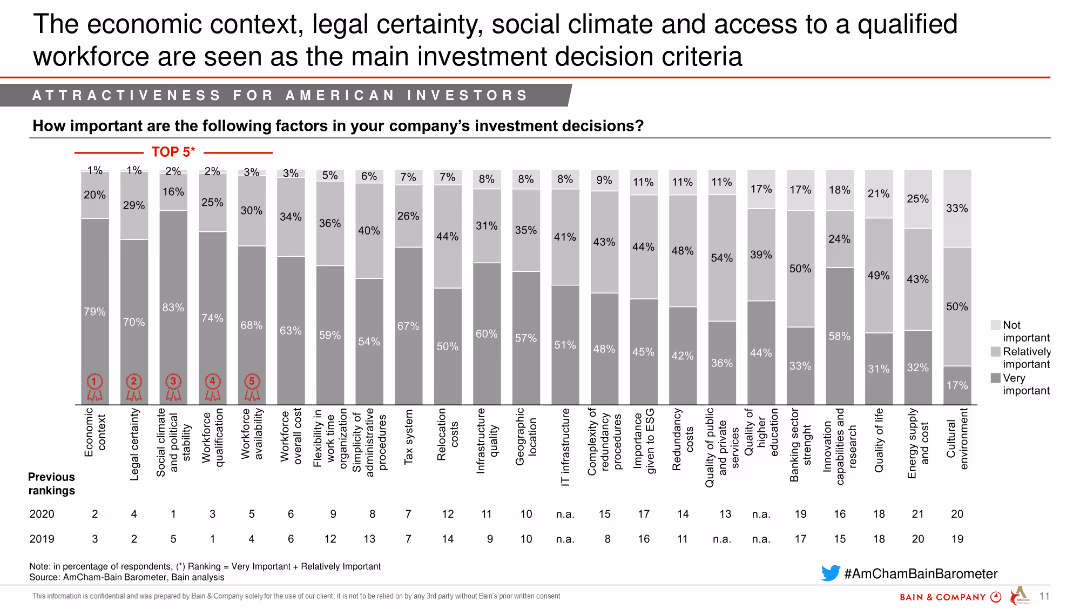
The slide contains a column chart highlighting the importance of various factors in investment decisions, such as economic context, legal certainty, and social climate, with rankings from 2019 to 2021.
Market Analysis and Trends
Media & Entertainment
This slide presents the key factors influencing investment decisions in France, with economic context and legal certainty being top priorities.
Investment criteria, Economic context, Legal certainty, Social climate, Workforce
false
The economic context, legal certainty, social climate and access to a qualified workforce are seen as the main investment decision criteriaAmCham-Bain Barometer 22nd Edition
Single Chart
Bain
View slide
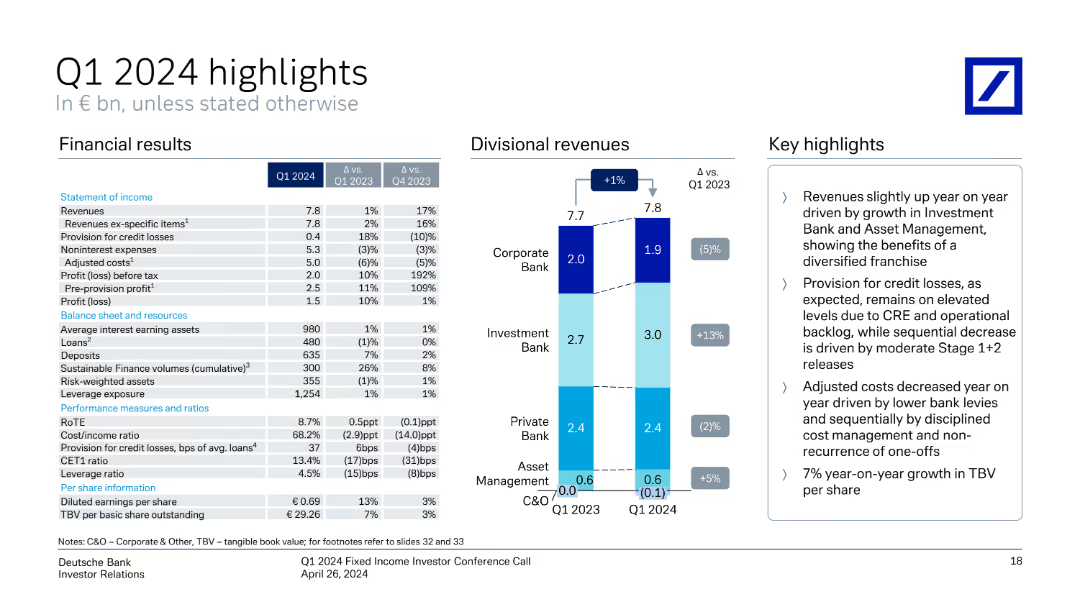
This slide has a column chart showing divisional revenues and a table with financial results for Q1 2024, with key highlights on the right.
Financial Performance
Financial Services
The slide summarizes Q1 2024 financial results, including revenues, profit, balance sheet metrics, and divisional revenues, with key insights.
financial, Q1 2024, highlights, revenue, profit, divisional, results, analysis, metrics, Deutsche Bank
false
Q1 2024 highlights In € bn, unless stated otherwiseQ1 2024 Fixed Income Investor Conference Call
Mixed Chart
Deutsche Bank
View slide
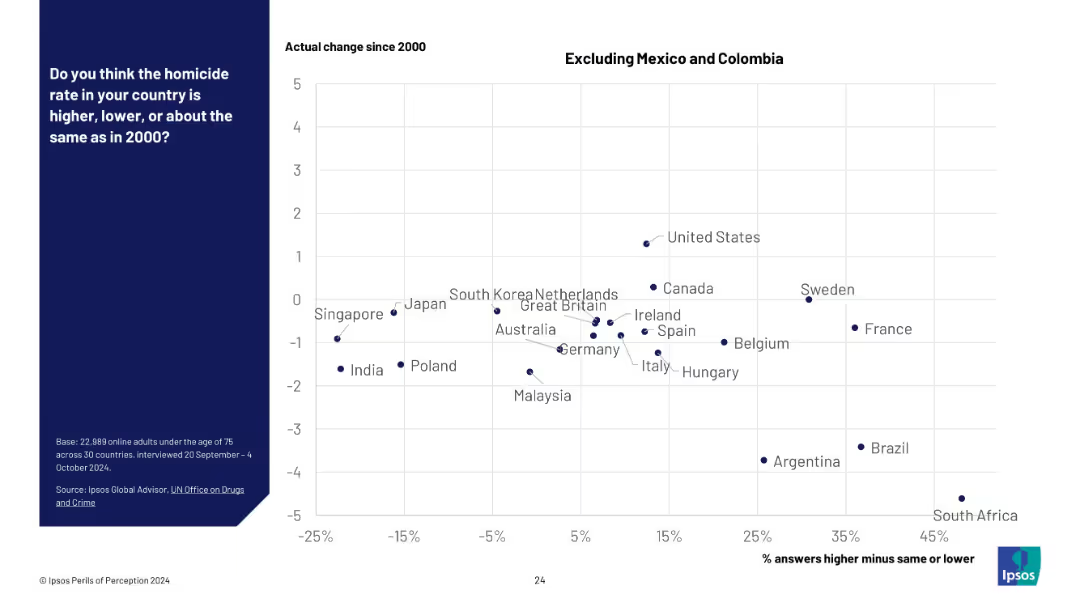
Same structure as previous slide but with Mexico and Colombia removed. Scatter plot on a white grid, allowing finer resolution for mid-range countries.
Market Analysis and Trends
Government & Public Sector
A refined view of homicide perception vs. reality by removing outlier countries Mexico and Colombia. The data suggests widespread overestimation of rising crime despite largely stable or falling homicide rates.
homicide trends, crime perception, data refinement, Ipsos survey, cross-country analysis, public misperception, safety, data visualization, international trends
false
Do you think the homicide rate in your country is higher, lower, or about the same as in 2000? (Excluding Mexico and Colombia)PERILS OF PERCEPTION
Mixed Chart
IPSOS
View slide
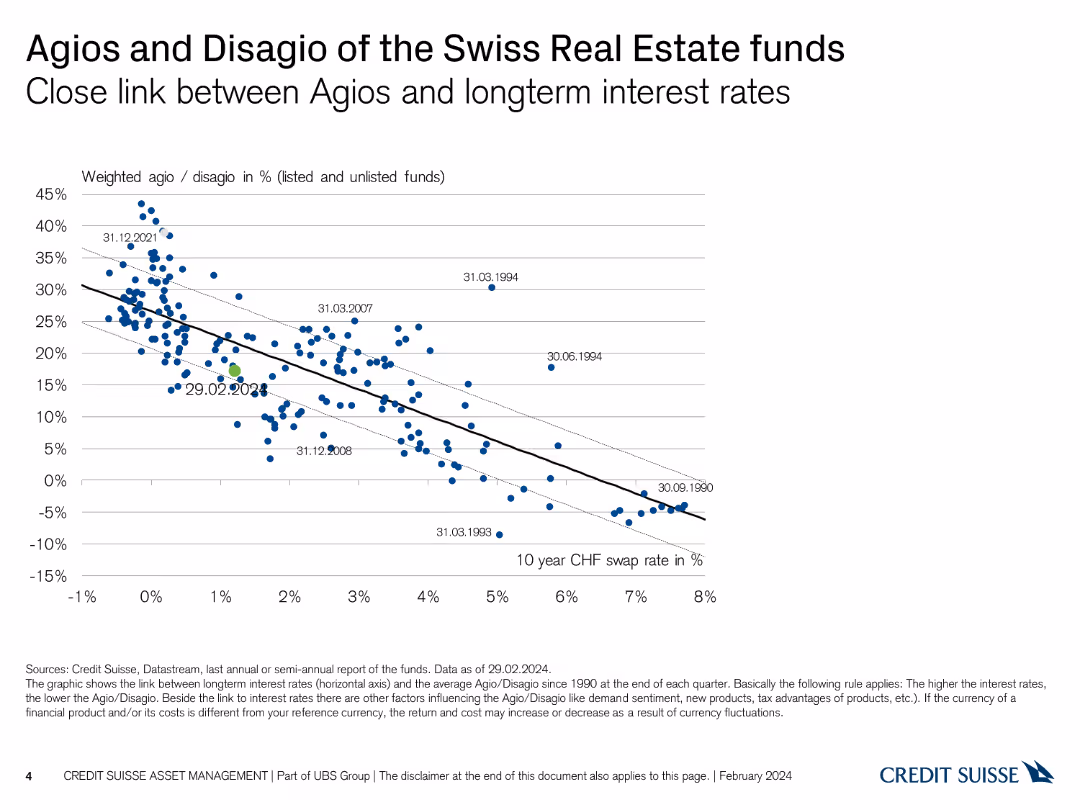
Scatter plot linking agios/disagios with long-term interest rates, with historical data points labeled.
Market Analysis and Trends
Real Estate & Construction
Demonstrates the relationship between agio/disagio percentages and long-term interest rates for Swiss real estate funds.
real estate, agio, disagio, interest rates, historical data
false
Agios and Disagio of the Swiss Real Estate funds Close link between Agios and longterm interest ratesSwiss Real Estate Funds At a glance
Single Chart
Credit Suisse
View slide
This slide presents a list of Michelin's innovation capabilities accompanied by corresponding icons, and a graphical representation of their leadership positions across different end-markets. The layout is balanced with text on the left and images on the right. The slide's design incorporates brand colors and includes the Michelin logo at the bottom.
Strategic Planning
Industrial & Manufacturing
It focuses on Michelin's strengths in innovation, manufacturing, simulations, and sustainability. The slide likely serves to showcase the company's innovation strategy and its position in various market segments, aimed at stakeholders or in strategic planning meetings to discuss competitive advantage and long-term growth plans.
innovation, capabilities, Michelin, sustainability, manufacturing, market leadership, strategy, growth, research and development, services
false
Michelin’s deep-innovation capabilities feed the Group’s leadership on all targeted end-marketsRoad Show US West Coast Morgan Stanley
Header Horizontal
Morgan Stanley
View slide
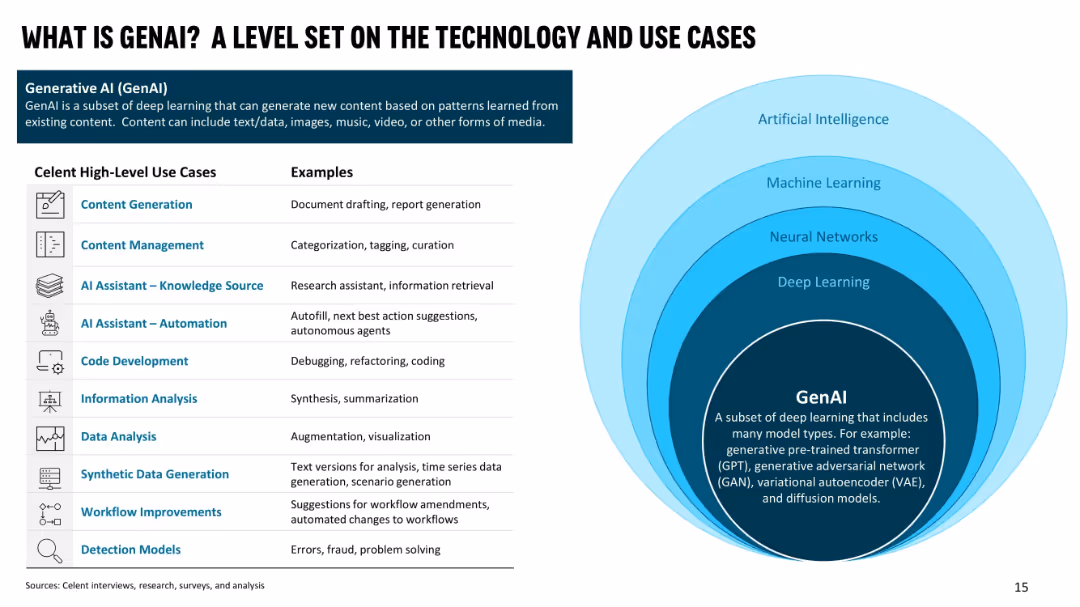
Left side shows a table of GenAI high-level use cases with examples; right side has concentric rings showing relationship of AI → ML → NN → DL → GenAI.
Technology and Digital Transformation
Artificial Intelligence
Defines Generative AI and places it within the broader AI ecosystem. Lists high-level use cases with real-world examples including content generation, automation, data analysis, and code development. The goal is to orient the audience to GenAI's capabilities and application relevance.
GenAI, AI hierarchy, use cases, content generation, automation, knowledge source, deep learning
false
WHAT IS GENAI? A LEVEL SET ON THE TECHNOLOGY AND USE CASESGenerative AI Making Waves
Table
Oliver Wyman
View slide
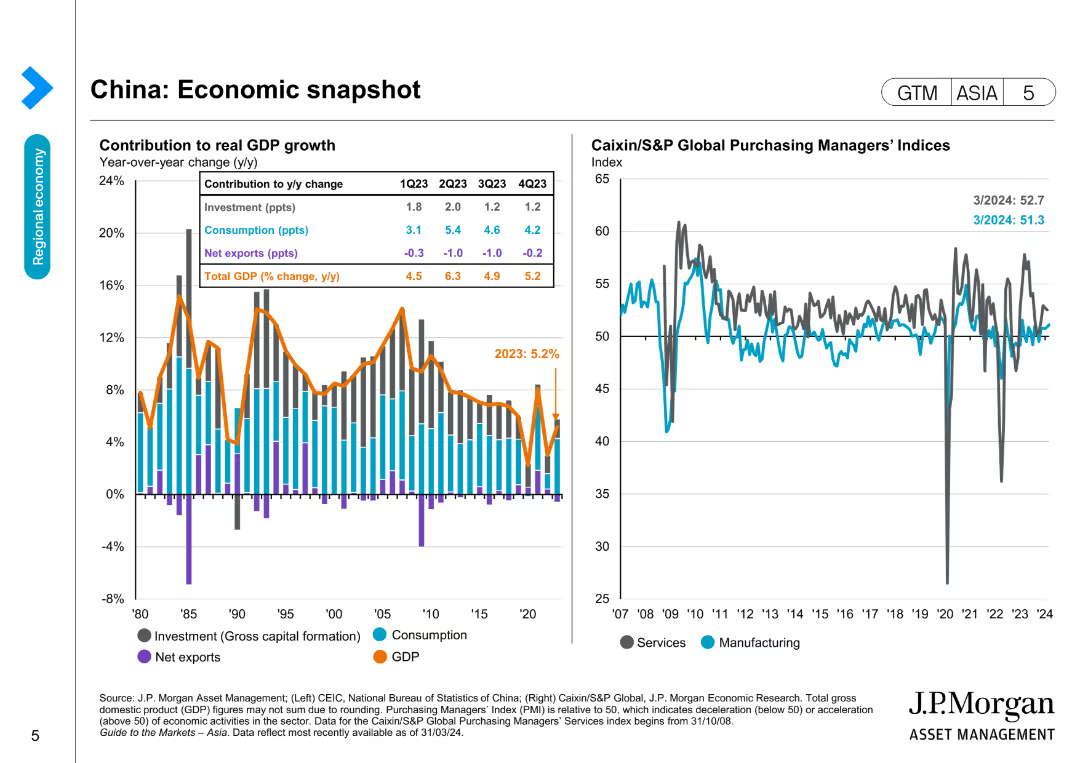
The slide contains a column chart showing GDP growth contributions and a line chart depicting Caixin/S&P Global Purchasing Managers’ Indices for services and manufacturing.
Market Analysis and Trends
Financial Services
It provides an overview of China's economic performance with data on GDP growth contributions and purchasing managers' indices, useful for market trend analysis.
GDP, China, Economic snapshot, Growth, Trends, Manufacturing, Services, Financial data, PMI
false
China: Economic snapshotGuide to the Markets Asia | 2Q 2024
Multiple Chart
JP Morgan
View slide
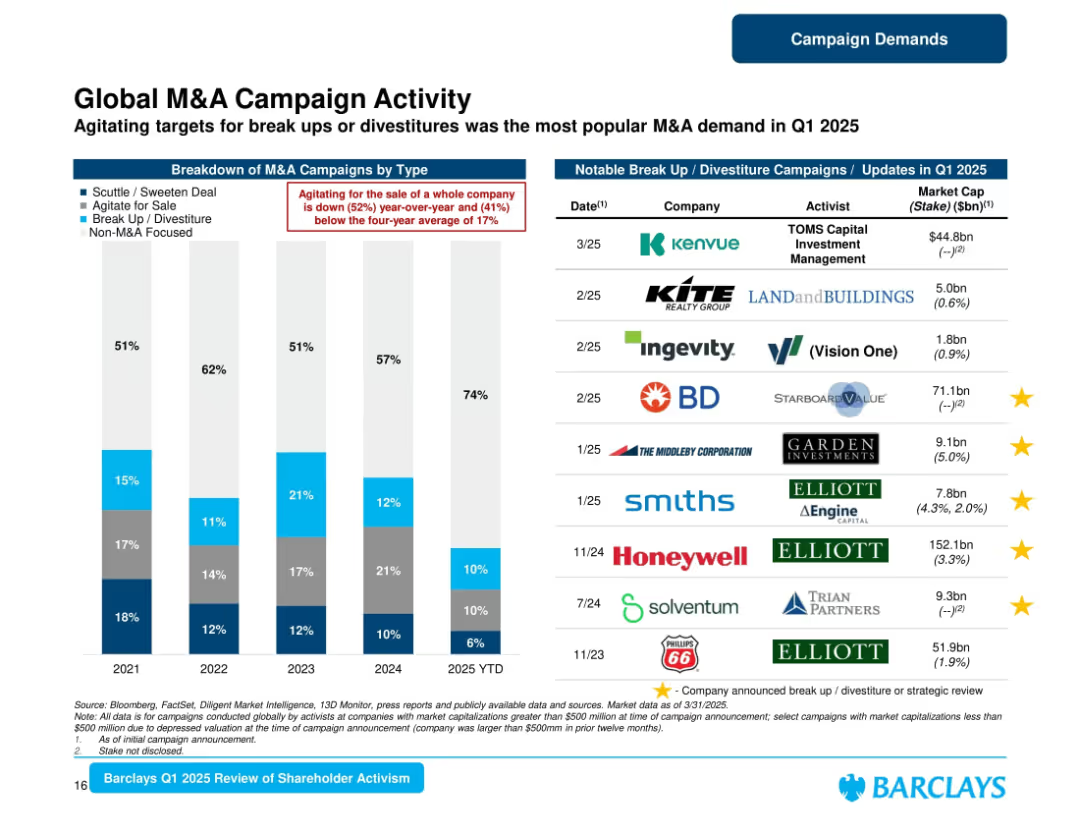
Left section shows stacked bars; right section is a table of notable campaigns with logos and company names.
Mergers and Acquisitions
Financial Services
Reviews M&A-related activist campaigns globally, showing breakdowns by type and a decline in campaigns agitating for full company sales. Includes a list of key break-up/divestiture campaigns with associated firms and market cap data.
M&A, Campaigns, Divestiture, Activists, Global, Shareholder, Barclays, Breakup, 2025
false
Global M&A Campaign ActivityBarclays Shareholder Advisory Group
Mixed Chart
Barclays
View slide
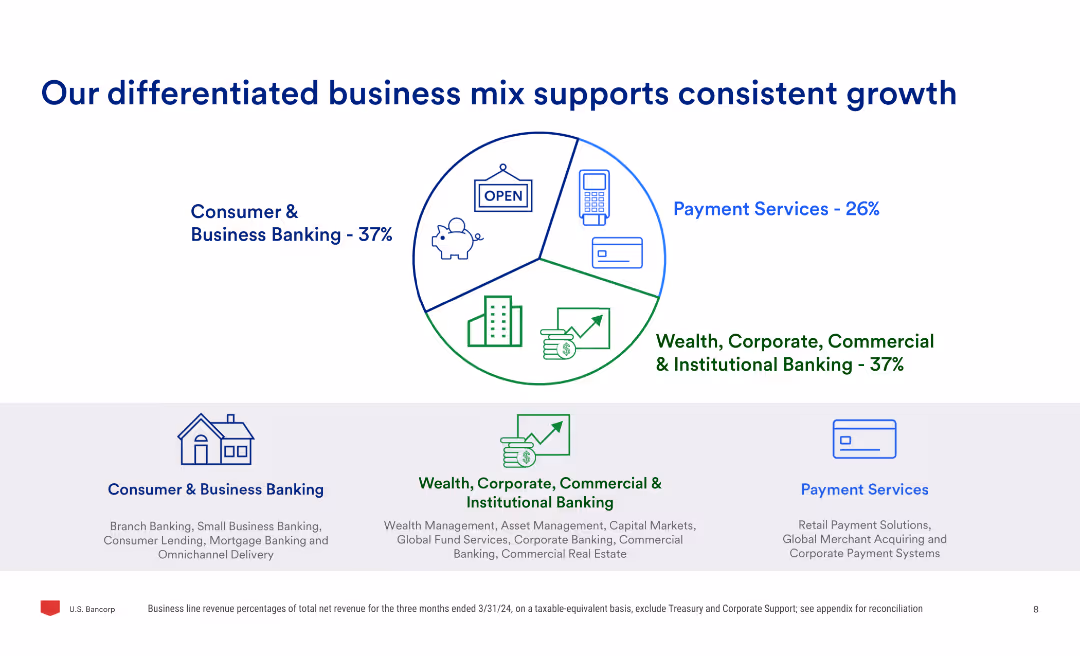
The slide uses a pie chart to show the business mix percentages and three sub-sections detailing consumer & business banking, payment services, and wealth, corporate, commercial & institutional banking.
Market Analysis and Trends
Financial Services
Highlights the company's diversified business model, showing the percentage contribution of different business segments and explaining the services offered in consumer & business banking, payment services, and institutional banking.
business mix, growth, banking, payment services, wealth, commercial, institutional, market analysis
false
Our differentiated business mix supports consistent growthBarclays Americas Select Franchise Conference 2024
Mixed Chart
Barclays
View slide
Column charts showing trends in litigation provisions and contingent liabilities over several quarters.
Regulatory and Compliance
Financial Services
Provides updates on litigation and contingent liabilities, highlighting slight increases and the impact on financial planning. Aimed at investors and regulators.
litigation, liabilities, trends, Q3 2023
false
Litigation update In € bn, period endQ3 2023 results
Multiple Chart
Deutsche Bank
View slide
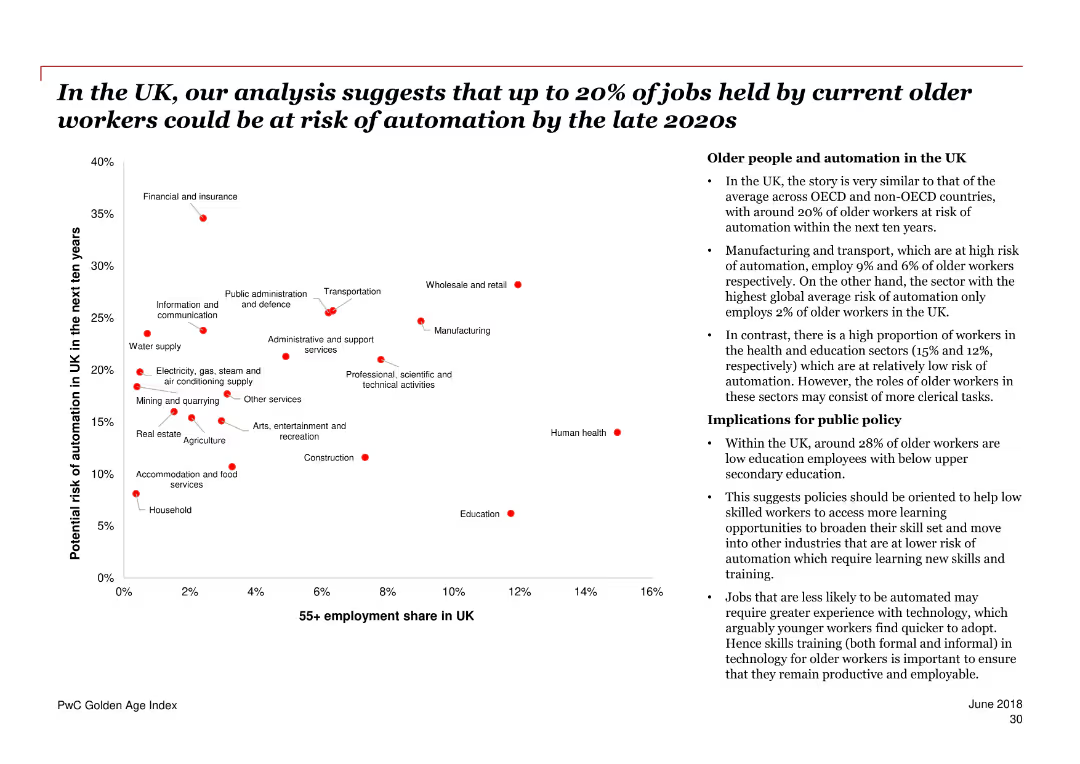
The slide features a scatter plot chart showing the potential risk of automation for older workers in various industries in the UK over the next ten years. A section of bullet points on the right provides additional context and implications.
Risk Assessment and Management
Government & Public Sector
The slide discusses the potential automation risk faced by older workers in the UK, with specific industry data and public policy implications. It highlights the proportion of older workers and their risk levels across different sectors.
automation, older workers, UK, risk, industries, public policy, employment, sectors, implications
false
In the UK, our analysis suggests that up to 20% of jobs held by current older workers could be at risk of automation by the late 2020sPwC Golden Age index Unlocking a potential $3.5 trillion prize from longer working lives
Mixed Chart
PwC/Strategy&
View slide
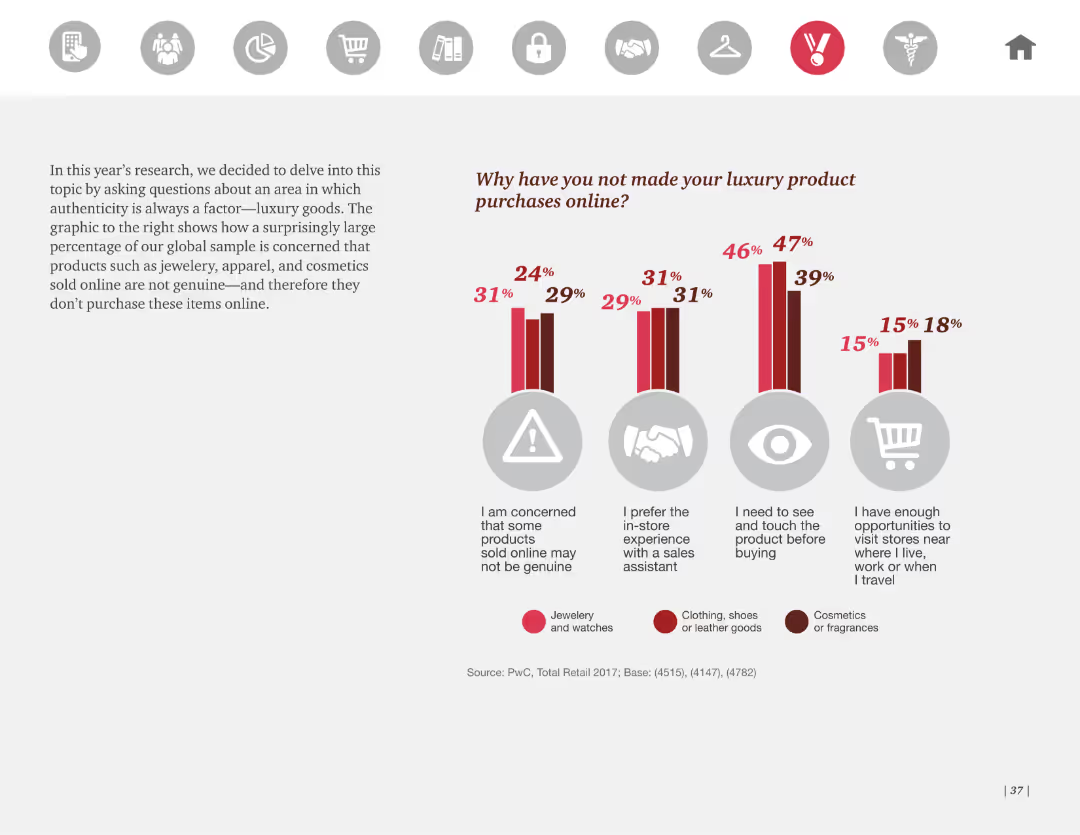
The slide presents a column chart depicting reasons for not purchasing luxury products online, segmented by product type. The design is clear with concise text explaining each reason and related statistics.
Market Analysis and Trends
Retail & E-commerce
It highlights survey findings that a significant number of consumers are hesitant to buy luxury products online due to concerns over authenticity, preference for in-store experiences, and the need to physically inspect items before purchase.
Luxury products, online shopping, consumer concerns, survey, authenticity
false
Why have you not made your luxury product purchases online?10 retailer investments for an uncertain future
Mixed Chart
PwC/Strategy&
View slide
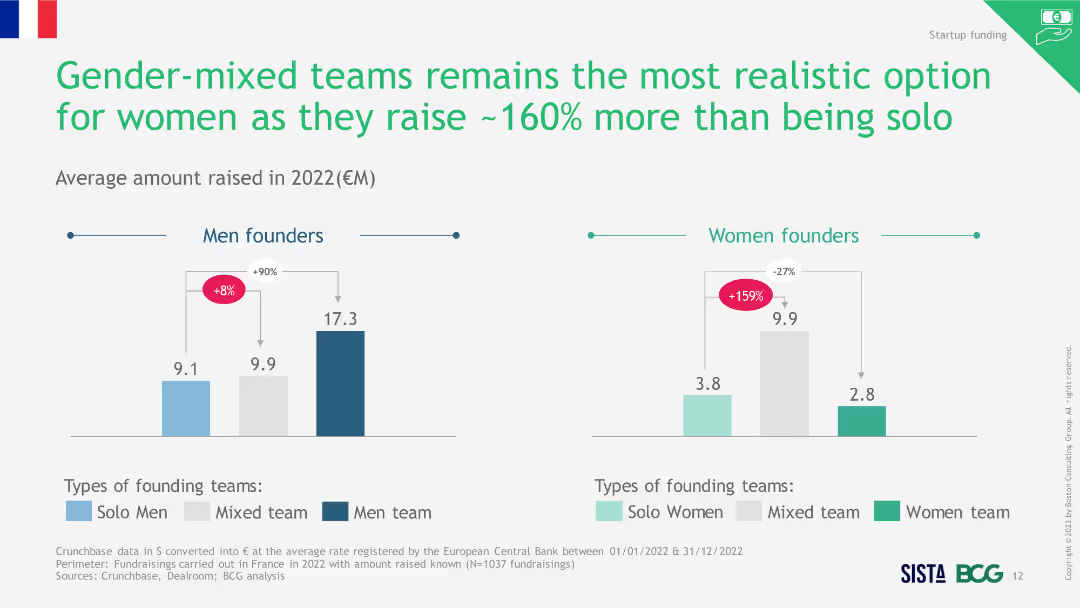
Two-column charts showing average amount raised in 2022 by different team compositions for men and women founders, highlighting mixed teams.
Market Analysis and Trends
Professional Services
The slide indicates that gender-mixed teams raised more funds in 2022 compared to solo or single-gender teams, making them a realistic option for women.
mixed teams, funding, gender diversity, realistic option
false
Gender mixed teams remains the most realistic option for women as they raise ~160% more than being soloWomen-led startups losing across the board: from creation to funding, in all key European markets
Multiple Chart
BCG
View slide
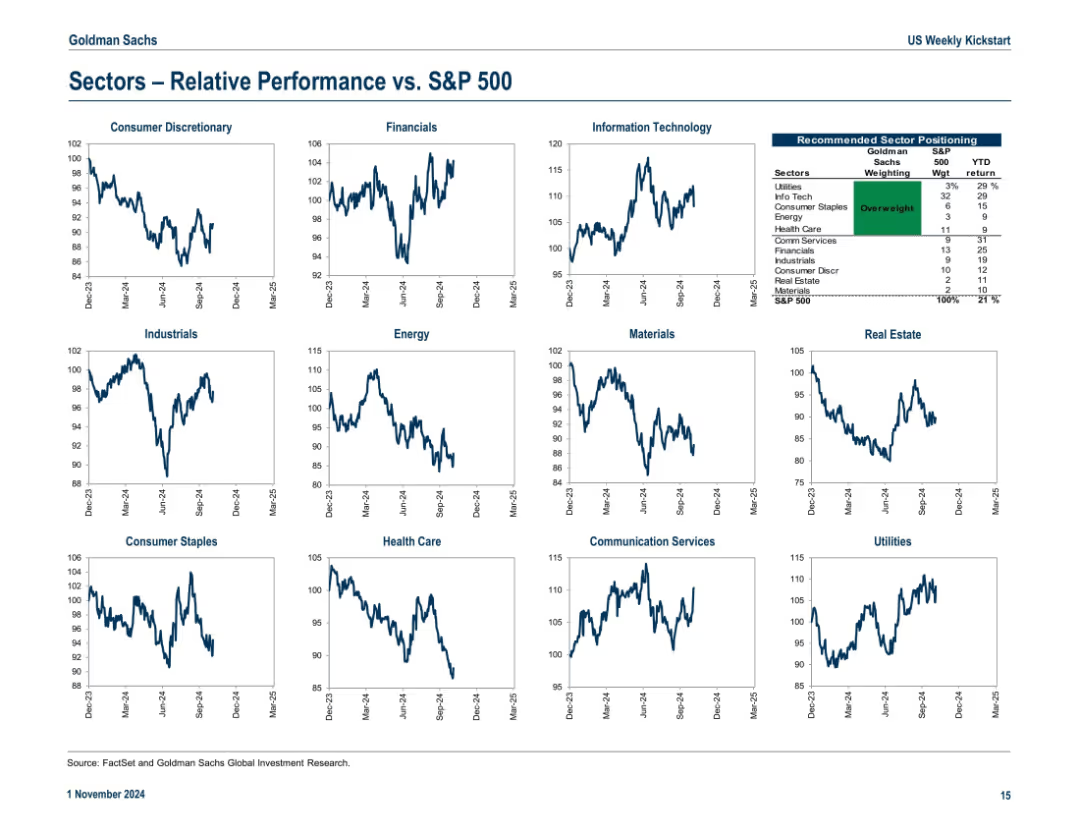
Grid of 12 mini line charts depicting each sector’s relative performance vs. S&P 500; includes recommended sector positioning table
Market Analysis and Trends
Financial Services
Shows relative performance trends for major GICS sectors vs. the S&P 500, along with a recommendation table suggesting overweights and underweights. Utilities and Info Tech are leading sectors YTD.
sector rotation, relative performance, S&P 500 comparison, overweight, sector positioning
false
Sectors – Relative Performance vs. S&P 500US Weekly Kickstart The rise of passive ownership
Multiple Chart
Goldman Sachs
View slide
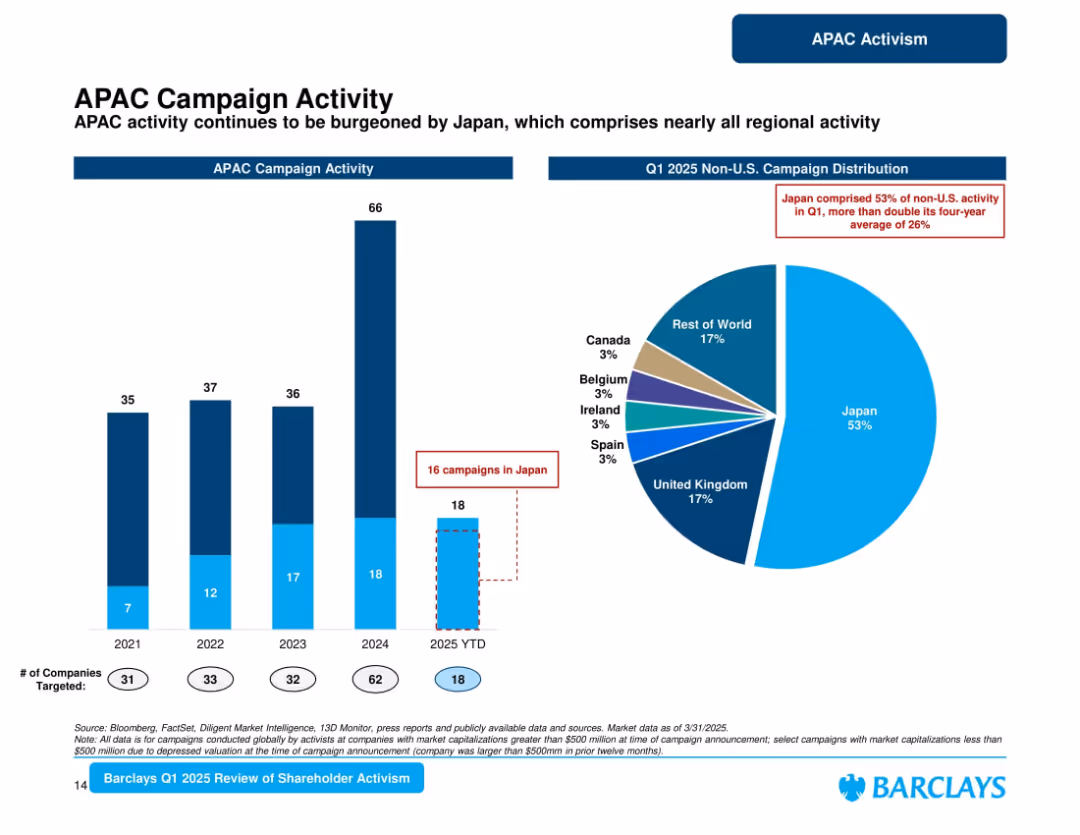
Vertical bar chart and a pie chart. Divided into left (historical trend) and right (regional share) panels. Clear blue/white style.
Market Analysis and Trends
Financial Services
Shows APAC shareholder activism from 2021 to 2025 YTD, emphasizing Japan’s growing dominance in Q1 2025, accounting for 53% of regional activity—double the four-year average. Includes campaign count and regional share pie chart.
APAC, Japan, Activism, Campaigns, Trends, Regional, Shareholder, 2025, Barclays
false
APAC Campaign ActivityBarclays Shareholder Advisory Group
Multiple Chart
Barclays
View slide
Featuring pie charts and bar charts, the slide shows the percentage of Canadians who received recommendations from financial advisors to purchase crypto assets, comparing data from 2023 and 2022.
Market Analysis and Trends
Financial Services
It details the recommendations from financial advisors regarding purchasing crypto assets, including how often these recommendations were made and how they have changed from 2022 to 2023.
recommendations, financial advisor, crypto assets, purchase, comparison
false
Recommendations From Advisor to Purchase Crypto Assets Nearly 80% of investors who have financial advisors have not been recommended to purchase crypto assets by their financial advisor,CRYPTO ASSET SURVEY 2023
Multiple Chart
IPSOS
View slide
The slide shows a world map overlaid with bar charts and textual annotations representing the year-over-year change in the PC/LT tire market by region. The design uses color-coded columns and icons to differentiate between OE and RT markets. The Michelin logo is subtly included, and the design makes use of brand colors and a clear, straightforward layout.
Market Analysis and Trends
Transportation & Logistics
Offering a global overview of the PC/LT tire market for the first 9 months of 2023, the slide depicts regional trends and market shifts. It is suitable for presentations to stakeholders in business strategy meetings or industry analysis seminars to inform decisions based on regional market performance.
tire market, global, analysis, trends, OE, RT, Michelin, regional, performance, strategy
false
9M PC/LT tire markets: sell-in demand globally flat, with OE up driven by supply chains ease vs RT slightly down on unfavorable basis of comparison and destockingRoad Show US West Coast Morgan Stanley
Mixed Chart
Morgan Stanley
View slide
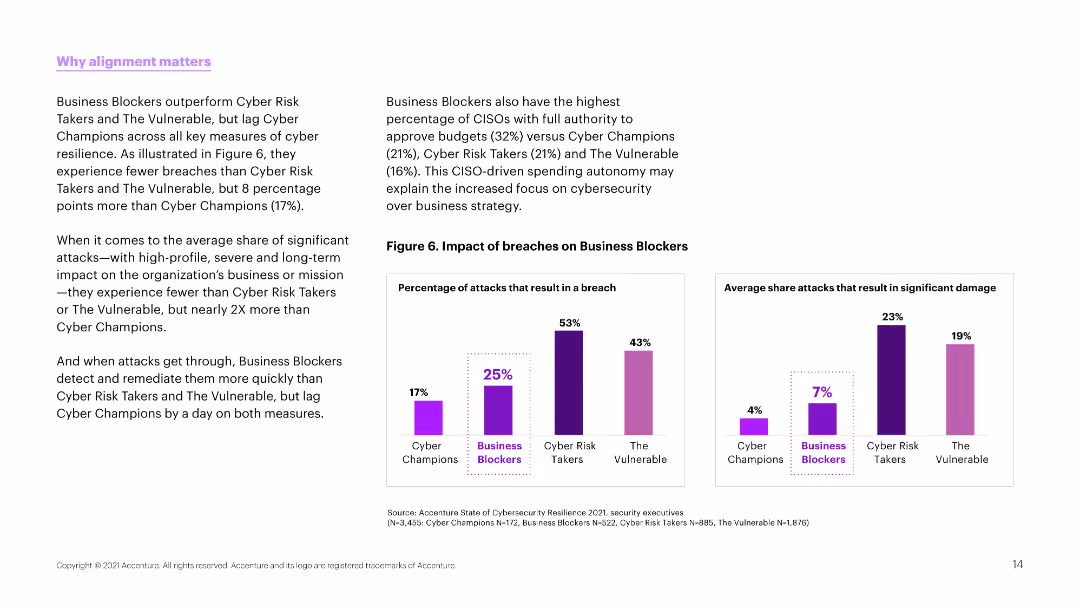
Text and column charts comparing the impact of breaches on different types of organizations. Charts use purple to show percentages of breaches and impacts.
Strategic Planning
Professional Services
The slide emphasizes the importance of alignment in cybersecurity strategies, comparing the breach impacts on different organizational types like Business Blockers and Cyber Champions.
alignment, cybersecurity, breaches, comparison, impact
false
Business Blockers outperform Cyber Risk Takers and The VulnerableHow aligning security and the business creates cyber resilience
Multiple Chart
Accenture
View slide
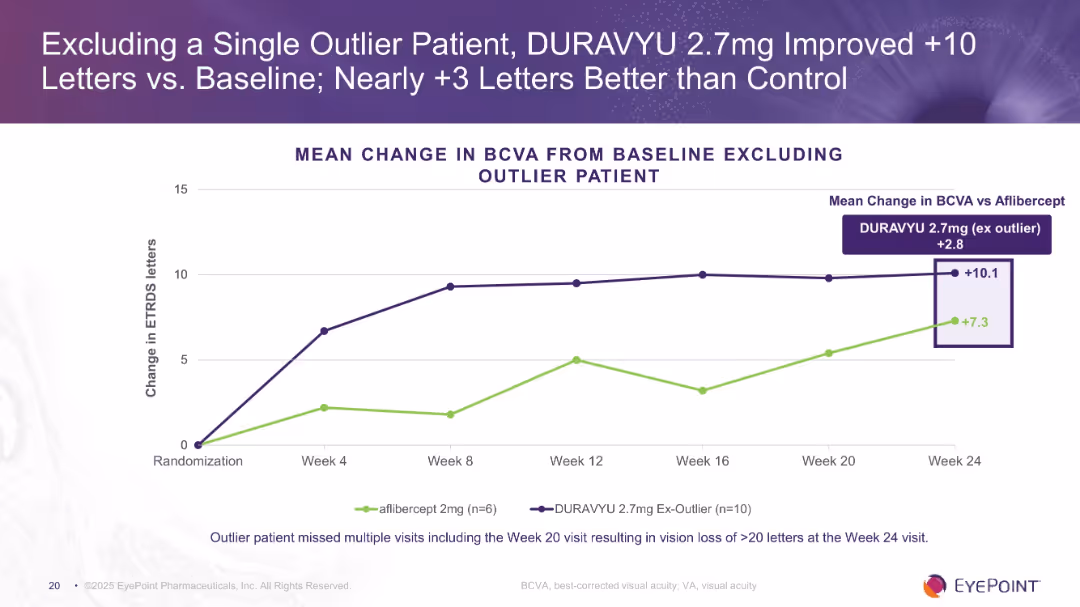
Line chart comparing DURAVYU 2.7mg (excluding outlier) vs. aflibercept across 24 weeks. Annotated visual highlights the +2.8 mean difference.
Product and Service Analysis
Healthcare & Pharmaceuticals
Shows enhanced visual acuity (+10.1 letters) when excluding one outlier in the DURAVYU 2.7mg group, improving its margin over aflibercept. Supports stronger efficacy claims by removing statistical noise caused by a missed visit.
outlier exclusion, BCVA, DURAVYU, vision improvement, clinical data
false
Excluding a Single Outlier Patient, DURAVYU 2.7mg Improved...Goldman Sachs Global Healthcare Conference
Single Chart
Goldman Sachs
View slide
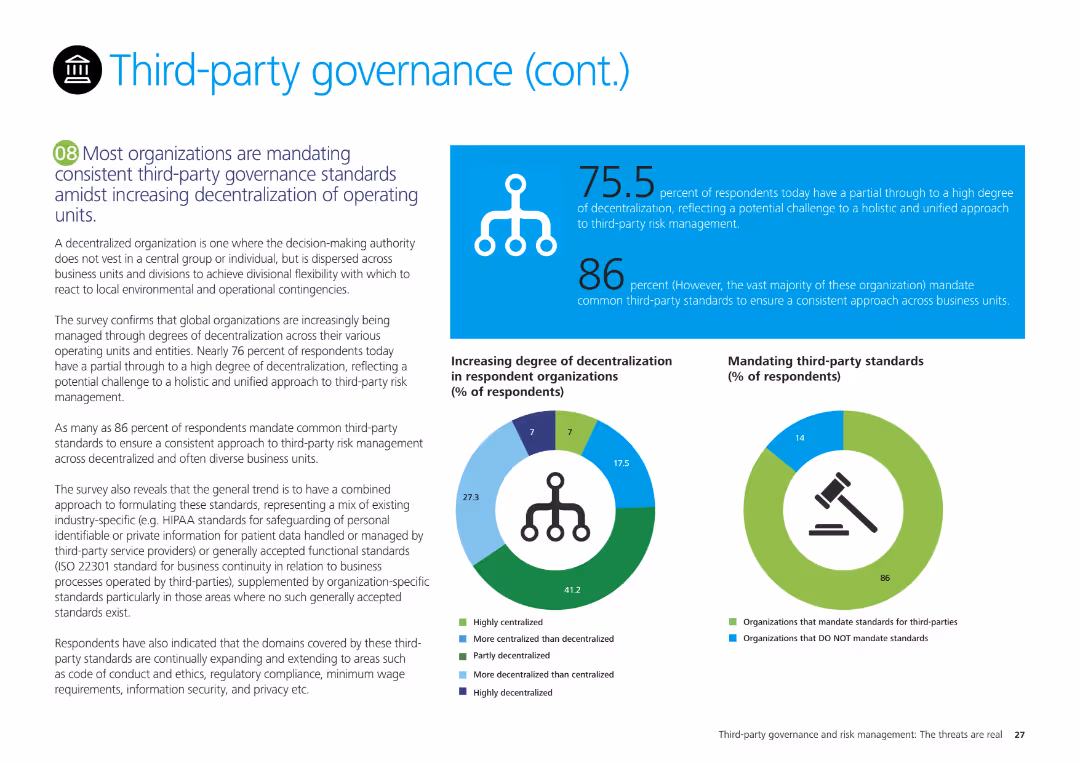
Text content with small charts showing the degree of decentralization and mandating third-party standards. Moderate visual density with explanatory text boxes.
Regulatory and Compliance
Professional Services
The slide explains third-party governance standards amidst decentralization, highlighting survey results on decentralization degrees and mandating third-party standards.
governance, decentralization, standards, third-party, survey
false
Most organizations are mandating consistent third-party governance standards amidst increasing decentralization of operating units.Third-party governance and risk management The threats are real
Multiple Chart
Deloitte
View slide
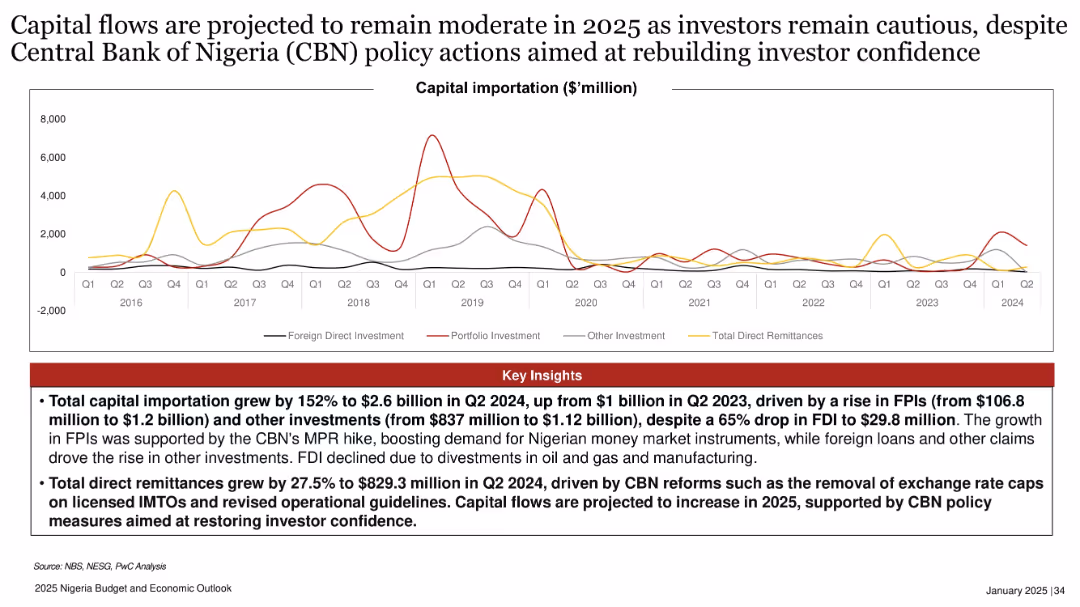
Multi-line chart tracking different types of capital importation; red insights box below; spans from 2016–2024.
Investment Analysis
Financial Services
Capital importation rose sharply in 2024 driven by FPIs and policy reforms, but FDI dropped significantly. The slide forecasts cautious capital flow in 2025, supported by CBN reforms and increased remittances amid efforts to rebuild investor confidence.
capital importation, FPI, FDI, CBN reforms, investor confidence, Nigeria, 2025, policy action, remittances, investment
false
Capital flows are projected to remain moderate in 2025...2025 Nigeria Budget and Economic Outlook
Mixed Chart
PwC/Strategy&
View slide
Slide contains maps and infographics illustrating Indonesia’s status as the world’s largest island country, highlighting the variances in connectivity setup.
Market Analysis and Trends
Telecommunications
Examines Indonesia's unique challenges in developing ICT infrastructure due to its extensive archipelago, focusing on connectivity issues and regional disparities.
Indonesia, connectivity, islands, infrastructure, challenges
false
Indonesia is the world's largest island country, with significant variances in connectivity set upIndonesia case study
Boxed
BCG
View slide
The slide includes text and a pie chart showing the impact of returns charges on online shopping behavior, such as increased caution in purchasing and cessation of buying from certain brands.
Risk Assessment and Management
Retail & E-commerce
Examines the effects of returns charges on consumer behavior, highlighting how financial penalties influence shopping habits and the decision to purchase from specific brands.
Returns charges, Online shopping, Consumer behavior, Financial penalties, Brands
false
6. Returns charges have the potential to significantly influence returns behaviour, however at a high financial cost to retailersSolving fashion’s product returns
Mixed Chart
Roland Berger
View slide
Features column charts and textual analysis comparing customer use of online and offline channels for different types of purchases, focusing on percentages of usage across various industries.
Market Analysis and Trends
Retail & E-commerce
Analyzes the shift in consumer behavior towards online platforms and digital channels, noting significant trends in how different sectors are adapting to the digital age.
digital age, consumer behavior, online shopping, channel usage, retail
false
Channels trichotomy Embracing the Digital Age, awaiting the Virtual RevolutionDigital Revolution Awards
Multiple Chart
Bain
View slide
The slide showcases line graphs for yield ratios and credit quality spreads, with annotations for current, 1-month ago, 12-months ago, and median values.
Market Analysis and Trends
Financial Services
Focuses on the investment attractiveness of municipal bonds by comparing yields and credit spreads with benchmarks, useful for trend analysis and strategic decision-making in fixed income investments.
municipal bonds, yield ratios, credit spreads, line graphs, market trends, investment analysis
false
Municipal Bond Market UpdateMonthly Market Monitor November 2023
Multiple Chart
Morgan Stanley
View slide
Stacked bar graph depicting anticipated approaches to agility in various industries by 2026, along with a pie chart of overall percentages.
Strategic Planning
Professional Services
Predicts the future of agility in different industries, providing a comparative look at expected strategic changes by 2026.
Industry Agility, Future Forecast, Strategic Change, Bar Graph, Pie Chart
false
Agility in 2026 by IndustryConsumers at 250
Single Chart
Kearney
View slide
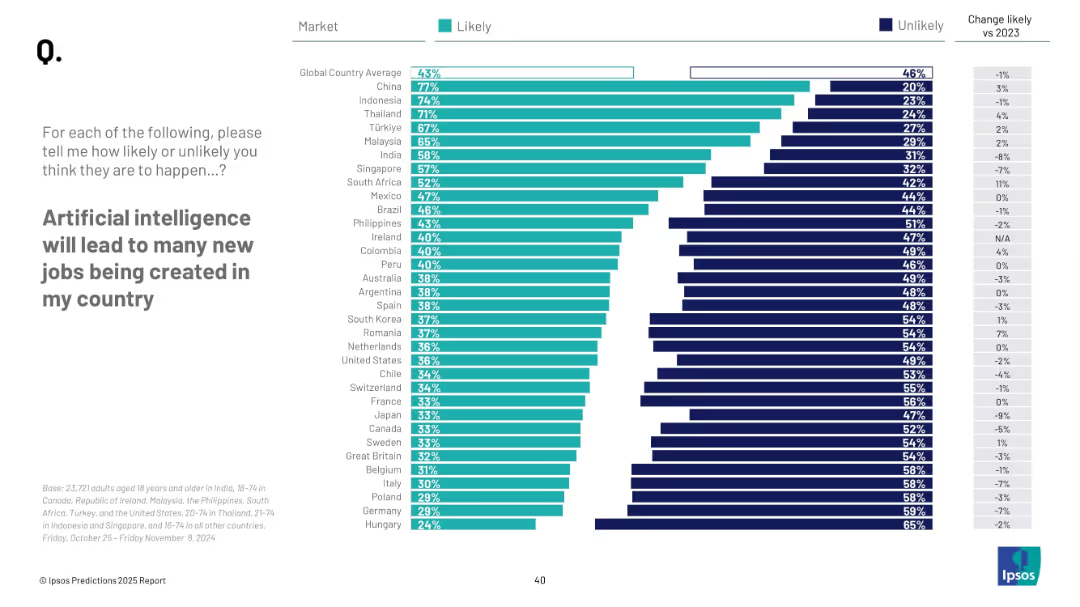
Horizontal bar chart; teal for "Likely", navy for "Unlikely"; countries listed with % values; right column shows change vs 2023
Market Analysis and Trends
Artificial Intelligence
This slide presents public opinion data from 29 countries on whether AI will create new jobs domestically. It ranks countries by perceived likelihood, with a global average of 43% likely.
AI, employment, public perception, survey, Ipsos, job creation, 2025 prediction, workforce, innovation, optimism
false
Artificial intelligence will lead to many new jobs being created in my countryPREDICTIONS 2025 REPORT
Mixed Chart
IPSOS
View slide
Three pie charts represent funding sources, remaining maturities, and funding by currency for UBS Group in Q4 2023.
Strategic Planning
Financial Services
Details UBS Group's funding diversification strategy, highlighting sources of funds, maturity timelines, and currency breakdowns.
UBS, funding, diversification, sources, maturity, currency, strategy, wholesale, financial
false
Long-term wholesale funding diversificationFourth quarter 2023 Fixed Income investor presentation
Multiple Chart
UBS
View slide
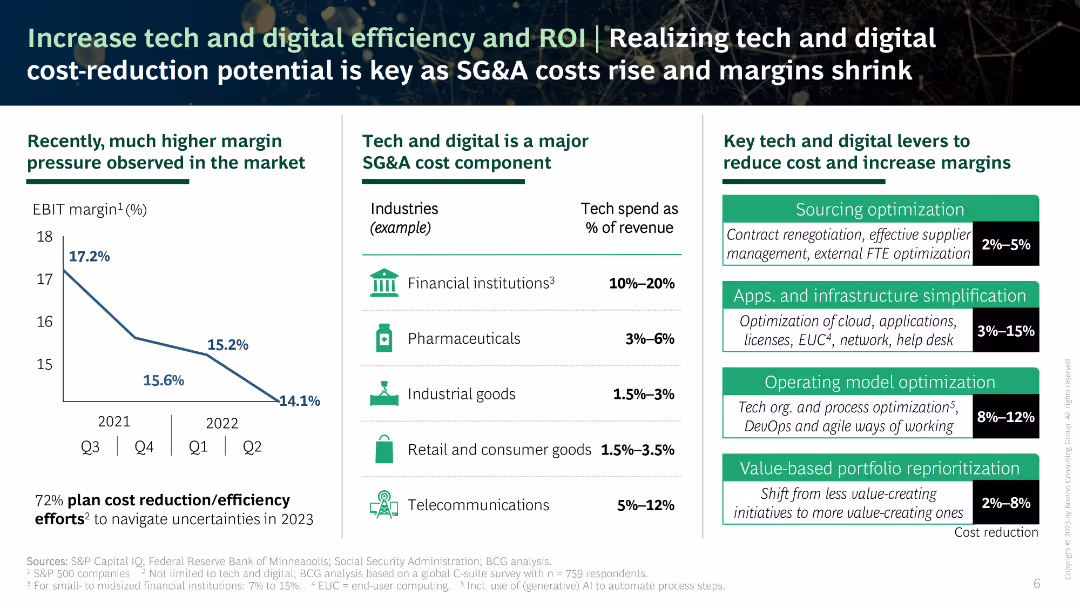
Column chart showing a decline in EBIT margins and a table with tech and digital spending by industry, along with key levers to reduce costs and increase margins.
Operational Efficiency
Technology & Software
This slide highlights the importance of increasing tech and digital efficiency to improve margins, with data on spending and key strategies for cost reduction.
tech, digital, efficiency, cost reduction, margins
false
Increase tech and digital efficiency and ROI | Realizing tech and digital cost reduction potential is key as SG&A costs rise and margins shrinkThe CEO’s Dilemma Leveraging Tech and Digital to Build Resilience
Mixed Chart
BCG
View slide
Includes a stacked chart displaying the levelized cost of hydrogen production over time, comparing different methods.
Financial Performance
Energy & Utilities
Analyzes how incentives impact the cost-effectiveness of hydrogen production methods, useful for financial planning in energy markets.
hydrogen production, cost analysis, incentives, energy market, financial planning, green energy
false
Clean tech | Incentives improve cost competitiveness of clean hydrogen against traditionally produced hydrogenUS Inflation Reduction Act: Climate & Energy Featuresand Potential Implications
Multiple Chart
BCG
View slide
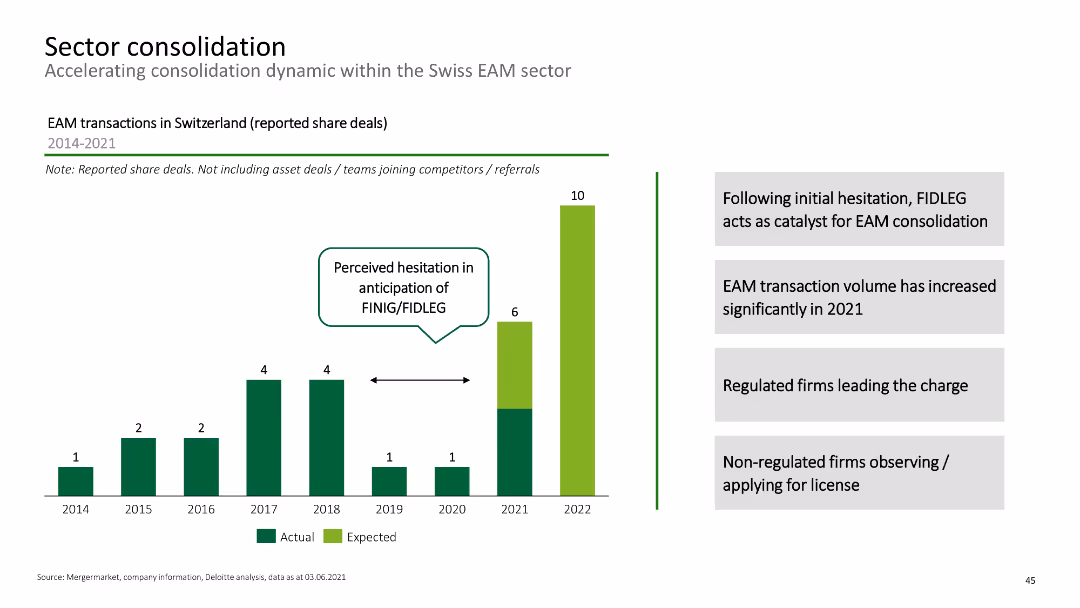
Column chart showing EAM transactions in Switzerland from 2014-2021, with annotations on consolidation catalysts.
Mergers and Acquisitions
Financial Services
This slide discusses the consolidation trends within the Swiss EAM sector, highlighting the impact of regulatory changes.
sector consolidation, EAM transactions, mergers, Swiss market, financial services
false
Sector consolidation Accelerating consolidation dynamic within the Swiss EAM sectorExternal Asset Manager (EAM) Conference
Mixed Chart
Deloitte
View slide
The slide includes a column chart listing various issues faced by users of crypto trading platforms, with corresponding percentages. The layout is moderately complex.
Risk Assessment and Management
Financial Services
This slide highlights common issues experienced by users of crypto trading platforms, such as withdrawal problems and lack of understanding of fees. It aims to identify and address user concerns in the crypto trading ecosystem.
crypto trading, platform issues, user experience, problems, concerns
false
Crypto Trading Platform ExperiencesCRYPTO ASSET SURVEY
Single Chart
IPSOS
View slide
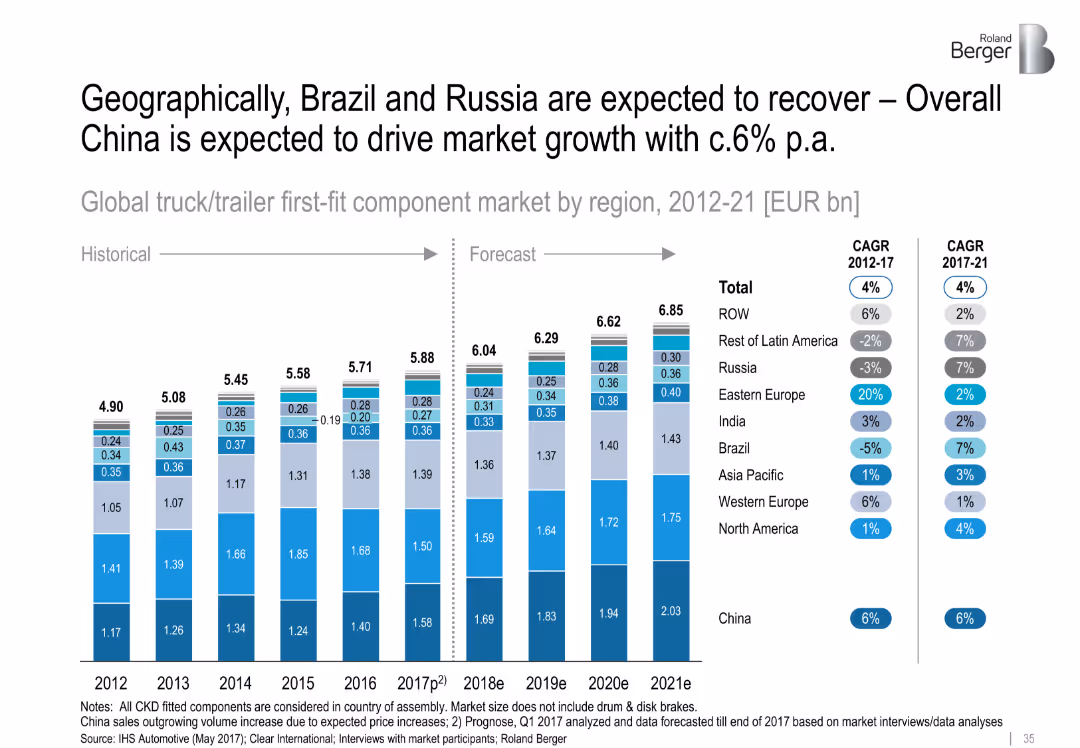
Stacked column chart (historical and forecasted market sizes by region); CAGR annotations on the side
Market Analysis and Trends
Transportation & Logistics
Forecasts the growth of the global truck/trailer first-fit component market from 2012 to 2021. China is the dominant growth driver with ~6% CAGR, while Brazil and Russia show signs of recovery post-2017. Western Europe and ROW also contribute moderately.
market growth, China, Brazil, Russia, CAGR, truck/trailer components, global forecast, regional performance
false
Geographically, Brazil and Russia are expected to recover – Overall China is expected to drive market growth with c.6% p.aTruck and trailer components – Success factors for suppliers in specialized markets
Single Chart
Roland Berger
View slide
The slide displays a diamond-shaped diagram in the center, showing four business areas, flanked by text blocks on each side. It is in a blue and white color scheme with the page number at the bottom right.
Organizational Structure and Change
Financial Services
This slide provides an overview of the presenter's corporate structure, highlighting the integration of services and the focus on client-centricity. It outlines the growth in client coverage and improved relationships as a result of this approach. Ideal for discussions on corporate strategy, organizational change, and client relationship management, it illustrates the company's strategy for unified services and growth in client engagement.
Corporate Strategy, Client Centricity, Business Development, Organizational Structure, Integration
false
Delivering One Goldman SachsGoldman Sachs Presentation to Bernstein Strategic Decisions Conference
Framework
Goldman Sachs
View slide
Diagram showing interconnectivity between different CIB businesses and client engagement statistics in a geometric layout.
Industry Overview
Financial Services
This diagram illustrates the synergy among JP Morgan's CIB businesses—Investment Banking, Markets, Payments, and Securities Services—and their client coverage. It shows the percentage of clients engaged with multiple CIB services, emphasizing comprehensive client solutions and connectivity.
CIB, clients, business, synergy
false
Together our businesses enable us to bring a holistic set of solutions to our clientsCorporate & Investment Bank 2022
Mixed Chart
JP Morgan
View slide
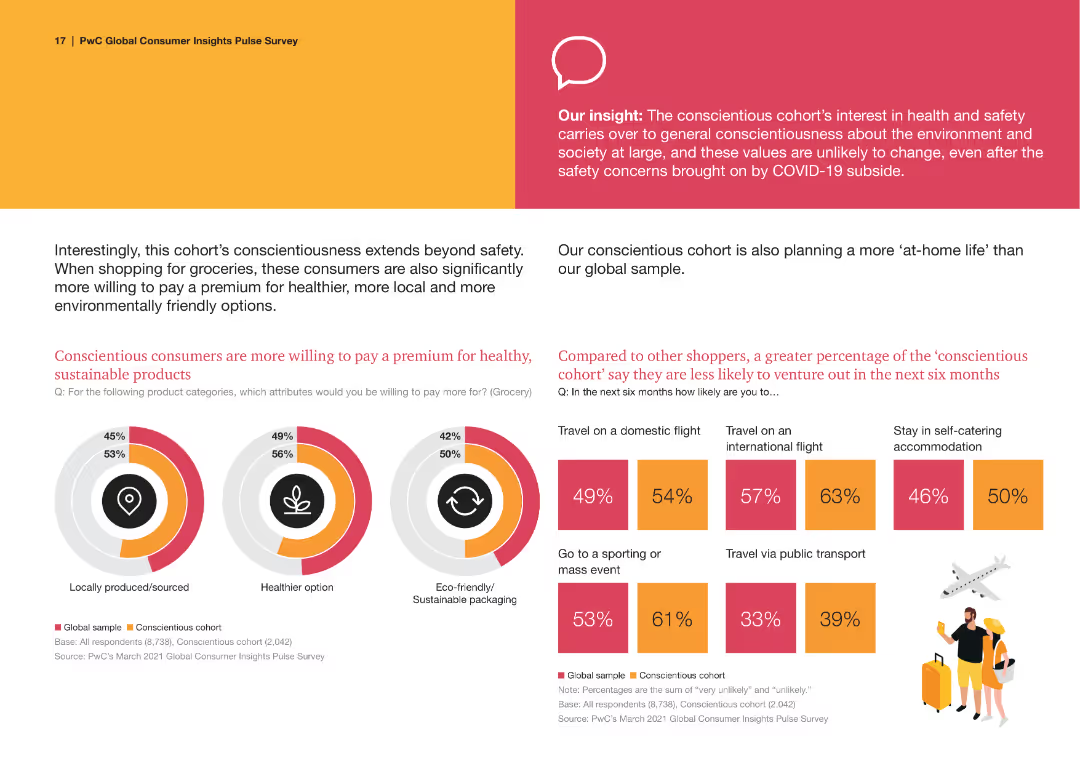
The slide has two circular charts comparing willingness to pay premiums for sustainable products. Text blocks provide additional context. Design is colorful and organized.
Market Analysis and Trends
Consumer Goods
It details how conscientious consumers are more willing to pay for health, local, and eco-friendly products, and their travel habits in the near future.
Sustainable Products, Consumer Preferences, Health, Local Products, Eco-friendly
false
Our insight: The conscientious cohort’s interest in health and safety carries over to general conscientiousness about the environment and society at largeFour fault lines show a fracturing among global consumers
Multiple Chart
PwC/Strategy&
View slide
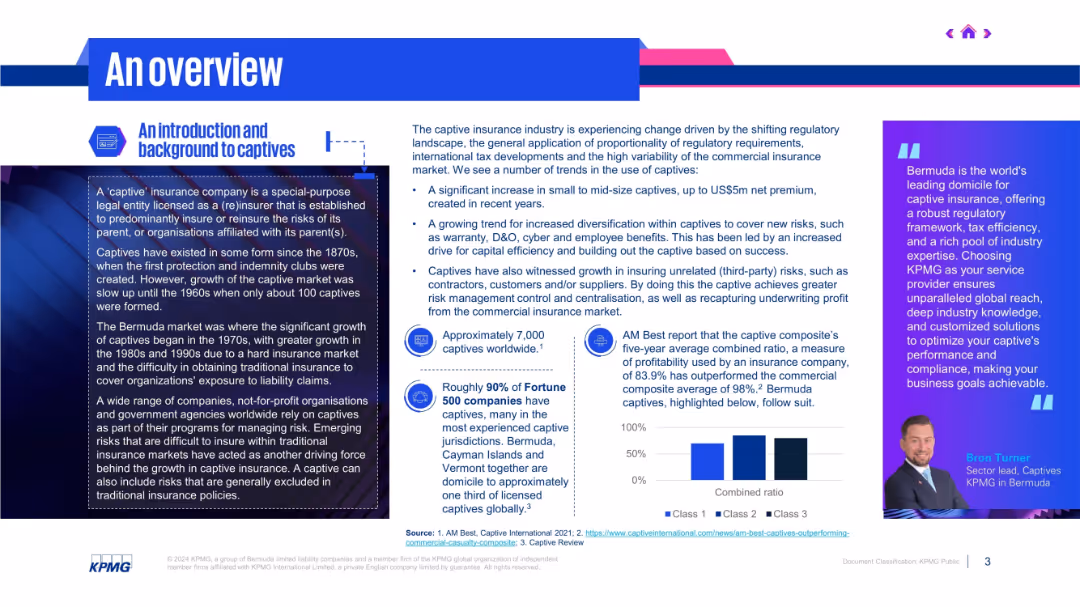
Two-column layout; left side defines captives and history; right side explains market shifts and trends in bullet form.
Industry Overview
Financial Services
The slide introduces the captive insurance market, noting increased adoption due to regulatory changes, cost control, and risk management benefits. It mentions Bermuda’s prominence and growth in third-party risk insurance and diversification within captive structures.
captive insurance, regulation, Bermuda, risk management, diversification
false
An overviewCaptive Insurance Guide
Mixed Chart
KPMG
View slide
The slide contains a column chart depicting spending priorities over the next 3 years across three categories: Physical and digital infrastructure, Medical supplies and devices, and Staff.
Strategic Planning
Healthcare & Pharmaceuticals
The slide shows the expected increase in spending by hospitals in three main areas over the next three years, with a focus on innovative drugs/therapy, physician support systems, and patient-facing digital solutions.
Hospitals, spending, infrastructure, medical supplies, staff
false
Over 40% of hospitals are expected to increase spending on physical and digital infrastructure; amongst medical supplies, spending on innovative drugs/therapy is expected to be the top priorityAsia-Pacific 2022 Hospital Priorities Survey: Strategic Implications for Healthcare Providers
Multiple Chart
LEK
View slide
This slide includes two column charts. The first chart shows the contribution of the largest seven 'tech' stocks to the S&P 500. The second chart displays the contribution of the 'magnificent 7' stocks to S&P 500 return.
Competitive Landscape
Financial Services
The slide provides insights into the market concentration and impact of major tech stocks on the S&P 500, aiding in competitive landscape analysis.
equity, market concentration, tech stocks, S&P 500, market impact, analysis
false
Equity focus: Navigating market concentrationGuide to the Markets UK | Q2 2024
Multiple Chart
JP Morgan
View slide
A bar graph with a horizontal layout shows the percentage of investors' change in risk preference due to increased inflation. It includes a sidebar with notable changes in investing practices. The visual elements are detailed, utilizing contrasting colors to highlight changes over time.
Market Analysis and Trends
Financial Services
Illustrates a shift in investors' risk preferences in response to inflation, highlighting an increase in risk aversion and changes in investment practices. Can be used to discuss investment strategies and market behavior.
Investor Behavior, Risk Aversion, Inflation Impact, Investment Strategies, Market Trends, Risk Management, Cash Holdings, Asset Classes, Portfolio Management, Value Investing
false
Many investors have become more risk averse, holding more cash, pivoting toward value, and investing in traditionally stable or countercyclical sectorsBCG Investor Perspective Series: Pulse Check #21
Multiple Chart
BCG
1
...
Next
Load More
Hold On!
We are searching in our database
If nothing, comes up, please try different filters!
Create a FREE account to continue browsing
Receive Instant Access to 1,000+ slides from companies like McKinsey, Google, and Goldman Sachs
First Name
Last Name
Email
Password
I agree to all
Terms & Privacy Policy
Thank you! Your submission has been received!
Oops! Something went wrong while submitting the form.
Have an account?
Sign in
Column Chart
Heatmap
Chevron
Org Chart
Infographic
Callouts
Timeline
List
Graphic
Picture
Process Flow
Diagram
Paragraph
Map
Table
Framework
Subtitle
Takeaway Box
Icon
Other Chart
Radar Chart
Waterfall Chart
Mekko Chart
Pie Chart
Scatter Plot
Line Chart
Bar chart
Bullet points


![[Backup] Investable Ideas Assessment: Decarbonization opportunities prioritized based on assessment of attractiveness, technical feasibility, and commercial interest to date](https://cdn.prod.website-files.com/654e70fb59937215cac87b19/6899953e275395ca2ed1cc51_vZaDA2xgScL3S_uzIEobYgqSfN-ETPMrXtk5qsFc3lE.avif)