My Account
My Slides
Search by Category
Templates
View All Templates
Download Template Slides
Leave Feedback
Login
Logout
Get Started
Browse all Slides
Browse all Slides
Create a FREE Account
Instant access to 1,000+ real slides from top companies like McKinsey, BCG, Goldman Sachs, Google and many more!
First Name
Last Name
Email
Password
I agree to all
Terms & Privacy Policy
Thank you! Your submission has been received!
Oops! Something went wrong while submitting the form.
Have an account?
Sign in
Instant access to the internet's best slides
Get access to 40+ advanced filters and more
Advanced Search and Filters
Access to
10,000+ slides
Access to Category Pages
Save/Bookmark Slides
PowerPoint Template Library (New)
Choose your plan
MONTHLY
$12/month
Billed every month, cancel anytime.
YEARLY
$9/month
Billed $108 annually, cancel anytime.
Checkout for $12/month
Checkout for $108/yr
Secured by Stripe | AES-256 bit encryption
Spark Your Next Big Idea with New Presentation Templates
VIEW ALL Templates
Welcome,
Welcome
Upgrade to SlideStart
Pro
Instant access to 15,000+ slides
Show Featured Only
Checkbox 8
Companies
Mckinsey
Bain
BCG
EY
Deloitte
Accenture
PwC/Strategy&
JP Morgan
Goldman Sachs
Morgan Stanley
Citigroup
Deutsche Bank
Barclays
LEK
Kearney
Oliver Wyman
Booz Allen Hamilton
Gartner
IPSOS
Nielsen
Slide type
Header Horizontal
Framework
Vertical Flow
Single Chart
Single Chart
Text Only
Mixed Chart
Header Vertical
Graphic
Pillar
Multiple Chart
Agenda
Title
Table
Linear Flow
Upgrade to SlideStart
Pro
Instant access to 40+ advanced filters
Industry
Upgrade to SlideStart
Pro
Instant access to 40+ advanced filters
Technology
Healthcare
Financial Services
Consumer Goods
Energy & Utilities
Manufacturing
Retail
E-commerce
Logistics
Telecommunications
Real Estate
Professional Services
Education
Media
Entertainment
Hospitatlity
Tourism
Agriculture
Food Production
Government & Public Sector
Environmental
Sustainability
Use Case
Upgrade to SlideStart
Pro
Instant access to 40+ advanced filters
Sales and Business Development
Mergers and Acquisitions
Corporate Finance and Valuation
Performance Metrics and KPIs
Client Case Studies
Competitive Landscape
Product and Service Analysis
Customer and Market Segmentation
Organizational Structure
Human Resources and Talent Management
Industry Overview
Regulatory and Compliance
Risk Assessment and Management
Agriculture & Food Production
Hospitality and Tourism
Government
Environmental
Sustainability
Clear all
Thank you! Your submission has been received!
Oops! Something went wrong while submitting the form.
Show Featured Only
Checkbox 8
Companies
Mckinsey
Bain
BCG
EY
Deloitte
Accenture
PwC/Strategy&
JP Morgan
Goldman Sachs
Morgan Stanley
Citigroup
Deutsche Bank
Barclays
LEK
Kearney
Oliver Wyman
Booz Allen Hamilton
Gartner
IPSOS
Nielsen
Slide type
Text Only
Linear Flow
Vertical Flow
Single Chart
Header Horizontal
Mixed Chart
Header Vertical
Pillar
Multiple Chart
Graphic
Agenda
Title
Table
Framework
Industry
Technology
Healthcare
Financial Services
Consumer Goods
Energy & Utilities
Manufacturing
Retail
E-commerce
Logistics
Telecommunications
Real Estate
Professional Services
Education
Media
Entertainment
Hospitatlity
Tourism
Agriculture
Food Production
Government & Public Sector
Environmental
Sustainability
Use Case
Sales and Business Development
Mergers and Acquisitions
Corporate Finance and Valuation
Performance Metrics and KPIs
Client Case Studies
Competitive Landscape
Product and Service Analysis
Customer and Market Segmentation
Organizational Structure
Human Resources and Talent Management
Industry Overview
Regulatory and Compliance
Risk Assessment and Management
Agriculture & Food Production
Hospitality and Tourism
Government
Environmental
Sustainability
Clear all
Thank you! Your submission has been received!
Oops! Something went wrong while submitting the form.
Tag
View slide
Bar chart showing various savings goals among Canadians pre-COVID-19. Bars indicate the percentage of respondents with 'Yes', 'No', and 'Not applicable' responses for each savings goal. Dense text at the top explains the context.
Market Analysis and Trends
Financial Services
The slide presents data on the savings goals of Canadian investors before COVID-19, highlighting the percentage contributing to goals such as retirement, travel, and education. It notes gender differences and the high proportion of younger investors saving for these goals.
Savings, Goals, Canadians, Retirement, Travel, Education
false
Canadians’ Savings GoalsINVESTING AND THE COVID-19 PANDEMIC
Mixed Chart
IPSOS
View slide
The slide balances text with a set of illustrative icons. It is organized into four sections, each with headers and bullet points.
Financial Performance
Financial Services
The slide highlights the target for Return on Tangible Common Equity (ROTCE), and how various strategies contribute to achieving this financial goal.
ROTCE, target, financial goals, strategy, common equity, icons, JPMorgan
false
~17% ROTCE remains our target and may be achieved in 2022Firm Overview 2022
Table
JP Morgan
View slide
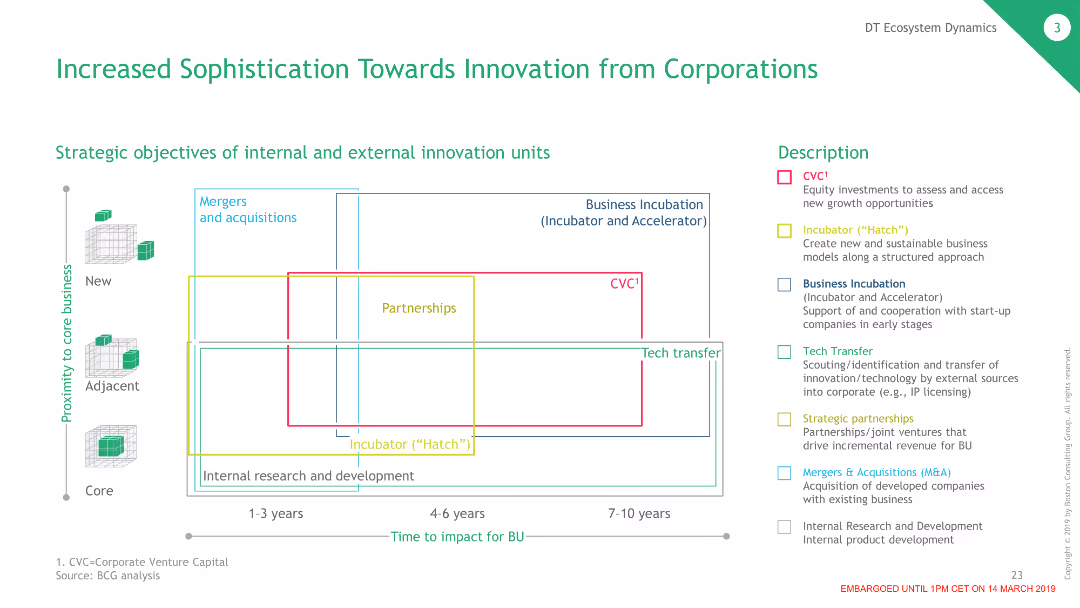
The slide contains a grid chart illustrating the strategic objectives of internal and external innovation units over different time frames and proximity to core business areas.
Strategic Planning
Technology & Software
This slide explains the strategic approaches corporations use for innovation, including mergers, partnerships, and incubators, highlighting their timelines and business impacts.
Innovation, Corporations, Strategy, Partnerships
false
Increased Sophistication Towards Innovation from CorporationsThe Dawn of the Deep Tech Ecosystem
Header Horizontal
BCG
View slide
Line graph showing historical US GDP changes, with blue shades indicating projected impacts under mild and extreme scenarios. A clear timeline from 1900 to 2020.
Market Analysis and Trends
Financial Services
Illustrates the potential impact of COVID-19 on the US economy by comparing historical GDP data and future projections.
GDP, COVID-19, impact, projections, economy, historical, US, scenarios
false
COVID-19 US impact could exceed anything since the end of WWIIResponding to COVID-19: Addressing the economic impact of the crisis
Single Chart
McKinsey
View slide
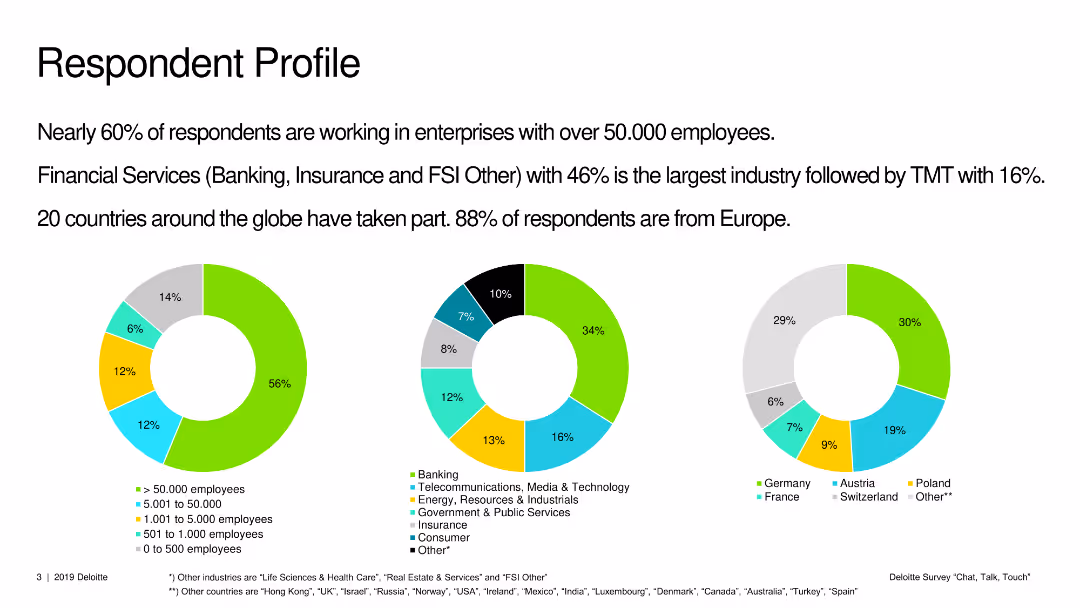
Three pie charts showing the profile of survey respondents by company size, industry, and geographic location.
Market Analysis and Trends
Professional Services
The slide outlines the demographic breakdown of survey respondents, detailing their company sizes, industries, and regions.
respondent profile, company size, industry, geography, survey, demographics
false
Respondent Profile Nearly 60% of respondents are working in enterprises with over 50.000 employees.Deloitte Survey | Chat, Talk, Touch… That’s how companies interact with their customers
Multiple Chart
Deloitte
View slide
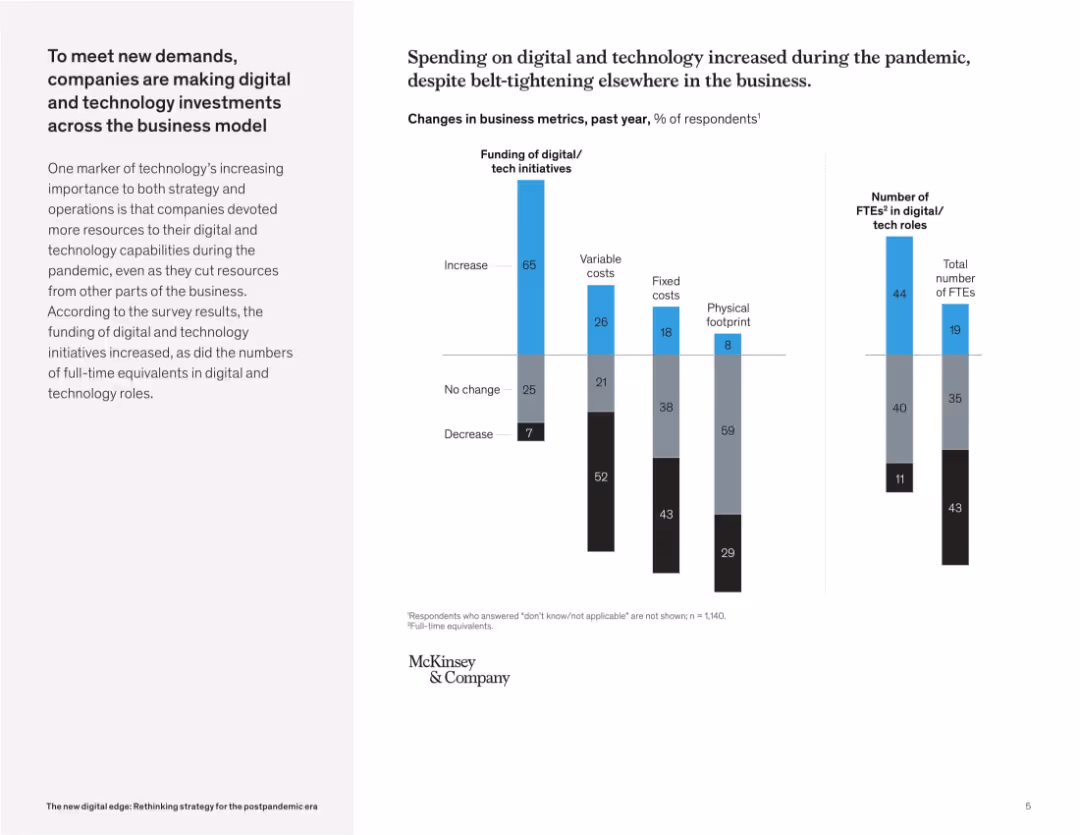
Dual-panel chart: left side shows business metric changes (funding, costs); right side compares FTEs in digital roles. Minimalist design with light grids.
Financial Performance
Technology & Software
The slide details how businesses increased spending on digital initiatives and staff during the pandemic, while cutting costs in other areas. It contrasts changes in funding and fixed/variable costs, and highlights growth in tech-related full-time roles.
tech spending, FTE growth, digital investment, pandemic response, financial allocation, cost restructuring, digital workforce
false
To meet new demands, companies are making digital and technology investments across the business modelThe new digital edge: Rethinking strategy for the postpandemic era
Mixed Chart
McKinsey
View slide
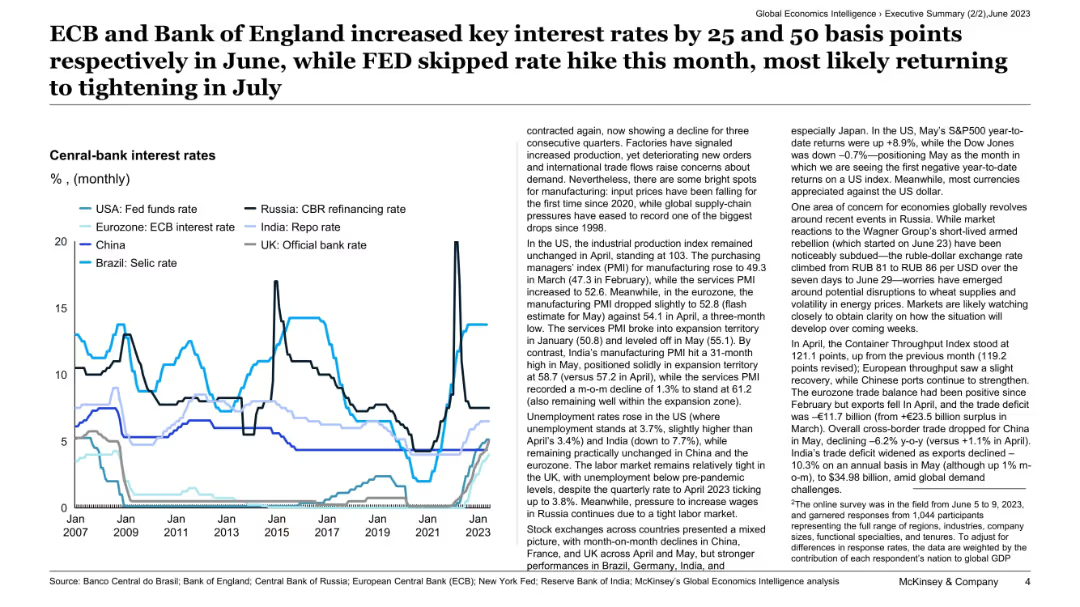
Line chart comparing central bank interest rates across major economies (USA, Eurozone, UK, India, etc.) over time, with text commentary.
Regulatory and Compliance
Financial Services
This slide outlines the recent interest rate decisions by central banks, highlighting increases by the ECB and Bank of England, while the Fed held steady. It provides context on manufacturing trends, unemployment, and global geopolitical factors affecting economic outlooks and exchange rate stability.
central banks, interest rates, ECB, Fed, monetary policy, inflation, regulation, macroeconomics, global risk, exchange rates
false
ECB and Bank of England increased key interest rates by 25 and 50 basis points respectively in June, while FED skipped rate hike this month, most likely returning to tightening in JulyGlobal Economics Intelligence June 2023
Mixed Chart
McKinsey
View slide
The slide features a bar chart with horizontal bars representing survey data on employer performance in various areas important to Millennials and Gen Z. It includes comparative data and a textual analysis on the left side.
Market Analysis and Trends
Professional Services
The slide provides insights into Millennials' and Gen Z's expectations from employers, emphasizing areas like diversity, community impact, and support during the pandemic. It compares employer performance across these areas, offering a clear view of what younger generations value in their workplaces.
Employer, Millennials, Gen Z, Expectations, Performance
false
Addressing what employees wantThe Deloitte Global Millennial Survey 2020
Multiple Chart
Deloitte
View slide
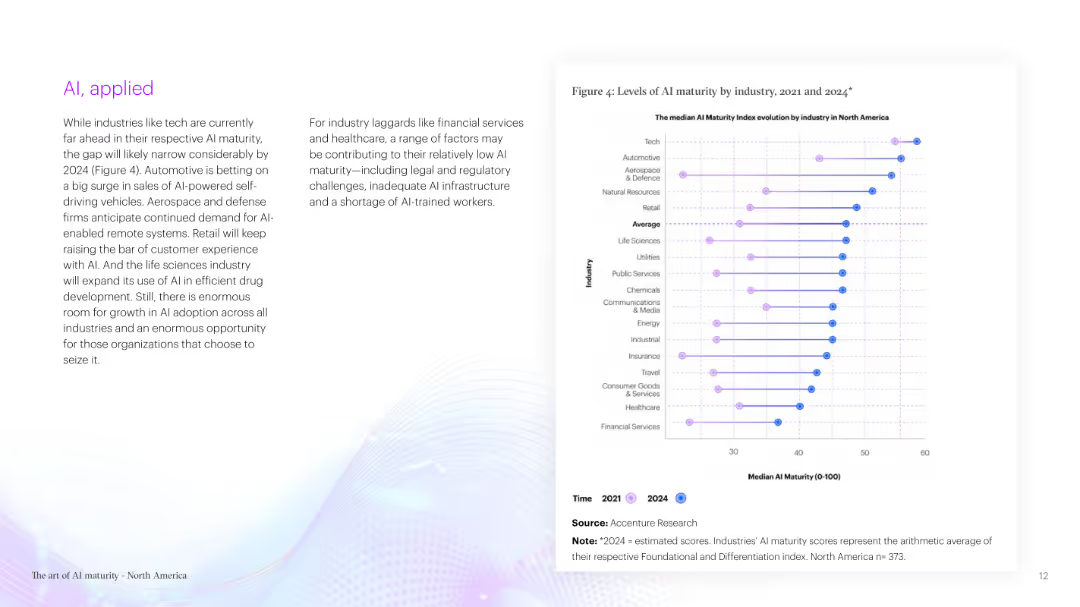
A two-column slide with text on the left and a column chart on the right. The column chart compares AI maturity levels across various industries from 2021 to 2024.
Technology and Digital Transformation
Technology & Software
The slide discusses AI maturity across industries, predicting a narrowing gap by 2024, with tech industries leading. It mentions the challenges faced by financial services and healthcare in adopting AI due to various factors.
AI, maturity, industries, technology, adoption, challenges, predictions, 2024, financial, healthcare
false
Figure 4: Levels of AI maturity by industry, 2021 and 2024*The art of AI maturity Advancing from practice to performance North America
Mixed Chart
Accenture
View slide
Line chart slide tracking the contribution of social media to company performance over time, with annotations for different time points.
Performance Metrics and KPIs
Professional Services
Highlights the consistent lack of growth in social media's impact on business performance, suggesting a reassessment of social media strategies.
social media, company performance, performance review, strategy reassessment, line graph
false
No improvement in social media contributions to company performanceThe CMO Survey Marketing in a Post Covid Era
Single Chart
Deloitte
View slide
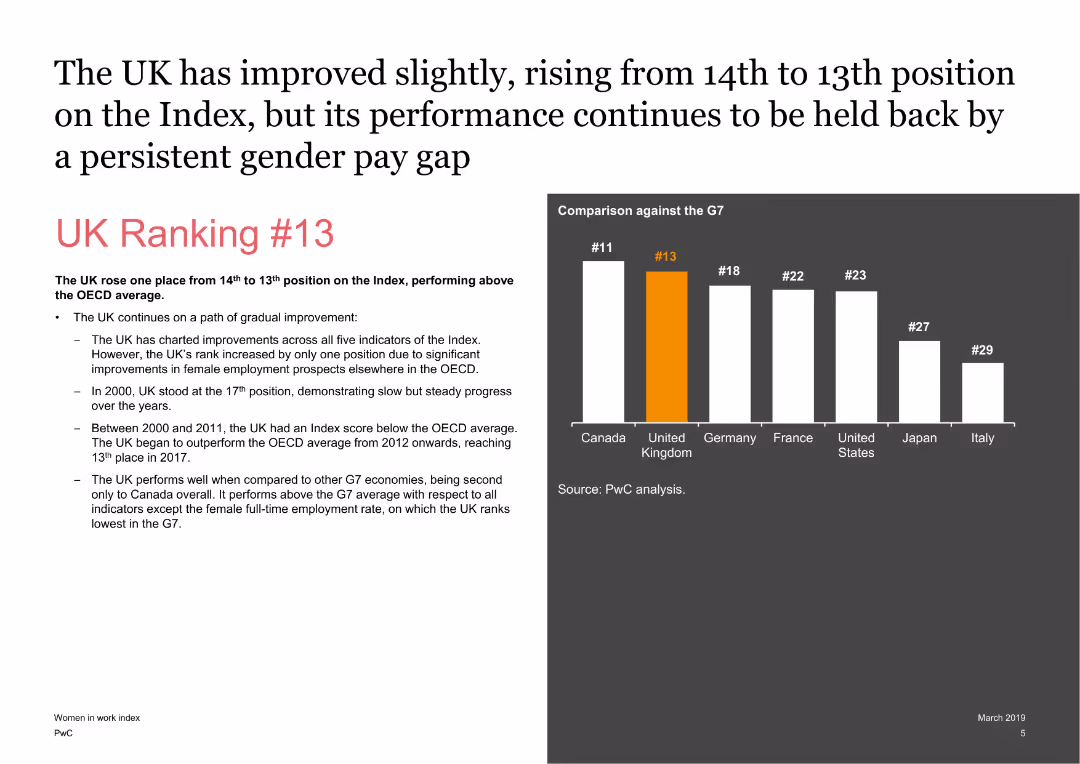
The slide features a mix of text and a column chart comparing the UK’s ranking with other G7 countries. The text highlights key points about the UK's position in the index and its performance over time.
Market Analysis and Trends
Financial Services
It discusses the UK’s improvement in the ranking on the Women in Work Index, highlighting the UK's performance compared to other G7 countries and factors influencing its ranking.
UK, Ranking, G7, Performance, Index, Analysis
false
The UK has improved slightly, rising from 14th to 13th position on the Index,Women in Work Index 2019
Mixed Chart
PwC/Strategy&
View slide
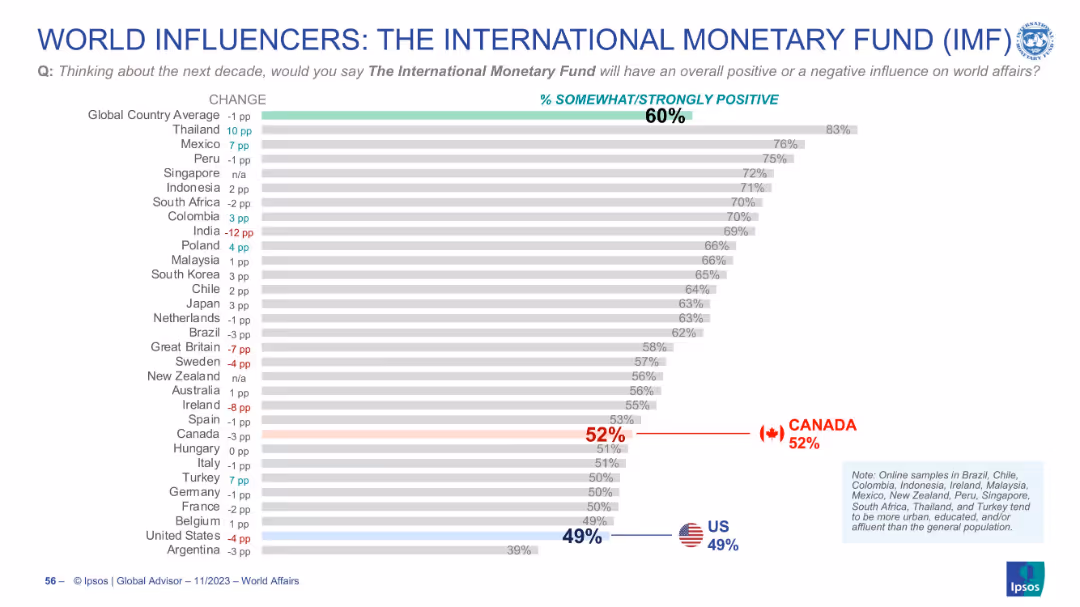
Horizontal bar chart with ranked countries, % values, and change indicators. Global and country averages shown. Flags highlight US and Canada positions.
Market Analysis and Trends
Financial Services
This slide presents global perceptions of the IMF’s influence over the next decade. The majority (60%) view the IMF positively, with strong support in Thailand and Mexico. US and Canadian views are lower than the global average.
IMF, global opinion, perception, influence, trends, country comparison, approval rating, international affairs
false
WORLD INFLUENCERS: THE INTERNATIONAL MONETARY FUND (IMF)WORLD AFFAIRS 2023
Single Chart
IPSOS
View slide
Left-aligned paragraph with survey chart in center and quote on the right. Yellow and grey theme, structured with chart legends.
Strategic Planning
Transportation & Logistics
Highlights the importance of cross-border business/trade and other factors in making Ireland a financial hub for aviation finance. Survey shows top priorities for fostering future growth in the sector.
aviation finance, Ireland, cross-border, trade, innovation, labor supply, policy
false
Aviation Finance: Cross-Border Networks can unlock Future GrowthBuilding a Better Financial Services Ireland: Accelerate to Elevate
Mixed Chart
EY
View slide
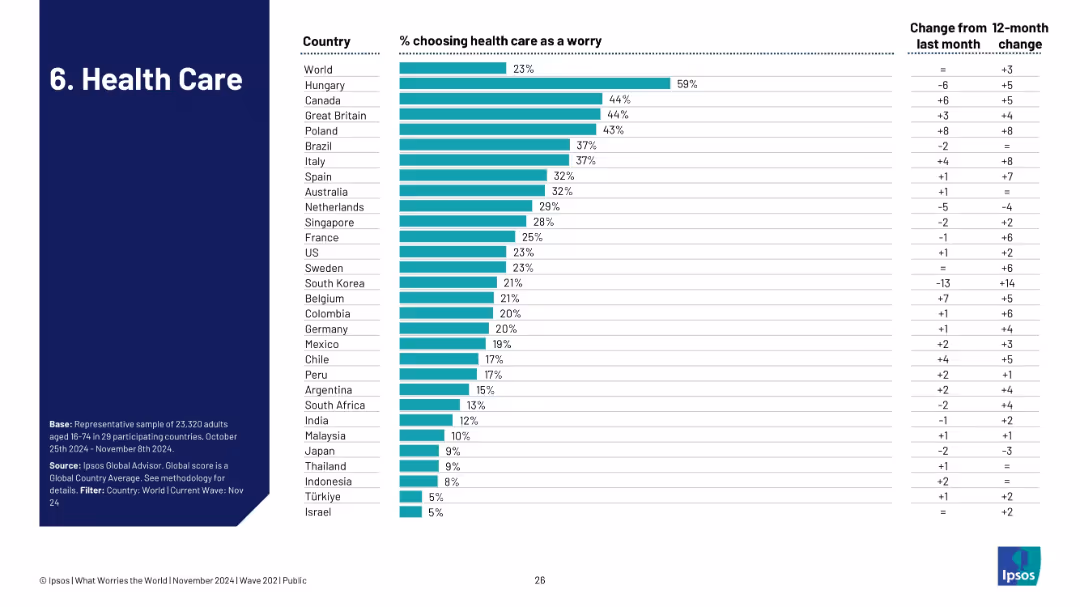
Bar chart of countries concerned with health care; includes monthly and yearly trend columns.
Strategic Planning
Healthcare & Pharmaceuticals
Shows public worry about healthcare systems, with Hungary (59%) and Canada/UK (44%) leading concerns. The data reflects both consistent and shifting national health concerns amid broader economic and societal issues.
healthcare, public opinion, system capacity, Ipsos, medical services, survey, societal concern, planning, accessibility
false
6. Health CareWhat Worries the World
Single Chart
IPSOS
View slide
Scatter plot showing income per customer for 2023 against growth rate from 2018-2023 for various European countries. Countries are plotted and color-coded for clarity.
Market Analysis and Trends
Financial Services
Discusses the relationship between income per customer and growth rates across European countries, indicating which countries are growing or shrinking.
income per customer, growth rate, Europe, scatter plot
false
Income per customer 2023 (€)Retail Banking Evolution in the Age of AI
Single Chart
Kearney
View slide
Features two graphs showing trends in consumer behavior changes towards online shopping and brand loyalty.
Customer and Market Segmentation
Retail & E-commerce
Discusses significant shifts in consumer and business purchasing behaviors, emphasizing increased online engagement and brand switching post-COVID-19.
Consumer Behavior, B2B, B2C, Online Shopping, Brand Loyalty
false
Metamorphosis of demand – B2B and B2CCovid 19: Briefing Materials
Multiple Chart
McKinsey
View slide
Features a column chart displaying growth over time, complemented by side panels with text and additional small images, creating a data-rich yet organized presentation.
Financial Performance
Financial Services
The slide demonstrates the financial growth of a company and its strategic investments. It would be effective in financial analysis presentations or shareholder meetings to display performance metrics.
Financial Growth, Investment, Performance, Success, Strategy
false
Our strong track record has laid the foundation for our continued successInverstors Day 2023
Mixed Chart
JP Morgan
View slide
The slide includes a bar chart comparing the percentage of respondents expressing various concerns about digital health adoption in 2021 versus 2022, such as patient privacy and solution incompatibility.
Risk Assessment and Management
Healthcare & Pharmaceuticals
The slide addresses the growing concerns regarding digital health adoption, highlighting issues like increased concerns about patient privacy, incompatibility between digital solutions, and the shortage of talent for developing and implementing these solutions.
Digital adoption, concerns, patient privacy, compatibility
false
With increasing digital adoption, concerns around patient privacy and incompatibility between digital solutions are growingAsia-Pacific 2022 Hospital Priorities Survey: Strategic Implications for Healthcare Providers
Single Chart
LEK
View slide
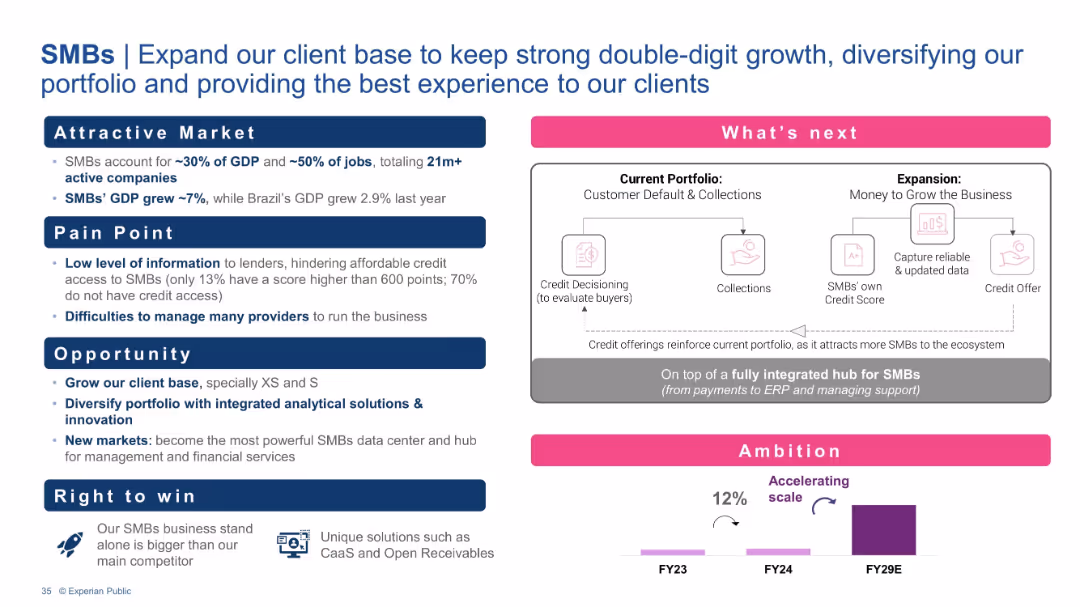
Pain-point/opportunity structure with market stats, a process diagram of Experian’s integrated hub, and an ambition chart.
Customer and Market Segmentation
Financial Services
This slide emphasizes the significance of SMBs in the economy and their challenges in accessing credit. Experian’s solution is a comprehensive data and financial hub, enabling expanded credit access and business growth, aiming for strong double-digit growth and market leadership.
SMBs, Credit access, Financial hub, Integrated solutions, GDP contribution, Data platform
false
SMBsBarclays Global Credit Bureau Forum
Mixed Chart
Barclays
View slide
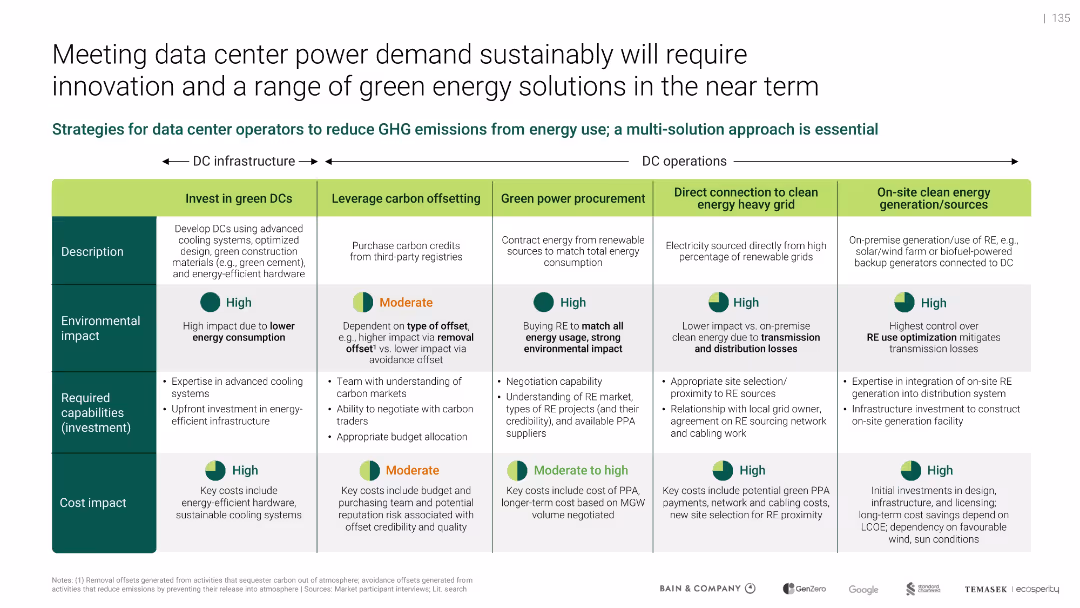
Matrix table format categorizing five decarbonization strategies; green-themed visuals
Operational Efficiency
Technology & Software
Proposes a multi-solution strategy for reducing emissions from data center energy use. Outlines five approaches including investing in green DCs, carbon offsetting, renewable procurement, grid connection, and on-site generation. Each is evaluated by environmental impact, required investment, and cost impact.
carbon offsetting, green power, infrastructure, emissions, PUE, RE sources, sustainability, DC operations
false
Meeting data center power demand sustainably will require innovation and a range of green energy solutions in the near termSoutheast Asia's Green Economy
Mixed Chart
Bain
View slide
Slide with a column chart comparing the percentage share of podcast ad revenue by ad type (announcer-read/pre-produced, host-read, etc.) from 2019 to 2021.
Operational Efficiency
Media & Entertainment
Evaluates the shift towards announcer-read ads in podcasts, reflecting on its efficiency in ad creation and deployment.
Podcast, Ads, Announcer-Read, Efficiency
false
Shift to announcer-read ads reflects its efficient ad creation and deployment functionalityU.S. Podcast Advertising Revenue Study
Single Chart
PwC/Strategy&
View slide
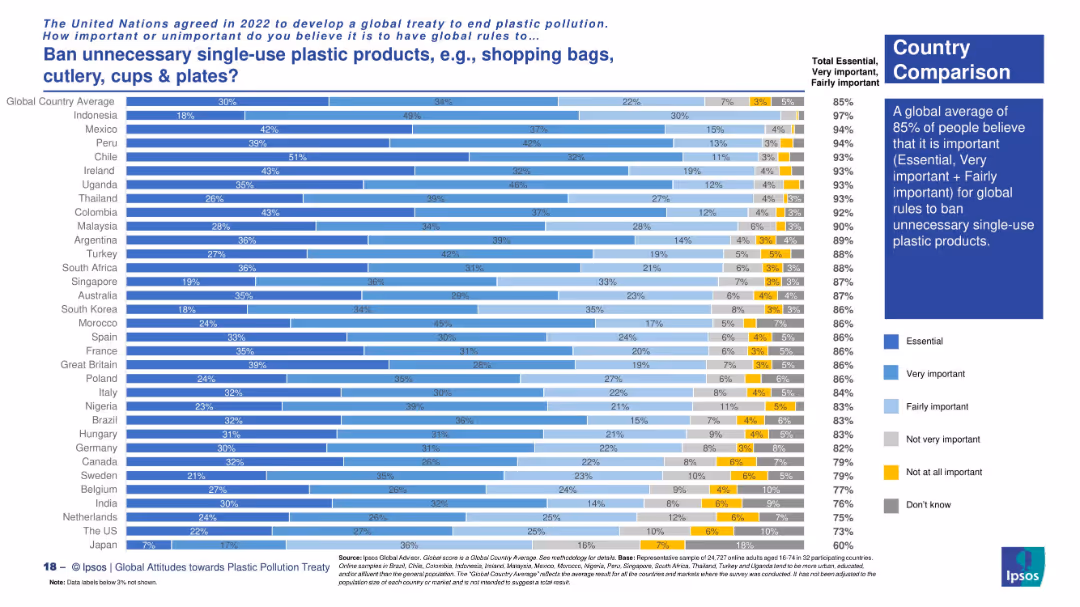
Vertical bar chart showing public opinion in different countries using five-color gradients to represent perceived importance. Includes summary statistics.
Regulatory and Compliance
Environmental Services & Sustainability
This slide highlights that a global average of 85% of people support banning unnecessary single-use plastic products. Latin American countries and Uganda show particularly high levels of support.
single-use plastics, environmental policy, global regulation, Ipsos data, public opinion, global treaty
false
Ban unnecessary single-use plastic products, e.g., shopping bags, cutlery, cups & plates?Attitudes towards a global plastic pollution treaty
Mixed Chart
IPSOS
View slide
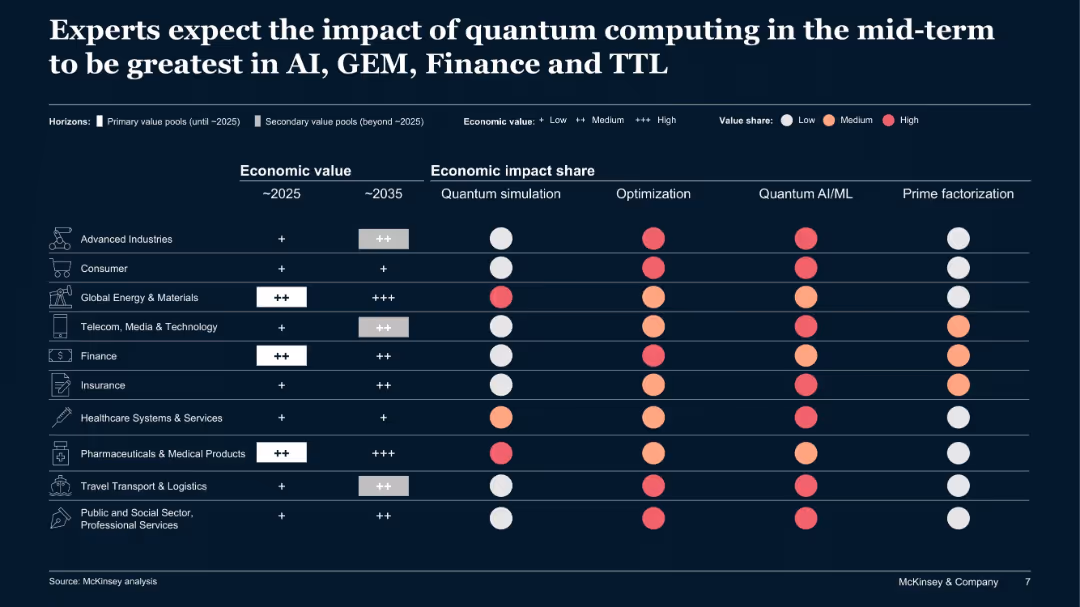
Heatmap and value impact table by sector and use case, covering economic value (2025/2035) and value share in four key quantum computing applications
Investment Analysis
Artificial Intelligence
The slide analyzes where quantum computing will create the most economic value across industries, highlighting AI/ML, optimization, and simulation. Finance, global energy, and technology sectors show significant near- and mid-term potential.
quantum impact, economic value, AI/ML, optimization, finance, mid-term outlook, industry impact
false
Experts expect the impact of quantum computing in the mid-term to be greatest in AI, GEM, Finance and TTLThe Quantum Technology Monitor December 2020
Table
McKinsey
View slide
Contains a central diagram surrounded by four quadrants depicting demand, supply, financing, and responsibility, all linking back to technology's central role in mineral criticality.
Strategic Planning
Environmental Services & Sustainability
Outlines the impact of technology on mineral criticality, emphasizing political, technological, and financial interactions. Useful for discussions on sustainable resource management.
mineral criticality, technology, sustainability, supply and demand, diagram, strategic planning, environmental impact
false
Technology’s role in mineral criticalityTechnology’s role in mineral criticality
Diagram
McKinsey
View slide
The slide features two line charts comparing S&P 500 and U.S. 10-year returns around the end of various Fed hiking cycles, indexed to zero at the last hike.
Investment Analysis
Financial Services
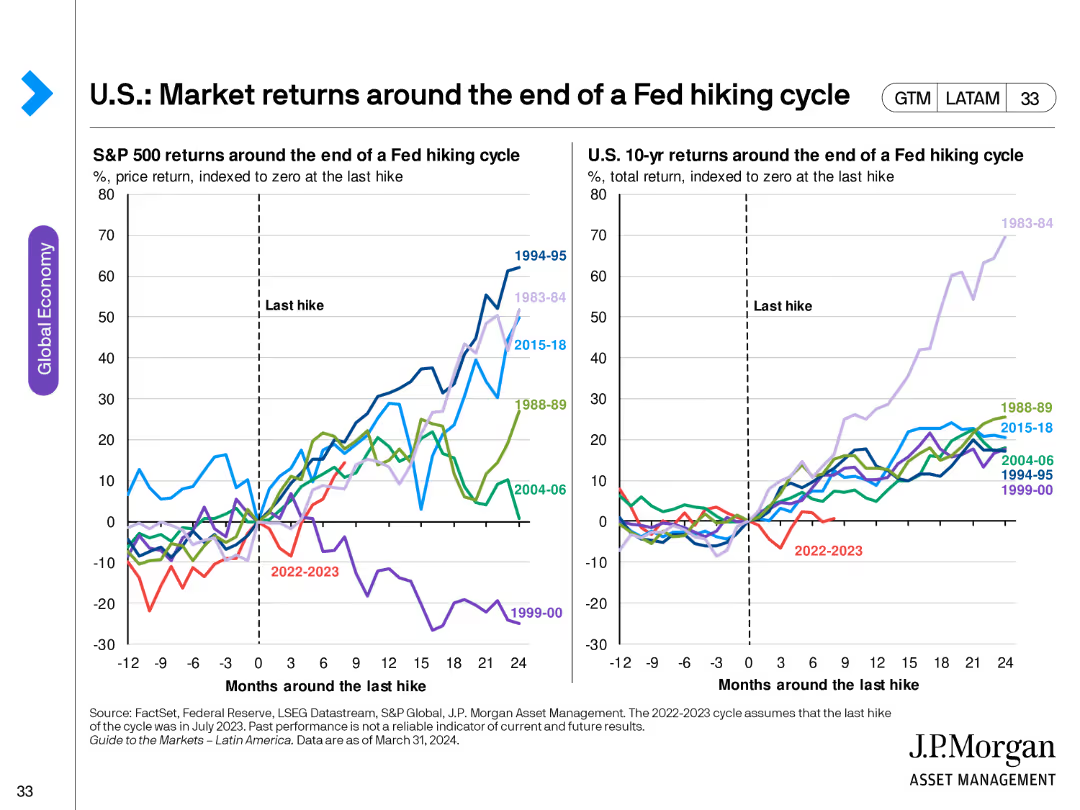
This slide analyzes market returns around the end of Fed hiking cycles, comparing historical S&P 500 and 10-year treasury returns to provide investment insights.
Fed hiking cycle, market returns, S&P 500, 10-year returns, investment analysis, historical trends
false
U.S.: Market returns around the end of a Fed hiking cycleGuide to the Markets Latin America | 2Q 2024
Multiple Chart
JP Morgan
View slide
Similar to the previous slide, this one also has multiple column charts but focuses on year-to-date (YTD) performance for the same metrics.
Market Analysis and Trends
Financial Services
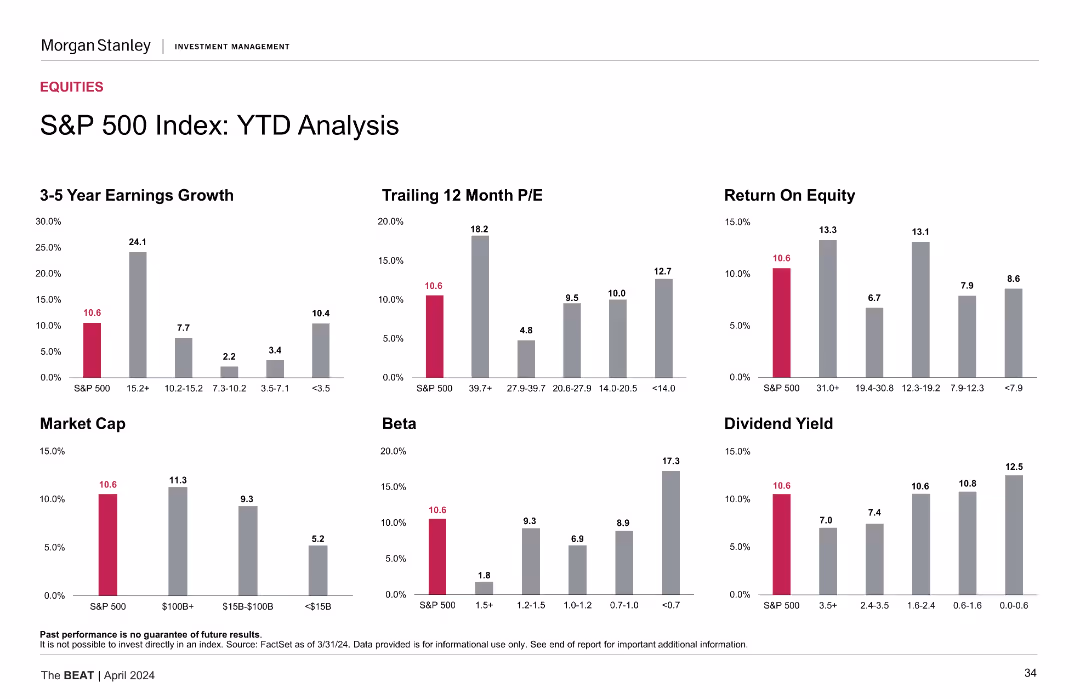
The slide provides a year-to-date performance analysis of the S&P 500 index, including earnings growth, P/E ratios, ROE, market cap, beta, and dividend yield metrics.
YTD analysis, financial metrics, S&P 500, performance
false
S&P 500 Index: YTD Analysis 3-5 Year Earnings Growth Trailing 12 Month P/E Return On EquityThe BEAT April 2024
Multiple Chart
Morgan Stanley
View slide
Simple layout with a single column chart illustrating consumer responses to purchasing second-hand luxury items.
Market Analysis and Trends
Retail & E-commerce
Focuses on the reasons driving consumer interest in second-hand luxury products, including perceived value and exclusivity.
Second-hand luxury, consumer behavior, purchasing reasons, perceived value, exclusivity, market insights, consumer trends
false
Most True-Luxury consumers interested in purchasing luxury 2nd-hand products2019 True-Luxury Global Consumer I nsight
Mixed Chart
BCG
View slide
Stacked bar chart showing M&As by industrial sector for several Latin American countries in 2023, with a breakdown of sectors per country and total transactions.
Market Analysis and Trends
Financial Services
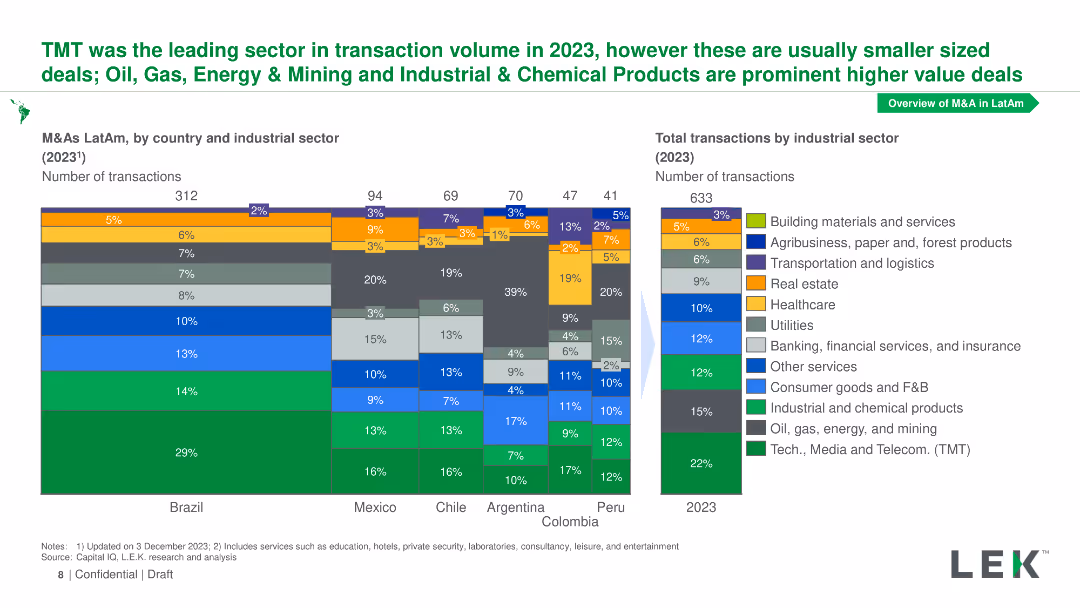
Shows M&A transaction volumes by industrial sector for Brazil, Mexico, Chile, Argentina, Peru, and Colombia, highlighting TMT as the leading sector in 2023.
M&As, industrial sector, Latin America, TMT, transaction volumes
false
TMT was the leading sector in transaction volume in 2023, however these are usually smaller sized deals; Oil, Gas, Energy & Mining and Industrial & Chemical Products are prominent higher value dealsMergers and Acquisitions in LatAm: Evolution and prospects
Multiple Chart
LEK
View slide
Features a title at the top, two bar graphs in the center comparing consumer habits, and a quote on the right side.
Market Analysis and Trends
Retail & E-commerce
Highlights increasing consumer preference for local products and brands during the pandemic, backed by quantitative data and a personal quote.
consumer trends, local brands, shopping habits, data analysis, pandemic impact, testimonial
false
Demand for local goods—and local brands—is growingHow is COVID-19 changing the retail consumer?
Multiple Chart
Accenture
View slide
The slide features a pie chart, a donut chart, a column chart, and several text boxes. The visual complexity is moderate, with a focus on data presentation and infographic elements.
Strategic Planning
Real Estate & Construction
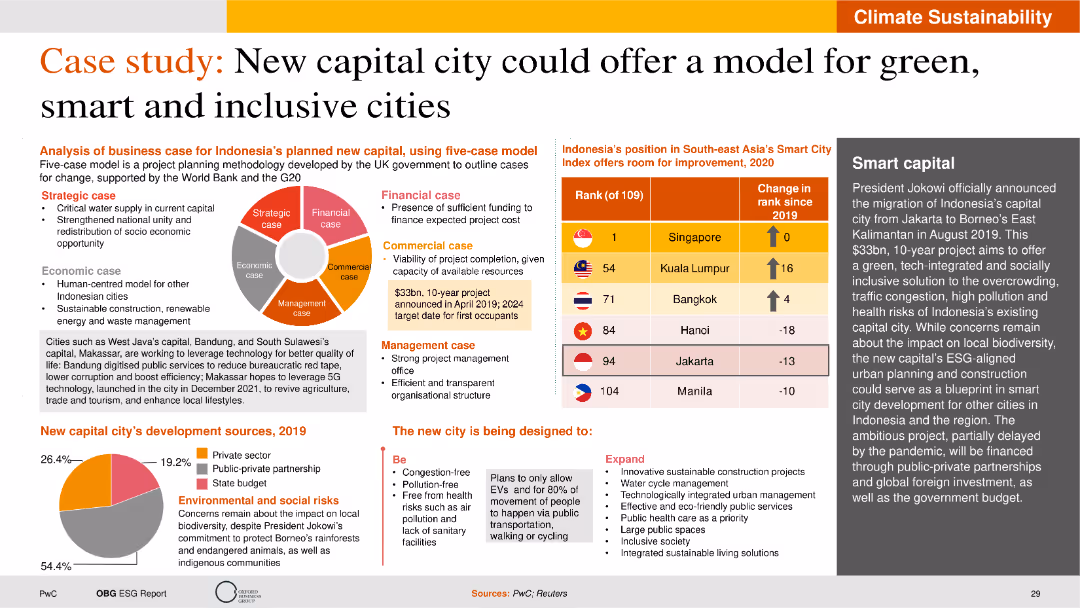
This slide analyzes the business case for Indonesia’s new capital, considering strategic, financial, commercial, economic, and management aspects. It includes data on development sources.
capital city, green cities, strategic planning, business case, Indonesia
false
Case study: New capital city could offer a model for green, smart and inclusive citiesIndonesia’s Sustainable Transformation
Mixed Chart
PwC/Strategy&
View slide
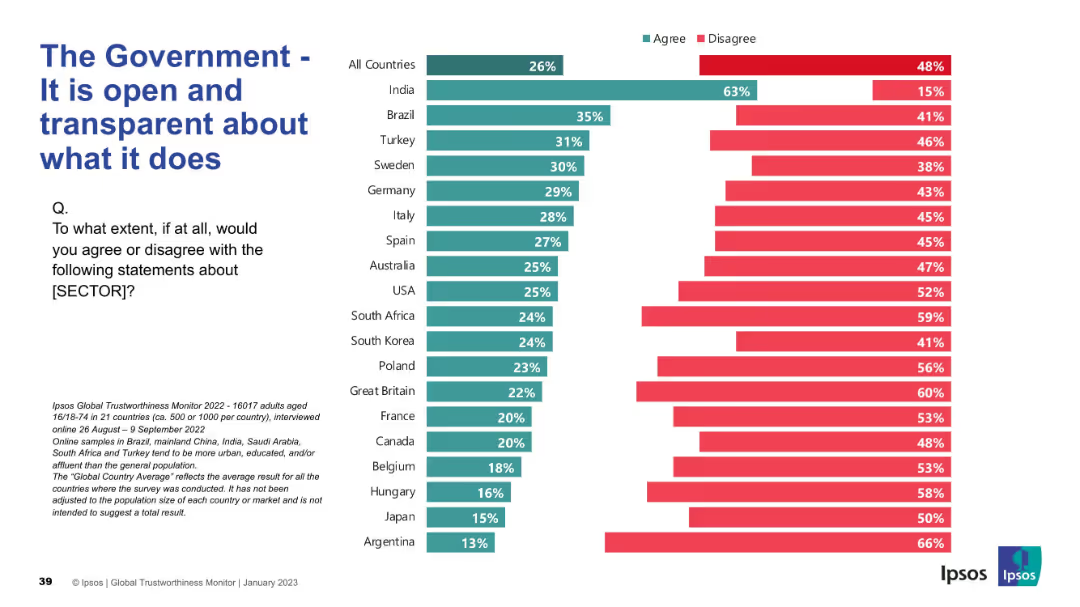
Split bar chart by country with green (agree) and red (disagree) proportions
Regulatory and Compliance
Government & Public Sector
The slide illustrates public sentiment about government transparency. While India leads in agreement, a majority of countries report high disagreement percentages.
transparency, governance, openness, public trust, compliance, Ipsos, survey, global responses
false
The Government - It is open and transparent about what it doesIPSOS GLOBAL TRUSTWORTHINESS MONITOR January 2023
Mixed Chart
IPSOS
View slide
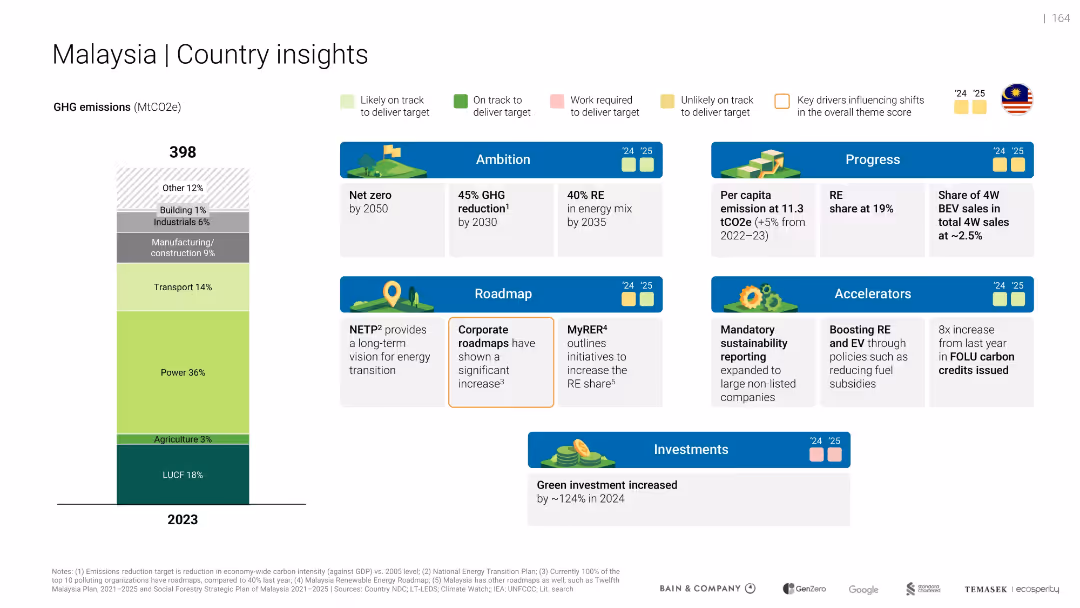
Similar layout to 15765 with GHG emissions chart and thematic insight boxes
Strategic Planning
Environmental Services & Sustainability
Malaysia's GHG and green roadmap overview. Notes strong corporate roadmap progress, increased investment (+124%), and key targets like 45% GHG cut by 2030 and 40% RE share by 2035.
corporate roadmap, share
false
Malaysia | Country insightsSoutheast Asia's Green Economy
Mixed Chart
Bain
View slide
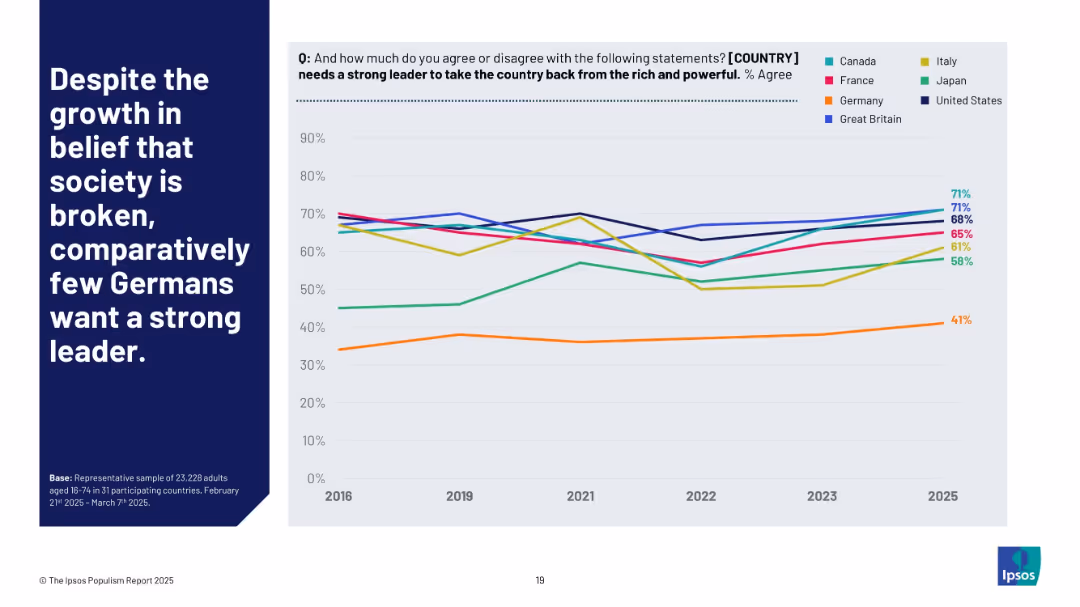
Line chart showing trends (2016–2025) of agreement with the need for a strong leader to counter elites, across selected countries. Germany is emphasized with a distinct low-trend line.
Strategic Planning
Government & Public Sector
This trend analysis reveals a disparity between perceived societal dysfunction and desire for authoritarian solutions. Germany, despite rising agreement with "society is broken," remains reluctant to support a strongman-style leader.
political sentiment, authoritarianism, Germany, Ipsos trend, society broken vs leadership, international comparison
false
Despite the growth in belief that society is broken, comparatively few Germans want a strong leader.THE IPSOS POPULISM REPORT 2025
Mixed Chart
IPSOS
View slide
A circular diagram in the center with icons around representing different stakeholders, text on left
Client Case Studies
Professional Services
Details the involvement of various stakeholders in EY, emphasizing internal and external communication
Stakeholders, engagement, EY, communication, plan
false
Stakeholders and their involvementEY Italia for the country system
Diagram
EY
View slide
This slide contains a column chart comparing types of crypto assets held in 2022 and 2023, with percentages and specific cryptocurrencies listed.
Market Analysis and Trends
Financial Services
It lists the cryptocurrencies and other assets held by Canadians, including Bitcoin and Ethereum, with changes in holding patterns between 2022 and 2023.
Crypto assets, 2023, 2022, holdings, Bitcoin, Ethereum, cryptocurrencies, holding patterns
false
Crypto Assets Currently Held Among the cryptocurrencies currently owned by Canadians, Bitcoin (BTC; 19%) and Ethereum (ETH; 14%) remained the most widely held; followed by Dogecoin (DOGE; 6%). Fewer owners reported owning Litecoin (LTC) than in 2022.CRYPTO ASSET SURVEY 2023
Multiple Chart
IPSOS
View slide
Icons and text blocks outlining key achievements and strategies for digital transformation and technology upgrades.
Technology and Digital Transformation
Technology & Software
Describes the initiatives and achievements in digital transformation at UBS, focusing on technology and culture.
Digital transformation, technology, agile, AI, automation, UBS, digital culture, client services
false
Leveling up technology to drive digitalization and differentiation for our clientsThird quarter 2022 Financial results
Pillar
UBS
View slide
Slide with bar graphs displaying digital payment market shares and a section describing penetration strategies of different payment platforms.
Competitive Landscape
Financial Services
This slide presents the competitive landscape of digital payment platforms in 2019, showing market shares and penetration strategies. It's useful for analyzing market dominance and strategic linkages in the payment sector, highlighting how major players are leveraging partnerships to enhance their market position.
Market Share, Digital Payments, Penetration Strategy, Competition, Strategic Alliances
false
The digital payment market is dominated by large players with strong connections to the wider ecosystem – leaving little room for newer players.Unlocking the next wave of digital growth: beyond metropolitan Indonesia
Mixed Chart
Kearney
View slide
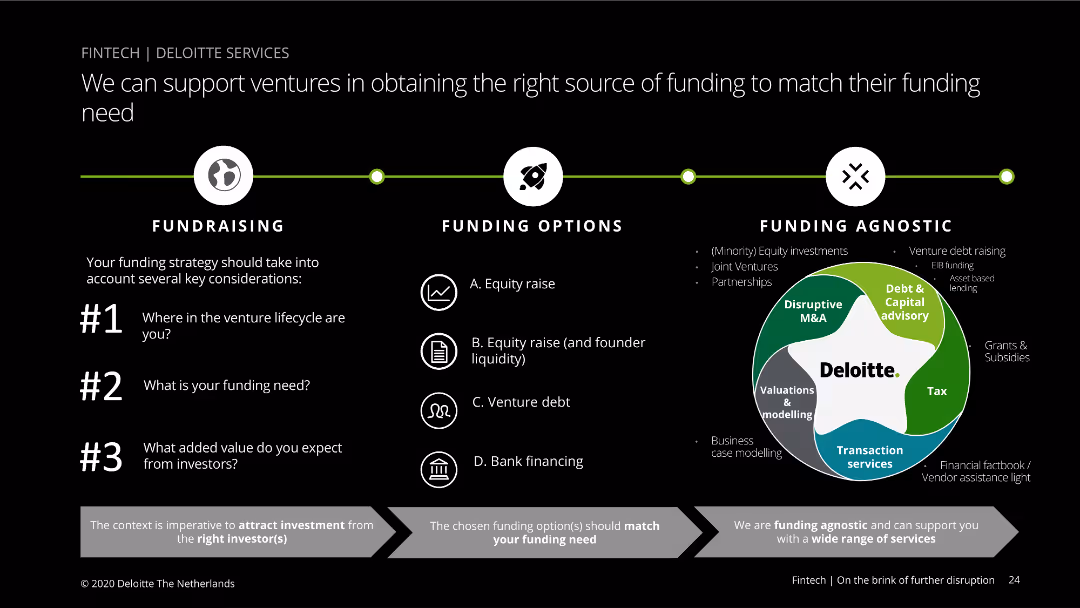
The slide features a diagram with three main funding categories: Fundraising, Funding Options, and Funding Agnostic. It includes bullet points and a circular diagram to explain different funding sources and strategies. Visual complexity is moderate.
Financial Performance
Financial Services
This slide explains the various funding options available for ventures, highlighting key considerations in the fundraising process and detailing different funding sources such as equity raise, venture debt, and bank financing.
Funding, ventures, options, equity, debt, bank, Deloitte
false
We can support ventures in obtaining the right source of funding to match their funding needFintech | On the brink of further disruption
Linear Flow
Deloitte
View slide
A map of Southeast Asia highlighting six countries with respective population figures, set against a simple backdrop. It's visually straightforward with a focus on the geographical distribution.
Market Analysis and Trends
Technology & Software
A geographic and demographic overview of Southeast Asia, indicating the total population across six key countries and their relevance to the digital economy of the region.
Southeast Asia, Population, Countries, Digital Economy, Geography, Demographics
false
e-Conomy SEA covers 6 countries in Southeast Asiae-Conomy SEA 2022 Through the waves, towards a sea of opportunity
Uncategorized
Bain
View slide
Features a flowchart diagram explaining consolidated sales calculation with side texts detailing the methodology, visual elements include grey column chart and red arrows for direction.
Market Analysis and Trends
Professional Services
This slide explains the methodology used for calculating player sales at retail value through various components like retail, wholesale, and licenses. Useful in understanding market analysis and sales reporting.
retail sales, methodology, market analysis, consolidation, retail value, sales, wholesale, licenses
false
METHODOLOGY OF THE STUDY • Revenues at retail value represent total sales valued at retail price.BAIN-ALTAGAMMA 2020 WORLDWIDE LUXURY MARKET MONITOR
Mixed Chart
Bain
View slide
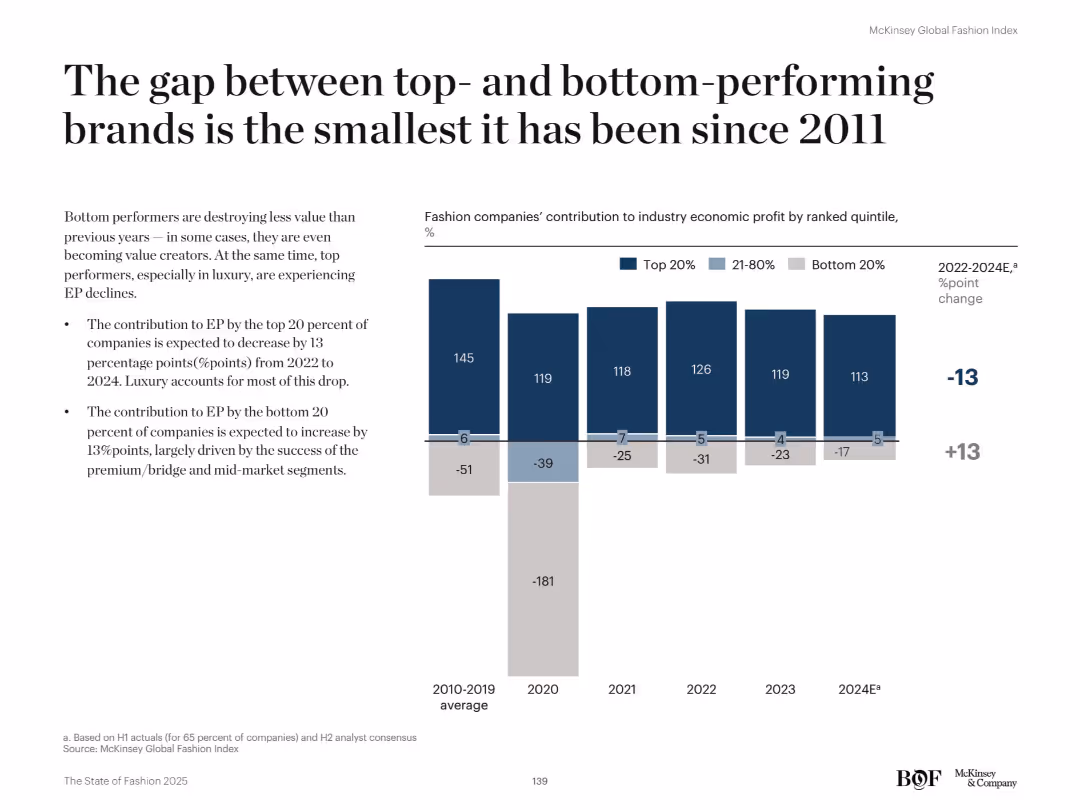
Left-aligned headline with bullet points beneath it; right side features a vertical stacked bar chart showing contribution to economic profit by company quintile from 2010 to 2024. Clear labels and dark-toned colors.
Performance Metrics and KPIs
Retail & E-commerce
The slide shows that the economic profit gap between top- and bottom-performing brands is narrowing. From 2022 to 2024, the bottom 20% of companies are expected to improve their EP contribution by 13 percentage points, while the top 20% drop by the same. Mid-market and premium segments are helping shrink the gap historically dominated by luxury.
economic profit, performance gap, quintiles, retail, premium, luxury, mid-market, EP contribution, fashion
false
The gap between top- and bottom-performing brands is the smallest it has been since 2011The State of Fashion 2025
Mixed Chart
McKinsey
View slide
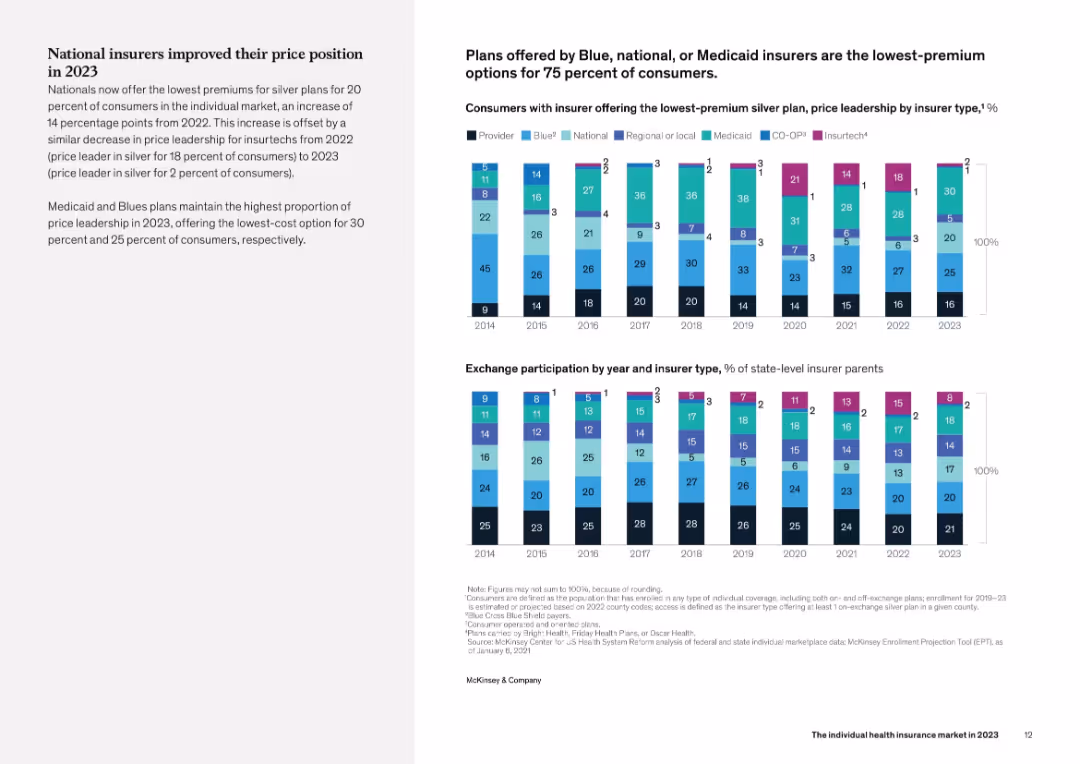
Left panel provides narrative analysis, while the right includes two bar charts: one showing insurer types with lowest silver plan premiums (2014–2023), the other showing exchange participation share by insurer type.
Pricing Strategies
Healthcare & Pharmaceuticals
The slide demonstrates that national insurers gained price competitiveness in 2023, offering the lowest-price silver plans for 20% of consumers. This was a 14-point increase from 2022. It contrasts with Insurtechs, whose share of price leadership declined sharply. Medicaid and Blues continue to lead in offering affordable silver plans to most consumers.
pricing, silver plan, national insurers, Medicaid, affordability
false
Plans offered by Blue, national, or Medicaid insurers are the lowest-premium options for 75 percent of consumersThe individual health insurance market in 2023
Mixed Chart
McKinsey
View slide
The slide presents multiple pie charts comparing the percentage of semiconductor-specific design R&D funding from public vs. private sources in different regions like the US, Europe, and China. Each chart uses two-tone color schemes for easy differentiation between public and private funding, with accompanying labels and percentages.
Market Analysis and Trends
Technology & Software
Analyzes the funding landscape for semiconductor design R&D, showing a higher reliance on private investment in the US compared to other OECD countries. This slide is pertinent for discussions on policy making, investment strategies, and public-private partnerships in technology and governmental sectors.
semiconductor, R&D funding, public investment, private sector, US, OECD
false
Share of semiconductor-specific design R&D funded by the private sector is greater in the US than other OECD peersThe Growing Challenge of Semiconductor Design Leadership
Multiple Chart
BCG
View slide
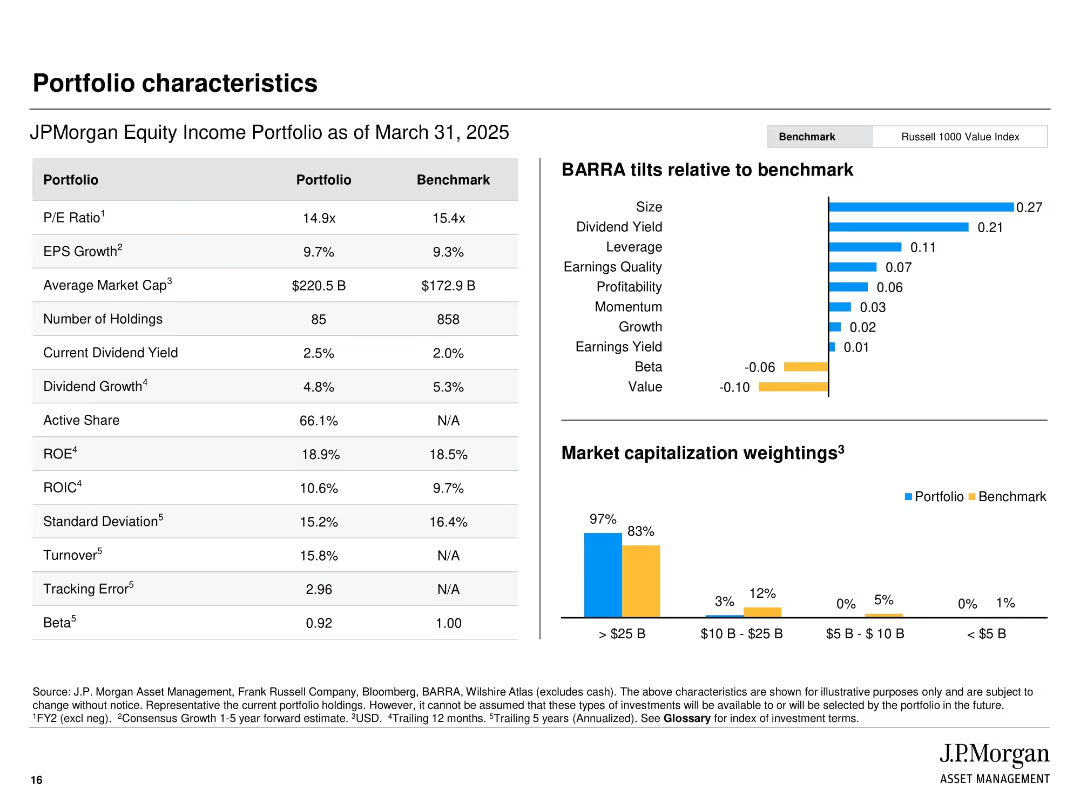
Side-by-side comparison table of portfolio vs benchmark; right section shows BARRA factor tilts and market cap breakdown.
Financial Performance
Financial Services
Compares JPMorgan’s Equity Income Portfolio with the Russell 1000 Value Index on metrics such as P/E, ROE, and dividend yield. BARRA tilts show factor exposures. A bar chart visualizes market cap breakdown, showing a bias toward large-cap holdings.
portfolio comparison, BARRA tilts, market cap, dividend yield, PE ratio, financial metrics, benchmark
false
Portfolio characteristicsJPMorgan Equity Income Strategy
Multiple Chart
JP Morgan
View slide
Contains a line chart showing the change in consumer sentiment about COVID-19 over time in the US and emerging markets. The layout is simple with clear labels and a contrasting color scheme for clarity.
Market Analysis and Trends
Healthcare & Pharmaceuticals
Discusses changes in consumer confidence in the US and emerging markets due to the COVID-19 Delta variant, using survey data to illustrate perceptions over time and expectations for economic recovery.
COVID-19, Delta Variant, Consumer Sentiment, Markets
false
Delta variant has caused a dip in consumer confidence in the US, while emerging markets remain resilient despite prolonged pandemicHow COVID-19 Changed the Consumer
Mixed Chart
BCG
View slide
Includes a column chart showing the percentage usage of AI tools by different types of risks.
Risk Assessment and Management
Technology & Software
Illustrates how AI tools are utilized across various risk types within organizations.
AI tools, risk types, usage, percentage
false
Usage of AI tools by risk typeAI/ML use in Risk Management and Compliance PwC Actuarial, Risk & Quants
Single Chart
PwC/Strategy&
View slide
Focuses on the educational aspect with photos and text, presenting moderate visual complexity.
Technology and Digital Transformation
Education & Training
The slide covers the Tempest programme's school outreach efforts to promote STEM careers, featuring specific programmes and their impacts.
STEM, outreach, Tempest, education, UK
false
The Tempest programme acts as a magnet in attracting young people into STEM careersAssessment of the expected economic impact of the Tempest Programme (2021-2050)
Boxed
PwC/Strategy&
View slide
This slide features bullet points summarizing recent sustainability achievements alongside a column chart of sustainable finance volumes. It is visually balanced between text and graphic elements.
Regulatory and Compliance
Environmental Services & Sustainability
Provides an overview of sustainability efforts and achievements, including financial volumes and strategic initiatives in sustainable practices.
sustainability, finance, corporate responsibility, environmental impact
false
Sustainability Q2 2023 highlightsClient & Creditor Overview August 2023
Mixed Chart
Deutsche Bank
View slide
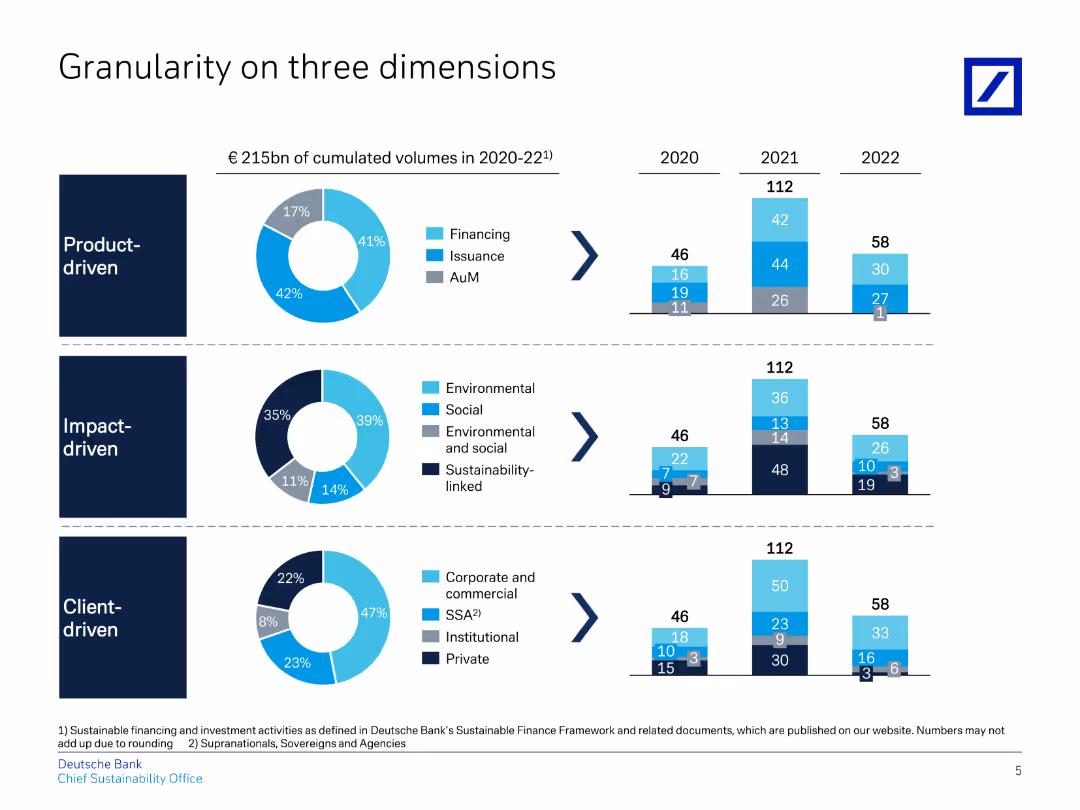
The slide includes three sections: product-driven, impact-driven, and client-driven, each with a pie chart and a column chart.
Market Analysis and Trends
Financial Services
Provides a detailed breakdown of cumulated volumes across different dimensions: product, impact, and client, with visual data.
granularity, product, impact, client, volumes
false
Granularity on three dimensionsHow we measure and drive success
Multiple Chart
Deutsche Bank
View slide
This slide includes two line charts: one showing business trading conditions with average and standard deviation lines, and the other showing construction activity.
Market Analysis and Trends
Financial Services
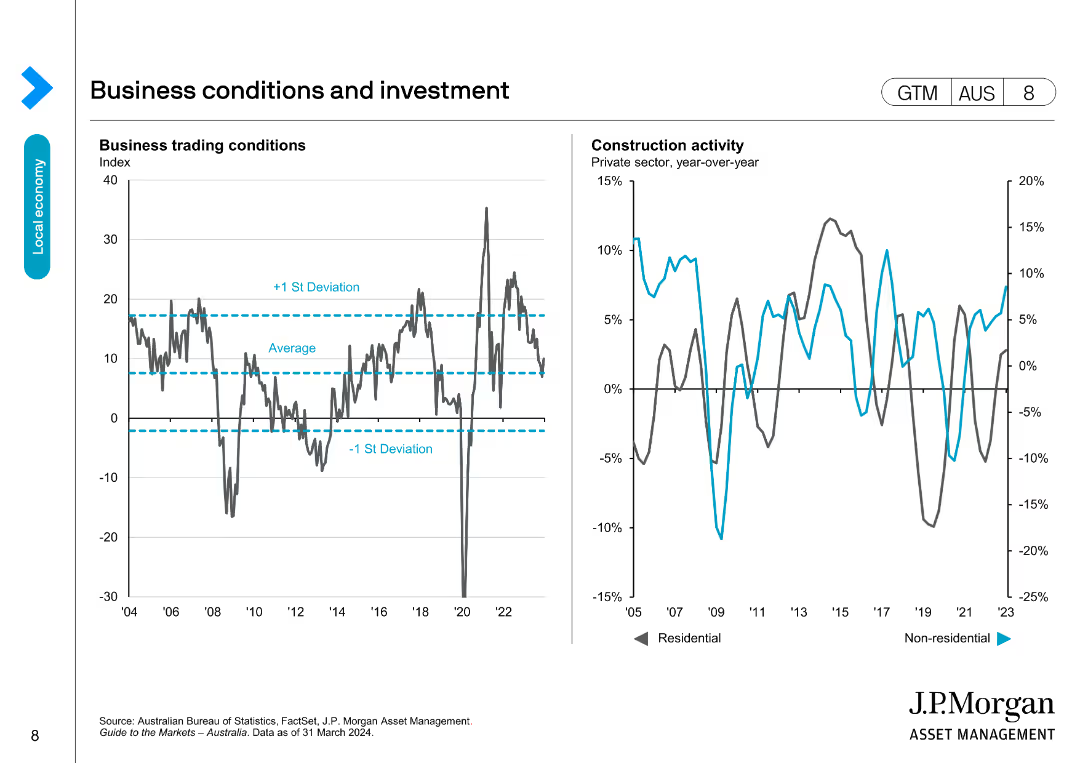
Analyzes business trading conditions and construction activity, comparing current performance to historical averages and deviations, useful for market analysis.
business conditions, investment, trading, construction, trends
false
Business conditions and investmentGuide to the Markets Australia | 2Q 2024
Multiple Chart
JP Morgan
View slide
Includes a bar chart comparing current and future human-machine working hours, and a pie chart showing reskilling needs of employees.
Operational Efficiency
Financial Services
Highlights the need for reskilling employees in the insurance industry due to shifts in labor between humans and machines, emphasizing digitization and automation impacts.
Reskilling needs, Human-machine working hours, Insurance industry, Digitization, Automation
false
According to World Economic Forum, 54% of employees are expected to need reskilling due to an anticipated shift in the division of labour between humans and machinesGlobal Employee Survey - Key findings and implications for ICMIF
Multiple Chart
EY
View slide
Split layout with vertical bar chart (2019 vs. 2023) on left and circular Venn diagram on right showing awareness vs. interest
Market Analysis and Trends
Media & Entertainment
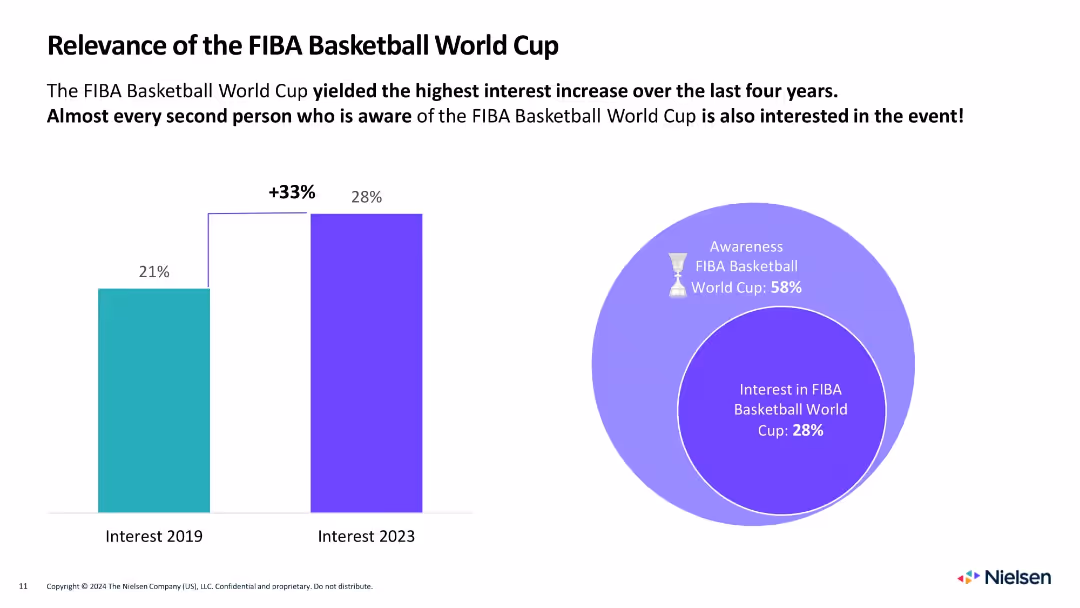
Demonstrates a 33% rise in interest in the FIBA World Cup from 2019 to 2023. Also shows that 28% of respondents are interested if aware (58% awareness rate).
FIBA, basketball, interest, awareness, growth, sports events, global reach, Venn diagram, comparison, fan engagement
false
Relevance of the FIBA Basketball World CupNielsen Fan Insights
Multiple Chart
Nielsen
View slide
Slide features two column charts with the title "External threats" at the top. The left chart compares three business threats: labor shortages, inflation, and competition. The right chart shows cyberattacks over the past 6 months: payments fraud, business email compromise, and malware.
Market Analysis and Trends
Technology & Software
This slide presents a comparative analysis of the most significant external business threats and cyberattacks, focusing on labor shortages and payment fraud as major concerns. It is likely used to inform stakeholders about prevailing risks and to prioritize mitigation strategies.
external threats, labor shortages, inflation, competition, cyberattacks, payment fraud, email compromise, malware
false
External threats2023 Midyear Business Leaders Outlook
Multiple Chart
JP Morgan
View slide
This slide features horizontal bar charts comparing percentages of agreement and disagreement on various social statements. A table highlights the highest and lowest agreement countries.
Market Analysis and Trends
Government & Public Sector
The slide discusses the belief in "live and let live" across different countries, illustrating tensions and divisions. It also shows where agreement is highest and lowest for these beliefs.
agreement, social beliefs, live and let live, tensions, divisions, countries, percentage, bar chart, highest, lowest
false
While most people believe in ‘live and let live’, it is clear that such an approach can create tensions and divisionsA NEW WORLD DISORDER?
Mixed Chart
IPSOS
View slide
Grid matrix showing percentages selecting improvement areas like end-to-end services, after-sales, and discounts. Light-blue color coding.
Customer and Market Segmentation
Technology & Software
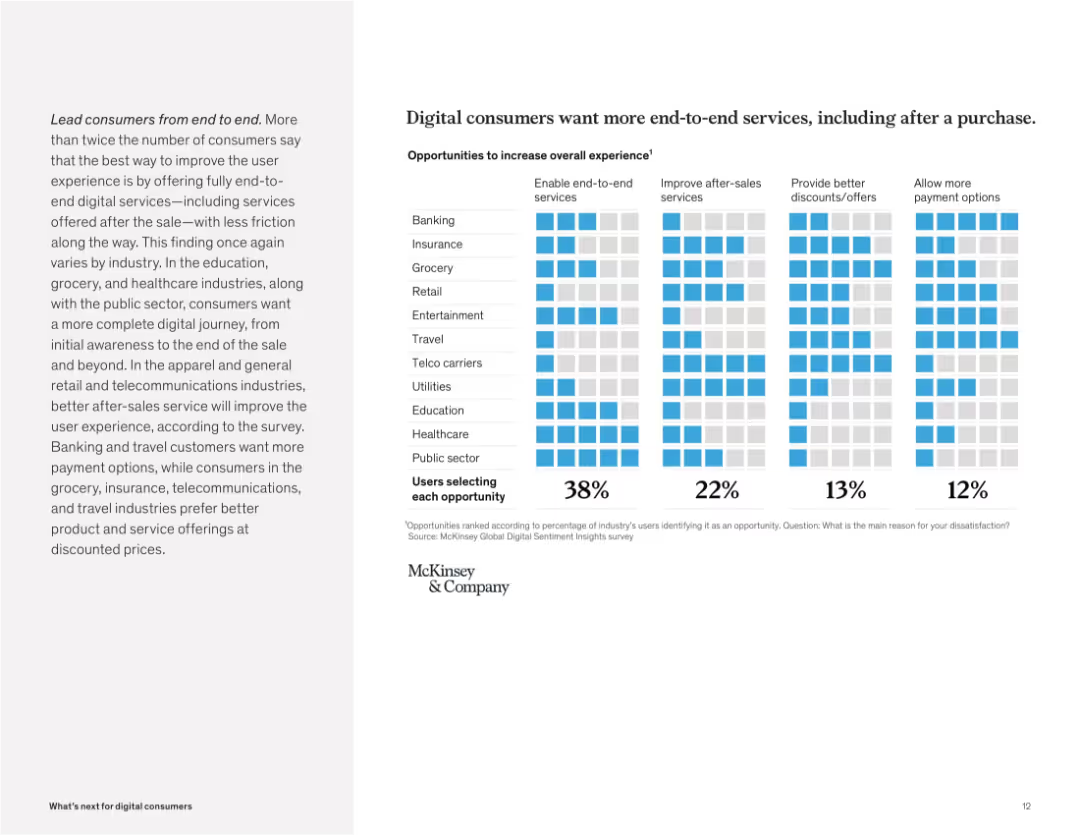
Consumers demand seamless digital journeys that cover post-purchase experiences. The top priority across most industries is enabling end-to-end services, followed by better after-sales support and payment options.
end-to-end, digital journey, post-purchase, after-sales, discounts, payment, consumer demand, frictionless
false
Digital consumers want more end-to-end services, including after a purchaseWhat’s next for digital consumers
Mixed Chart
McKinsey
View slide
Flowchart style layout with boxes and arrows, sections for parents, students, and grandparents.
Regulatory and Compliance
Education & Training
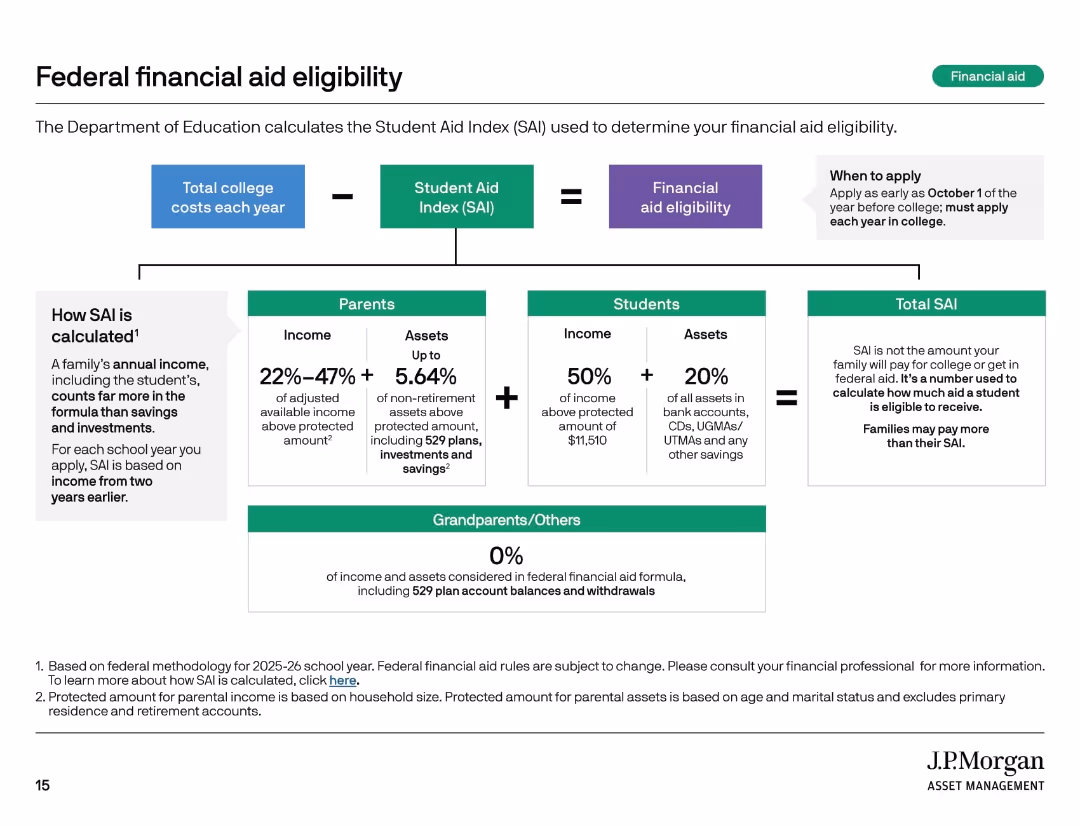
This slide explains how the Student Aid Index (SAI) is calculated and used to determine federal financial aid eligibility. It details income and asset contribution formulas for parents and students, while noting that grandparent contributions are excluded. It includes application timing guidance.
student aid, SAI, financial aid, college costs, FAFSA
false
Federal financial aid eligibilityCollege Planning Essentials A comprehensive guide to saving and investing
Diagram
JP Morgan
View slide
Slide features a pie chart showing the distribution of digital marketing budget among paid, owned, and earned media, set against a digital-themed background.
Market Analysis and Trends
Professional Services
Discusses allocation of marketing budget across different types of digital media, highlighting the dominance of paid media in digital marketing strategies.
digital marketing, paid media, budget allocation, marketing strategies, pie chart
false
Paid media tops marketers’ digital spend budgetThe CMO Survey Marketing in a Post Covid Era
Single Chart
Deloitte
View slide
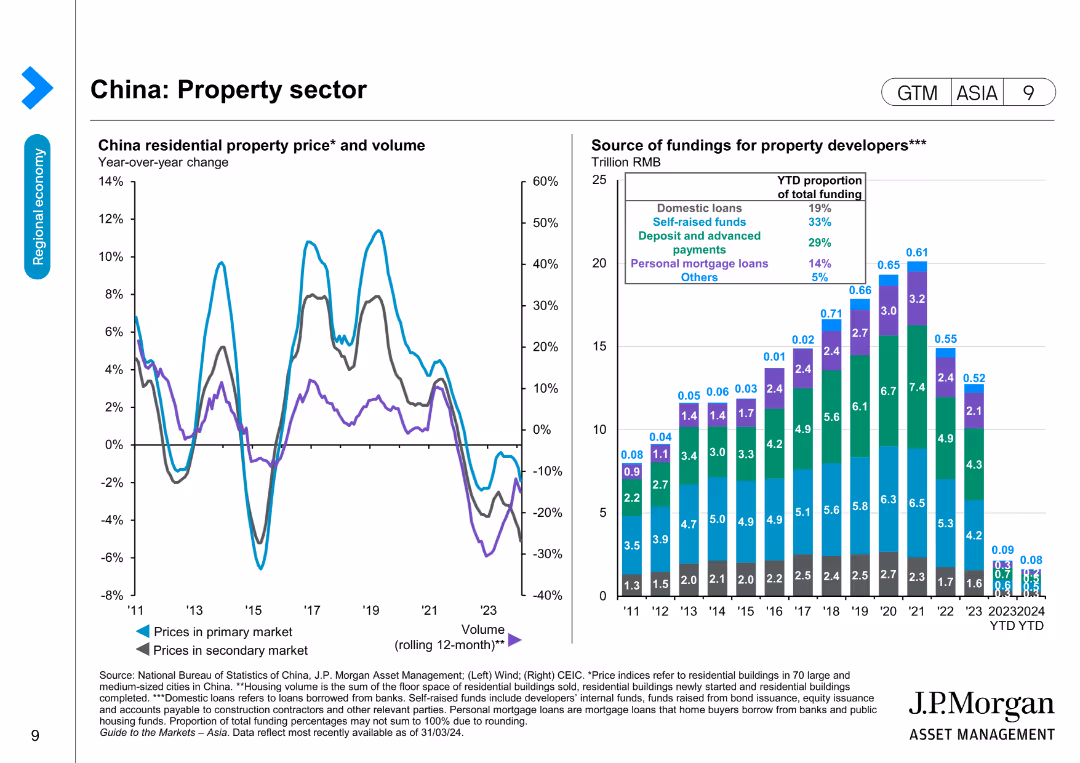
Features two line charts and a bar chart showing China residential property prices and volume, and the source of funding for property developers over time.
Market Analysis and Trends
Real Estate & Construction
Examines the property sector in China by tracking residential property prices and funding sources, useful for market and investment analysis in real estate.
Property sector, China, Real estate, Funding, Residential prices, Market trends, Investment, Economic data
false
China: Property sectorGuide to the Markets Asia | 2Q 2024
Multiple Chart
JP Morgan
View slide
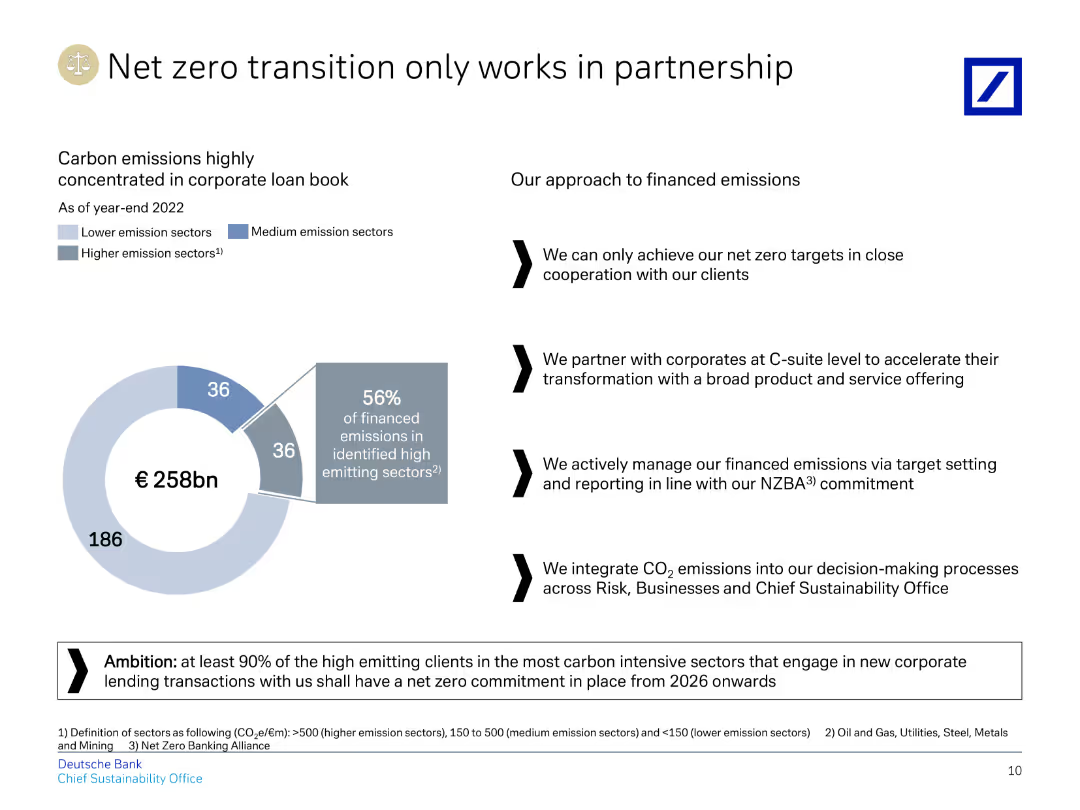
The slide features a pie chart illustrating the distribution of financed emissions in various sectors. It includes key points and percentages, with text explanations.
Regulatory and Compliance
Financial Services
The slide emphasizes Deutsche Bank's commitment to achieving net zero emissions through partnerships with clients. It highlights the distribution of emissions across sectors.
Net zero, emissions, partnership, finance, strategy, sustainability, CO2, targets, banking, environment
false
Net zero transition only works in partnershipStrategy outlook and ambition for 2025
Mixed Chart
Deutsche Bank
View slide
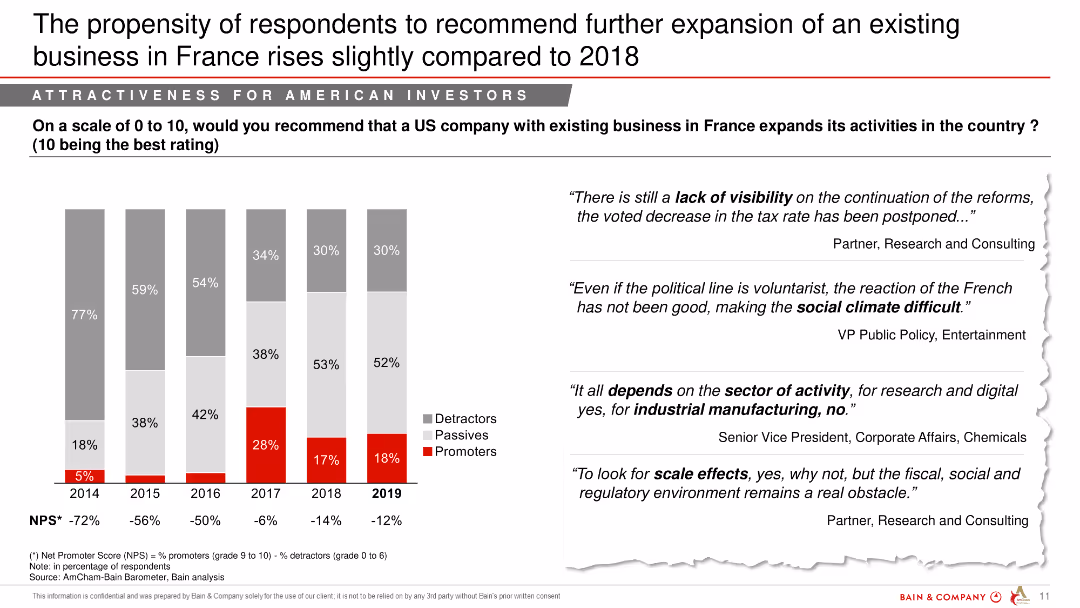
Column chart showing the Net Promoter Score (NPS) from 2014 to 2019, categorized into Detractors, Passives, and Promoters, with comments from respondents.
Market Analysis and Trends
Professional Services
The slide presents the NPS of American investors recommending further business expansion in France, highlighting a slight rise in recommendations from 2018.
NPS, expansion, business, France, investors, trend
false
The propensity of respondents to recommend further expansion of an existing business in France rises slightly compared to 2018AmCham – Bain Barometer 20th – Edition
Mixed Chart
Bain
View slide
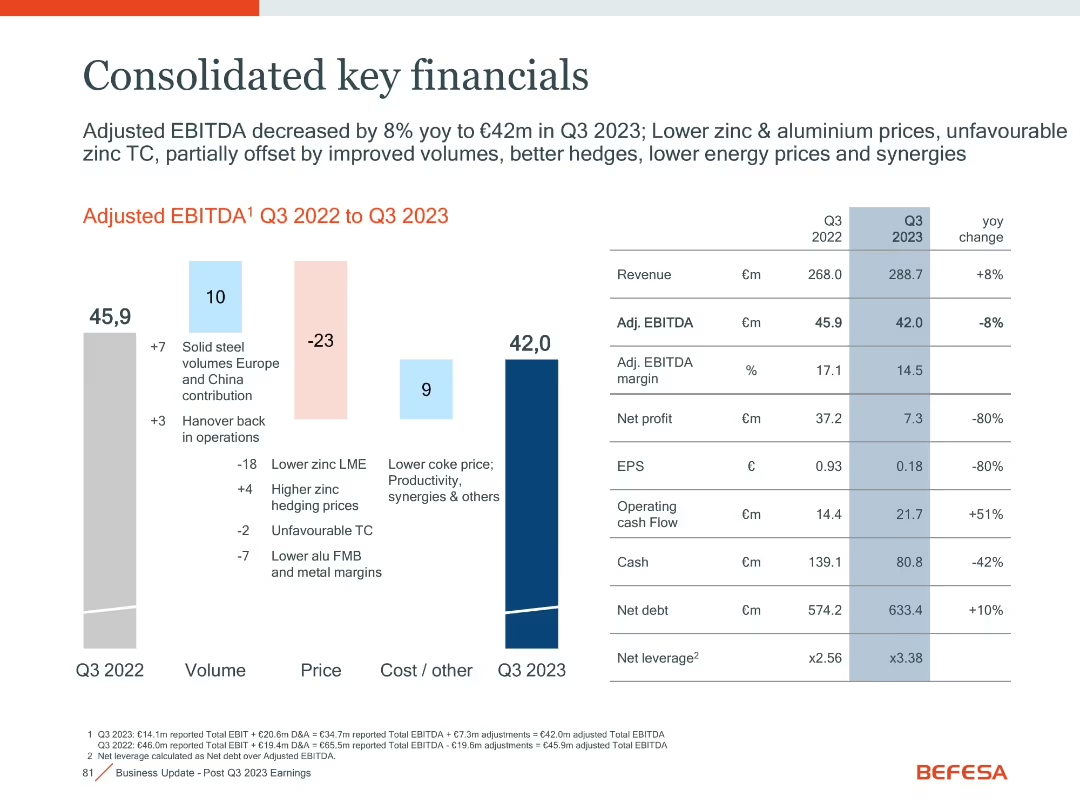
Waterfall chart on left; financial table on right
Financial Performance
Financial Services
This slide summarizes Befesa’s Q3 2023 financial performance, including revenue, EBITDA, cash flow, and profit metrics, with year-over-year comparisons.
EBITDA, Revenue, Cash Flow, Financials, Profit, Q3 2023
false
Consolidated key financialsGoldman Sachs 4th Annual Carbonomics Conference
Mixed Chart
Goldman Sachs
View slide
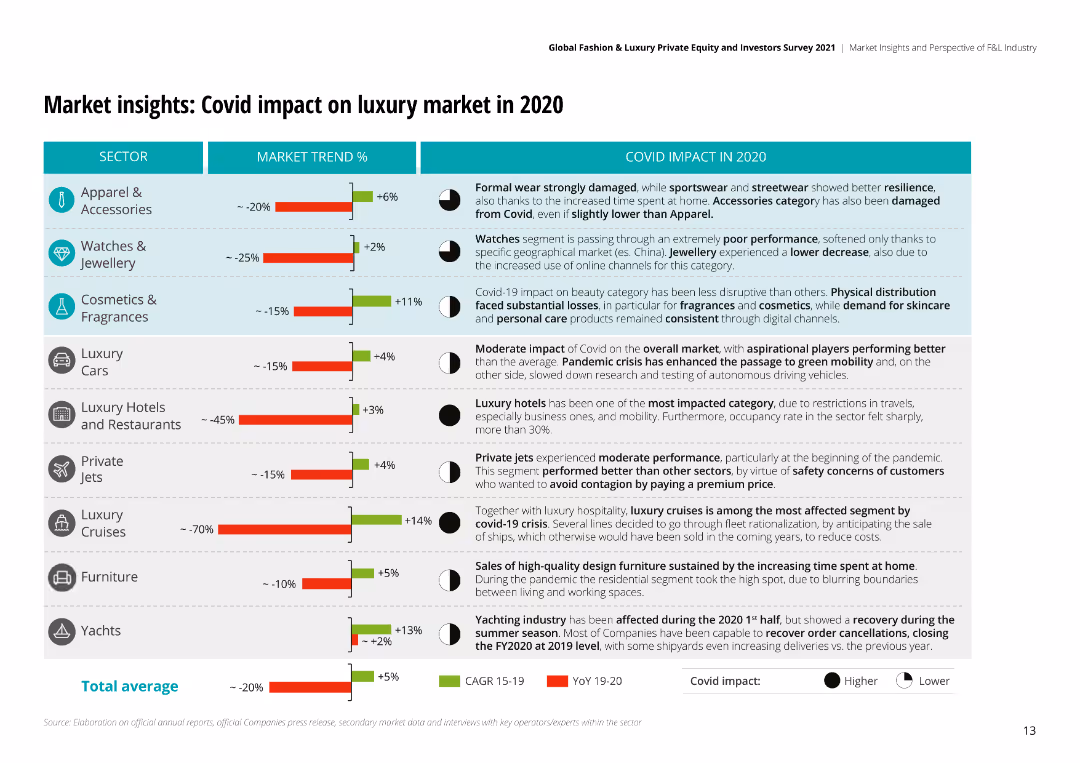
The slide uses a combination of bar charts and textual analysis to detail the impact of COVID-19 on different luxury sectors, including percentages of market trends.
Market Analysis and Trends
Retail & E-commerce
Analyzes the impact of COVID-19 on the luxury market, showing how various sectors like apparel, watches, and hotels were affected during the pandemic.
COVID-19, market impact, luxury, retail, e-commerce, apparel, watches, analysis
false
Market insights: Covid impact on luxury market in 2020Global Fashion & Luxury Private Equity and Investors Survey 2021
Mixed Chart
Deloitte
View slide
Visuals include silhouette icons representing different approaches to implementing food trends, with percentages beside each icon. The design is clean and easy to interpret.
Customer and Market Segmentation
Agriculture & Food Production
Discusses the strategic approaches companies are taking to implement future food trends, like partnerships and acquisitions. It highlights the importance of collaboration across the food ecosystem for effective transformation.
food trends, strategic approaches, partnerships, ecosystem
false
Companies prioritise sustainable food production and waste management.The Future of Food Challenges & opportunities
Mixed Chart
Deloitte
View slide
This slide features pie charts showing the distribution of research participants globally across different industries and job levels. The layout is straightforward, focusing on the data.
Market Analysis and Trends
Professional Services
This slide details the demographic and market analysis of global research participants, categorizing them by industry, job level, and organizational size. It provides a comprehensive view of the participant pool, aiding in understanding the global scope of the research and its relevance across different sectors and professional standings.
Research, Global, Demographics, Industry, Job Levels
false
Global research participantsDeloitte 2023 Global Human Capital Trends: New fundamentals for a boundaryless world
Multiple Chart
Deloitte
View slide
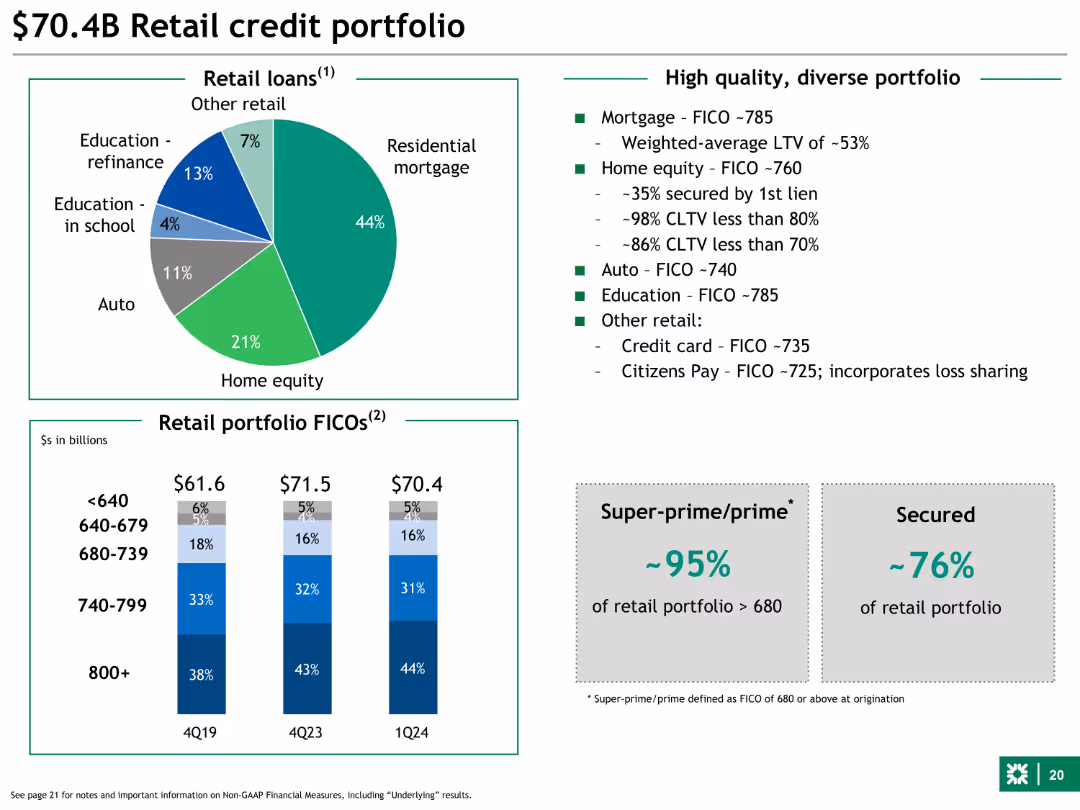
This slide features a pie chart and a column chart. The pie chart breaks down the retail loans by category, and the column chart shows the distribution of retail portfolio FICO scores across different time periods. The slide is moderately dense with detailed textual information.
Financial Performance
Financial Services
The slide provides a detailed breakdown of the retail credit portfolio, highlighting the composition of retail loans and FICO score distributions. It emphasizes the high-quality, diverse nature of the portfolio and mentions specific FICO scores for different loan categories.
Retail loans, FICO scores, mortgage, home equity, auto
false
$70.4B Retail credit portfolioBarclays Americas Select Franchise Conference
Multiple Chart
Barclays
View slide
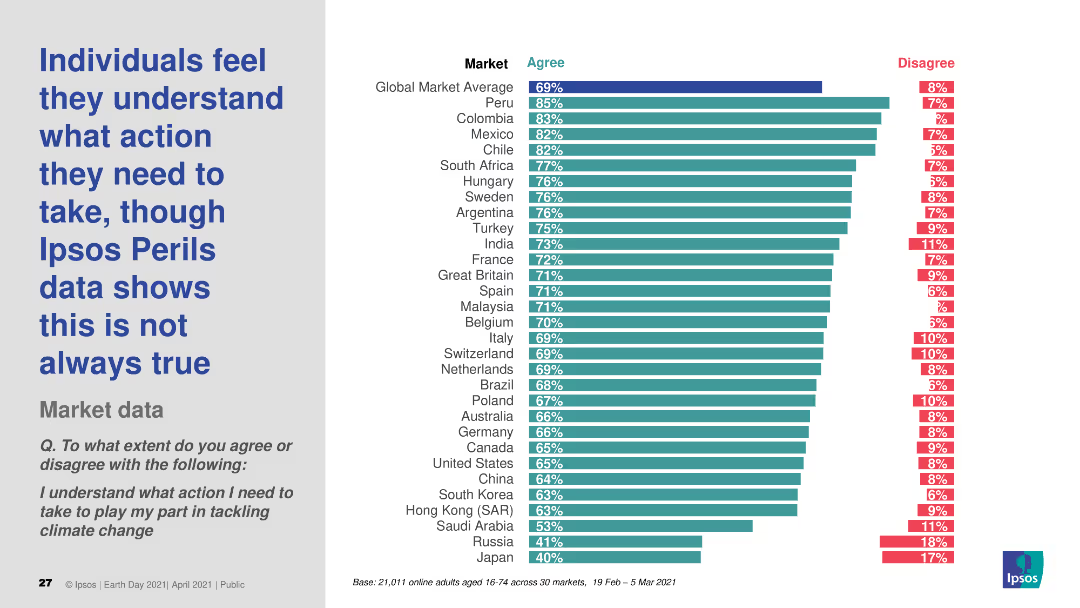
The slide presents a column chart showing the percentage of individuals who agree or disagree with the statement about understanding actions needed to tackle climate change. The chart has two colors for "Agree" and "Disagree."
Risk Assessment and Management
Environmental Services & Sustainability
The slide displays survey data on the perception of understanding actions required for tackling climate change, comparing agreement and disagreement across various global markets.
climate change, perception, understanding, survey, actions
false
Individuals feel they understand what action they need to take, though Ipsos Perils data shows this is not always trueEARTH DAY 2021 GLOBAL ADVISOR https://www.ipsos.com/en/earth-day-2021-globally-people-wonder-whats-plan-tackle-climate-change Public opinion and action on climate change
Multiple Chart
IPSOS
View slide
The slide includes a pie chart and column charts, with text describing the evolution of ESG awareness.
Regulatory and Compliance
Environmental Services & Sustainability
This slide discusses how organizations are evolving in their focus on ESG risks, with statistics and survey results.
ESG, risks, evolution, awareness, survey
false
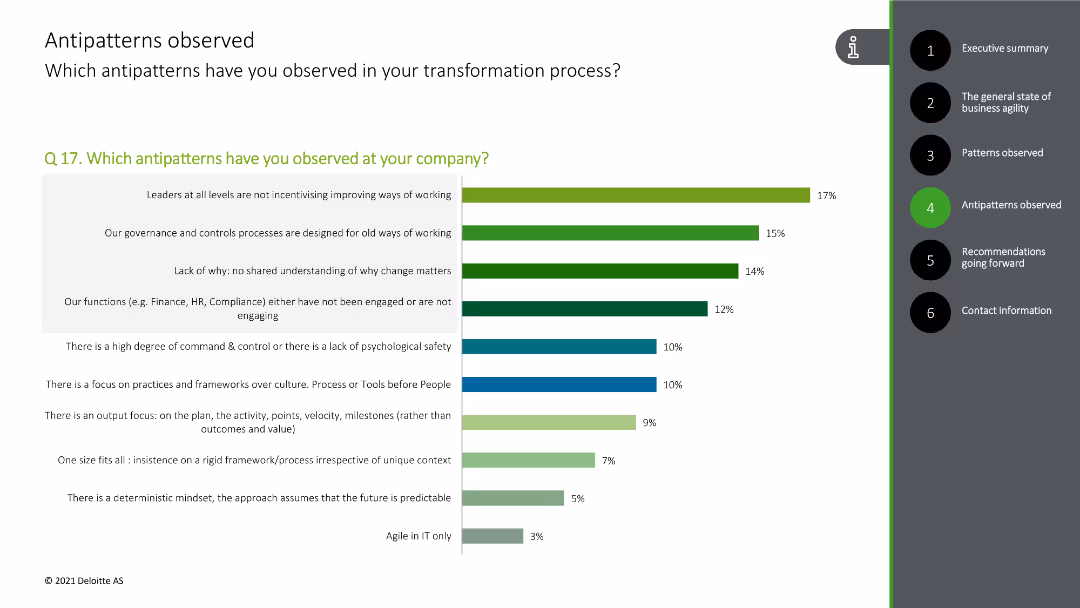
Antipatterns observed Which antipatterns have you observed in your transformation process?Deloitte Business Agility Survey 2021 A pulse check of business agility in the Nordics
Single Chart
Deloitte
View slide
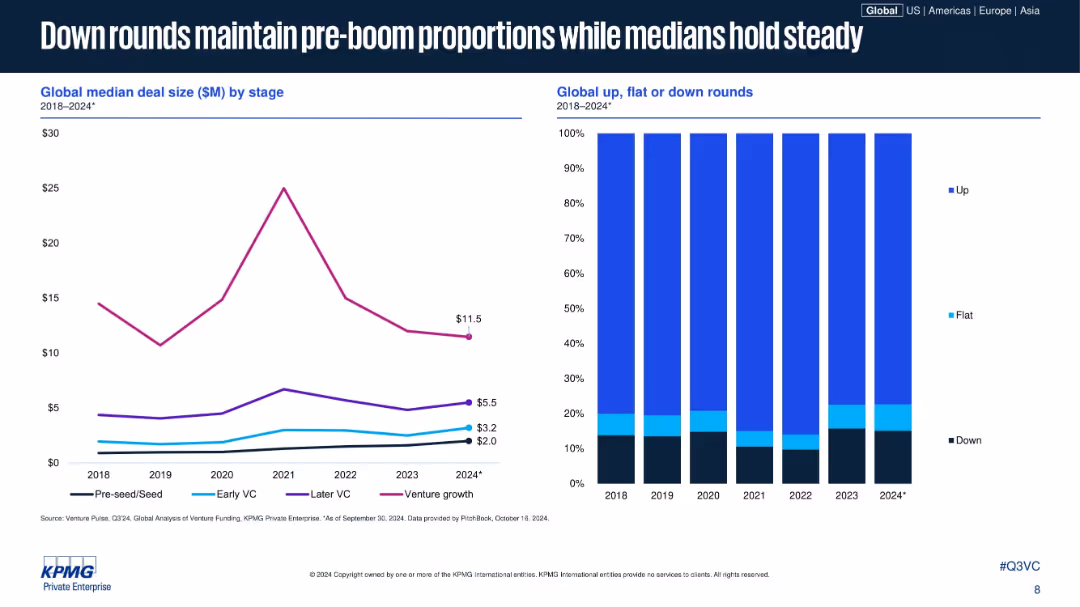
Dual visualizations: median deal size by stage and bar graph of deal round types (up, flat, down).
Performance Metrics and KPIs
Financial Services
This slide contrasts the stability of median deal sizes across stages with a bar graph showing the proportion of up, flat, and down rounds globally from 2018 to 2024. It suggests a reversion to pre-boom norms amid cautious investing.
VC Rounds, Down Rounds, Deal Size, Global Trends, KPIs
false
Down rounds maintain pre-boom proportions while medians hold steadyVenture Pulse Q3 2024
Multiple Chart
KPMG
View slide
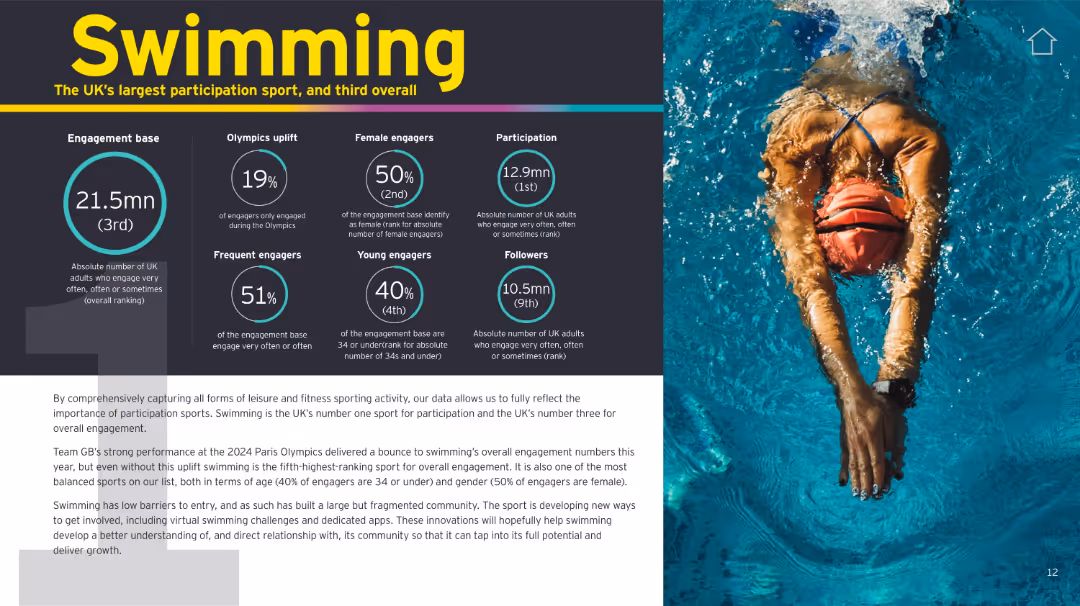
Split-screen: Left has infographics and text summary, right has a large action photo. Black, teal, and white theme.
Customer and Market Segmentation
Media & Entertainment
Swimming is highlighted as the UK’s top participation sport and third in overall engagement, with strong gender and youth representation. The slide also emphasizes its Olympic impact and future growth opportunities.
swimming, participation, gender balance, Olympics, youth, engagement, UK sports
false
SwimmingGoing for gold
Mixed Chart
EY
View slide
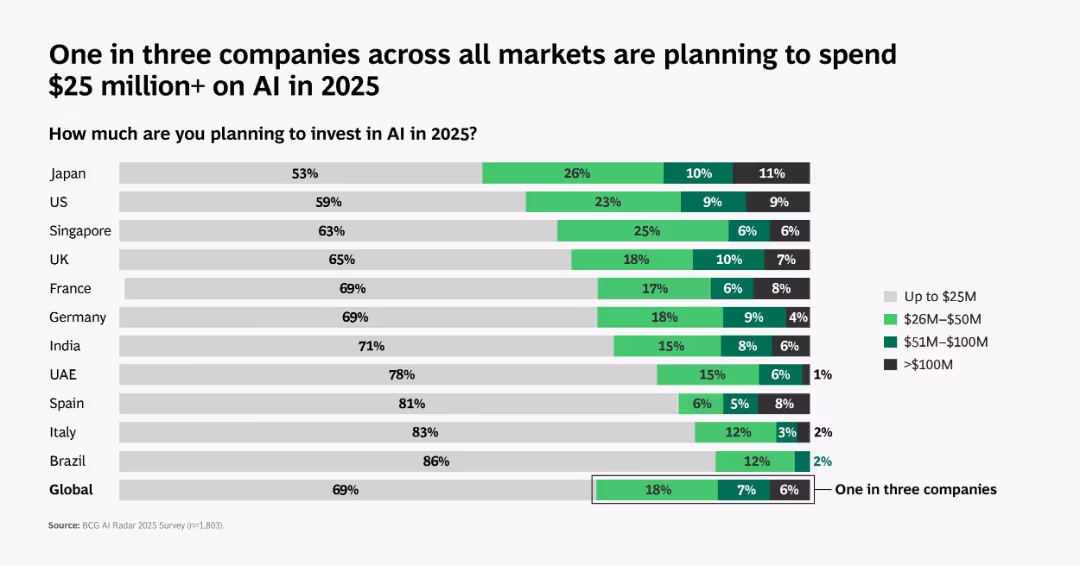
Bar chart layout with country comparisons. Various shades of green show different investment brackets; includes global average at bottom.
Market Analysis and Trends
Artificial Intelligence
Compares AI investment intentions across countries. 1 in 3 companies globally plan to invest over $25M in 2025, with regional variance in investment scale.
global AI spend, investment, 2025, countries, chart, BCG, $25M, analysis, survey, market planning
false
One in three companies across all markets are planning to spend $25 million+ on AI in 2025From Potential to Profit: Closing the AI Impact Gap
Single Chart
BCG
View slide
Slide shows column charts comparing GDP, IT & Business Services, and Accenture's CAGR across different fiscal years, using shades of purple.
Financial Performance
Technology & Software
This slide illustrates Accenture’s growth compared to general economic indicators like GDP and sector-specific growth in IT and Business Services, highlighting the company's strong market performance.
growth, GDP, IT, services, CAGR, Accenture, market performance, economic, sector-specific, comparison
false
Continued to outperform the market and take shareAccenture Investor & Analyst Conference
Multiple Chart
Accenture
View slide
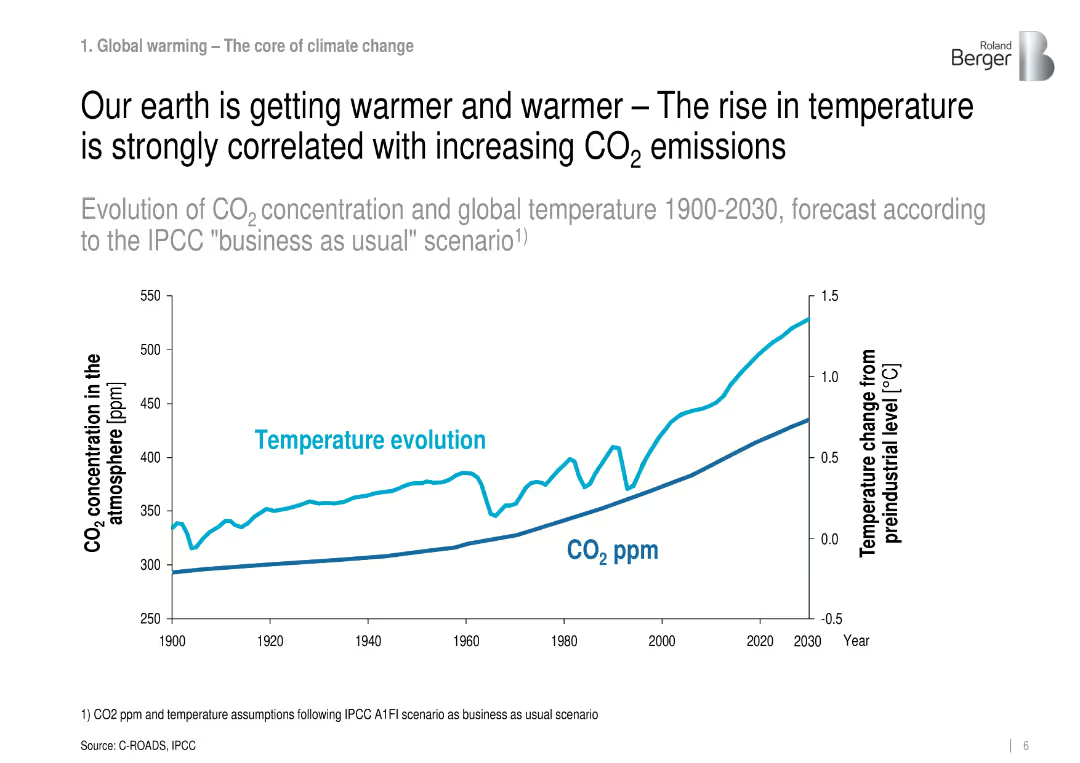
Line graph showing CO₂ concentration and temperature evolution from 1900 to 2030.
Regulatory and Compliance
Environmental Services & Sustainability
Demonstrates the strong correlation between rising CO₂ levels and temperature increases using historical and forecasted data under the IPCC scenario.
CO₂ emissions, global warming, IPCC, temperature, climate change
false
Our earth is getting warmer and warmer – The rise in temperature is strongly correlated with increasing CO2 emissionsRoland Berger Trend Compendium 2030 Megatrend 4 Climate change & ecosystem at risk
Single Chart
Roland Berger
View slide
Features bullet points and text explaining the potential growth in GDP, exports, and FDI in developed and developing countries. It summarizes growth projections and underlying economic trends.
Market Analysis and Trends
Financial Services
Discusses economic growth potential with detailed growth projections and trends in GDP, exports, and FDI for developed and developing countries, making it essential for strategic economic planning.
GDP, growth, potential, developed, developing
false
Global flows show strong trade relationships between regions – Intraregional integration also plays a major roleRoland Berger Trend Compendium 2030 Megatrend 2 Globalization & future markets
Multiple Chart
Roland Berger
View slide
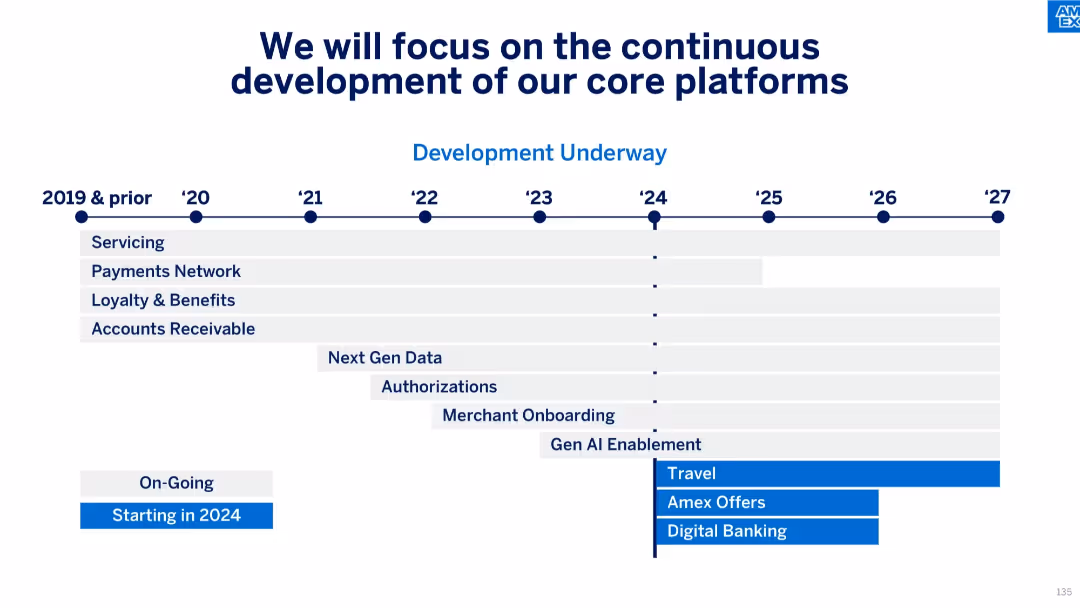
Timeline diagram mapping multi-year platform development initiatives from 2019 to 2027, categorized by function (e.g., Servicing, Payments Network, Gen AI Enablement), with new initiatives starting in 2024.
Technology and Digital Transformation
Technology & Software
This roadmap slide outlines key platform developments over time, highlighting areas such as payments, servicing, AI enablement, and onboarding. Several strategic initiatives begin in 2024, including digital banking and Amex Offers, showing a continued commitment to tech evolution.
core platforms, roadmap, platform development, AI enablement, digital banking, tech investment, transformation, timeline
false
We will focus on the continuous development of our core platformsAmerican Express Investor Day 2024
Table
McKinsey
View slide
The slide contains a combination of icon-based bar charts and isometric illustrations. There are three key statistics presented with corresponding icons: a baby carriage, pencils, and desks. Colors are blue, grey, and green.
Customer and Market Segmentation
Education & Training
This slide highlights statistics regarding access to education and childcare services. It showcases specific deficits in education availability, such as adult education and childcare, using graphical representations to clearly communicate the data.
education, childcare, statistics, access, deficits
false
There are also large deficits in education and learning:Ukraine Refugee Pulse
Single Chart
Deloitte
View slide
This slide includes text, a column chart depicting social media's impact on mental health, and bullet points summarizing key findings.
Risk Assessment and Management
Media & Entertainment
The slide discusses the mixed feelings Gen Zs and millennials have about social media's impact on their mental health, highlighting both positive and negative aspects.
social media, mental health, Gen Z, millennials, mixed impact, news consumption
false
Gen Zs and millennials have mixed feelings about the impact of social media on mental health2023 Gen Z and Millennial Survey
Multiple Chart
Deloitte
View slide
Visual timeline of major 2020 global events including the COVID-19 pandemic, stock market crash, and various crises.
Operational Efficiency
Healthcare & Pharmaceuticals
Provides a detailed timeline of key global and healthcare events in 2020, useful for historical analysis and educational purposes.
pandemic, timeline, global events, COVID-19, healthcare, 2020
false
2020: Timeline of a pandemic (and beyond)BAIN-ALTAGAMMA 2020 WORLDWIDE LUXURY MARKET MONITOR
Mixed Chart
Bain
View slide
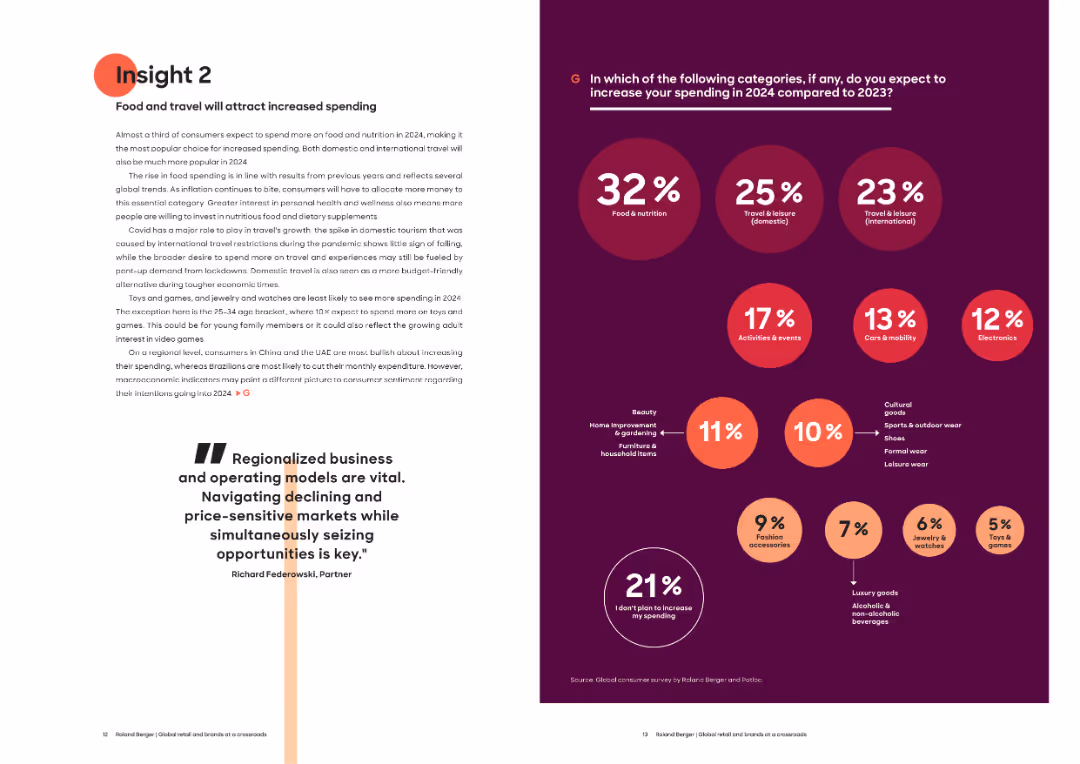
Left page with narrative explaining spending growth in food and travel; right page with large percentage bubbles indicating spending category changes.
Market Analysis and Trends
Consumer Goods
This slide focuses on expected increases in food and travel spending for 2024. It attributes the trend to post-pandemic recovery, rising interest in personal health, and economic shifts. A visual bubble chart ranks spending intentions across multiple categories.
spending trends, food, travel, consumer priorities, 2024, domestic tourism, international travel, nutrition, macroeconomics
false
Insight 2 Food and travel will attract increased spendingGlobal retail and brands at a crossroads
Mixed Chart
Roland Berger
View slide
A structured layout with icons and bullet points, highlighting key financial opportunities and industry capabilities enabled by connectivity.
Investment Analysis
Telecommunications
Discusses the monetization opportunities and new capabilities for industries created by advanced connectivity.
Connectivity, Monetization, Industry, Telecom, B2B, Devices, IoT
false
Why should leaders pay attention?McKinsey Technology Trends Outlook 2022 Report
Header Horizontal
McKinsey
View slide
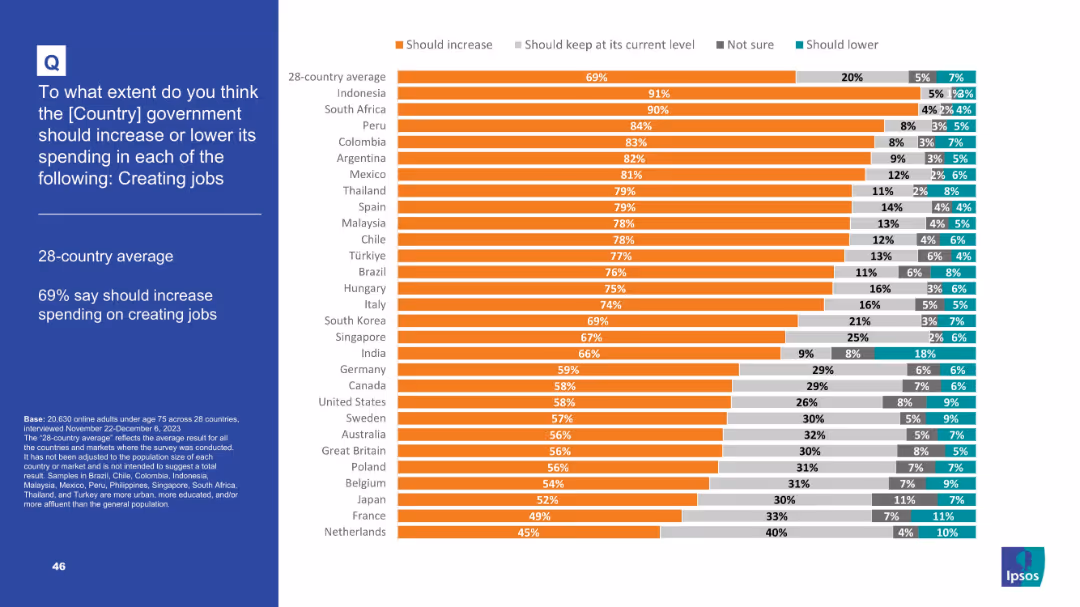
Orange bar chart displaying country-wise support for job creation spending
Strategic Planning
Government & Public Sector
This slide ranks 28 countries by public sentiment on increasing government spending to create jobs. The average is 69% in favor, with Indonesia and South Africa showing strongest support (91% and 90%, respectively).
Employment, job creation, public opinion, government spending, labor, economic development, global survey, Ipsos, strategic planning
false
Spending on Creating JobsPOPULISM IN 2024
Mixed Chart
IPSOS
View slide
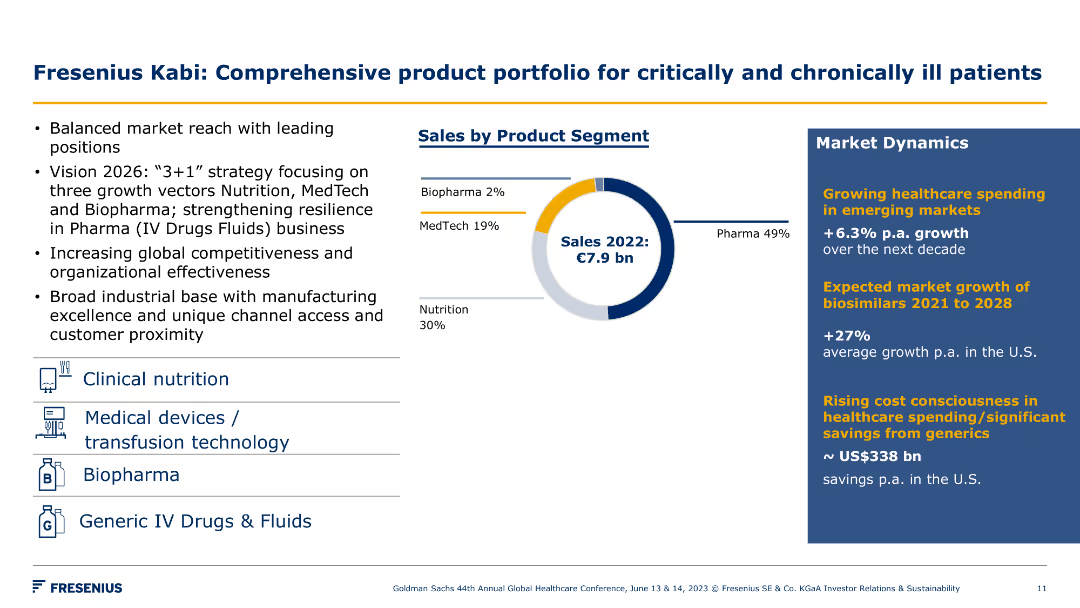
A pie chart of sales by product segment and bullet points detailing market dynamics. Visual elements include icons for each product category.
Product and Service Analysis
Healthcare & Pharmaceuticals
The slide highlights Fresenius Kabi's diverse product portfolio and market dynamics, focusing on sales distribution and strategic growth areas for critical and chronic care.
product portfolio, sales, market dynamics, critical care, chronic care, Fresenius Kabi, strategy, growth, healthcare, segments
false
Fresenius Kabi: Comprehensive product portfolio for critically and chronically ill patientsGoldman Sachs 44th Annual Global Healthcare Conference
Mixed Chart
Goldman Sachs
View slide
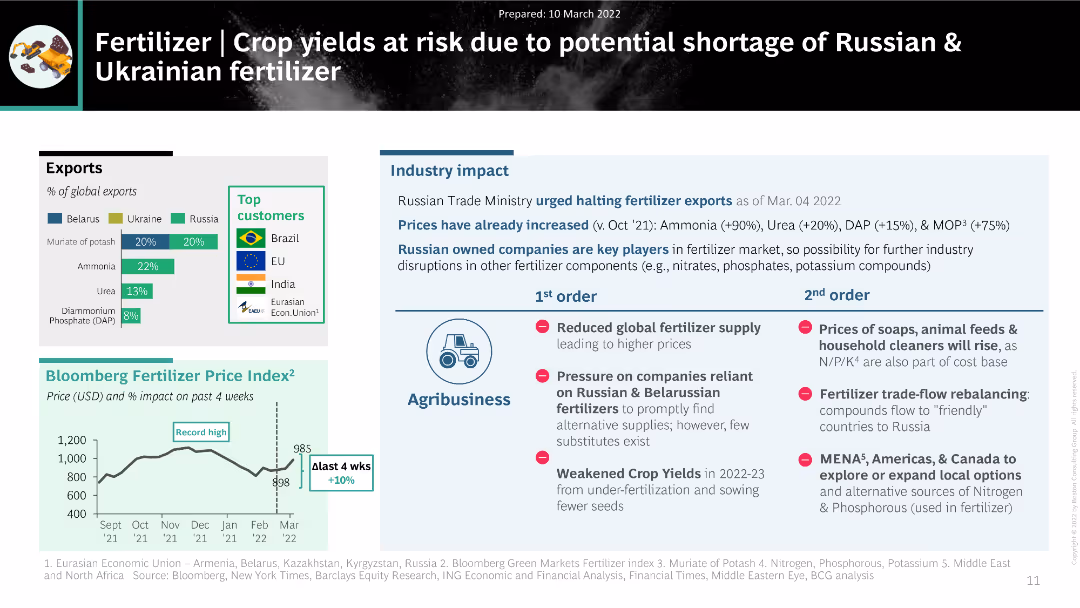
The slide features a mix of charts and text, including a column chart of fertilizer exports from Belarus, Ukraine, and Russia, a price index trend, and a detailed table of industry impacts.
Market Analysis and Trends
Agriculture & Food Production
The slide analyzes the impact of potential fertilizer shortages from Russia and Ukraine on global crop yields. It includes data on export percentages, pricing trends, and the cascading effects on agribusiness, highlighting significant challenges in the fertilizer supply chain.
fertilizer, supply disruption, crop yields, agribusiness, pricing trends
false
Fertilizer | Crop yields at risk due to potential shortage of Russian & Ukrainian fertilizerWar in Ukraine: Initial view on Supply Chain Impact
Multiple Chart
BCG
View slide
This slide presents a detailed table showing industry trends, impacts on factory automation products, and their overall impacts. It includes column charts depicting benefits of IT & OT convergence, cost reduction through XaaS, and market forecasts for AI in manufacturing, smart machines, IoT connected machines, and cobots.
Technology and Digital Transformation
Industrial & Manufacturing
The slide discusses trends in automation aimed at creating intelligent factories with improved flexibility, quality, security, and productivity. It highlights the convergence of IT and OT, XaaS, intelligent manufacturing, and new technology in manufacturing.
Automation, Intelligent Factories, IT & OT Convergence, XaaS, AI, Smart Machines, IoT, Cobots, Technology
false
Trends in automation are aimed at creating intelligent factories where new and innovative manufacturing technologies will increase flexibility, quality, security, and productivityDiscrete (Factory) Automation
Multiple Chart
LEK
View slide
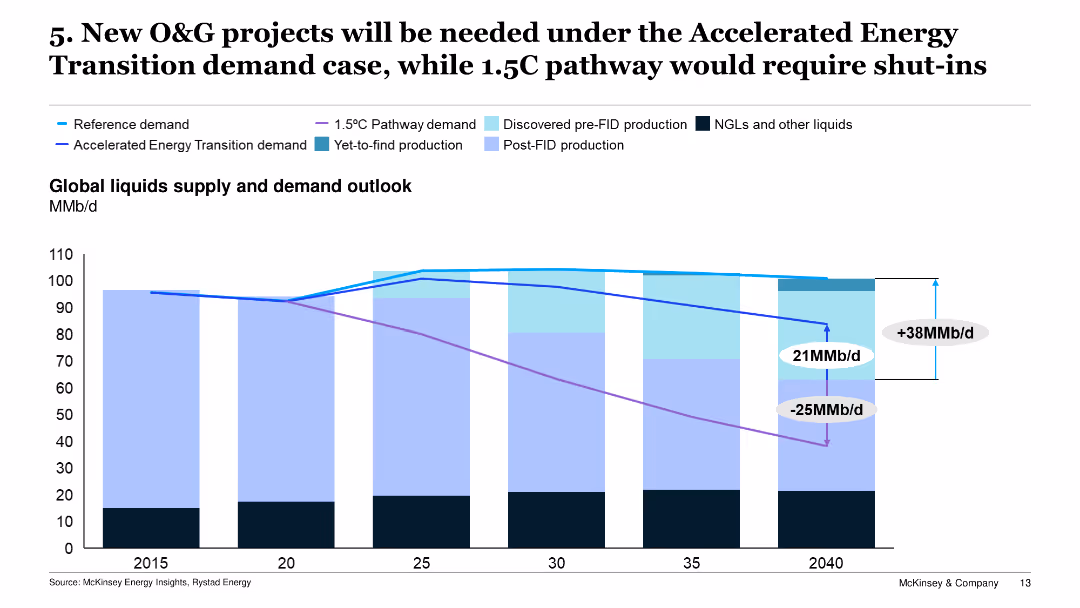
Displays a line chart projecting global liquids supply and demand outlooks under various scenarios, including the 1.5°C Pathway and Accelerated Energy Transition.
Risk Assessment and Management
Energy & Utilities
The slide examines the projected global supply and demand for oil and gas, stressing the need for new projects under the Accelerated Energy Transition scenario to meet future demands.
O&G projects, energy transition, demand, supply outlook, new projects
false
5. New O&G projects will be needed under the Accelerated Energy Transition demand case, while 1.5C pathway would require shut insGlobal Energy Perspective 2021
Single Chart
McKinsey
View slide
Graphic slide showcasing the healthcare sector opportunity, including dedicated icons and statistics related to U.S. healthcare expenditure.
Market Analysis and Trends
Healthcare & Pharmaceuticals
Highlights the potential in the healthcare market, detailing JPMorgan Chase & Co.'s positioning and strategic focus.
Healthcare market, expenditure, U.S. GDP, banking strategy, JPMorgan Chase, financial services, market opportunity, client targeting
false
Substantial opportunity to address the needs of the healthcare ecosystemCOMMERCIAL BANKING 2020
Linear Flow
JP Morgan
View slide
Bar chart showing changes in the perceived importance of marketing roles over time, segmented by survey date.
Market Analysis and Trends
Professional Services
Discusses the evolving role of marketing within companies, supported by statistical trends over recent years, useful for strategic insights.
marketing importance, role evolution, strategic impact, trend analysis, survey data
false
Marketers report that their role has increased in importance during the last year, continuing a two year trendThe CMO Survey The Highlights and Insights Report February 2022
Single Chart
Deloitte
View slide
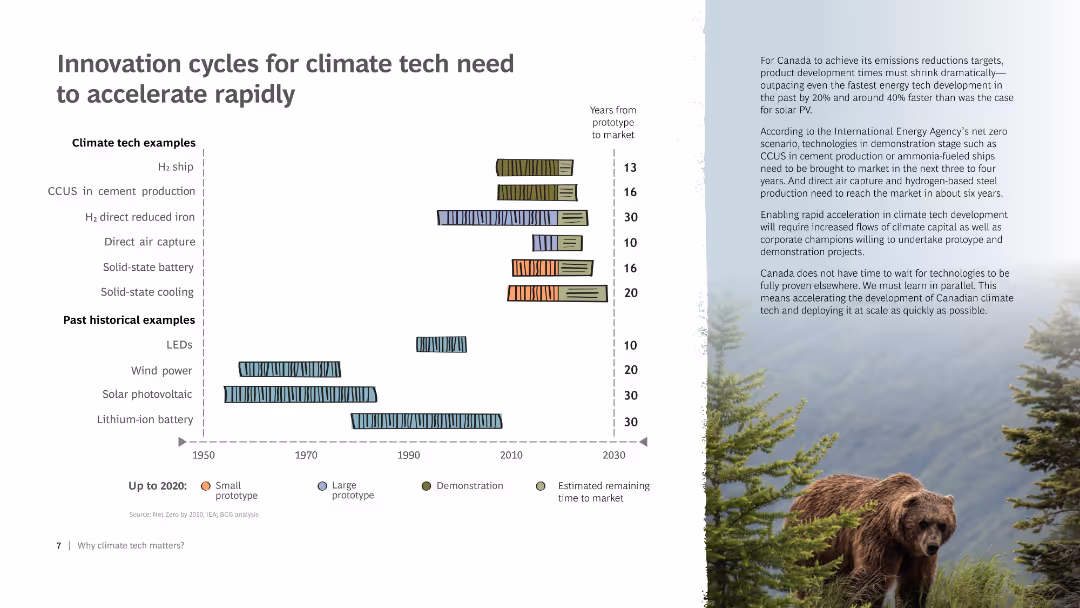
Column chart showing investment trends in Canadian climate tech from 2017 to 2022, with segments for emerging tech, early adoption, and maturing technologies.
Investment Analysis
Environmental Services & Sustainability
Tracks private investment in Canadian climate tech over several years, highlighting trends in funding and the growth of emerging technologies.
Investment, climate tech, Canada, trends, funding
false
Innovation cycles for climate tech need to accelerate rapidlyTHE CANADIAN VENTURE OPPORTUNITY
Mixed Chart
BCG
View slide
Features complex data visualizations including column charts and a multi-line chart tracking loan volume growth and performance over time. Colored primarily in blue, the design integrates concise textual explanations to guide understanding of the data trends.
Financial Performance
Financial Services
This slide focuses on the impact of strategic investments on loan balance growth within Citigroup's branded cards segment. It covers loan acquisition trends and the performance of different loan vintages over time, highlighting the increasing full-rate balance at maturity of these loans. Aimed at illustrating effective capital allocation and growth through strategic investments.
investments, loan growth, financial performance, branded cards, capital allocation
false
U.S. Branded Cards: Investments Driving Full Rate Balance GrowthGlobal Consumer Banking
Multiple Chart
Citigroup
View slide
The slide includes two line charts: one depicting government bond yields for various countries, and the other showing inflation expectations over time for the same regions.
Market Analysis and Trends
Financial Services
The slide provides an analysis of government bond yields and inflation expectations, comparing data across multiple countries including Australia, US, UK, Germany, and Japan.
government bonds, bond yields, inflation expectations, financial markets, comparative analysis, Australia, US, UK, Germany, Japan
false
Government bond yields and inflation expectationsGuide to the Markets Australia | 2Q 2024
Multiple Chart
JP Morgan
View slide
The slide displays pie charts reflecting the funding mix in 2015, 2019, and the medium-term. A breakdown sidebar shows the strategic deposit growth areas: consumer, private bank, institutional, and central channels.
Investment Analysis
Financial Services
Examines the evolution of Goldman Sachs' funding mix, detailing the strategic increase in deposits and the consequent improvement in funding costs through clear visual representations. The focus is on diversification and the role of strategic business channels in this growth.
funding mix, strategic growth, deposits, finance, diversification
false
Spotlight on Funding Mix TransformationGoldman Sachs Investor Day
Multiple Chart
Goldman Sachs
1
...
Next
Load More
Hold On!
We are searching in our database
If nothing, comes up, please try different filters!
Create a FREE account to continue browsing
Receive Instant Access to 1,000+ slides from companies like McKinsey, Google, and Goldman Sachs
First Name
Last Name
Email
Password
I agree to all
Terms & Privacy Policy
Thank you! Your submission has been received!
Oops! Something went wrong while submitting the form.
Have an account?
Sign in
Column Chart
Heatmap
Chevron
Org Chart
Infographic
Callouts
Timeline
List
Graphic
Picture
Process Flow
Diagram
Paragraph
Map
Table
Framework
Subtitle
Takeaway Box
Icon
Other Chart
Radar Chart
Waterfall Chart
Mekko Chart
Pie Chart
Scatter Plot
Line Chart
Bar chart
Bullet points