🎉 Black Friday Sale!
- Save 20% on SlideStart Pro Annual plan! CODE:
BLACKFRIDAY
My Account
My Slides
Search by Category
Templates
View All Templates
Download Template Slides
Leave Feedback
Login
Logout
Get Started
Browse all Slides
Browse all Slides
Create a FREE Account
Instant access to 1,000+ real slides from top companies like McKinsey, BCG, Goldman Sachs, Google and many more!
First Name
Last Name
Email
Password
I agree to all
Terms & Privacy Policy
Thank you! Your submission has been received!
Oops! Something went wrong while submitting the form.
Have an account?
Sign in
Instant access to the internet's best slides
Get access to 40+ advanced filters and more
Advanced Search and Filters
Access to
10,000+ slides
Access to Category Pages
Save/Bookmark Slides
PowerPoint Template Library (New)
Choose your plan
MONTHLY
$12/month
Billed every month, cancel anytime.
YEARLY
$9/month
Billed $108 annually, cancel anytime.
Checkout for $12/month
Checkout for $108/yr
Secured by Stripe | AES-256 bit encryption
Spark Your Next Big Idea with New Presentation Templates
VIEW ALL Templates
Welcome,
Welcome
Upgrade to SlideStart
Pro
Instant access to 15,000+ slides
Show Featured Only
Checkbox 8
Companies
Mckinsey
Bain
BCG
EY
Deloitte
Accenture
PwC/Strategy&
JP Morgan
Goldman Sachs
Morgan Stanley
Citigroup
Deutsche Bank
Barclays
LEK
Kearney
Oliver Wyman
Booz Allen Hamilton
Gartner
IPSOS
Nielsen
Slide type
Header Horizontal
Framework
Vertical Flow
Single Chart
Single Chart
Text Only
Mixed Chart
Header Vertical
Graphic
Pillar
Multiple Chart
Agenda
Title
Table
Linear Flow
Upgrade to SlideStart
Pro
Instant access to 40+ advanced filters
Industry
Upgrade to SlideStart
Pro
Instant access to 40+ advanced filters
Technology
Healthcare
Financial Services
Consumer Goods
Energy & Utilities
Manufacturing
Retail
E-commerce
Logistics
Telecommunications
Real Estate
Professional Services
Education
Media
Entertainment
Hospitatlity
Tourism
Agriculture
Food Production
Government & Public Sector
Environmental
Sustainability
Use Case
Upgrade to SlideStart
Pro
Instant access to 40+ advanced filters
Sales and Business Development
Mergers and Acquisitions
Corporate Finance and Valuation
Performance Metrics and KPIs
Client Case Studies
Competitive Landscape
Product and Service Analysis
Customer and Market Segmentation
Organizational Structure
Human Resources and Talent Management
Industry Overview
Regulatory and Compliance
Risk Assessment and Management
Agriculture & Food Production
Hospitality and Tourism
Government
Environmental
Sustainability
Clear all
Thank you! Your submission has been received!
Oops! Something went wrong while submitting the form.
Show Featured Only
Checkbox 8
Companies
Mckinsey
Bain
BCG
EY
Deloitte
Accenture
PwC/Strategy&
JP Morgan
Goldman Sachs
Morgan Stanley
Citigroup
Deutsche Bank
Barclays
LEK
Kearney
Oliver Wyman
Booz Allen Hamilton
Gartner
IPSOS
Nielsen
Slide type
Text Only
Linear Flow
Vertical Flow
Single Chart
Header Horizontal
Mixed Chart
Header Vertical
Pillar
Multiple Chart
Graphic
Agenda
Title
Table
Framework
Industry
Technology
Healthcare
Financial Services
Consumer Goods
Energy & Utilities
Manufacturing
Retail
E-commerce
Logistics
Telecommunications
Real Estate
Professional Services
Education
Media
Entertainment
Hospitatlity
Tourism
Agriculture
Food Production
Government & Public Sector
Environmental
Sustainability
Use Case
Sales and Business Development
Mergers and Acquisitions
Corporate Finance and Valuation
Performance Metrics and KPIs
Client Case Studies
Competitive Landscape
Product and Service Analysis
Customer and Market Segmentation
Organizational Structure
Human Resources and Talent Management
Industry Overview
Regulatory and Compliance
Risk Assessment and Management
Agriculture & Food Production
Hospitality and Tourism
Government
Environmental
Sustainability
Clear all
Thank you! Your submission has been received!
Oops! Something went wrong while submitting the form.
Tag
View slide
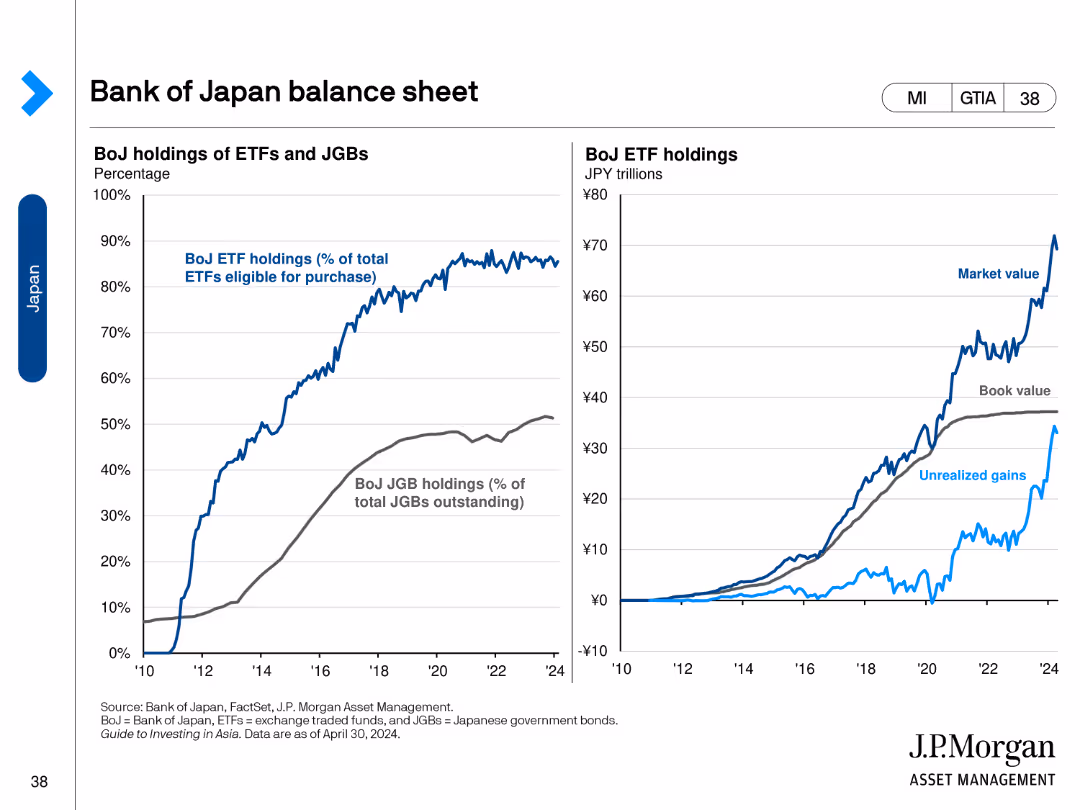
The slide contains two line charts. The left chart shows BoJ holdings of ETFs and JGBs as a percentage of total. The right chart shows the market, book value, and unrealized gains of BoJ ETF holdings in trillions of JPY.
Financial Performance
Financial Services
This slide reviews the balance sheet of the Bank of Japan, detailing ETF and JGB holdings, and market values, book values, and unrealized gains of these assets.
Balance Sheet, Bank of Japan, ETFs, JGBs, Market Value
false
Bank of Japan balance sheetGuide to Investing in Asia
Multiple Chart
JP Morgan
View slide
The slide contrasts two key aspects: 'Superior Technology' and 'Broad Product Offering' with bullet points and icons. There's also a sidebar detailing 'Superior Technology and Automation' with specific service features highlighted.
Technology and Digital Transformation
Financial Services
Spotlights the competitive edge in technology and product offerings, detailing the trading technology, broad market access, and cost-effective rates. The slide aims to convince the audience of the company's technological superiority and extensive market coverage.
Technology, Product Offering, Trading, Market Access, Cost-Effectiveness
false
The IBKR AdvantageGoldman Sachs US Financial Services Conference 2022
Diagram
Goldman Sachs
View slide
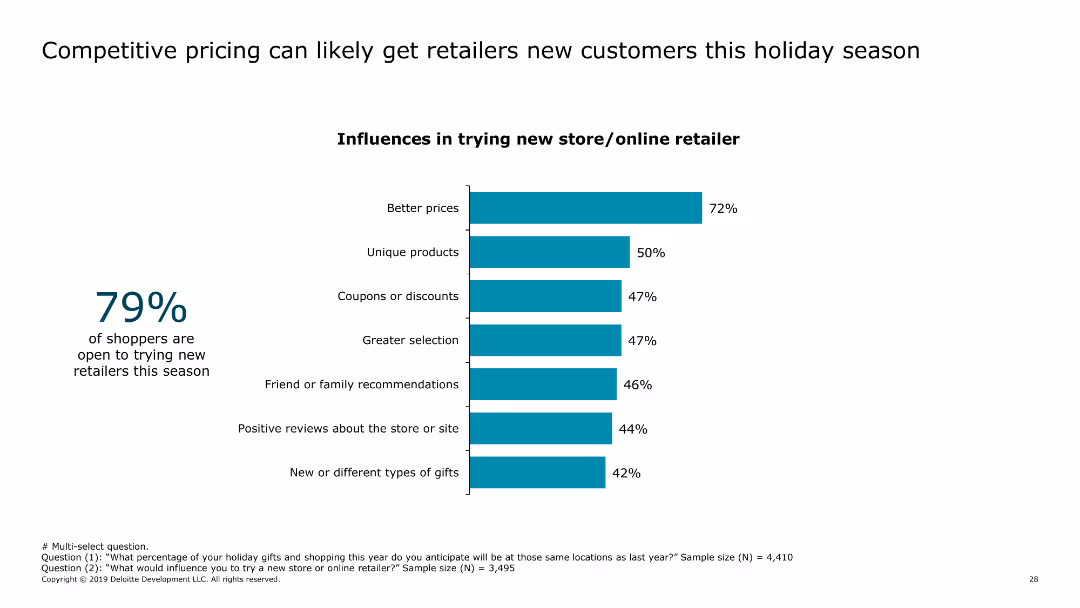
The slide contains a column chart showing factors that influence consumers to try new stores or online retailers, such as better prices, unique products, coupons or discounts, and greater selection.
Market Analysis and Trends
Retail & E-commerce
The slide emphasizes the impact of competitive pricing and unique product offerings on attracting new customers, particularly during the holiday season.
competitive pricing, consumer attraction, new customers, holiday shopping, retail strategy
false
Competitive pricing can likely get retailers new customers this holiday season2019 Holiday Survey of Consumers Keeping the good times rolling
Mixed Chart
Deloitte
View slide
The slide features a flow diagram illustrating the concrete manufacturing process from raw materials to the finished product. Each stage is accompanied by relevant images and descriptive text, with a clear visual hierarchy.
Industry Overview
Industrial & Manufacturing
Describes the process of cement production, highlighting the stages from limestone and clay to concrete. Explains the importance of clinker and the industry's move towards more sustainable practices.
Cement, clinker, concrete, manufacturing, sustainability
false
Cement is produced locally from domestic and imported clinker, but also imported as a finished productInternational Comparison of Australia’s Freight and Supply Chain Performance Final Report - Cement
Linear Flow
LEK
View slide
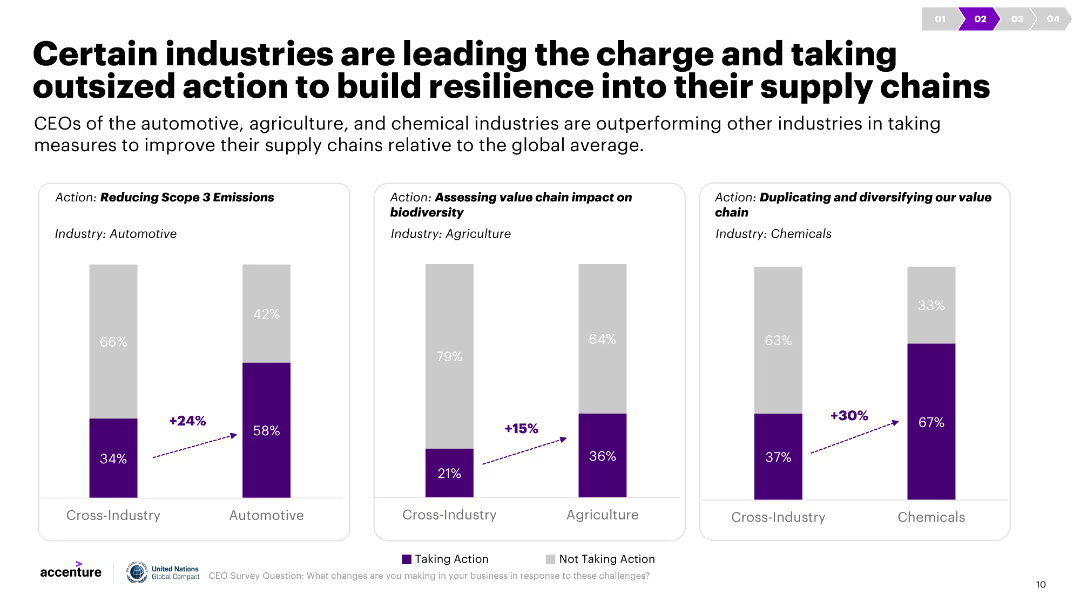
Three column charts illustrate actions taken by different industries to improve supply chain resilience, with cross-industry comparisons. Commentary explains the data.
Strategic Planning
Transportation & Logistics
The slide compares the automotive, agriculture, and chemical industries' efforts to improve supply chain resilience, highlighting measures like emissions reduction and biodiversity assessments.
Industry actions, supply chain, resilience, automotive, agriculture, chemicals
false
Certain industries are leading the charge and taking outsized action to build resilience into their supply chainsREIMAGINING THE AGENDA
Multiple Chart
Accenture
View slide
Similar to the previous slide but focuses on marketing insights, with interconnected text boxes explaining various aspects of strategic marketing.
Strategic Planning
Technology & Software
Details Experian's marketing strategies utilizing auto data to provide detailed consumer insights, enhancing target marketing efforts and campaign measurement in the automotive sector.
marketing strategy, auto data, consumer insights, campaign measurement, target marketing
false
Powered by Auto Data EMS + AutoBarclays Global Credit Bureau Forum
Table
Barclays
View slide
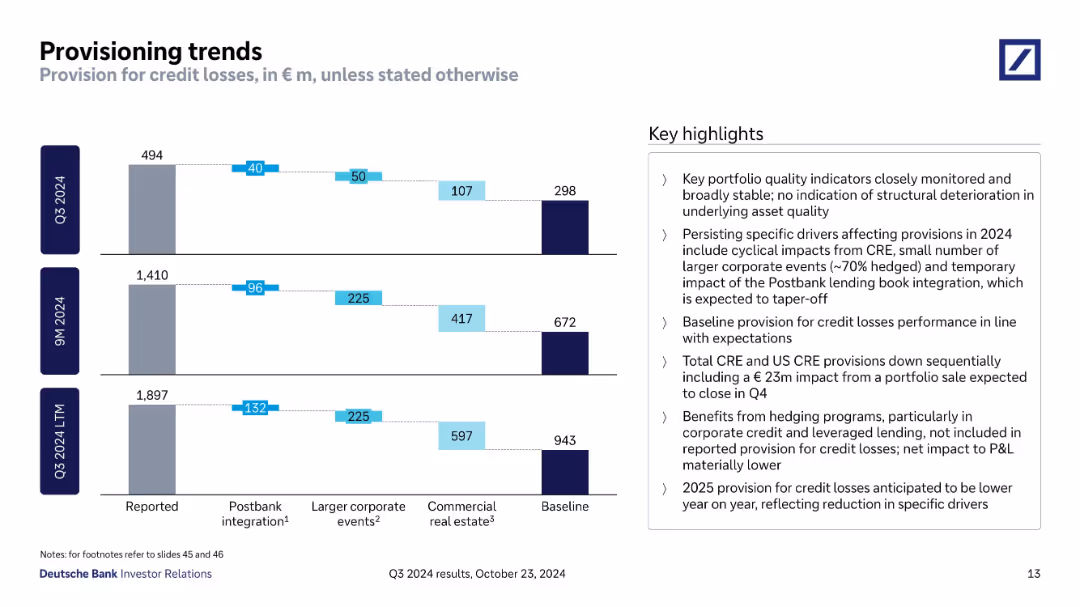
Three stacked bar charts (Q3, 9M, LTM); waterfall-style attribution of key drivers.
Risk Assessment and Management
Financial Services
Details drivers of credit loss provisions, including Postbank integration, corporate events, and commercial real estate. Trends show tapering impacts expected in 2025. Provides baseline forecasts and notes on hedging benefit exclusion from P&L.
provisioning, Postbank, CRE, credit risk, loss drivers, baseline
false
Provisioning trendsQ3 2024 results
Mixed Chart
Deutsche Bank
View slide
This slide displays a column chart tracking expenses from 2018 to 2019 in billions of dollars, highlighting overhead, revenue-related, and investment areas. The chart has a balance of dark and light blue tones, with green bars for positive changes and red for negative ones.
Financial Performance
Financial Services
The slide analyzes the expense trends for JPMorgan, showing an increase in overall expenses from 2018 to 2019 due to higher revenues and investments in technology and non-tech areas. A bar and column chart illustrates the changes in financial figures, such as overhead ratio and revenue-related expenses, offering insights into the financial planning and budgeting of the firm.
Expenses, Revenue, Investments, JPMorgan, Financial Analysis, Overhead Ratio, Bar Chart, Column Chart, Financial Planning
false
Expenses increased due to higher revenues and additional investmentsCORPORATE & INVESTMENT BANK 2020
Single Chart
JP Morgan
View slide
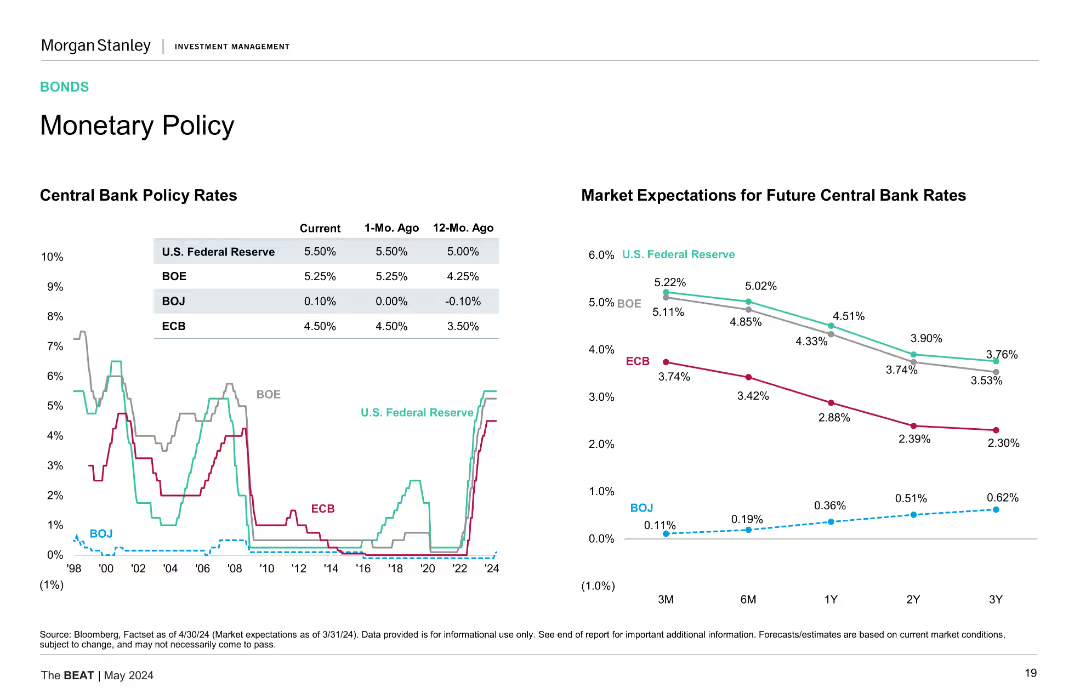
Features two line charts. The left chart shows central bank policy rates for the US Fed, BoE, BoJ, and ECB from 1998 to 2024. The right chart shows market expectations for future central bank rates over different time horizons.
Market Analysis and Trends
Financial Services
Discusses current and future central bank policy rates across major economies, emphasizing the impact on global financial markets and expectations for rate adjustments.
Central Bank, Policy Rates, Fed, BoE, BoJ, ECB, Market Expectations, Financial Markets, Global Economy
false
Monetary Policy Central Bank Policy Rates Market Expectations for Future Central Bank RatesThe BEAT May 2024
Multiple Chart
Morgan Stanley
View slide
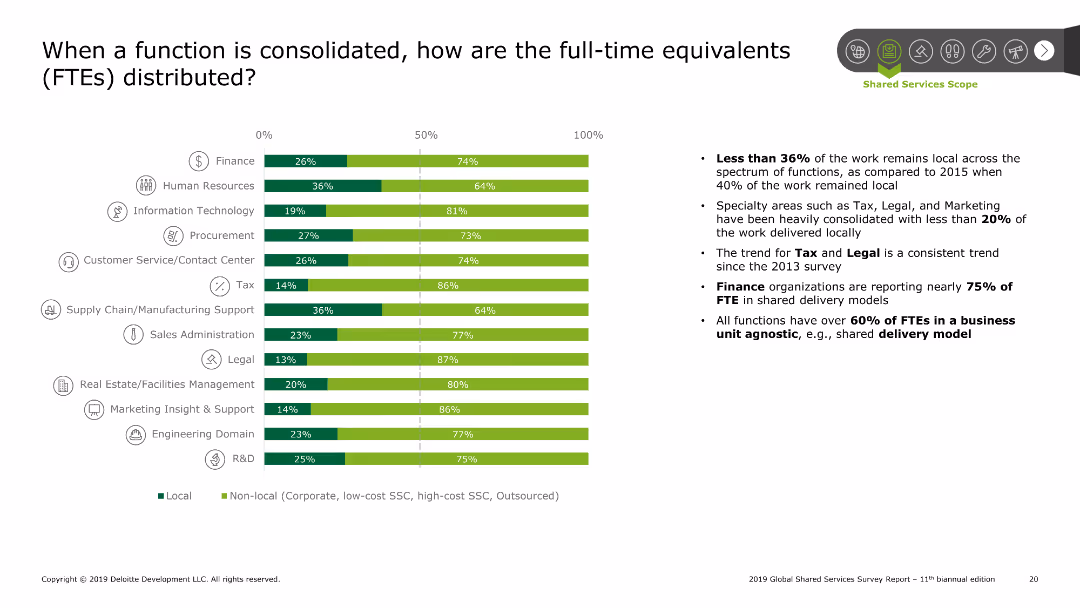
Bar chart displaying the distribution of FTEs between local and non-local for various functions. Functions include finance, HR, IT, procurement, etc. Summary points on the right detail the trends and findings.
Performance Metrics and KPIs
Professional Services
The slide shows how FTEs are distributed when functions are consolidated. The bar chart indicates the split between local and non-local FTEs across different functions like finance and HR. Summary points highlight trends such as the decline in local work and the consistency in finance and tax trends.
SSC, FTE distribution, consolidation, finance, HR
false
When a function is consolidated, how are the full time equivalents (FTEs)2019 Global Shared Services Survey Report 11th biannual edition
Mixed Chart
Deloitte
View slide
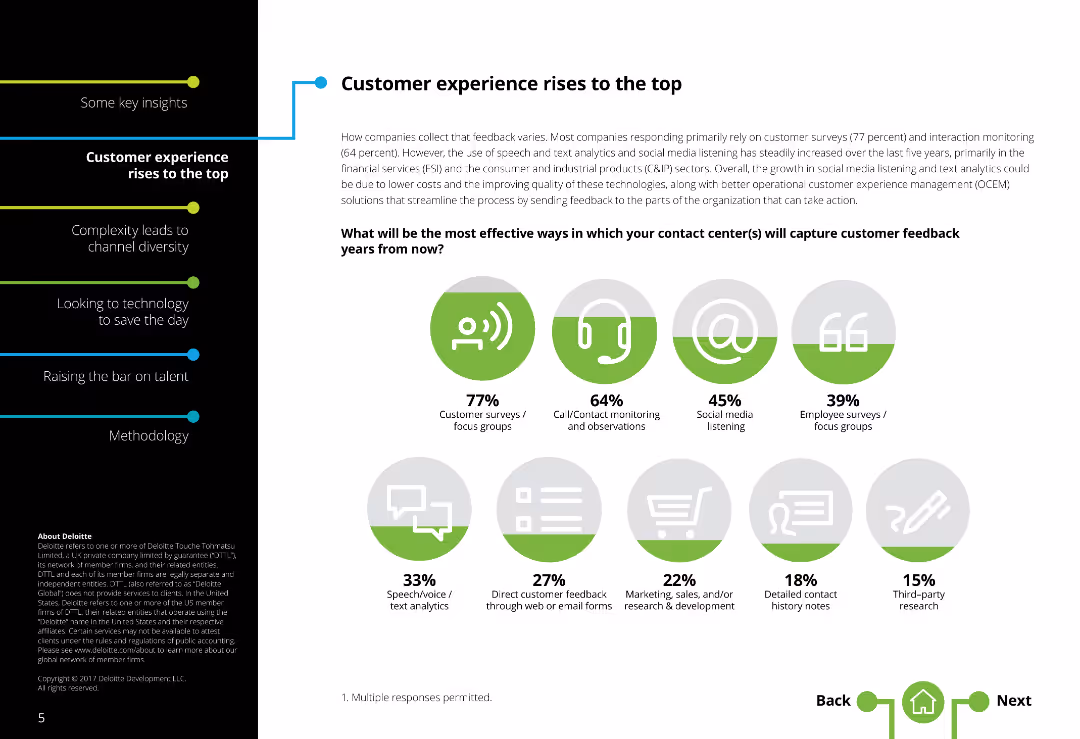
This slide features various icons and column charts displaying effective methods for capturing customer feedback in contact centers, with percentage data for each method.
Market Analysis and Trends
Professional Services
The slide outlines the most effective ways for contact centers to capture customer feedback. It includes survey data showing the prevalence of different methods such as customer surveys, call/contact monitoring, social media listening, and employee focus groups, presented with corresponding icons and column charts.
Customer feedback, contact centers, survey methods, column charts, engagement
false
How companies collect that feedback varies.Global Contact Center Survey
Single Chart
Deloitte
View slide
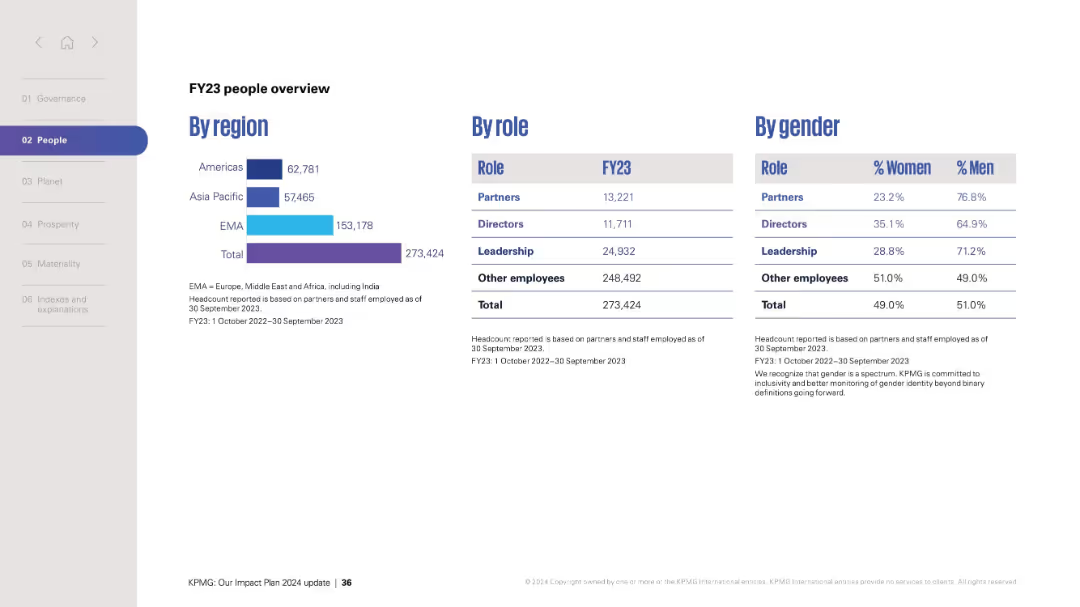
Split layout: left has bar chart by region, center table by role, right table by gender. Light grey and blue palette, clean presentation.
Human Resources and Talent Management
Professional Services
Provides headcount data by region, role, and gender for FY23, highlighting gender representation and workforce distribution across global KPMG operations.
workforce data, FY23, gender diversity, headcount, region, roles
false
FY23 people overviewKPMG: Our Impact Plan 2024 update
Mixed Chart
KPMG
View slide
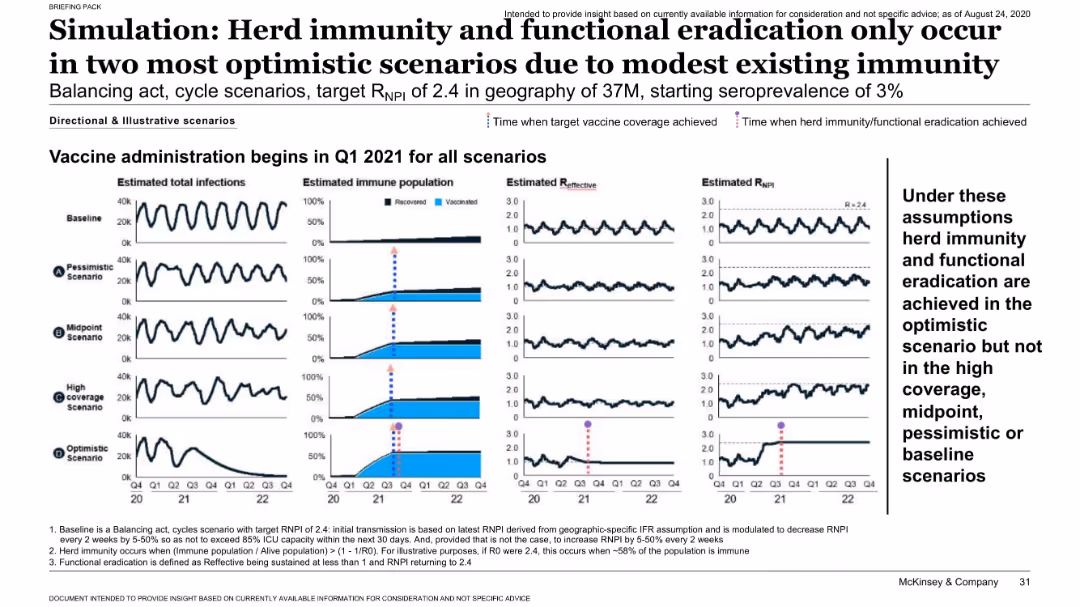
Multi-panel layout comparing infection trends, immune population, effective R, and RNPI across five vaccine rollout scenarios; uses vertical markers for milestones.
Strategic Planning
Healthcare & Pharmaceuticals
Shows that only in the optimistic and high-coverage scenarios is herd immunity and functional eradication of COVID-19 achieved. Visual simulation illustrates varying outcomes based on vaccine rollout effectiveness and starting immunity levels.
herd immunity, simulation, scenarios, RNPI, vaccine, immunity levels
false
Simulation: Herd immunity and functional eradication only occur in two most optimistic scenarios due to modest existing immunityCOVID-19: Briefing materials
Mixed Chart
McKinsey
View slide
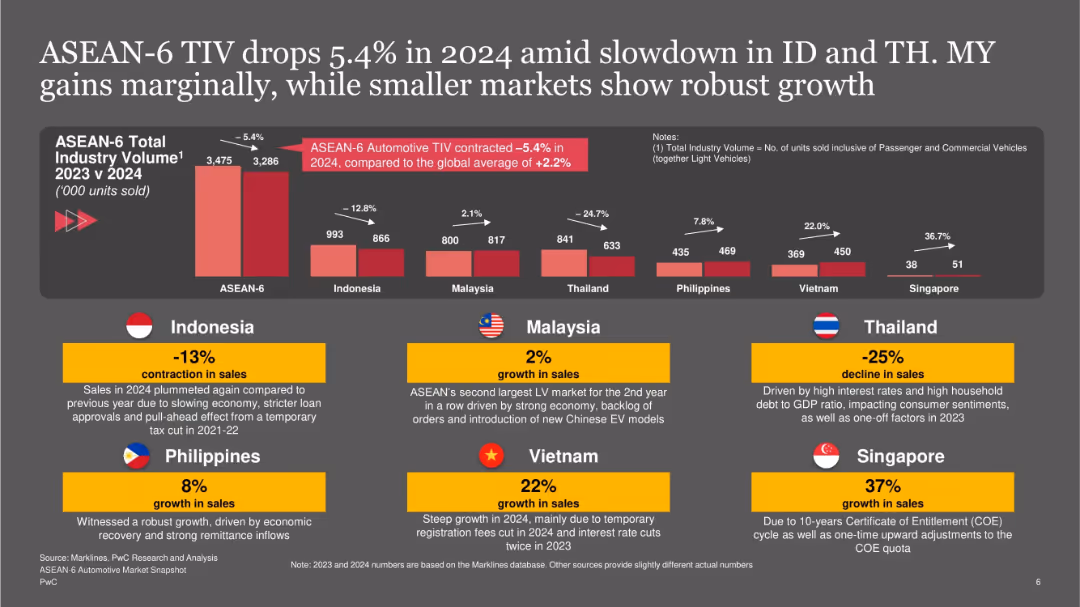
Central bar chart with red bars shows volume change by country; bottom row has yellow country boxes with growth/decline stats and explanations; dark background with bold white title.
Market Analysis and Trends
Industrial & Manufacturing
Provides a breakdown of ASEAN-6 Total Industry Volume changes from 2023 to 2024. Highlights significant contractions in Indonesia and Thailand, while countries like Vietnam and Singapore saw robust growth. It emphasizes local economic and policy factors behind these shifts in vehicle sales.
ASEAN-6, automotive sales, TIV, Indonesia, Malaysia, Thailand, growth, decline, 2024
false
ASEAN-6 TIV drops 5.4% in 2024 amid slowdown in ID and TH. MY gains marginally, while smaller markets show robust growthOverview of the ASEAN-6 Automotive Market
Mixed Chart
PwC/Strategy&
View slide
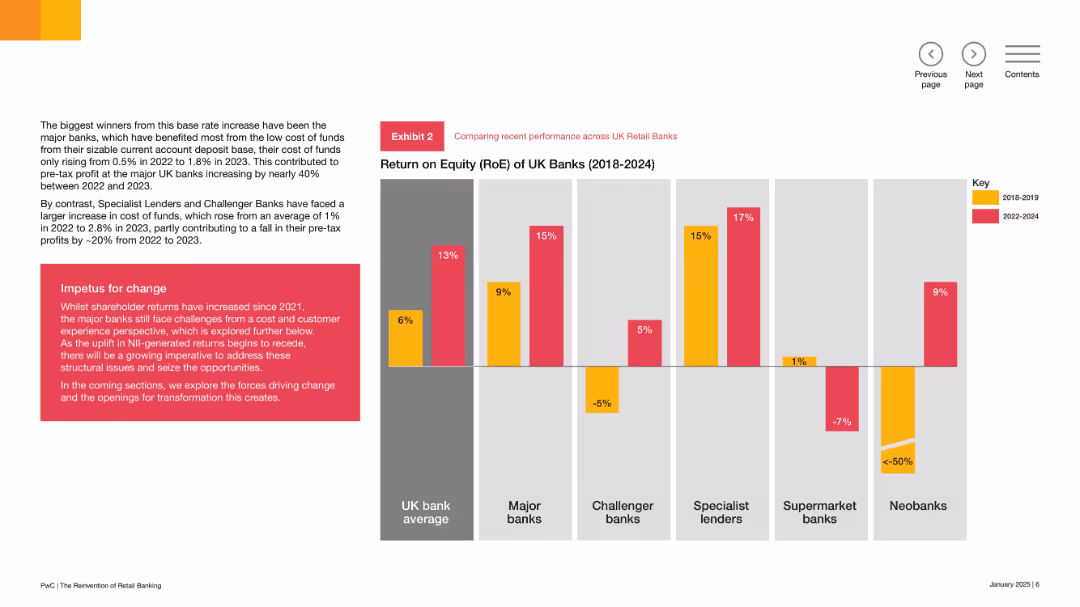
Vertical bar chart comparing RoE across bank types and periods; left panel has explanatory narrative; red-yellow color code indicates performance by time range.
Performance Metrics and KPIs
Financial Services
The slide compares RoE across various UK bank types, showing that major and specialist lenders improved returns since 2022, while challenger and supermarket banks faced declining profitability. It highlights structural differences in cost of funds and customer models.
RoE, UK banks, profitability, major banks, challenger banks, structural challenges, performance comparison, 2018–2024
false
Return on Equity (RoE) of UK Banks (2018–2024)The Reinvention of Retail Banking: How focused business models can unlock value
Mixed Chart
PwC/Strategy&
View slide
A bar chart depicts consumer expectations for BEV driving range, categorized by urban and sub-urban/rural responses, showing varying preferences.
Market Analysis and Trends
Transportation & Logistics
Discusses consumer expectations for battery electric vehicle (BEV) driving ranges, essential for understanding market needs and vehicle design in the automotive sector.
BEV, driving range, consumer expectations, urban, rural, market needs, vehicle design, automotive trends
false
Only one in four non-BEV intenders surveyed would consider a fully charged BEV with a driving range below 400 kms as a viable option for their next vehicle.2024 Global Automotive Consumer Study
Single Chart
Deloitte
View slide
The slide contains three charts: a line chart of long-term interest rates, a column chart of global and US M&A activity, and a line chart of exchange rates vs. USD. The layout is organized with a blue and white color scheme, clear labels, and legends.
Market Analysis and Trends
Financial Services
The slide examines how increased market volatility and a rapid global monetary policy tightening cycle impact the cost of capital, highlighting trends in interest rates, M&A activity, and exchange rates.
cost of capital, market volatility, monetary policy, interest rates
false
Cost of capital: Increased market volatility influenced by a historically rapid global monetary policy tightening cycle will remain a key feature of the outlook2023 Global Macroeconomic Outlook
Multiple Chart
EY
View slide
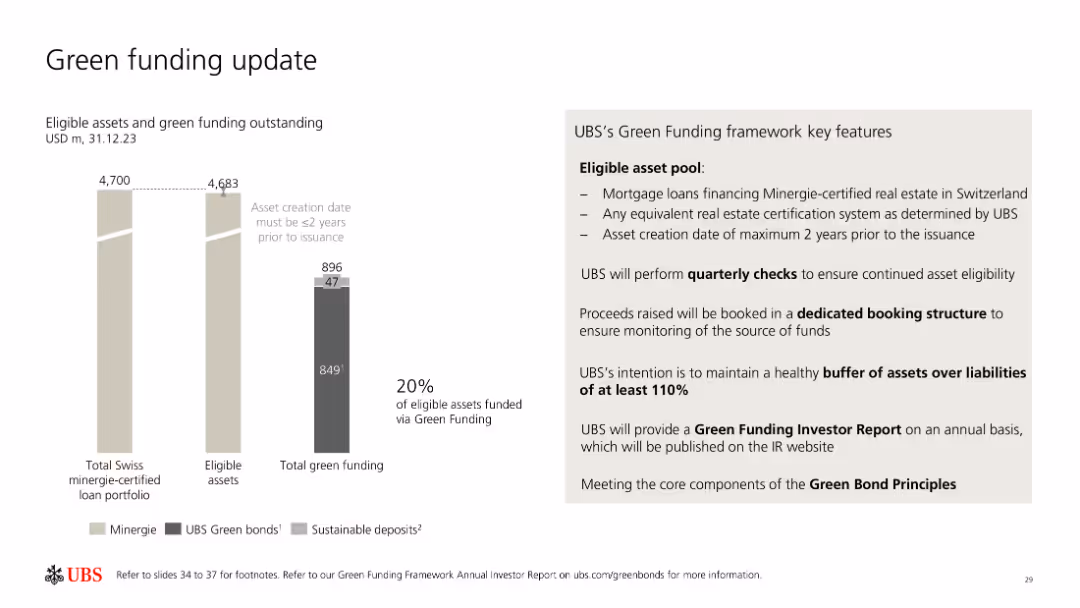
The slide includes bar charts and a list outlining UBS's green funding metrics, eligible asset pool, and key features of their green funding framework.
Investment Analysis
Financial Services
UBS provides an update on their green funding, detailing eligible assets, green bonds, sustainable deposits, and the framework for maintaining and monitoring green funding.
Green funding, UBS, sustainable assets, framework, bonds
false
Green funding update Eligible assets and green funding outstanding USD m, 31.12.23Sustainability at UBS
Mixed Chart
UBS
View slide
Slide features a pie chart in dark grey background. The chart details share of global GDP among services, emission-intensive industries, and all others.
Industry Overview
Energy & Utilities
This slide discusses the distribution of global GDP, emphasizing the smaller proportion held by emission-intensive industries, which might be seen as less competitive due to emissions constraints.
GDP, services, industries, emissions, competitiveness
false
Fear of losing competitiveness is overstatedClimate Change: BCG’s Perspectives and Offerings
Single Chart
BCG
View slide
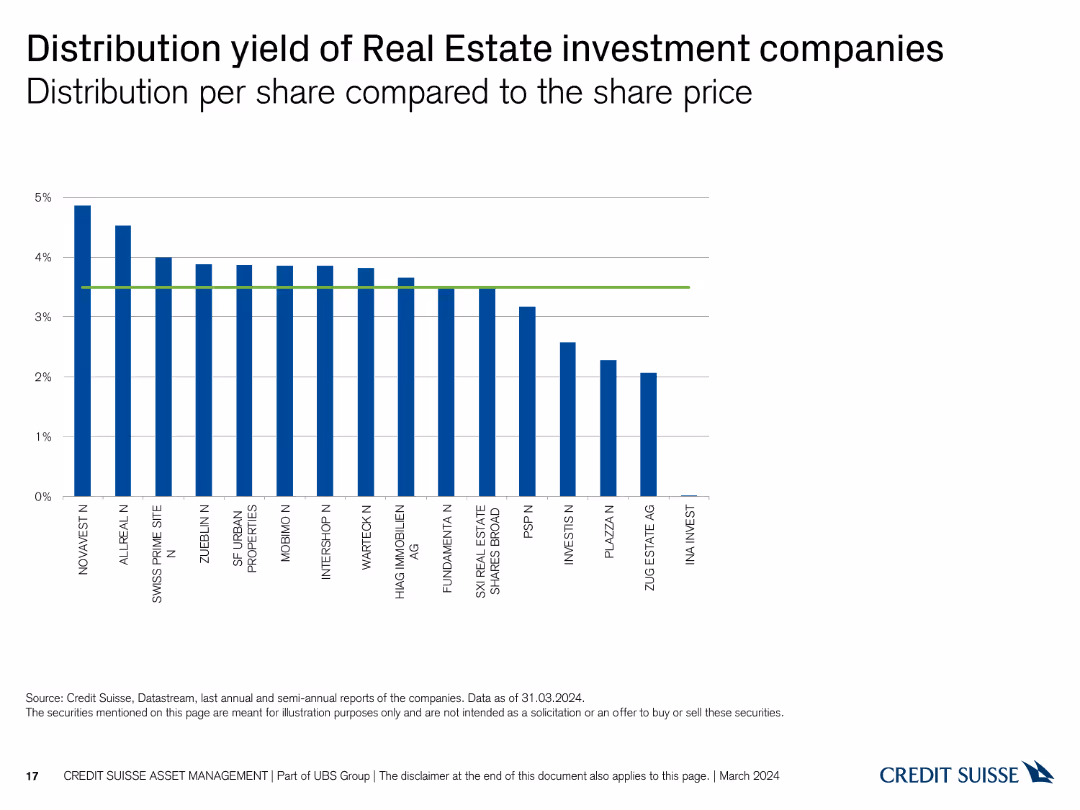
A column chart showing the distribution yield per share of various real estate investment companies. The X-axis lists companies, and the Y-axis represents distribution yield percentages up to 5%.
Financial Performance
Real Estate & Construction
This slide compares the distribution yield per share across different real estate investment companies, highlighting those with the highest and lowest yields.
distribution, yield, real estate, investment, companies, comparison, financial, performance, yield percentage, analysis
false
Distribution yield of Real Estate investment companies Distribution per share compared to the share priceSwiss Real Estate Funds At a glance Switzerland March 2024
Single Chart
Credit Suisse
View slide
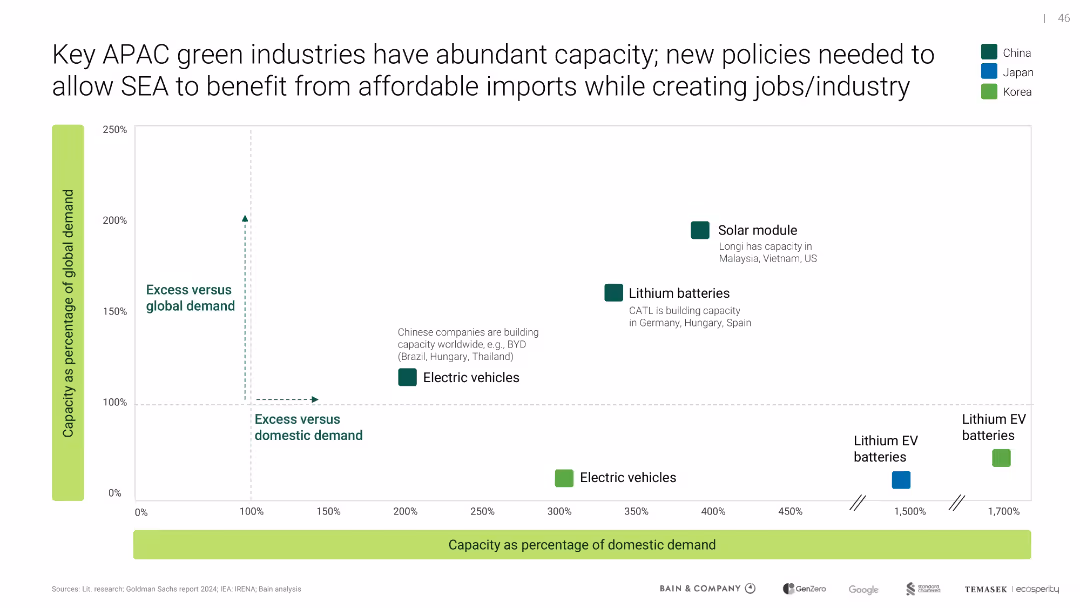
Scatter plot showing domestic vs global demand; color-coded by country (China, Japan, Korea)
Market Analysis and Trends
Artificial Intelligence
APAC countries, particularly China, have significant excess capacity in green sectors like solar modules and EV batteries. The slide argues for policy support to allow SEA to import green tech and build local industry.
APAC, green industry, overcapacity, imports, SEA, EV, solar, policy
false
Key APAC green industries have abundant capacity; new policies needed to allow SEA to benefit from affordable imports while creating jobs/industrySoutheast Asia's Green Economy
Single Chart
Bain
View slide
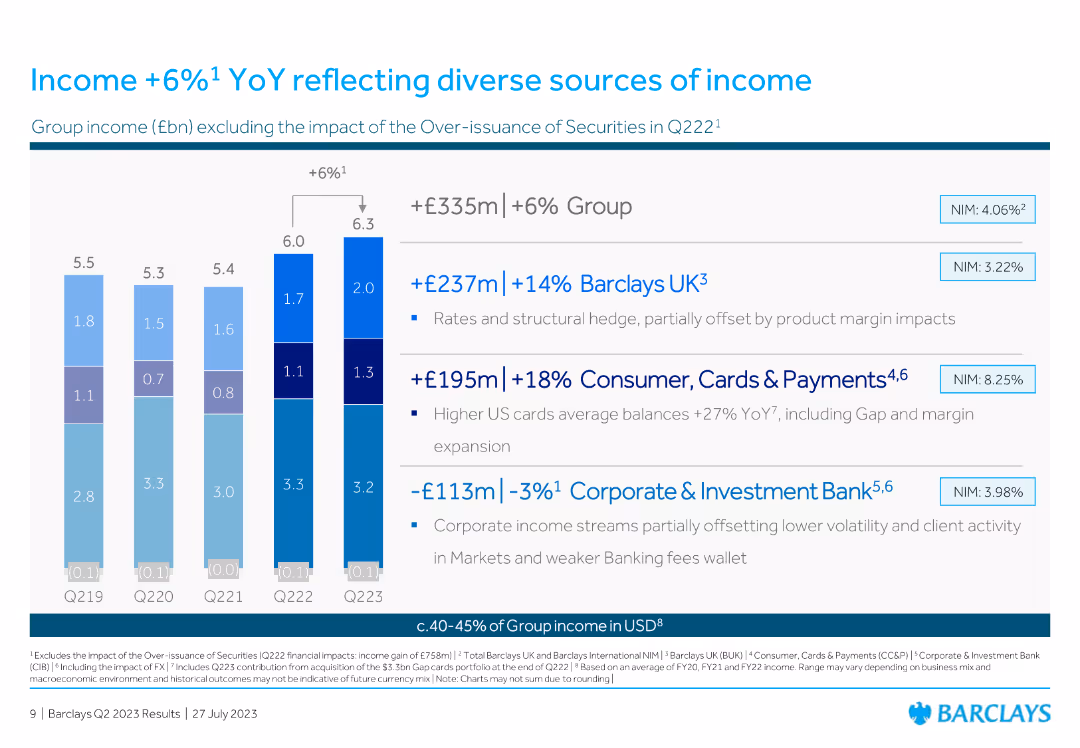
The slide presents a column chart with different income sources, highlighting year-on-year income growth percentages.
Financial Performance
Financial Services
This slide shows the income growth by various sources within the group, indicating a 6% overall increase year-on-year, and breaks down contributions by segments.
income, growth, financial, performance, sources, column chart, YoY, percentage, segment, diverse
false
Income +6%1 YoY reflecting diverse sources of incomeBarclays PLC Q2 2023 Results Presentation
Mixed Chart
Barclays
View slide
This slide features a column chart and a table detailing the breakdown of survey respondents by country, focusing on European countries and a global control set. The layout is structured and uses colors to differentiate between regions.
Market Analysis and Trends
Professional Services
Details the distribution of survey respondents across multiple countries, with specific emphasis on European nations. Useful for analyzing demographic trends and the geographic distribution of survey participation.
survey respondents, demographics, global control, Europe
false
1. Breakdown of respondents by countryGlobal Culture Survey 2021
Single Chart
PwC/Strategy&
View slide
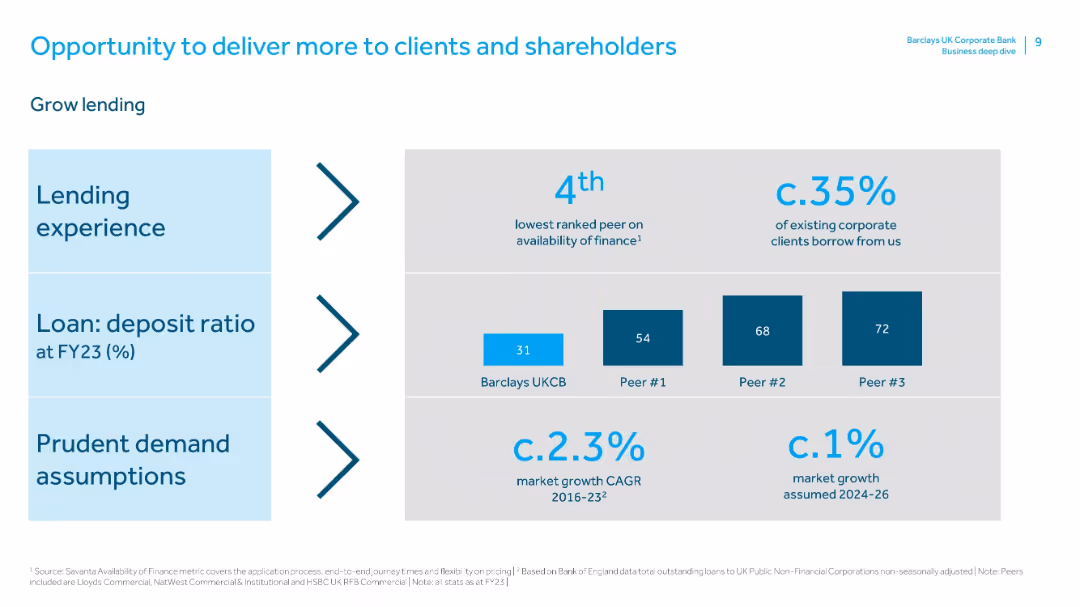
Similar layout to previous slide. Sections for lending experience, loan:deposit ratio, and demand assumptions with relevant benchmarks.
Sales and Business Development
Financial Services
Focuses on growing lending as a strategic priority. Barclays UKCB is underperforming in loan:deposit ratio compared to peers, indicating an opportunity. It notes current client borrowing levels (35%) and conservative growth forecasts.
lending, borrowing, loan:deposit ratio, market assumptions, peer comparison, business development, client financing
false
Opportunity to deliver more to clients and shareholdersBarclays UK Corporate Bank Business deep dive: 18th June 2024
Mixed Chart
Barclays
View slide
The slide displays a stylized image of a sailing boat on blue waters with mountains in the background, under a bright yellow sun. The Vietnamese flag is visible on the boat, and a lighthouse stands on a green landmass. The graphical elements are simplistic, making it visually clear and uncluttered. The country name "Vietnam" is boldly placed.
Industry Overview
Hospitality & Tourism
The slide is a visual representation meant to showcase Vietnam, likely to be used in a context of discussing tourism, hospitality, or geographical overviews. The image conveys a sense of place and is likely to engage an audience with an interest in the region or in travel-related topics.
Vietnam, tourism, sailing, lighthouse, hospitality, travel, geography, image representation
false
Vietname-Conomy SEA 2022 Through the waves, towards a sea of opportunity
Title
Bain
View slide
Features a combination of bar graphs and textual analysis, using color coding to differentiate data points across multiple sectors.
Strategic Planning
Environmental Services & Sustainability
Reviews strategic decarbonization levers across Southeast Asia, highlighting key sectors and the potential for carbon abatement.
decarbonization, SEA, carbon abatement, strategy, sectors
false
A material economic and climate prize exists regionally in SEA if fully pursuedSoutheast Asia’s Green Economy 2022 Report
Mixed Chart
Bain
View slide
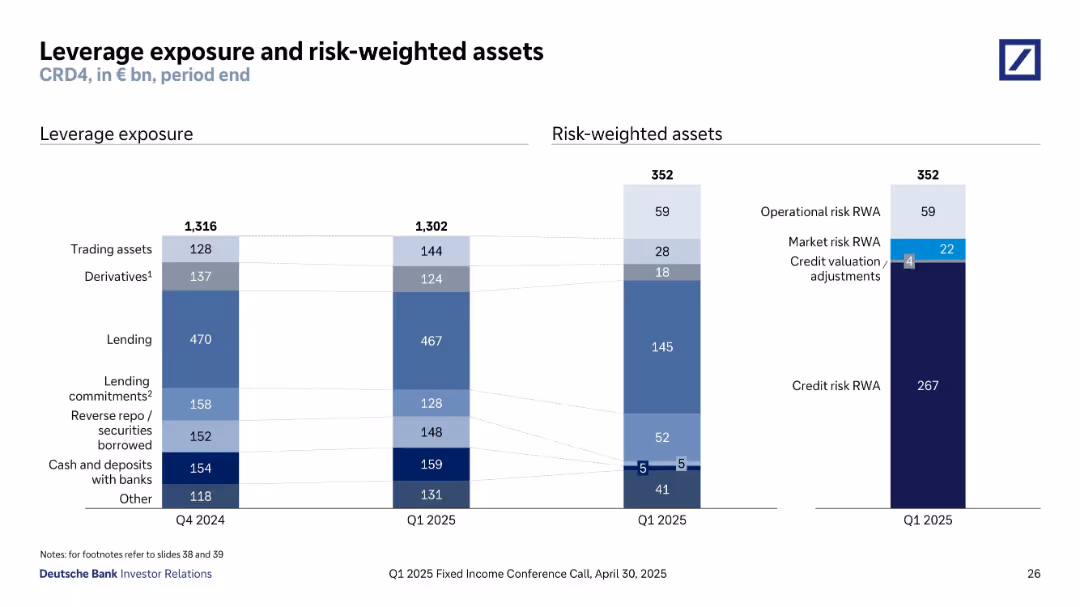
Bar charts comparing Q4 2024 and Q1 2025 leverage exposures and risk-weighted assets.
Financial Performance
Financial Services
The slide outlines leverage exposure and risk-weighted assets under CRD4 regulation. Key elements include lending (€467bn), derivatives (€124bn), and risk weights categorized into operational, market, and credit risks. Comparison with Q4 2024 shows stability in leverage with minor changes in exposures and risk segmentation.
leverage exposure, risk-weighted assets, CRD4, lending, credit risk, derivatives, Q1 2025, regulatory capital, operational risk
false
Leverage exposure and risk-weighted assetsQ1 2025 Fixed Income Investor Conference Call
Multiple Chart
Deutsche Bank
View slide
The slide consists of a large green column chart showing the growth of the UK platform market from FY15 to FY18, accompanied by a key trends list and a forecast column chart for global asset management flows. It uses shades of green, white, and black for clear differentiation between sections. Visual elements include column charts, with corresponding annotations for clarity. The layout is clean and allows each section to stand out individually.
Market Analysis and Trends
Financial Services
The slide details the growth of the UK platform market driven by structural trends and projects the composition of global asset management flows. This would be useful in financial market trend analyses or investment strategy presentations.
Market Trends, Platform Growth, Asset Management, UK Financial Market, Investment Forecast, Pension Consolidation, Financial Planning
false
Growth driven by structural market trendsRMB Morgan Stanley Off Piste
Multiple Chart
Morgan Stanley
View slide
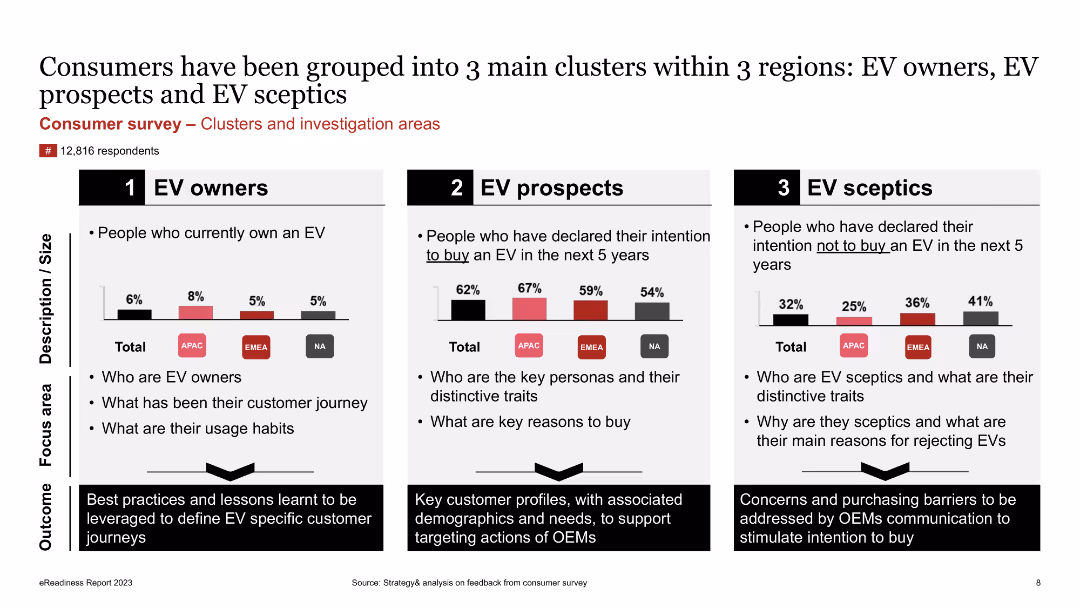
The slide presents a comparative analysis of three consumer clusters (EV owners, EV prospects, EV sceptics) using column charts and text boxes. It highlights key traits and focus areas for each group.
Customer and Market Segmentation
Consumer Goods
The slide categorizes consumers into three clusters based on their EV ownership and intentions: EV owners, EV prospects, and EV sceptics. It identifies the key traits, usage habits, and reasons for or against buying EVs, providing insights for targeted marketing strategies.
Consumer Survey, Clusters, EV Owners, EV Prospects, EV Sceptics, Market Segmentation, Traits, Focus Areas
false
Consumers have been grouped into 3 main clusters within 3 regions: EV owners, EV prospects and EV sceptics4th edition eReadiness 2023
Multiple Chart
PwC/Strategy&
View slide
Contains a side-by-side column chart comparison and bullet points detailing the benefits of utilizing bank entities for growth.
Strategic Planning
Financial Services
Offers a strategic overview of banking model advantages, targeting stakeholders or internal strategic reviews to optimize banking operations.
Banking Model, Strategy, Asset Growth, Funding, Operational Efficiency, Financial Services
false
Embracing The Bank ModelGoldman Sachs Investor Day
Mixed Chart
Goldman Sachs
View slide
The slide is densely packed with text and includes a digital skill matrix, career pathways, and job description with skills required. Each section is color-coded and contains bullet points. It is visually complex, incorporating various text blocks and a flow diagram that outlines career progression. The overall layout is systematic but crowded.
Operational Efficiency
Technology & Software
This slide maps the digital skill and career roadmap for Singapore, depicting key areas such as Data & AI, Infrastructure, Software, and Strategy & Governance. It offers an in-depth view into the specific job roles, required skills, and potential career pathways within the ICT sector, serving as a guide for workforce upskilling strategies and educational planning.
Digital Skills, Career Roadmap, Singapore, ICT, Job Descriptions, Skills Matrix, Data & AI, Software Engineering, Strategy & Governance, Upskilling
false
Singapore has clear digital skill and career roadmaps that provide job descriptions and corresponding ICT skills requiredASEAN Growth and Scale Talent Playbook
Header Horizontal
Kearney
View slide
Features column charts detailing newspaper and magazine revenue trends globally and in India from 2020 to 2025.
Market Analysis and Trends
Media & Entertainment
Analyzes declining global trends in newspaper and magazine revenues with a contrasting slight growth in India.
newspaper, magazines, revenue decline, India growth, global trend, 2025 forecast, media industry
false
Newspaper and consumer magazine revenue is expected to decline, -1% CAGR globally but +1.82% CAGR for IndiaGlobal & Entertainment Media Outlook 2021-2025
Multiple Chart
PwC/Strategy&
View slide
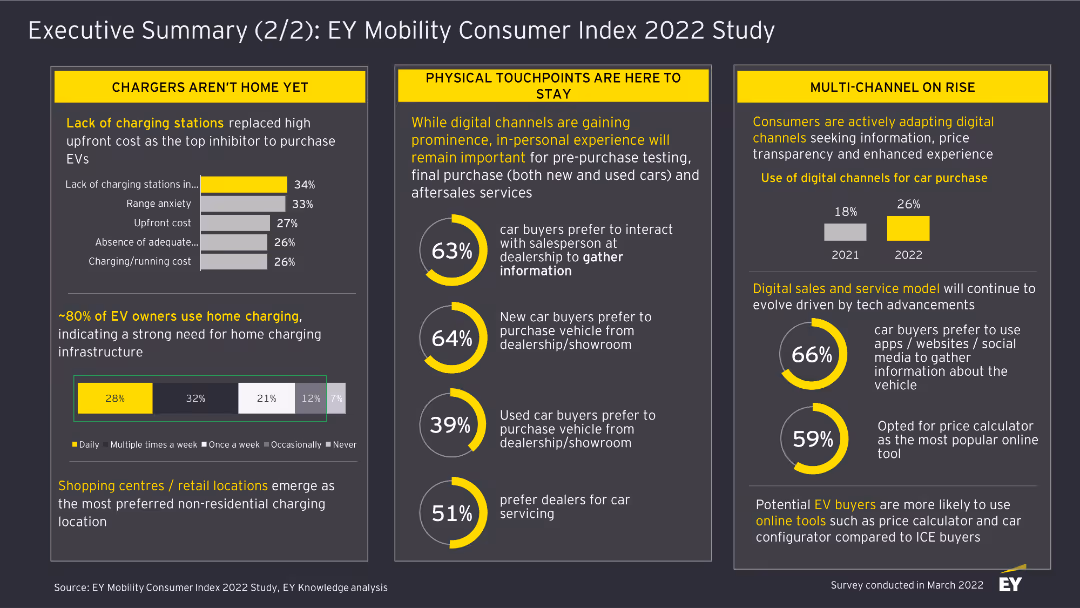
This slide includes column charts and textual highlights. It discusses the challenges in EV adoption, the importance of physical touchpoints, and the rise of digital channels for car purchases.
Market Analysis and Trends
Transportation & Logistics
The slide summarizes findings from the EY Mobility Consumer Index 2022 Study, focusing on barriers to EV adoption, the role of physical touchpoints, and the increasing use of digital channels in car buying.
EV Adoption, Physical Touchpoints, Digital Channels, Car Buying, Transportation, Market Analysis, 2022, Survey, Consumer Trends
false
Executive Summary (2/2): EY Mobility Consumer Index 2022 StudyEY Mobility Consumer Index (MCI) 2022 study
Multiple Chart
EY
View slide
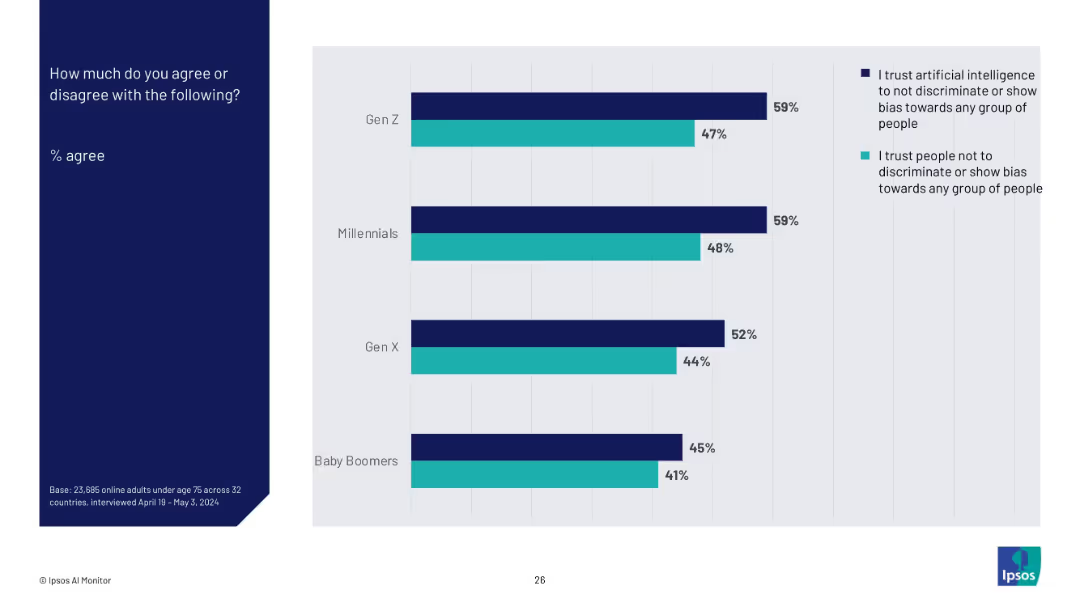
Horizontal bar chart comparing Gen Z, Millennials, Gen X, and Baby Boomers with two colored bars each (AI trust vs. people trust), on a light gray background. Left-aligned title in a dark blue block.
Market Analysis and Trends
Artificial Intelligence
This slide compares generational trust in artificial intelligence versus people regarding fairness and bias. Gen Z and Millennials show higher trust in AI over people, with trust levels gradually decreasing among older generations.
AI trust, generational comparison, bias perception, Ipsos, trust metrics, societal views, survey, discrimination, fairness, 2024 data
false
How much do you agree or disagree with the following?THE IPSOS AI MONITOR 2024
Mixed Chart
IPSOS
View slide
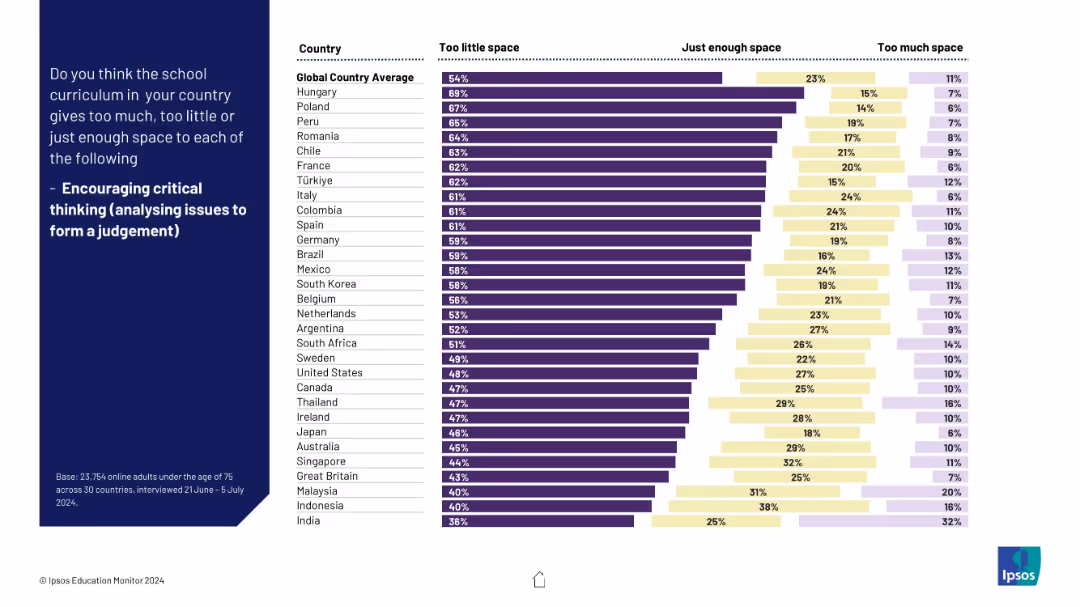
Horizontal bar chart ranking countries by whether curriculum provides too little, enough, or too much focus on critical thinking; three-color legend.
Strategic Planning
Education & Training
The slide presents opinions on whether national curricula allocate sufficient time to critical thinking. Most respondents across countries feel there is too little focus on developing analytical judgment.
critical thinking, education, curriculum, skills, global opinion, too little, judgement, survey
false
Encouraging critical thinking (analysing issues to form a judgement)IPSOS EDUCATION MONITOR 2024
Mixed Chart
IPSOS
View slide
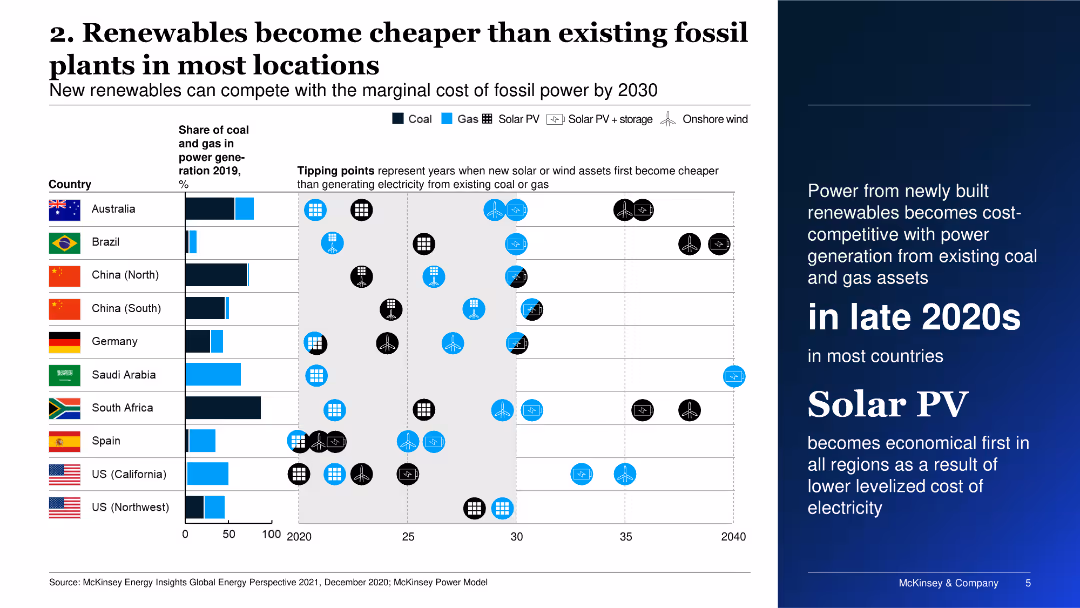
The slide includes a bar chart showing the break-even production cost of clean hydrogen versus incumbent technology across various sectors.
Technology and Digital Transformation
Energy & Utilities
The slide evaluates the cost-competitiveness of clean hydrogen in different sectors, emphasizing the potential for hydrogen to become competitive by 2030.
clean hydrogen, cost-competitive, sectors, 2030, energy
false
2. Renewables become cheaper than existing fossil plants in most locationsGlobal Energy Perspective 2021
Mixed Chart
McKinsey
View slide
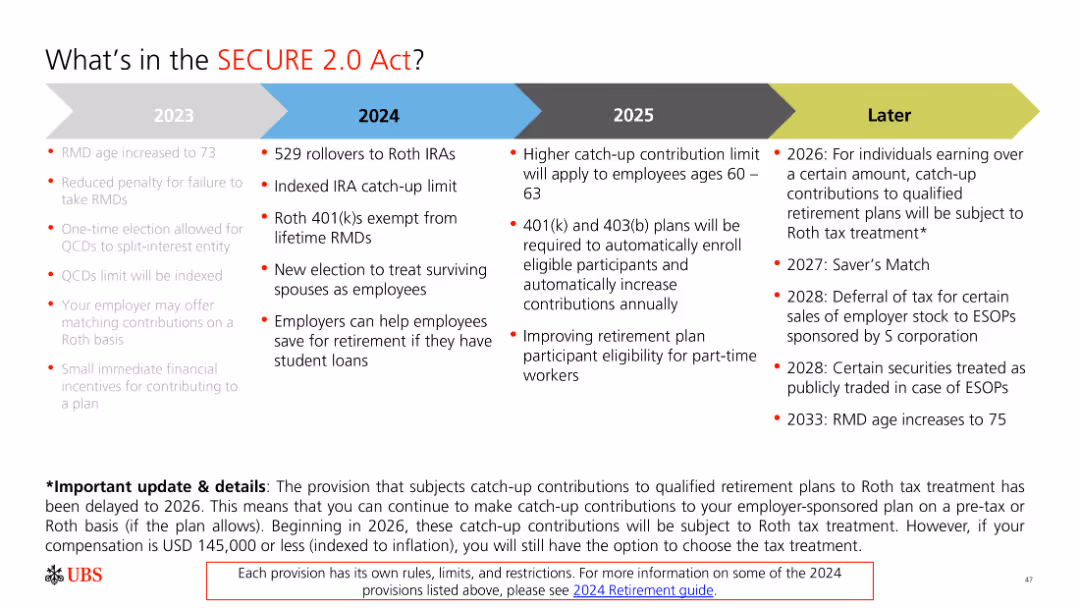
The slide includes a timeline and bullet points with text. It is moderately complex with clear visual differentiation between different years and provisions.
Regulatory and Compliance
Financial Services
The slide outlines key provisions of the SECURE 2.0 Act from 2023 to 2026 and later, emphasizing changes in retirement savings regulations.
SECURE Act, retirement, provisions, 2023, 2024, 2025, 2026
false
What’s in the SECURE 2.0 Act?2024 Retirement guidebook
Linear Flow
UBS
View slide
This slide uses a timeline layout with three phases represented as boxes progressing from left to right. The first phase, "Stabilizing, restructuring and planning (2023)," is in a light beige box. The second phase, "Restructuring, integrating and optimizing (2024 - 2026)," is in a medium beige box. The third phase, "Capturing sustainable growth and long-term value creation," is in a dark grey box. Below each box, there is a short description and a small arrow icon between the phases.
Strategic Planning
Financial Services
The slide outlines a phased plan to achieve long-term growth and value creation. Each phase has specific goals: achieving profitability in 2023, restructuring and optimizing from 2024 to 2026, and sustaining growth and delivering returns beyond 2026. The slide can be used to present a strategic plan to stakeholders.
growth, planning, restructuring, profitability, strategy
false
Executing to capture long-term growth and value creationThird quarter 2023 Fixed Income investor presentation
Linear Flow
UBS
View slide
This slide features a line chart showing the historical Brent prices and future estimates with a sunset backdrop of oil tankers at sea. The visual complexity is moderate, with clear graph lines and color contrasts for readability.
Market Analysis and Trends
Energy & Utilities
The slide discusses the short-term increase in Brent futures due to COVID-19 vaccination programs and OPEC+ actions. It highlights the ongoing scrutiny on vaccine distribution, mobility patterns, and OPEC+ actions affecting oil demand.
Brent futures, OPEC+, COVID-19, oil demand, vaccine
false
Brent futures Brent futures have increased in the short term given global COVID 19 vaccination programs coupled with the continued supply discipline of the OPEC+.EY Price Point: global oil and gas market outlook Q2 | April 2021
Mixed Chart
EY
View slide
This slide shows a set of circular charts displaying Australian consumers' top values in healthcare, such as access to care, cost-effectiveness, and relief from pain and anxiety.
Market Analysis and Trends
Healthcare & Pharmaceuticals
It presents the top values Australian consumers hold in healthcare, emphasizing the importance of access to care, cost-effectiveness, and relief from negative experiences.
Australian consumers, healthcare values, access to care, cost-effectiveness, pain relief
false
‘What matters most to me.’Health care consumer views on value
Mixed Chart
EY
View slide
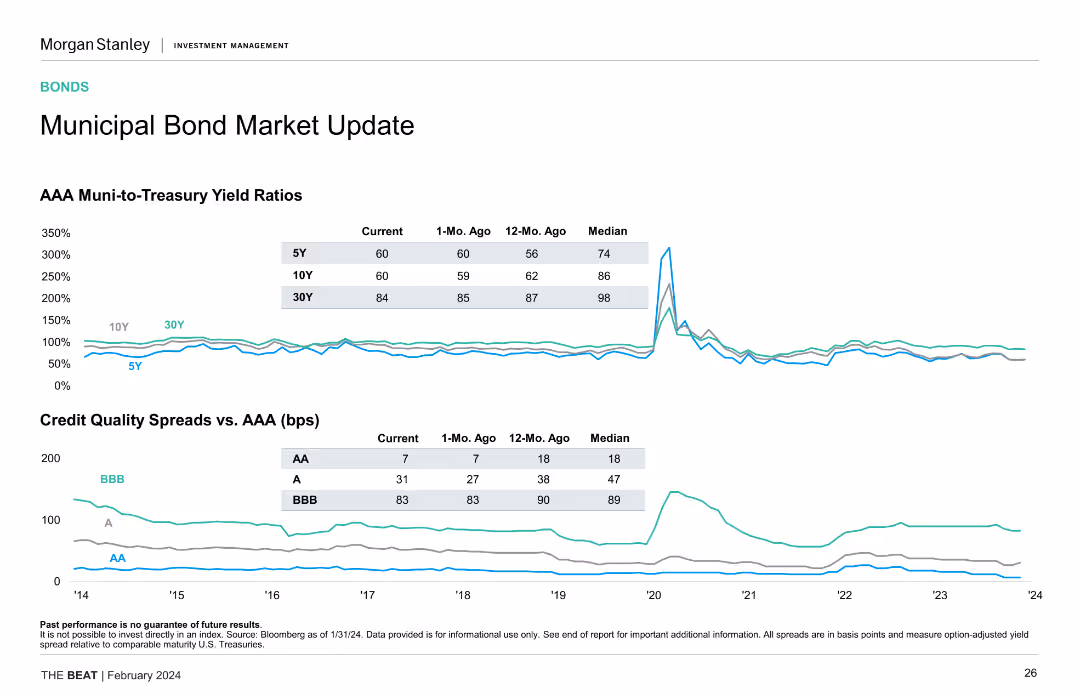
Two line charts are shown: one for AAA muni-to-treasury yield ratios and one for credit quality spreads versus AAA. Data is color-coded by bond rating.
Market Analysis and Trends
Financial Services
The slide updates on the municipal bond market, comparing AAA muni-to-treasury yield ratios and credit quality spreads, highlighting bond performance metrics.
Municipal Bonds, Yield Ratios, Credit Quality, Bond Ratings, Performance
false
Municipal Bond Market Update AAA Muni-to-Treasury Yield RatiosThe BEAT February 2024
Multiple Chart
Morgan Stanley
View slide
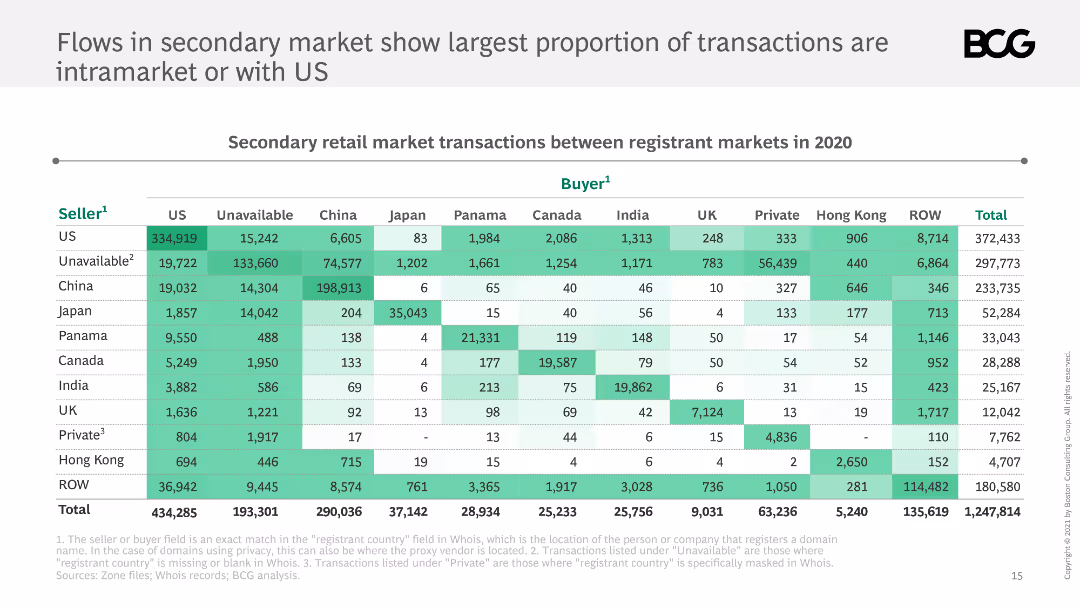
The slide features a table showing secondary retail market transactions between registrant markets in 2020. The table is color-coded with shades of green indicating transaction volumes.
Market Analysis and Trends
Financial Services
This slide presents data on secondary retail market transactions between various registrant markets in 2020, highlighting that the largest proportion of transactions are intramarket or with the US.
secondary market, transactions, registrant markets, US, 2020, intramarket, table, data visualization, BCG
false
Flows in secondary market show largest proportion of transactions are intramarket or with USWhat’s in a (Domain) Name? The $2 Billion Secondary Market for Dot-Com Domains
Table
BCG
View slide
A column chart with blue bars dominates this slide, representing the private funding value across different years, against a background of minimal text.
Investment Analysis
Financial Services
Highlighting the resilience of deal values amidst a decrease in deal activity, this slide suggests a dynamic investment landscape with a focus on high-profile investments.
private funding, deal value, investments, year-on-year, column chart, resilience
false
Despite a ~30% drop in deal activity, deal value grew marginally YoY due to several high-profile investments in new categoriese-Conomy SEA 2022 Through the waves, towards a sea of opportunity
Single Chart
Bain
View slide
Includes multiple column charts tracking interest, loans, and deposits over time.
Financial Performance
Financial Services
Tracks net interest income and average loans and deposits across various banking sectors over sequential quarters.
banking, interest, loans, deposits, financial performance
false
Net Interest Income, Average Loans and DepositsFirst Quarter 2023 Earnings Results Presentation
Multiple Chart
Citigroup
View slide
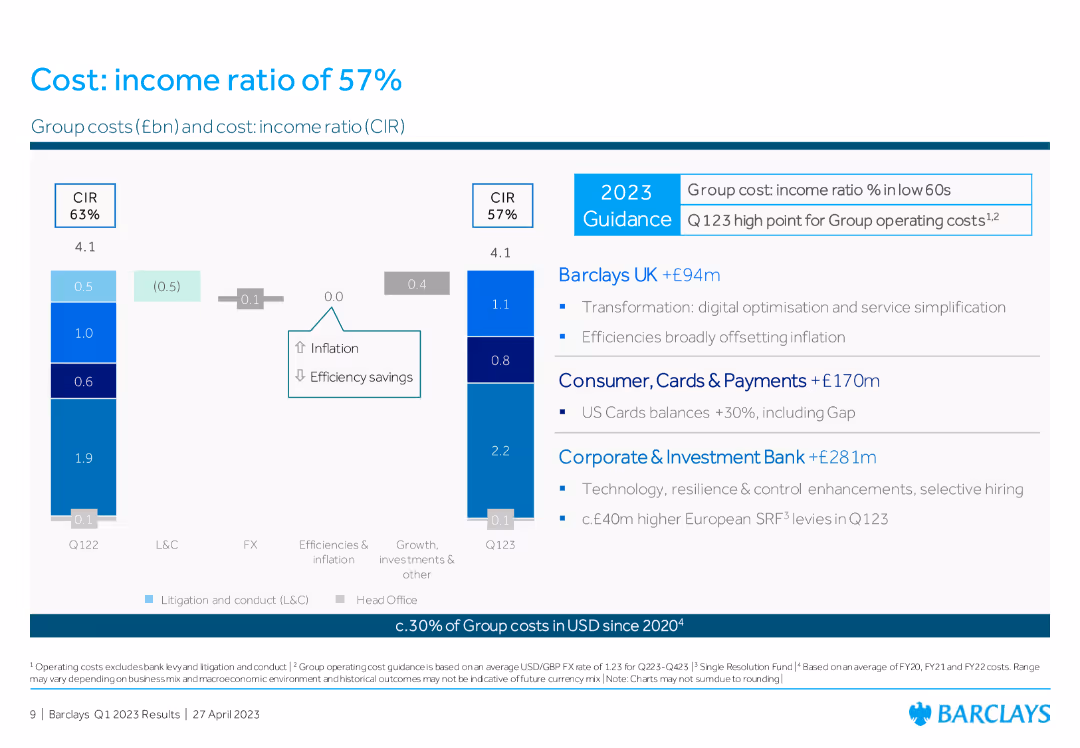
Column chart comparing group costs and cost: income ratio (CIR) between Q1 2022 and Q1 2023, with text boxes summarizing contributions from Barclays UK, Consumer, and CIB.
Operational Efficiency
Financial Services
The slide presents the cost: income ratio of Barclays, illustrating the changes in group costs and highlighting efficiencies and inflation impacts.
cost: income ratio, group costs, operational efficiency, Barclays UK, Consumer, CIB
false
Cost: income ratio of 57%Barclays PLC Q1 2023 Fixed Income Investor Presentation
Multiple Chart
Barclays
View slide
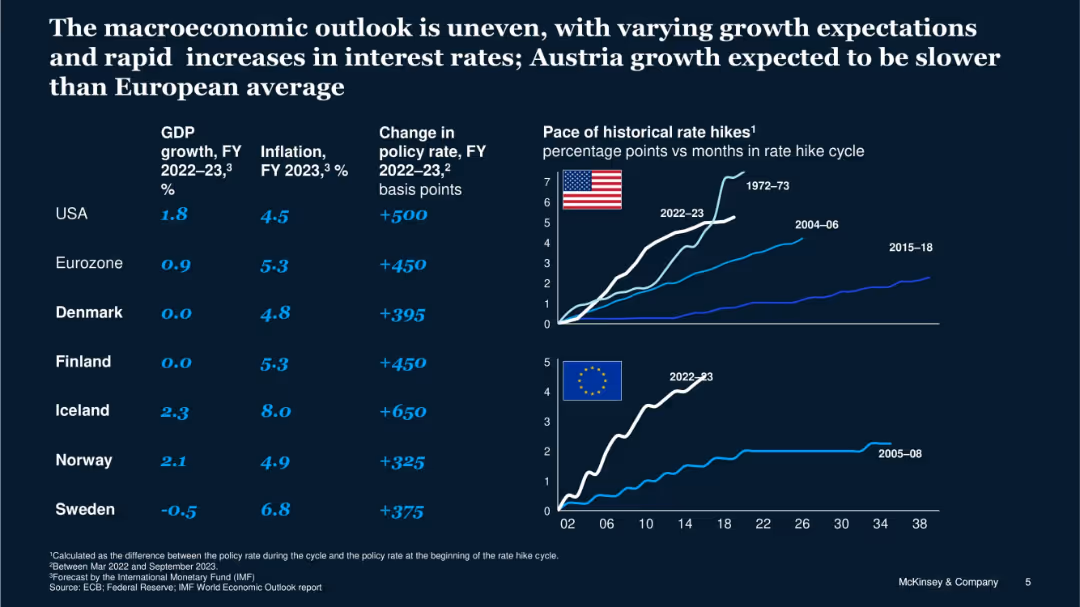
Table of macro indicators by country, and two line charts comparing interest rate hike cycles (US and EU) across decades.
Market Analysis and Trends
Financial Services
This slide reviews recent macroeconomic conditions across select economies, showing varying growth rates and inflation alongside historical policy rate hikes. It notes Austria's lagging growth and contextualizes interest rate shifts in historical perspective.
macroeconomics, growth, inflation, interest rates, rate hikes, policy, Europe, US
false
The macroeconomic outlook is uneven, with varying growth expectations and rapid increases in interest rates; Austria growth expected to be slower than European averageGlobal Banking Annual Review 2023
Multiple Chart
McKinsey
View slide
Structured slide with hexagonal graphics, connecting various business operations aspects centered around commercial banking.
Operational Efficiency
Financial Services
Discusses enhancing client experience and operational excellence in commercial banking by improving onboarding, service channels, and lending processes.
Banking, operational excellence, client experience, service improvement, digital transformation, KYC
false
Relentless focus on client experience and operational excellenceCommercial Banking 2022
Framework
JP Morgan
View slide
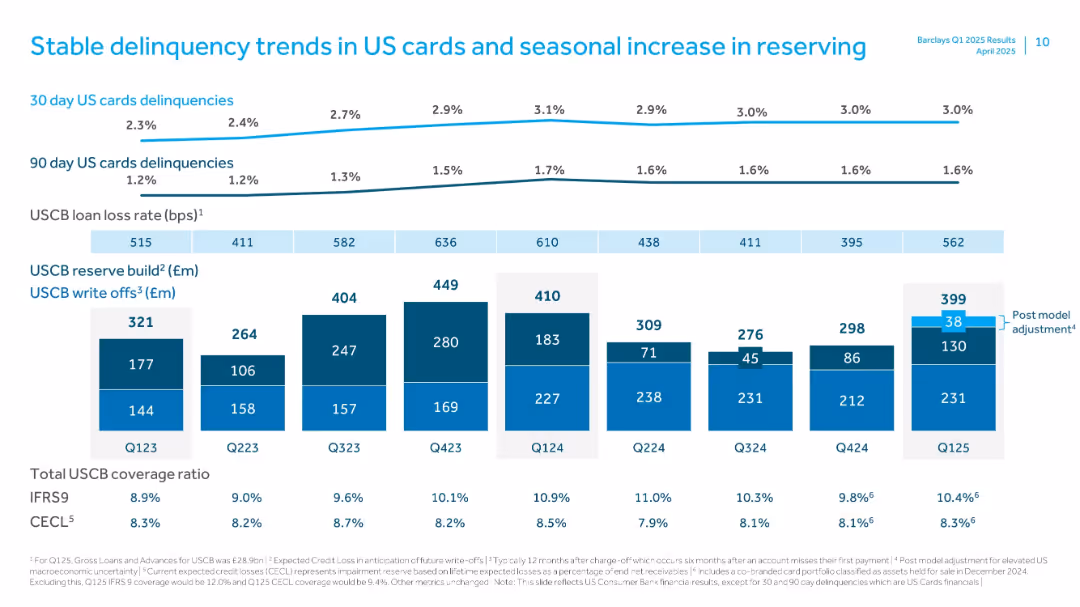
Line and bar graphs tracking delinquencies, loan loss rates, and reserve changes.
Risk Assessment and Management
Financial Services
This slide monitors US card delinquency trends and reserve builds. It shows stable patterns with seasonal variance and discusses reserve ratios and write-offs, particularly under IFRS9 and CECL standards.
delinquency, US cards, loan loss, reserve build, CECL, IFRS9, Barclays, write-offs, credit risk, seasonal trends
false
Stable delinquency trends in US cards and seasonal increase in reservingQ1 2025 Results Presentation
Multiple Chart
Barclays
View slide
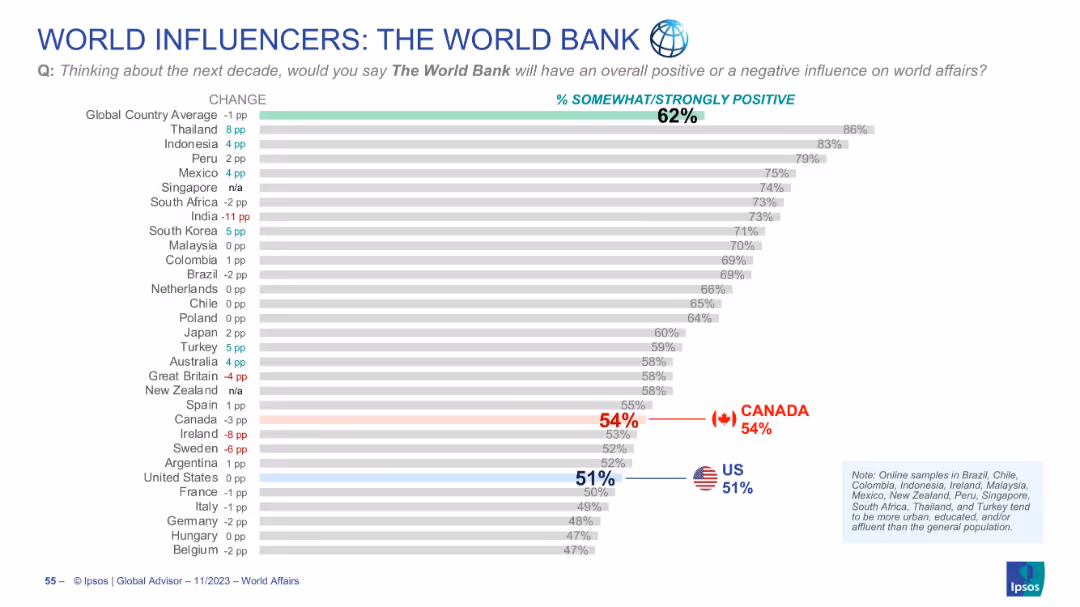
Horizontal bar graph showing opinions on The World Bank’s future global influence
Market Analysis and Trends
Government & Public Sector
Displays perceptions of The World Bank’s role in future global affairs. Canada scores 54%, slightly above the U.S. (51%), both under the global average of 62%. Trends vs last year are noted.
World Bank, global influence, development finance, Ipsos, perception, Canada, US, public opinion, world affairs, bar chart
false
WORLD INFLUENCERS: THE WORLD BANK 🌐WORLD AFFAIRS 2023
Single Chart
IPSOS
View slide
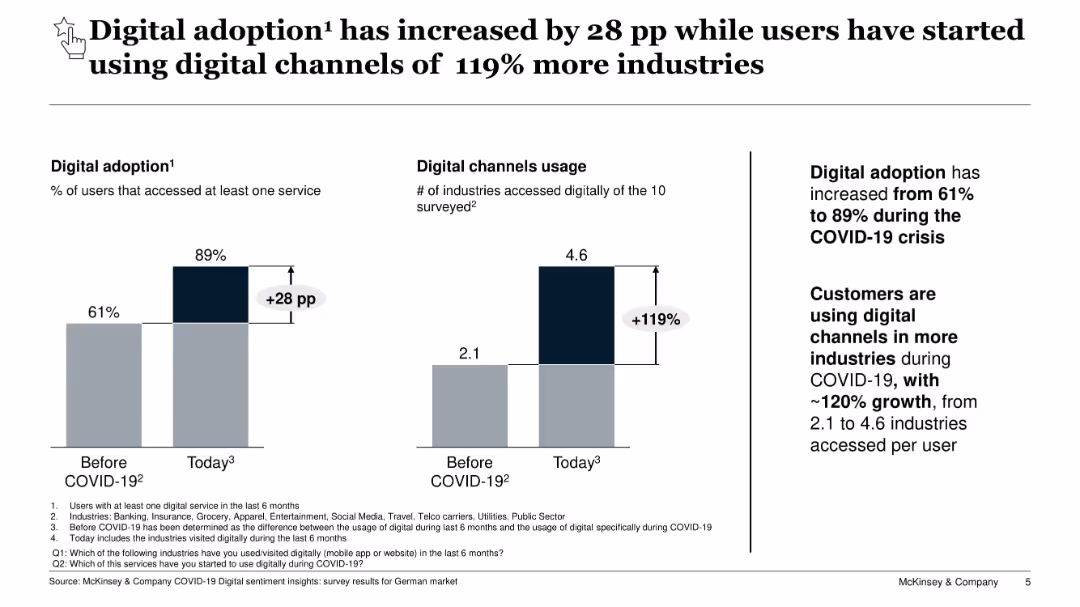
Two side-by-side bar charts showing digital service access pre- and post-COVID. Text emphasizes digital channel expansion.
Technology and Digital Transformation
Technology & Software
Shows a sharp increase in digital adoption and number of industries accessed digitally by users due to COVID-19. Highlights the behavioral shift in consumer engagement across industries in the German market.
digital adoption, COVID-19, consumer behavior, digital transformation
false
Digital adoption¹ has increased by 28 pp while users have started using digital channels of 119% more industriesCOVID-19 Digital sentiment insights
Mixed Chart
McKinsey
View slide
The slide includes a vertical bar chart showing the job titles of survey participants, with an image of a professional woman using a tablet on the right.
Human Resources and Talent Management
Professional Services
Breakdown of survey participants' job titles, indicating a significant presence of C-suite executives.
Job titles, survey participants, C-suite, demographics, HR
false
Job title Chief Executive Officer (CEO)/ PresidentGreece goes the distance, continuing to win investors’ trust
Mixed Chart
EY
View slide
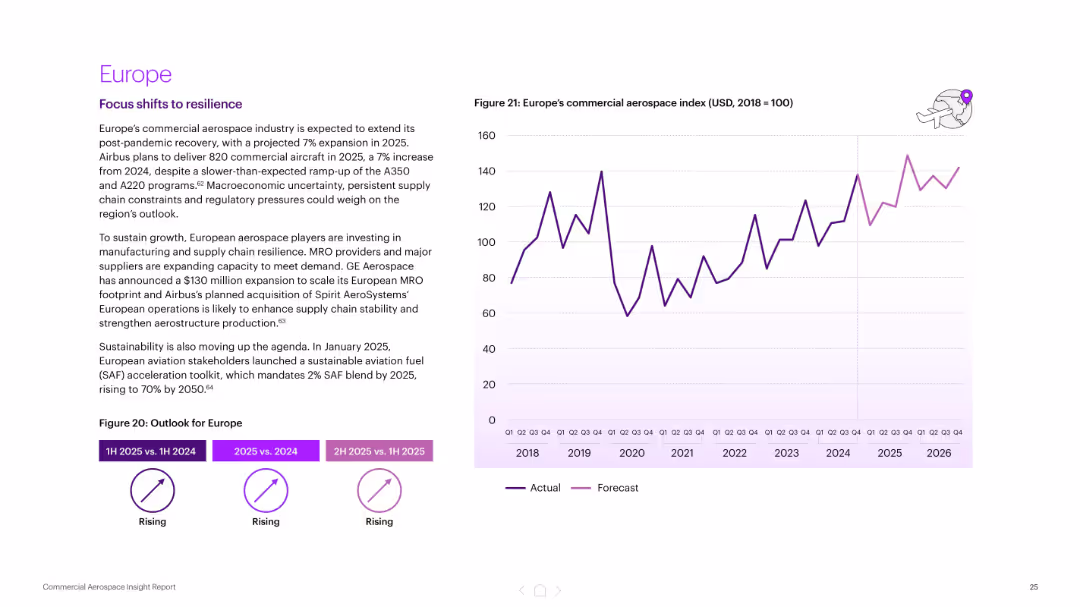
Text section on the left with growth summary; right side graph shows Europe’s aerospace index (2018–2026). Consistent with other regional slides.
Market Analysis and Trends
Industrial & Manufacturing
Forecasts a 7% growth in Europe’s aerospace sector for 2025. Highlights Airbus production targets, supply chain resilience investments, and the introduction of sustainability regulations (SAF blend targets).
Europe, aerospace growth, Airbus, supply chain resilience, sustainability, SAF, forecast, commercial aviation
false
EuropeNavigating uncertain skies Commercial Aerospace Insight Report
Mixed Chart
Accenture
View slide
Timeline showing the projected development of electric and hybrid-electric aviation technologies from 2020 to 2050.
Technology and Digital Transformation
Transportation & Logistics
This slide discusses the challenges and advancements in electrifying the aviation sector. It provides a timeline for the development of electric air taxis, hybrid-electric aircraft, and battery-powered planes, emphasizing their potential to reduce CO2 emissions and transform aviation.
Electric Aviation, Decarbonization, Timeline
false
Electric vehicles are a common sight today, but the aviation sector faces major challenges in decarbonization and electrificationMegatrend 5 - Technology & Innovation
Linear Flow
Roland Berger
View slide
This slide has a blue and green color scheme with a pie chart showing outstanding debt and preferred shares. It contains bullet points with checkmarks and three text sections on the left side. The slide is marked as number 7.
Regulatory and Compliance
Financial Services
The slide presents actions taken for a seamless LIBOR transition, including leadership roles, meeting investor needs, and managing LIBOR exposure. It uses a pie chart to show the composition of outstanding debt and shares, and bullet points for structured information.
LIBOR, transition, debt, shares, derivatives, risk management
false
LIBOR TransitionGoldman Sachs Investor Day
Mixed Chart
Goldman Sachs
View slide
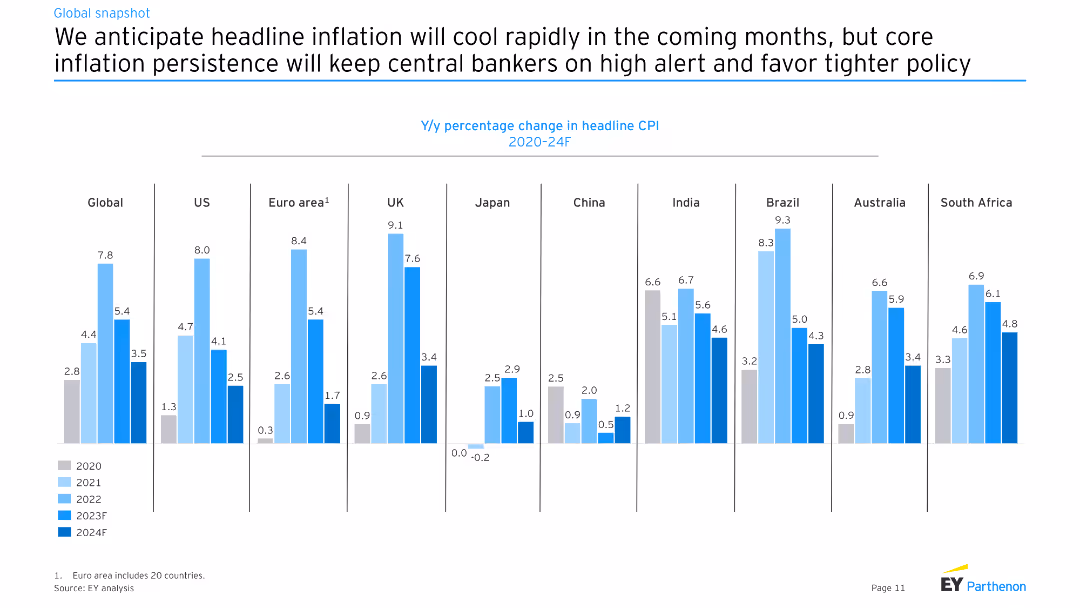
The slide contains a series of vertical column charts showing y/y percentage change in headline CPI for various countries from 2020 to 2024F. The charts are color-coded by year.
Market Analysis and Trends
Financial Services
This slide predicts the cooling of headline inflation in the coming months across major economies but warns that core inflation persistence will require tighter monetary policies.
inflation, CPI, central banks, global economy, forecasts
false
We anticipate headline inflation will cool rapidly in the coming months, but core inflation persistence will keep central bankers on high alert and favor tighter policyGlobal economic outlook Macroeconomic outlook and impact on businesses
Multiple Chart
EY
View slide
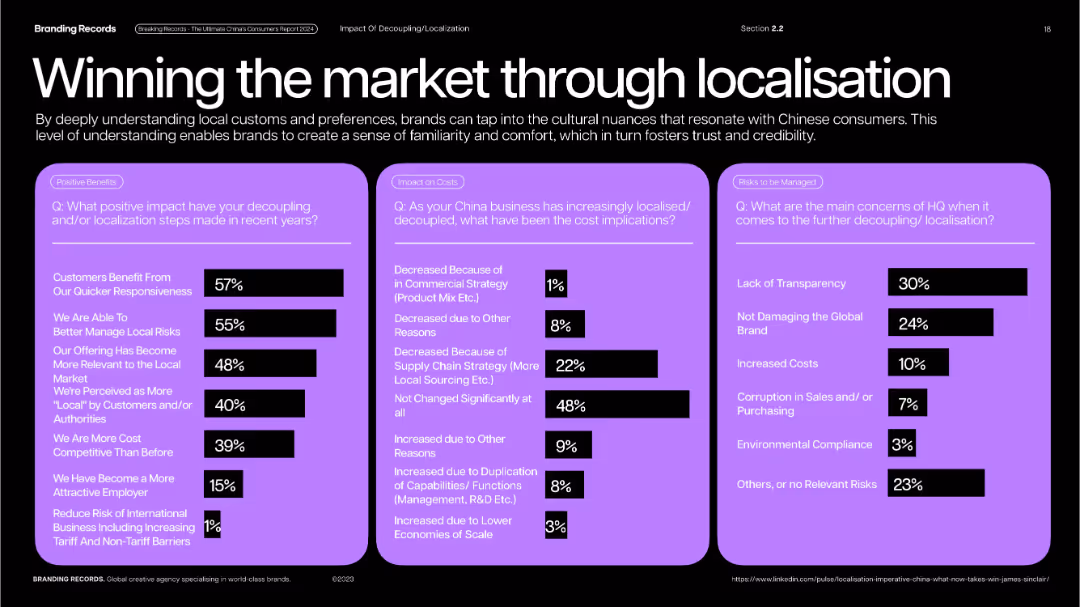
Three-column purple info-box layout; all content in black and white fonts with bar chart percentages.
Strategic Planning
Professional Services
Breaks down benefits, cost impacts, and HQ concerns related to localization in China. Key benefits include responsiveness, risk management, and competitiveness; concerns include transparency and brand integrity.
localisation, decoupling, transparency, cost strategy, risk management, brand relevance
false
Winning the market through localisationBreaking Records Everything Brands needs to know to breakthrough and dominate the Chinese Market in 2024
Single Chart
McKinsey
View slide
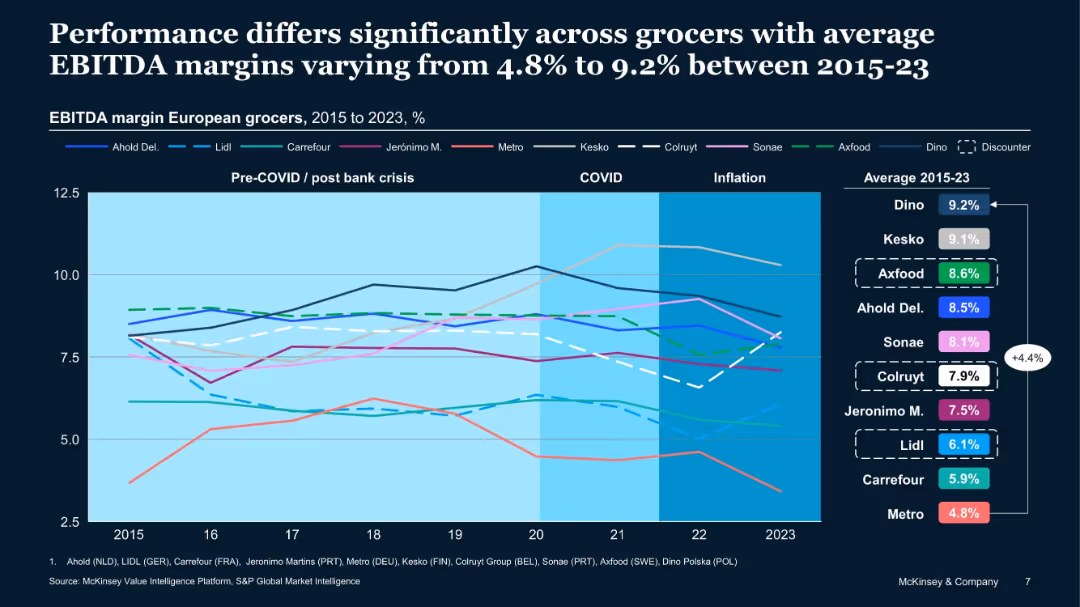
Line graph with multiple company EBITDA trends (2015–2023). Company names color-coded with average EBITDA shown to the right. Background shaded by period (COVID, inflation).
Performance Metrics and KPIs
Retail & E-commerce
Compares performance of major European grocers from 2015 to 2023. Highlights margin variability by company and identifies consistent top performers like Dino and Kesko, while others like Metro underperform. Data contextualized by external shocks.
grocers, margins, KPIs, performance, retailers, comparison
false
Performance differs significantly across grocers with average EBITDA margins varying from 4.8% to 9.2% between 2015-23Grocery profitability outlook –Europe
Single Chart
McKinsey
View slide
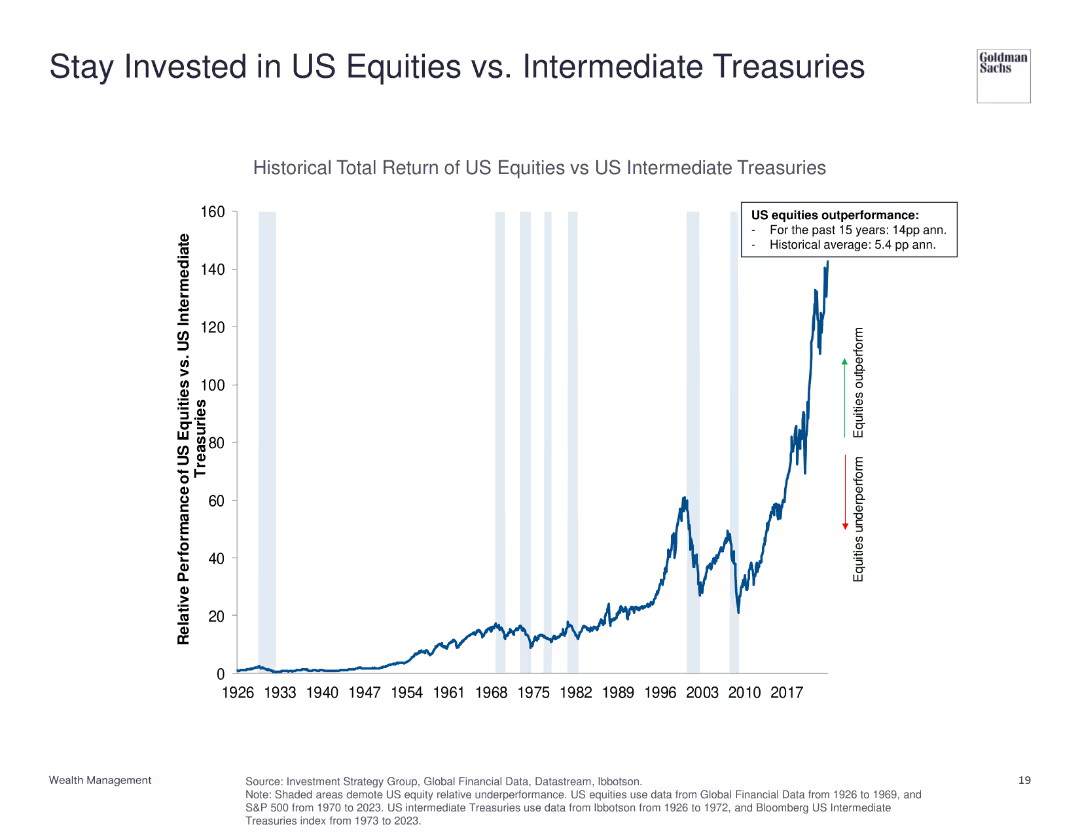
The slide displays a line chart showing the historical total return of US equities versus US intermediate treasuries from 1926 to 2023. Annotations highlight periods of outperformance and underperformance.
Investment Analysis
Financial Services
This slide compares the total return of US equities to US intermediate treasuries, indicating the significant outperformance of equities over the long term.
US equities, intermediate treasuries, historical return, investment, performance comparison
false
Stay Invested in US Equities vs. Intermediate TreasuriesInvestment Strategy Group
Single Chart
Goldman Sachs
View slide
The slide features a prominent image of a person using augmented reality, with text on the right and a trend assessment.
Technology and Digital Transformation
Technology & Software
Highlights the rise of augmented, mixed, and virtual reality, focusing on new opportunities in the consumer industry.
Augmented Reality, Virtual Reality, Mixed Reality, Consumer Industry, Immersive Experience, Virtual Collaboration
false
Virtualisation Web 3.0TrendRadar: The Future Consumer
Multiple Chart
Deloitte
View slide
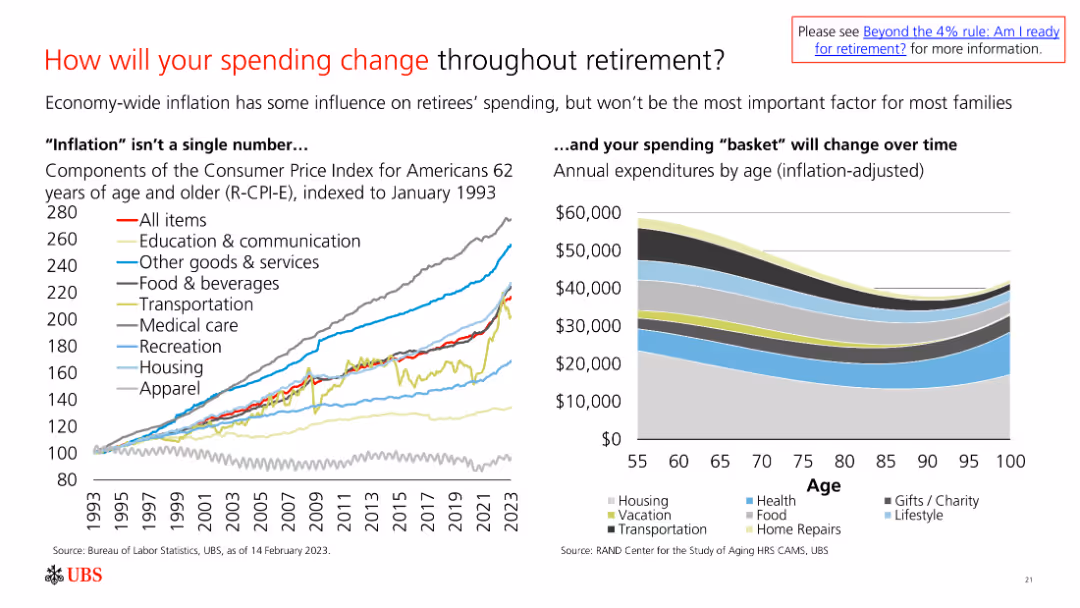
The slide features a line chart showing the Consumer Price Index for different expense categories over time and a bar chart of annual expenditures by age.
Market Analysis and Trends
Financial Services
The slide analyzes spending changes in retirement, influenced by inflation and shifts in expenditure categories, to guide financial planning for retirees.
Retirement, Spending, Inflation, Expenses, Financial Planning
false
How will your spending change throughout retirement?2024 Retirement guidebook
Multiple Chart
UBS
View slide
Contains a color-coded map of Australia with detailed GDP uplift and job creation figures for each state and territory. Various colors represent different levels of economic benefit.
Market Analysis and Trends
Telecommunications
Analyzes the economic benefits of the nbn network across Australia, detailing GDP uplift, job creation, and business development in each state and territory from 2012 to 2022.
nbn, Economic, Australia, States, GDP
false
The nbn network is enabling improved economic outcomes across all of Australia’s states and territoriesThe economic and social impact of investment in the nbn network Key Insights Report
Graphic
Accenture
View slide
Circle charts with net positive/negative financial statuses compared across SEA countries.
Market Analysis and Trends
Financial Services
The slide compares the financial status of respondents to a year ago, indicating a general decrease in financial wellbeing.
financial status, SEA, comparison, circle chart, survey
false
COMPARED TO A YEAR AGO, ABOUT 1 IN 3 ARE FINANCIALLY WORSE OFFIPSOS SEA AHEAD SHIFTS & SENTIMENTS
Multiple Chart
IPSOS
View slide
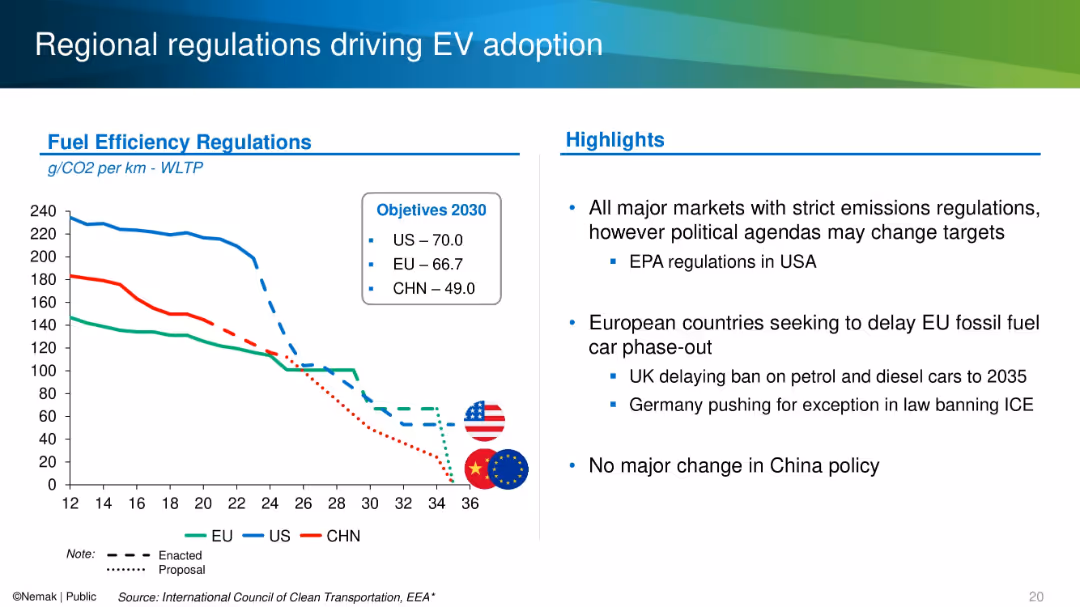
Line graph on the left and bullet point highlights on the right, using flags and color-coded emission trend lines.
Regulatory and Compliance
Industrial & Manufacturing
The slide compares emission regulations across the US, EU, and China, showing declining CO₂ per km targets through 2030. It discusses political influences on timelines, such as delays in Europe and regulatory stance in China and the U.S.
emissions, regulation, EV, fuel efficiency, CO₂ targets, policy
false
Regional regulations driving EV adoption2024 Barclays ESG Conference
Mixed Chart
Barclays
View slide
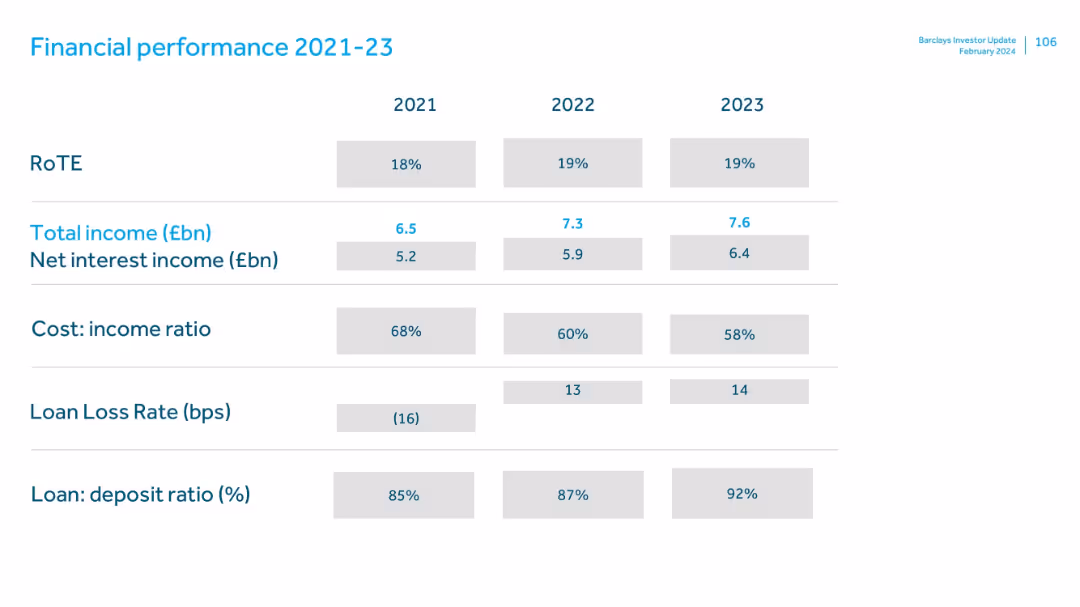
Grid layout with grey and blue text boxes; metrics shown in columns by year for 2021–2023.
Financial Performance
Financial Services
Displays Barclays UK's key financial metrics over three years, including RoTE, income, cost ratios, loan loss rate, and deposit ratios. It shows steady income growth and operational efficiency improvements.
RoTE, total income, cost ratio, loan loss, deposits, trends, Barclays
false
Financial performance 2021–23Barclays UK Investor Update: 20th February 2024
Single Chart
Barclays
View slide
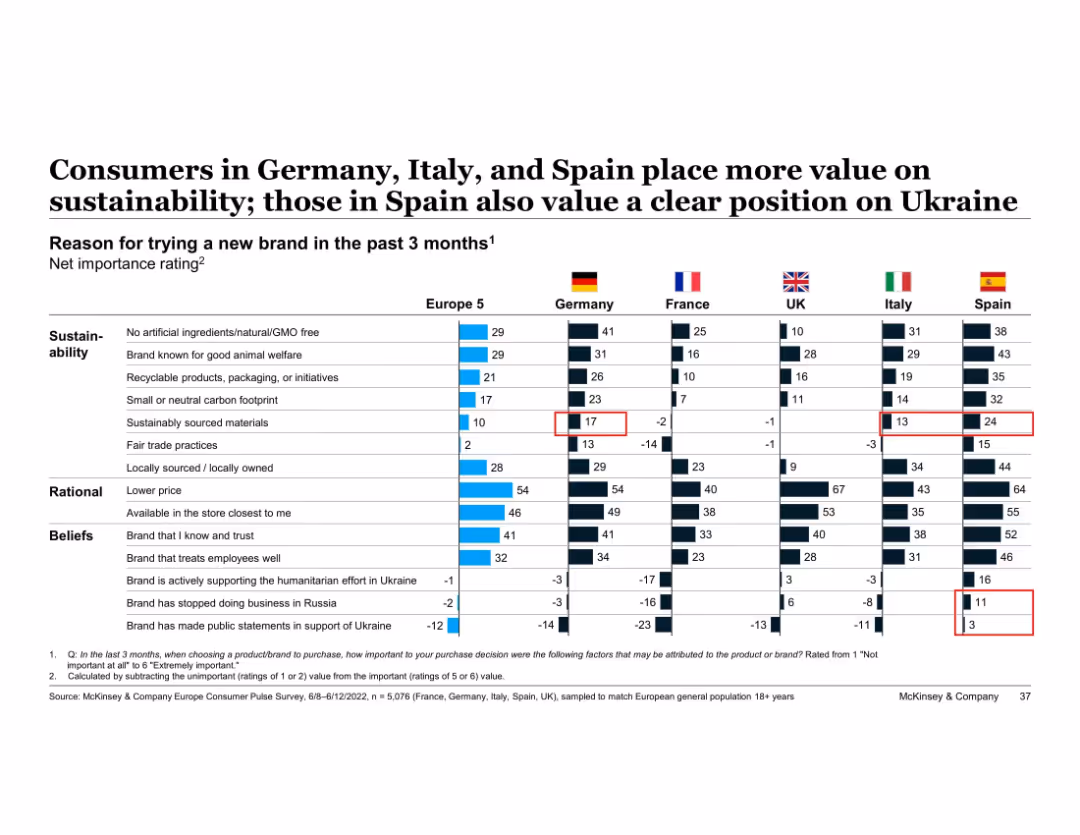
Table showing net importance ratings across five countries for brand trial reasons
Market Analysis and Trends
Consumer Goods
Shows comparative net importance ratings for why consumers tried new brands, across countries. Sustainability ranks high in Germany, Italy, and Spain; Spain also values brand stance on Ukraine.
sustainability, brand trial, international comparison, ethical values, Spain, Germany, consumer reasons, McKinsey
false
Consumers in Germany, Italy, and Spain place more value on sustainability; those in Spain also value a clear position on UkraineEuropean Consumer Sentiment Survey: How current events in Europe are shaping consumer behavior
Single Chart
McKinsey
View slide
This slide is a bold title slide with the statement 'MAKE INNOVATION ACCESSIBLE TO ALL' prominently displayed. The background features a high-contrast image of a robotic dog, signifying cutting-edge technology. The slide employs a dark backdrop with teal highlights and is part of the 2022 ESG report series, indicated in the top left corner. It includes the page number '28' at the bottom right.
Strategic Planning
Technology & Software
This title slide encapsulates the firm's commitment to ensuring that innovation is inclusive and benefits society at large. It serves as an introduction to the firm's initiatives in making technology and innovative practices accessible to all segments of society, highlighting the theme of inclusivity in innovation. The use of a robotic dog image serves as a metaphor for advanced technology and the potential of digital transformation.
innovation, accessibility, technology, inclusion, ESG report
false
Make Innovation Accessible to All2022 Environmental, Social, Governance Report
Title
Booz Allen Hamilton
View slide
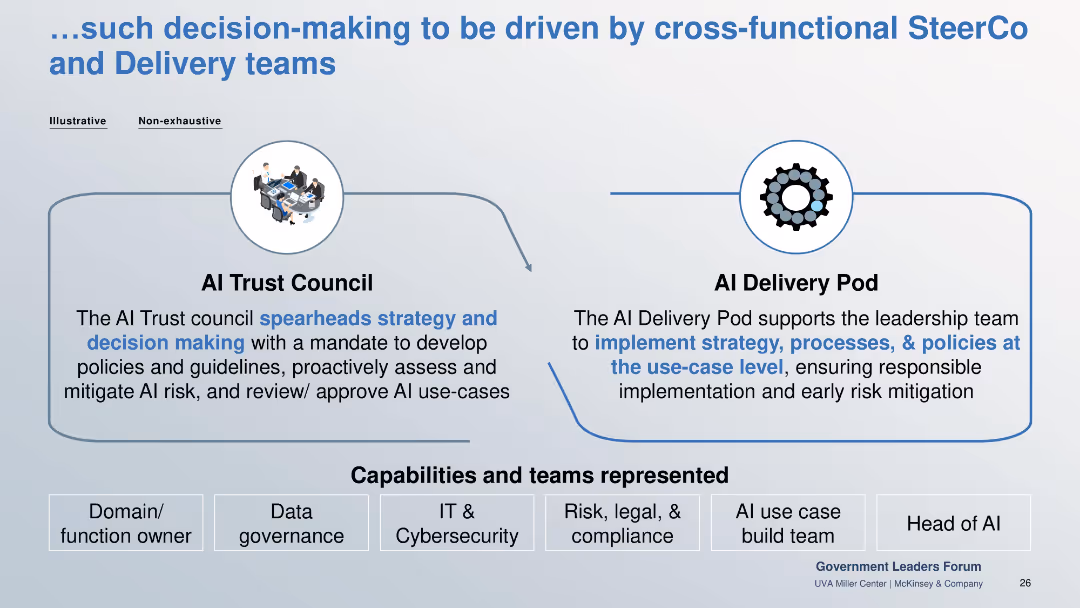
Two-box structure for AI Trust Council and AI Delivery Pod. Capabilities listed below include cybersecurity, legal, and AI use case teams.
Organizational Structure and Change
Government & Public Sector
Describes decision-making structure for responsible AI: a strategy-setting AI Trust Council and execution-focused AI Delivery Pod, backed by multidisciplinary teams.
AI council, delivery pod, cross-functional, risk mitigation, governance, compliance
false
…such decision-making to be driven by cross-functional SteerCo and Delivery teamsResponsible AI and Gen AI
Linear Flow
McKinsey
View slide
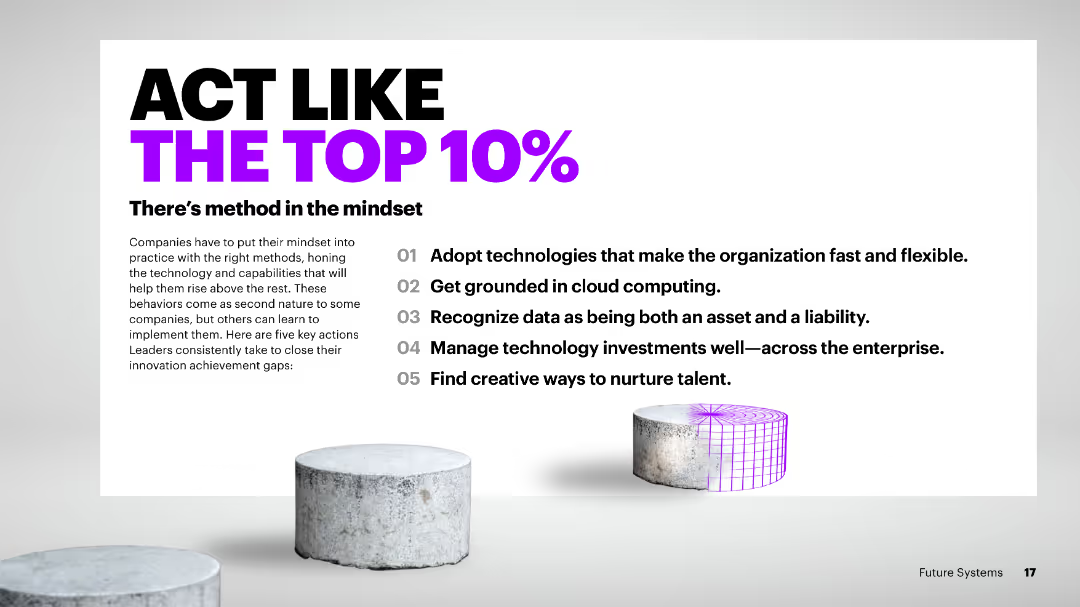
A single-column slide with text listing the key actions leaders take to close innovation gaps.
Strategic Planning
Technology & Software
The slide outlines five key actions that top-performing companies undertake to foster innovation, including adopting flexible technologies, investing in cloud computing, and nurturing talent creatively.
top 10%, innovation, key actions, flexible technologies, cloud computing, talent, strategies, performance, closing gaps, foster
false
ACT LIKE THE TOP 10%FULL VALUE. FULL STOP How to scale innovation and achieve full value with Future Systems
Vertical Flow
Accenture
View slide
Includes tables and a process flow chart describing various service delivery models and their characteristics.
Operational Efficiency
Professional Services
Examines service delivery models focusing on efficiency, effectiveness, and the optimal allocation of tasks.
service delivery, efficiency, optimization, global, local
false
Service Delivery ModelStrategic Cost Transformation Grab’n Go session
Boxed
Deloitte
View slide
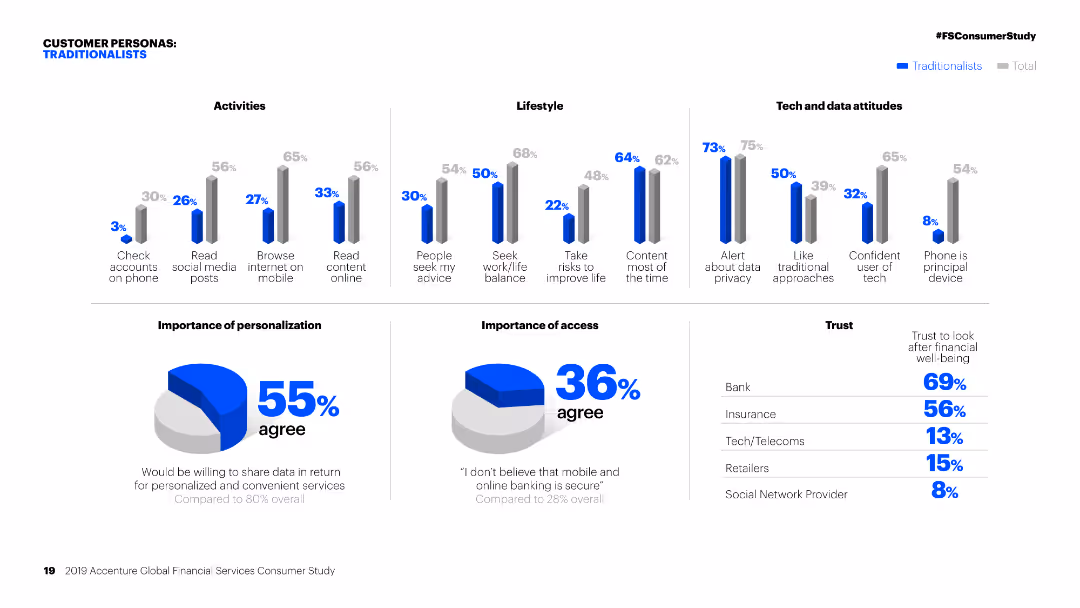
Column charts showing activities, lifestyle, and tech attitudes of 'Traditionalists' compared to the total. Pie charts on personalization and access.
Customer and Market Segmentation
Financial Services
Detailed segmentation of 'Traditionalists' in financial services, focusing on their activities, lifestyle, attitudes towards tech, and personalization preferences.
Personas, financial services, segmentation, traditionalists, activities, lifestyle, tech attitudes, personalization, market study, access
false
CUSTOMER PERSONAS: TRADITIONALISTS2019 Accenture Global Financial Services Consumer Study DISCOVER THE PATTERNS IN PERSONALITY
Multiple Chart
Accenture
View slide
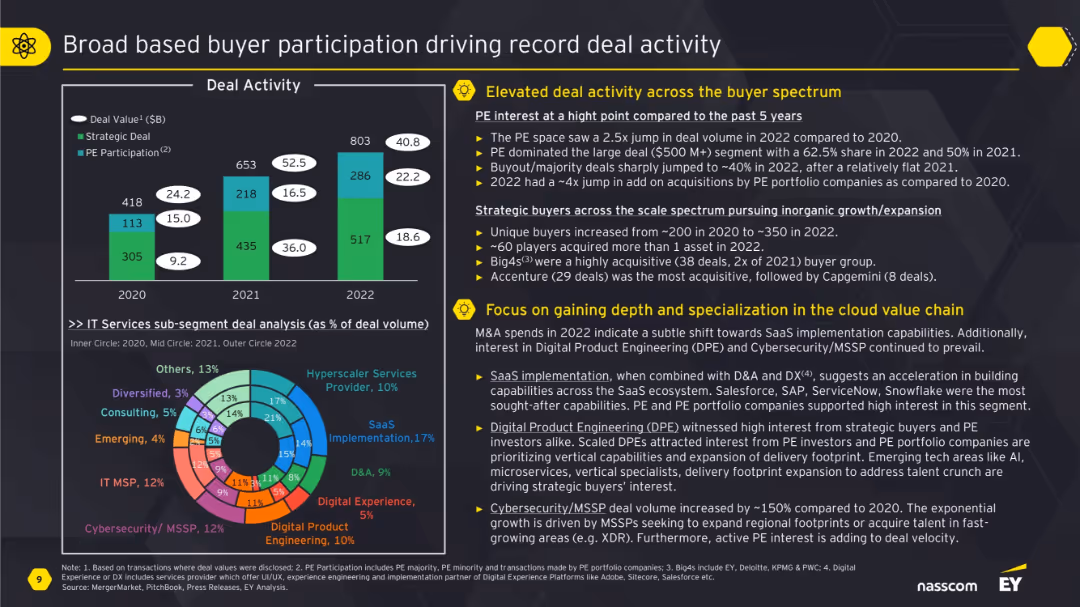
Includes a bar graph, circular sub-segment chart, and bullet-point commentary. Emphasizes data and themes with yellow callout icons on a dark grey background.
Mergers and Acquisitions
Technology & Software
This slide analyzes deal activity by buyer type, showing strong growth in both strategic and private equity investment across IT services. It highlights increased interest in SaaS, digital product engineering, and cybersecurity. The pie chart reveals sub-segment shares within IT services, while bullet points emphasize rising buyer diversity and specialization in cloud-related domains.
deal activity, private equity, SaaS, cloud, cybersecurity, M&A, buyers
false
Broad based buyer participation driving record deal activityA Year of Paradoxes: M&A Trends and Outlook in the Technology Services Sector
Multiple Chart
EY
View slide
A column chart illustrating the reduction in operating expenses in millions, with percentage changes and explanatory side notes.
Operational Efficiency
Financial Services
The slide discusses the execution of cost-reduction strategies, resulting in a 5% decrease in underlying operating expenses quarter-over-quarter.
operating expenses, cost reduction, QoQ, efficiency, financial strategy
false
Executing on cost ambitions with underlying operating expenses down 5% QoQFirst quarter 2024 Financial results
Mixed Chart
UBS
View slide
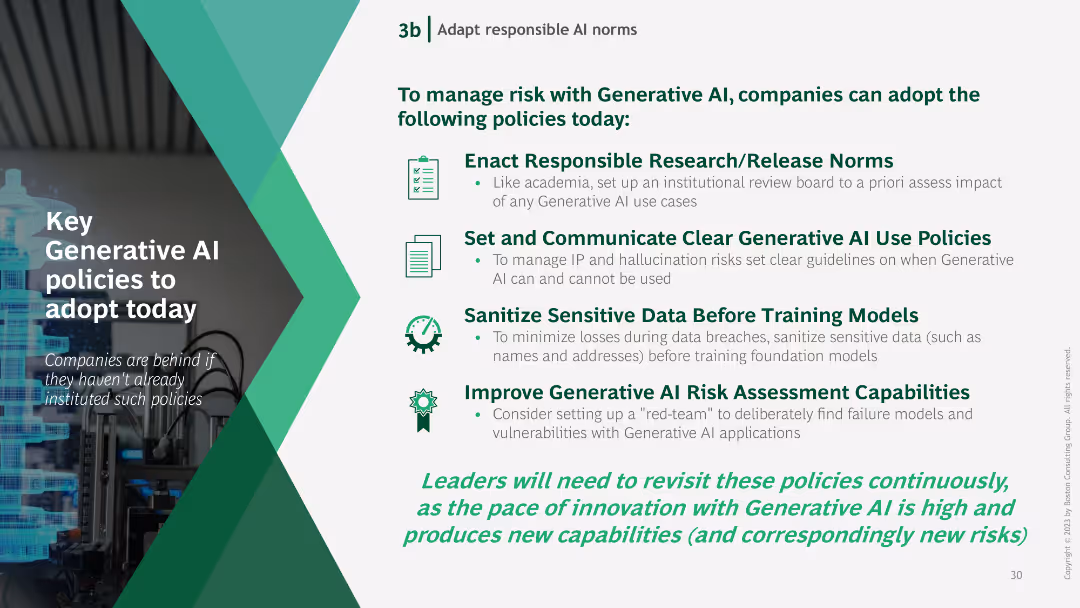
Text-based slide with bullet points outlining key policies for managing Generative AI risks, accompanied by icons representing each policy.
Regulatory and Compliance
Technology & Software
The slide lists essential policies for managing Generative AI risks, including responsible research norms, clear use policies, data sanitization, and risk assessment improvements.
Generative AI, policies, risk management, research norms, data sanitization
false
To manage risk with Generative AI, companies can adopt the following policies today:Women-led startups losing across the board: from creation to funding, in all key European markets
Vertical Flow
BCG
View slide
Contains a column chart comparing the corporate perception of France over the years with key quotes from executives.
Investment Analysis
Professional Services
Evaluates the perception of France as an investment destination among top business executives, reflecting on its strengths and weaknesses.
Investment, Business Environment, Executive Opinions, Corporate Headquarters
false
52% of respondents think that the perception of France by their corporate headquarters is either good or excellent, down 12 points since the 2021 recordBAROMETER AmCham-Bain 2024
Mixed Chart
Bain
View slide
Detailed analysis and graphics representing offshore and onshore wind energy opportunities, with emphasis on geographical and financial aspects.
Investment Analysis
Energy & Utilities
Analysis of offshore wind project development opportunities, highlighting geographical benefits and expected returns.
wind energy, offshore, investment opportunities, SEA, project returns
false
Attractive investment opportunity in offshore project development due to higher return and potential, selective opportunity in operating onshore projectsSoutheast Asia’s Green Economy 2022 Report
Table
Bain
View slide
This slide includes a map and column charts showing the number of gaseous and liquid HRS globally, highlighting operational status and future plans.
Operational Efficiency
Energy & Utilities
The slide maps out existing H₂ production and distribution infrastructure, noting the phase-out of liquid HRS and the focus on gaseous systems for mobility.
H₂, Infrastructure, Mobility, Gaseous, Liquid HRS
false
Current H2 infrastructure for mobility is exclusively made of gaseous HRS – All liquid HRS were experimental and are now out of order with no further plansRoland Berger views on H2 market development
Multiple Chart
Roland Berger
View slide
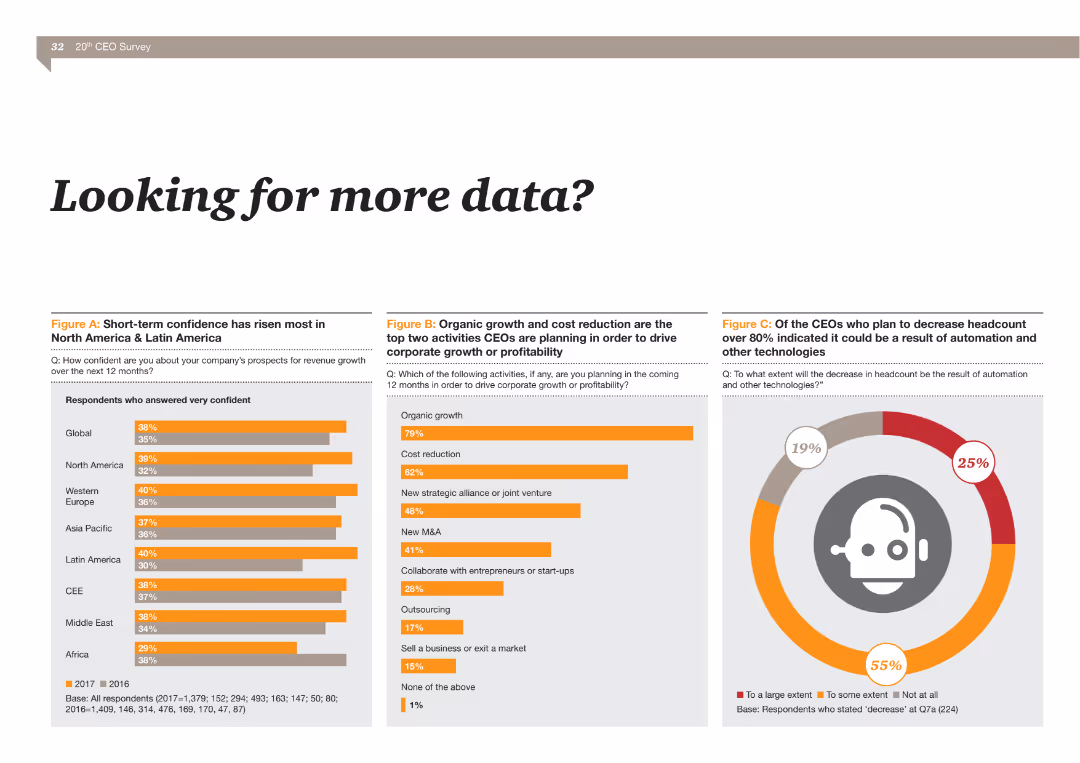
The slide contains a bar chart showing the percentage of respondents confident in their company's revenue growth prospects across various regions, with notable increases in North America and Latin America.
Market Analysis and Trends
Financial Services
This slide presents data on the short-term confidence of CEOs in different regions, showing significant increases in confidence in North America and Latin America regarding their company's revenue growth prospects over the next 12 months.
Confidence, revenue growth, North America, Latin America, financial services, market analysis
false
Looking for more data?20 years inside the mind of the CEO... What’s next?
Multiple Chart
PwC/Strategy&
View slide
This slide has a text section and a bar chart. It visually represents the positive and negative impacts of political and social discussions at work as perceived by employees. The chart uses contrasting colors to differentiate between positive and negative impacts.
Organizational Structure and Change
Government & Public Sector
Explores the specific effects of discussions about political and social issues on employees' work environment, highlighting both the benefits, such as increased empathy and open-mindedness, and the drawbacks, like increased stress and isolation.
discussion impacts, workplace environment, empathy, stress
false
These conversations help employees understand each other, though employers need strategies to avoid negative impactsGlobal Workforce Hopes and Fears Survey 2022
Single Chart
PwC/Strategy&
View slide
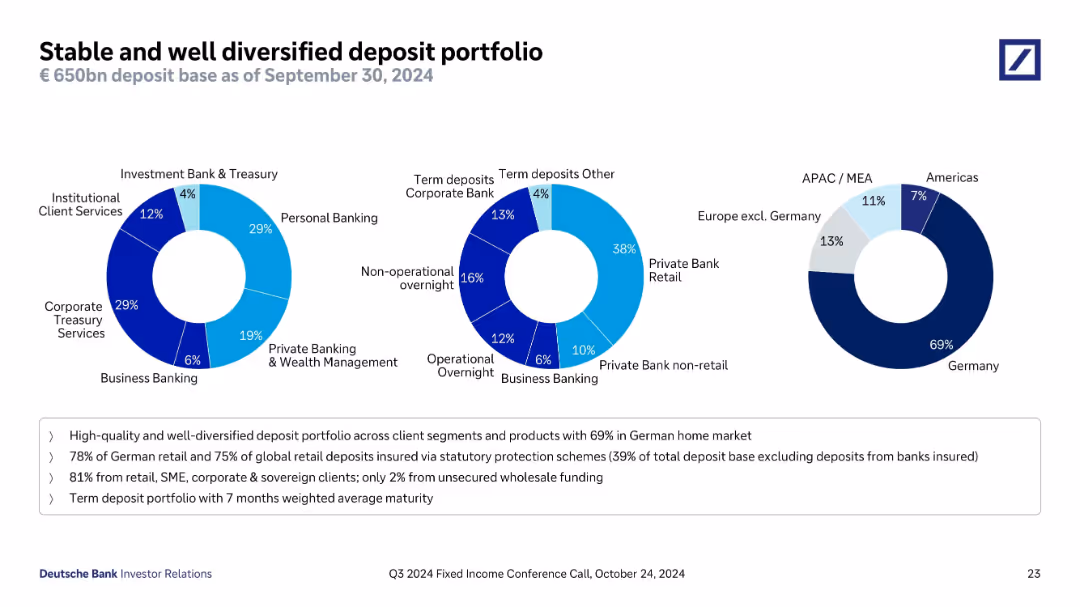
Three donut charts presenting €650bn deposit base by segment, product type, and region; bullet-point summary at the bottom.
Financial Performance
Financial Services
As of Q3 2024, Deutsche Bank’s €650bn deposit base is highly diversified—69% from Germany, 81% from stable client groups. Product mix includes a significant portion in retail and term deposits, with an average 7-month maturity, reflecting a stable, low-risk funding foundation.
deposit portfolio, diversification, Germany, retail deposits, funding stability
false
Stable and well diversified deposit portfolioQ3 2024 Fixed Income Investor Conference Call
Mixed Chart
Deutsche Bank
View slide
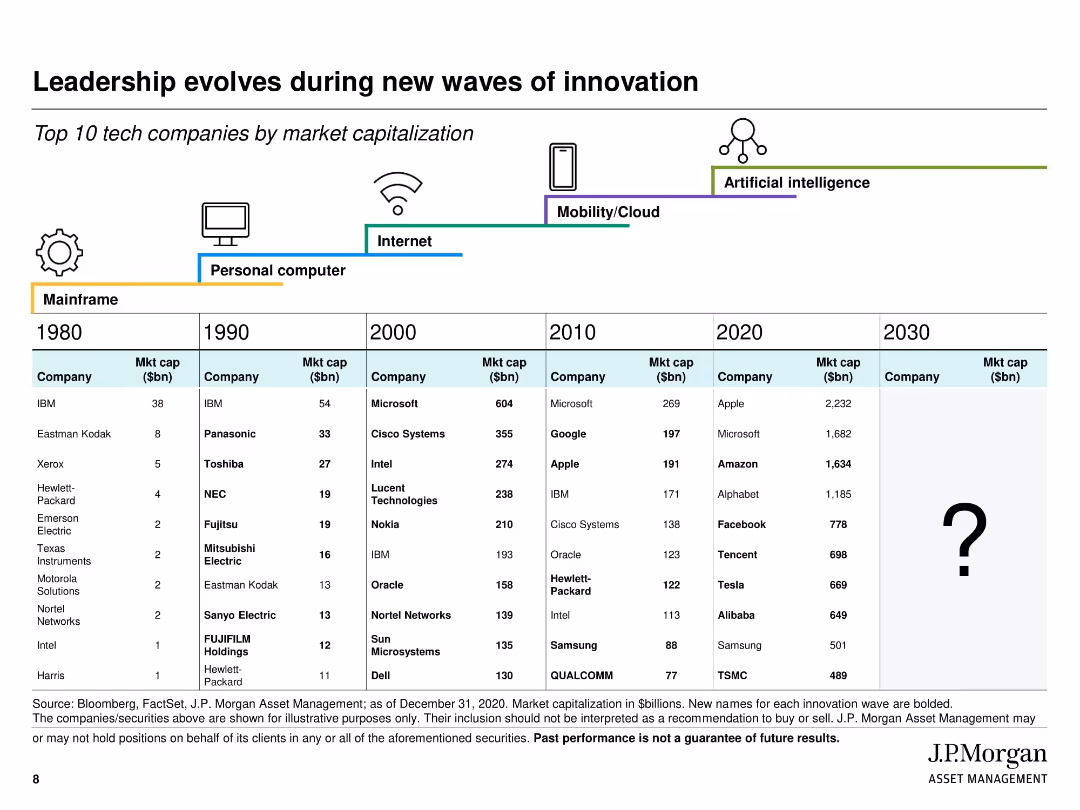
Timeline chart with vertical columns of top 10 tech companies by market cap by decade (1980–2030 projection); icons representing tech eras
Market Analysis and Trends
Technology & Software
Charts the evolution of top technology companies by market capitalization across major innovation waves (Mainframe to AI). Visuals include a tech-era timeline and bolded companies as new leaders. The slide conveys how market leadership shifts over time, emphasizing adaptation to technological disruption.
technology, innovation, market cap, top companies, leadership, disruption, historical trends, J.P. Morgan
false
Leadership evolves during new waves of innovationJ.P. Morgan US Technology Leaders Strategy
Table
JP Morgan
View slide
The slide includes a vertical bar chart showing levels of concern about the environmental emergency across various demographic groups.
Market Analysis and Trends
Environmental Services & Sustainability
Breakdown of concern about the environmental emergency by gender, age, marital status, education, income, and working status, indicating broad agreement across groups.
Environment, demographics, concern, survey, global trends
false
Concern about the environmental emergency is ubiquitous across demographic groupsA NEW WORLD DISORDER?
Mixed Chart
IPSOS
View slide
Comprises two bar charts assessing the importance of geopolitical and macro factors in the US equity market. Each chart uses green, red, and teal colors to indicate investor sentiments.
Investment Analysis
Financial Services
Evaluates the key factors that investors consider critical for the US equity market, including interest rate policies and geopolitical risks, and how these perceptions influence market optimism.
US equity market, interest rates, geopolitical risks, investor sentiment
false
Investors view the equity market as too optimistic regarding the interest rate policy and upcoming elections, both of which are expected to influence the market the mostBCG Investor Perspectives Series
Multiple Chart
BCG
View slide
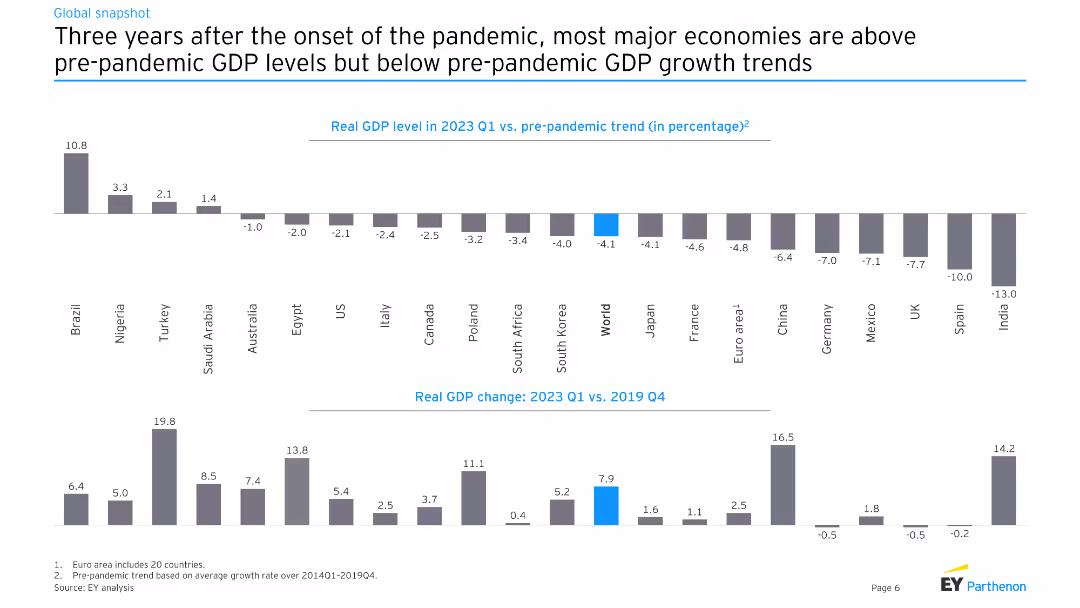
This slide features two charts: one showing the real GDP level in 2023 Q1 versus pre-pandemic trends for various countries, and another showing real GDP change from 2023 Q1 versus 2019 Q4.
Market Analysis and Trends
Financial Services
The slide compares real GDP levels and changes post-pandemic, analyzing how different economies have recovered relative to pre-pandemic trends, providing insights into economic resilience and recovery rates.
GDP, pre-pandemic, trend, recovery, economy, global
false
Three years after the onset of the pandemic, m ost major economies are above pre pandemic GDP levels but below pre pandemic GDP growth trendsGlobal economic outlook Macroeconomic outlook and impact on businesses
Multiple Chart
EY
View slide
Bar and line combination chart tracking revenue, expenditure, and fiscal deficit as a % of GDP from 2016 to H1 2024.
Corporate Finance and Valuation
Government & Public Sector
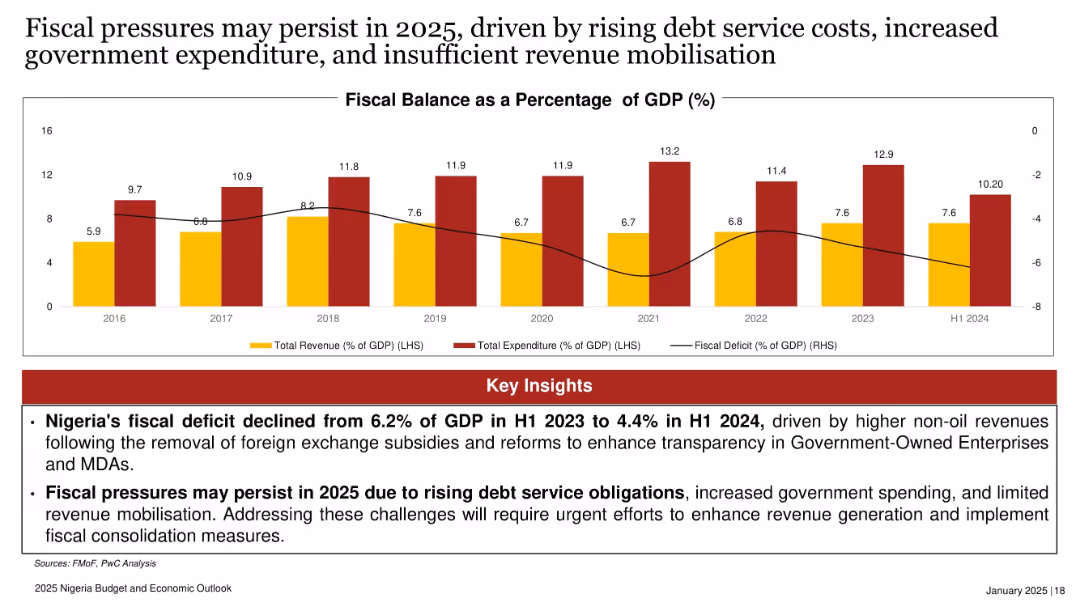
Despite a reduction in the fiscal deficit from 6.2% to 4.4% of GDP in H1 2024, fiscal pressures are expected to continue in 2025 due to rising debt service, high spending, and limited revenue generation. Reforms are needed to stabilize public finances.
fiscal deficit, revenue, expenditure, GDP, Nigeria, debt service, fiscal reform
false
Fiscal pressures may persist in 2025...2025 Nigeria Budget and Economic Outlook
Mixed Chart
PwC/Strategy&
View slide
Two-column layout with text on the left and icons representing various talent initiatives on the right. Text density is moderate.
Market Analysis and Trends
Professional Services
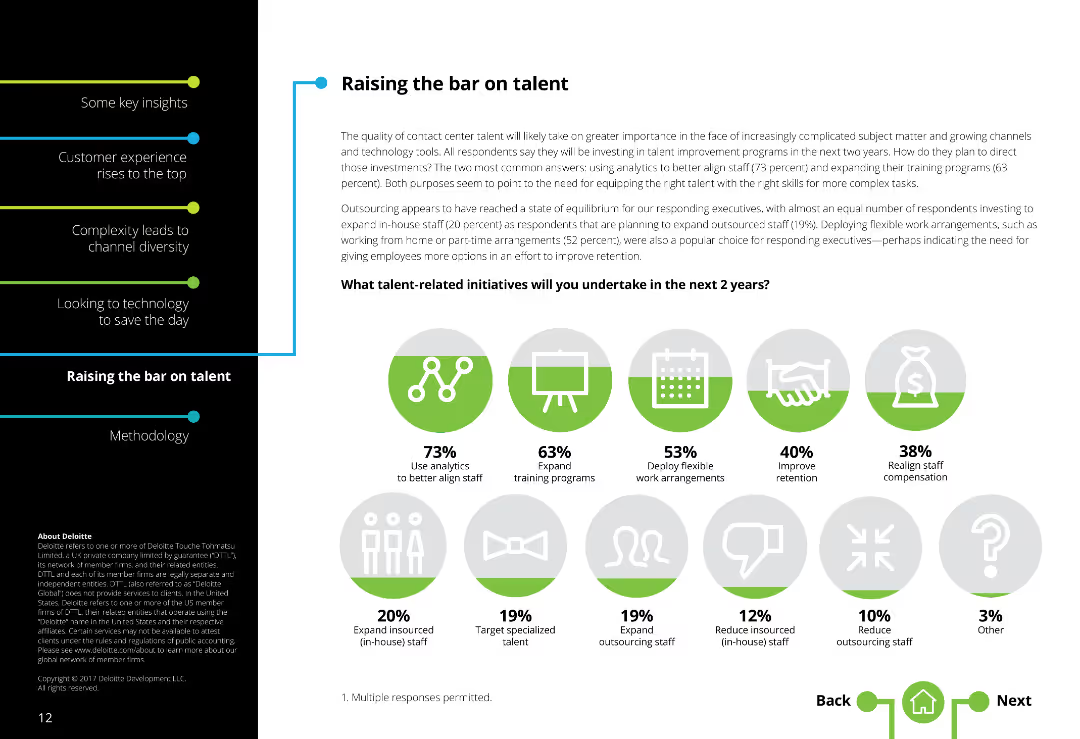
Discusses initiatives for improving talent in contact centers, such as using analytics for staff, expanding training programs, and deploying flexible work arrangements.
Talent management, Contact centers, Analytics, Training programs, Flexible work arrangements, Staff improvement
false
The quality of contact center talent will likely take on greater importance in the face of increasingly complicated subject matter and growing channels and technology tools.Global Contact Center Survey
Mixed Chart
Deloitte
View slide
Bar chart comparing current usage and perceived helpfulness; left paragraph with AI use case examples; clean layout.
Strategic Planning
Artificial Intelligence
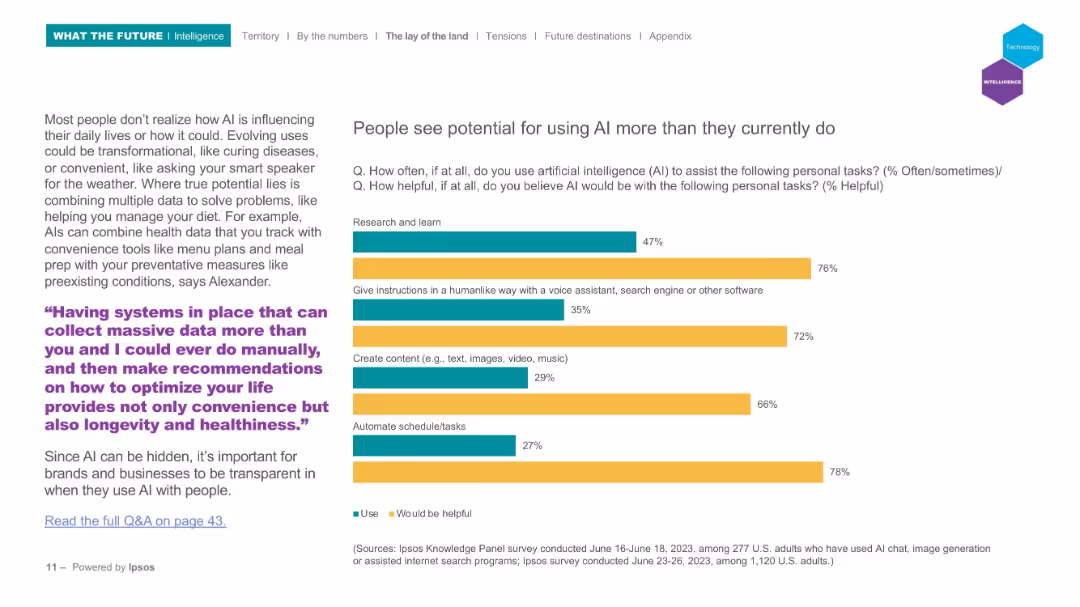
Explores the gap between current AI usage and perceived potential. It emphasizes how people believe AI could help with scheduling, research, content creation, etc., more than they currently use it for. Includes forward-looking perspectives and examples of future applications.
AI potential, usage gap, helpfulness, perception, voice assistants, productivity, Ipsos
false
People see potential for using AI more than they...WHAT THE FUTURE: INTELLIGENCE
Mixed Chart
IPSOS
View slide
Contains column charts comparing statutory RoTE across different bank divisions over several years.
Financial Performance
Financial Services
Demonstrates how different bank divisions contribute to overall growth and performance, emphasizing improvements and future targets.
RoTE, performance, divisions, growth, targets
false
Better returns: our divisions contribute through growth and performanceFY 2023 Results Announcement
Multiple Chart
Barclays
View slide
Comparative bar graphs of cost scenarios for various supply chains (South Korea vs. US); icons and flags used to denote material flow; breakdown by cost components
Operational Efficiency
Industrial & Manufacturing
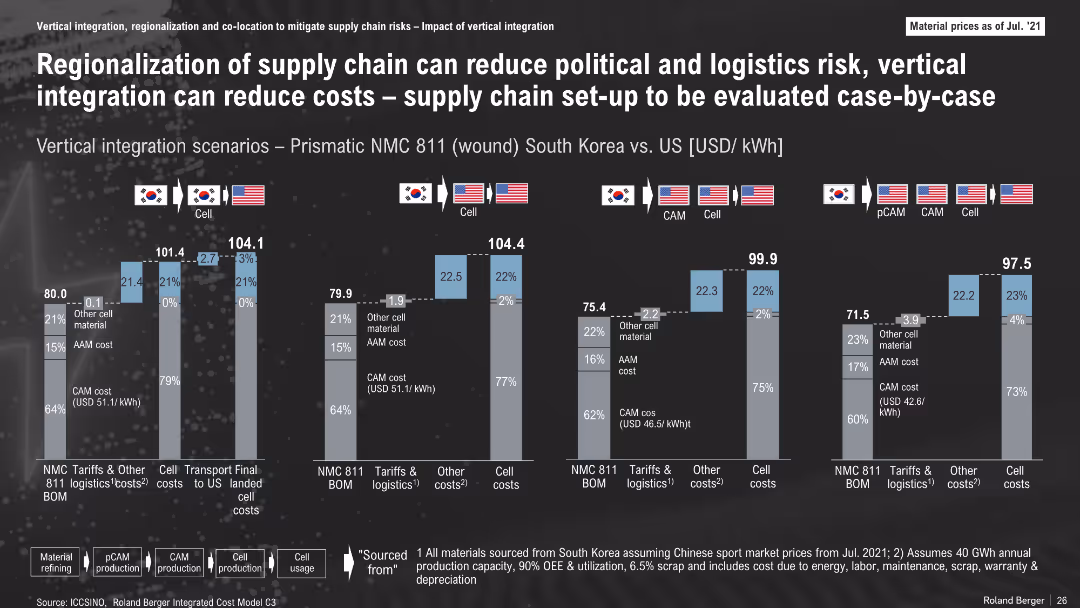
The slide compares costs of vertical integration and regionalization of the battery supply chain across different configurations. It shows cost advantages of localized U.S. supply chains and how material origin affects final cell costs.
Supply Chain, Vertical Integration, Logistics, Battery Production, Cost Analysis, South Korea, U.S.
false
Regionalization of supply chain can reduce political and logistics risk, vertical integration can reduce costs – supply chain set-up to be evaluated case-by-caseThe Lithium-Ion (EV) battery market and supply chain
Multiple Chart
Roland Berger
View slide
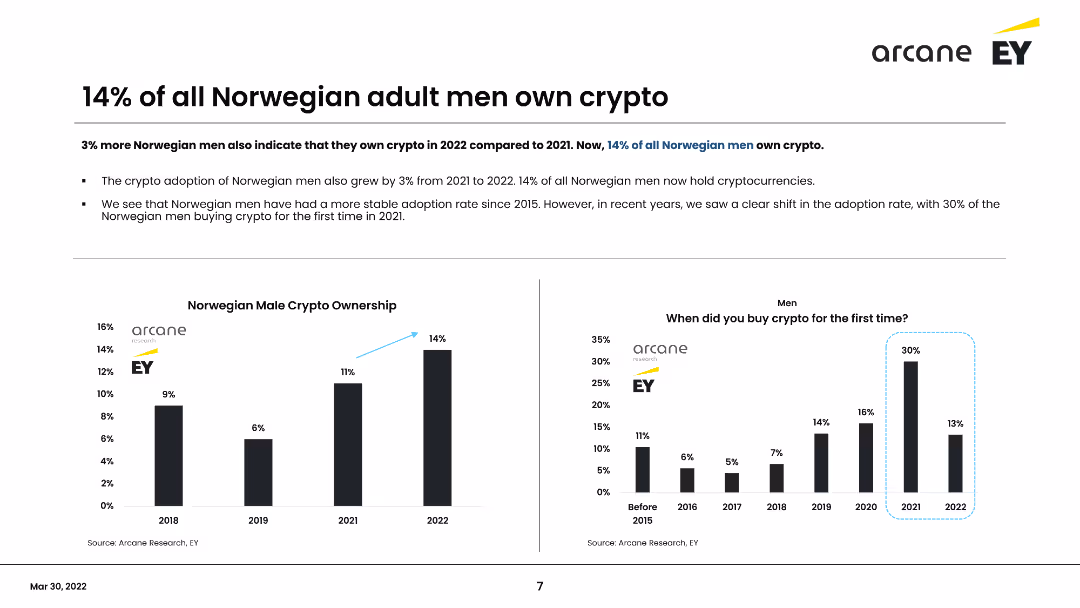
This slide presents data on Norwegian men owning cryptocurrency, including a column chart showing the percentage from 2018 to 2022 and a survey on when men first bought crypto. It highlights a 3% increase in ownership in 2022, reaching 14% overall.
Market Analysis and Trends
Financial Services
Shows that 14% of Norwegian men own cryptocurrency, with a steady increase over the years. Highlights the growth from 2021 to 2022 and the survey findings on the timeline of initial crypto purchases among men.
Cryptocurrency, Male adoption, Norway, Survey, Trends
false
14% of all Norwegian adult men own cryptoNorwegian Crypto Adoption Survey 2022
Multiple Chart
EY
View slide
The slide features a column chart depicting participants' ability to correctly identify crypto assets, with categories for correct, incorrect, and unknown.
Market Analysis and Trends
Financial Services
This slide presents data on participants' knowledge and understanding of what constitutes a crypto asset.
Identification, crypto assets, knowledge, survey, participants
false
Correct Identification of Crypto AssetsCRYPTO ASSET SURVEY
Mixed Chart
IPSOS
1
...
Next
Load More
Hold On!
We are searching in our database
If nothing, comes up, please try different filters!
Create a FREE account to continue browsing
Receive Instant Access to 1,000+ slides from companies like McKinsey, Google, and Goldman Sachs
First Name
Last Name
Email
Password
I agree to all
Terms & Privacy Policy
Thank you! Your submission has been received!
Oops! Something went wrong while submitting the form.
Have an account?
Sign in
Column Chart
Heatmap
Chevron
Org Chart
Infographic
Callouts
Timeline
List
Graphic
Picture
Process Flow
Diagram
Paragraph
Map
Table
Framework
Subtitle
Takeaway Box
Icon
Other Chart
Radar Chart
Waterfall Chart
Mekko Chart
Pie Chart
Scatter Plot
Line Chart
Bar chart
Bullet points