🎉 Black Friday Sale!
- Save 20% on SlideStart Pro Annual plan! CODE:
BLACKFRIDAY
My Account
My Slides
Search by Category
Templates
View All Templates
Download Template Slides
Leave Feedback
Login
Logout
Get Started
Browse all Slides
Browse all Slides
Create a FREE Account
Instant access to 1,000+ real slides from top companies like McKinsey, BCG, Goldman Sachs, Google and many more!
First Name
Last Name
Email
Password
I agree to all
Terms & Privacy Policy
Thank you! Your submission has been received!
Oops! Something went wrong while submitting the form.
Have an account?
Sign in
Instant access to the internet's best slides
Get access to 40+ advanced filters and more
Advanced Search and Filters
Access to
10,000+ slides
Access to Category Pages
Save/Bookmark Slides
PowerPoint Template Library (New)
Choose your plan
MONTHLY
$12/month
Billed every month, cancel anytime.
YEARLY
$9/month
Billed $108 annually, cancel anytime.
Checkout for $12/month
Checkout for $108/yr
Secured by Stripe | AES-256 bit encryption
Spark Your Next Big Idea with New Presentation Templates
VIEW ALL Templates
Welcome,
Welcome
Upgrade to SlideStart
Pro
Instant access to 15,000+ slides
Show Featured Only
Checkbox 8
Companies
Mckinsey
Bain
BCG
EY
Deloitte
Accenture
PwC/Strategy&
JP Morgan
Goldman Sachs
Morgan Stanley
Citigroup
Deutsche Bank
Barclays
LEK
Kearney
Oliver Wyman
Booz Allen Hamilton
Gartner
IPSOS
Nielsen
Slide type
Header Horizontal
Framework
Vertical Flow
Single Chart
Single Chart
Text Only
Mixed Chart
Header Vertical
Graphic
Pillar
Multiple Chart
Agenda
Title
Table
Linear Flow
Upgrade to SlideStart
Pro
Instant access to 40+ advanced filters
Industry
Upgrade to SlideStart
Pro
Instant access to 40+ advanced filters
Technology
Healthcare
Financial Services
Consumer Goods
Energy & Utilities
Manufacturing
Retail
E-commerce
Logistics
Telecommunications
Real Estate
Professional Services
Education
Media
Entertainment
Hospitatlity
Tourism
Agriculture
Food Production
Government & Public Sector
Environmental
Sustainability
Use Case
Upgrade to SlideStart
Pro
Instant access to 40+ advanced filters
Sales and Business Development
Mergers and Acquisitions
Corporate Finance and Valuation
Performance Metrics and KPIs
Client Case Studies
Competitive Landscape
Product and Service Analysis
Customer and Market Segmentation
Organizational Structure
Human Resources and Talent Management
Industry Overview
Regulatory and Compliance
Risk Assessment and Management
Agriculture & Food Production
Hospitality and Tourism
Government
Environmental
Sustainability
Clear all
Thank you! Your submission has been received!
Oops! Something went wrong while submitting the form.
Show Featured Only
Checkbox 8
Companies
Mckinsey
Bain
BCG
EY
Deloitte
Accenture
PwC/Strategy&
JP Morgan
Goldman Sachs
Morgan Stanley
Citigroup
Deutsche Bank
Barclays
LEK
Kearney
Oliver Wyman
Booz Allen Hamilton
Gartner
IPSOS
Nielsen
Slide type
Text Only
Linear Flow
Vertical Flow
Single Chart
Header Horizontal
Mixed Chart
Header Vertical
Pillar
Multiple Chart
Graphic
Agenda
Title
Table
Framework
Industry
Technology
Healthcare
Financial Services
Consumer Goods
Energy & Utilities
Manufacturing
Retail
E-commerce
Logistics
Telecommunications
Real Estate
Professional Services
Education
Media
Entertainment
Hospitatlity
Tourism
Agriculture
Food Production
Government & Public Sector
Environmental
Sustainability
Use Case
Sales and Business Development
Mergers and Acquisitions
Corporate Finance and Valuation
Performance Metrics and KPIs
Client Case Studies
Competitive Landscape
Product and Service Analysis
Customer and Market Segmentation
Organizational Structure
Human Resources and Talent Management
Industry Overview
Regulatory and Compliance
Risk Assessment and Management
Agriculture & Food Production
Hospitality and Tourism
Government
Environmental
Sustainability
Clear all
Thank you! Your submission has been received!
Oops! Something went wrong while submitting the form.
Tag
View slide
This slide features a dark background with a header, body text, and a column chart showing three percentage indicators. Each indicator is accompanied by descriptive text explaining consumer openness to virtual primary care consultations versus in-person consultations.
Technology and Digital Transformation
Healthcare & Pharmaceuticals
The slide discusses the openness of Irish consumers to switch to virtual primary care consultations, despite a general preference for in-person consultations. It highlights the percentage of consumers willing to consider virtual consultations.
healthcare, virtual care, primary care, Ireland, consultations
false
‘But I am open to switching to virtual primary care.’ Consumers: IrelandHealth care consumer views on value
Mixed Chart
EY
View slide
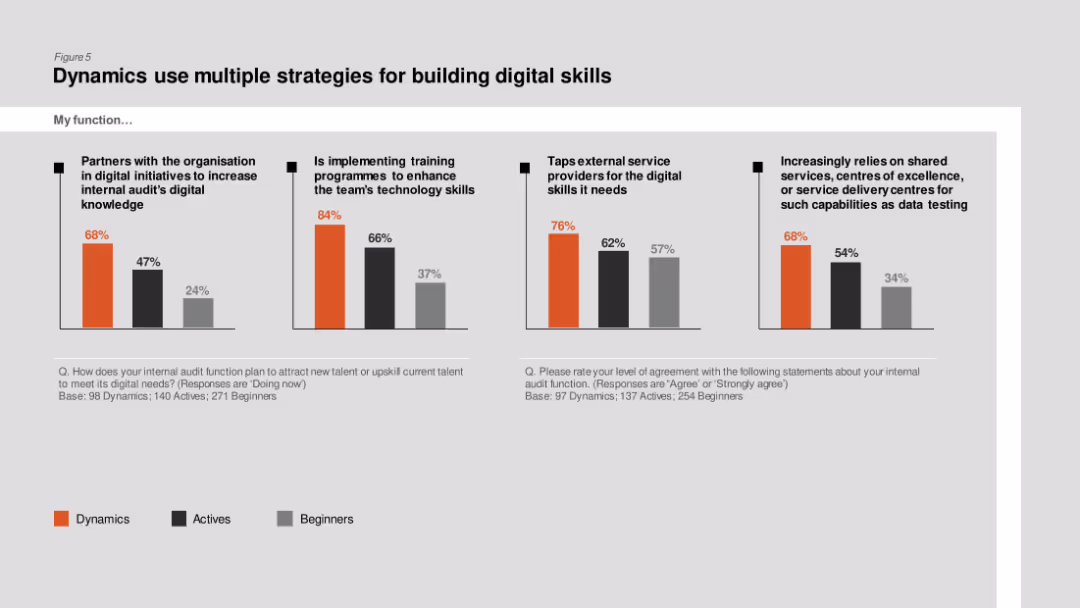
Column charts comparing strategies like partnerships, training programs, and external service providers for building digital skills among Dynamics, Actives, and Beginners.
Human Resources and Talent Management
Professional Services
The slide details various strategies used by internal audit functions to enhance digital skills, showing higher implementation of training programs and partnerships in Dynamics.
Digital skills, training programs, internal audit, partnerships, Dynamics
false
Figure 5 Dynamics use multiple strategies for building digital skillsElevating internal audit’s role: The digitally fitfunction 2019 State of the Internal Audit Profession Study
Multiple Chart
PwC/Strategy&
View slide
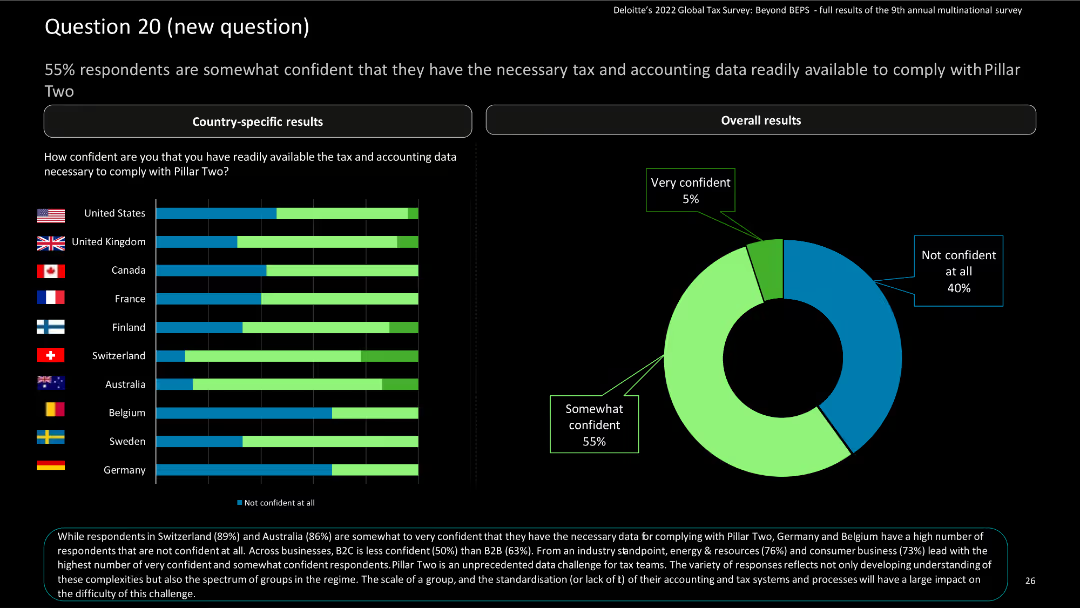
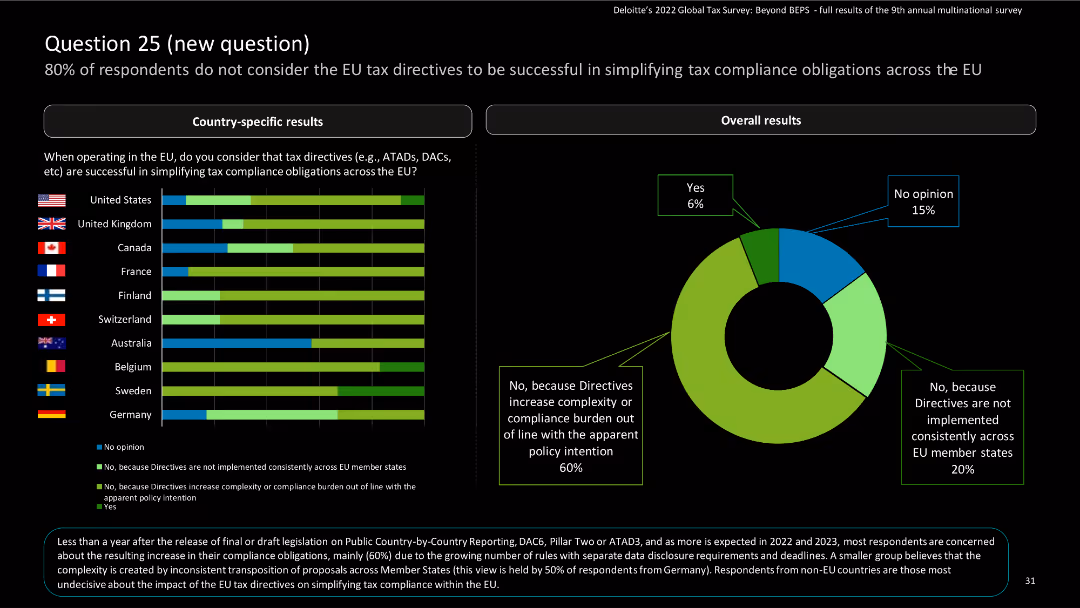
The slide contains horizontal bar charts for country-specific results and a donut chart for overall results, highlighting confidence levels.
Risk Assessment and Management
Financial Services
The slide summarizes survey findings on confidence in having the necessary tax and accounting data for complying with Pillar Two. It includes country-specific and overall responses.
Pillar Two, compliance, tax data, survey, financial services
false
Question 20 (new question) 55% respondents are somewhat confident that they have the necessary tax and accounting data readily available to comply with Pil lar TwoDeloitte’s 2022 Global Tax Survey: Beyond BEPS
Multiple Chart
Deloitte
View slide
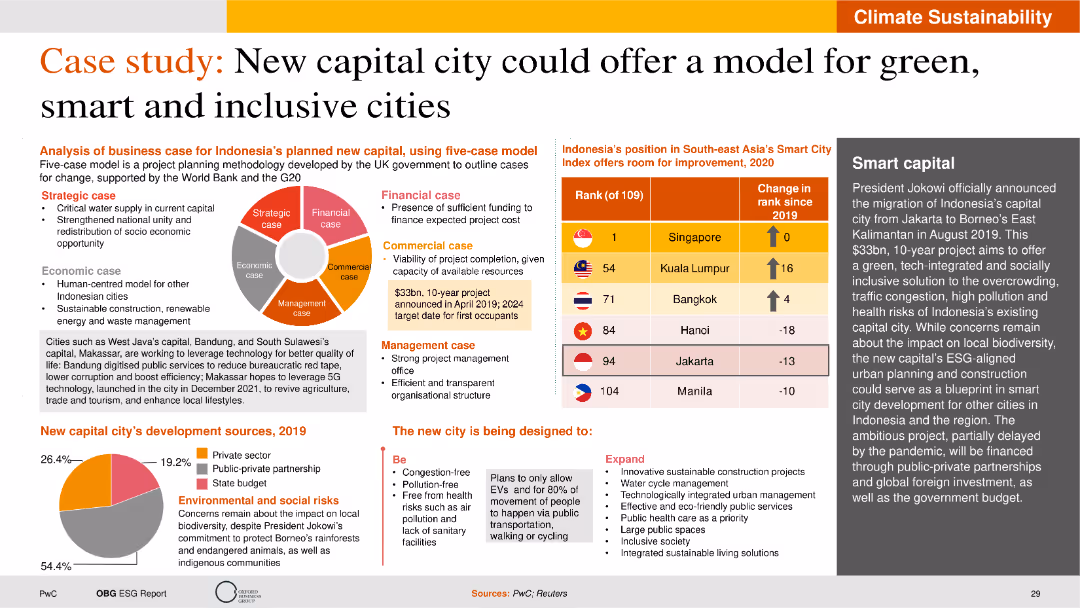
The slide features a pie chart, a donut chart, a column chart, and several text boxes. The visual complexity is moderate, with a focus on data presentation and infographic elements.
Strategic Planning
Real Estate & Construction
This slide analyzes the business case for Indonesia’s new capital, considering strategic, financial, commercial, economic, and management aspects. It includes data on development sources.
capital city, green cities, strategic planning, business case, Indonesia
false
Case study: New capital city could offer a model for green, smart and inclusive citiesIndonesia’s Sustainable Transformation
Mixed Chart
PwC/Strategy&
View slide
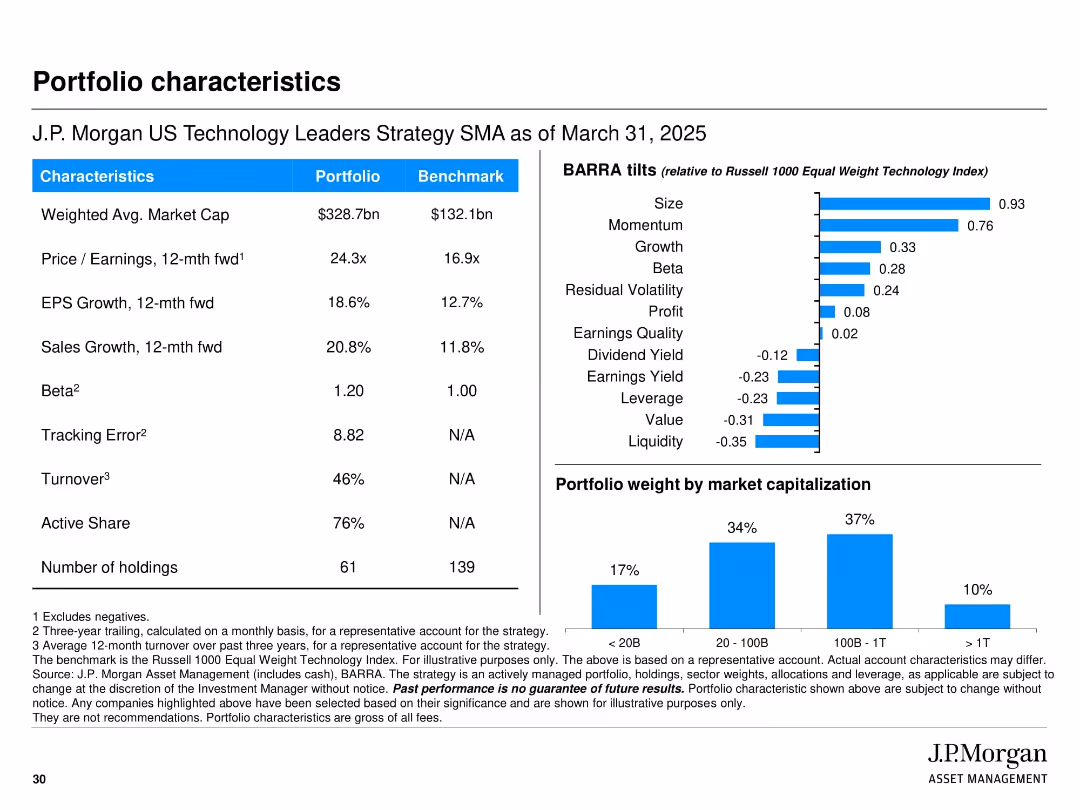
Left side contains a metrics table comparing portfolio vs. benchmark (market cap, EPS growth, beta, etc.). Right side includes BARRA tilt chart and bar graph showing portfolio weight by market capitalization. Uses blue for highlights. Grid layout with two vertical sections.
Financial Performance
Financial Services
This slide provides an overview of portfolio metrics and characteristics versus the benchmark. Key differentiators include higher market cap, EPS and sales growth, and beta. It also includes BARRA factor tilts to indicate style exposures (size, momentum, growth) and a market cap breakdown chart. These metrics help assess the risk/return profile and investment focus of the strategy.
portfolio metrics, benchmark comparison, BARRA factors, J.P. Morgan, market cap, beta, EPS growth, portfolio overview, financial characteristics
false
Portfolio characteristicsJ.P. Morgan US Technology Leaders Strategy
Multiple Chart
JP Morgan
View slide
Features line graphs and column charts detailing economic indicators, interest rates, and credit cycle concerns.
Risk Assessment and Management
Financial Services
Examines the potential cyclical headwinds faced by the industry and the economic growth forecasts.
Economic indicators, interest rates, credit cycle, economic growth, cyclical headwinds
false
The environment remains strong, but presents us with potential cyclical headwinds…FIRM OVERVIEW 2020
Multiple Chart
JP Morgan
View slide
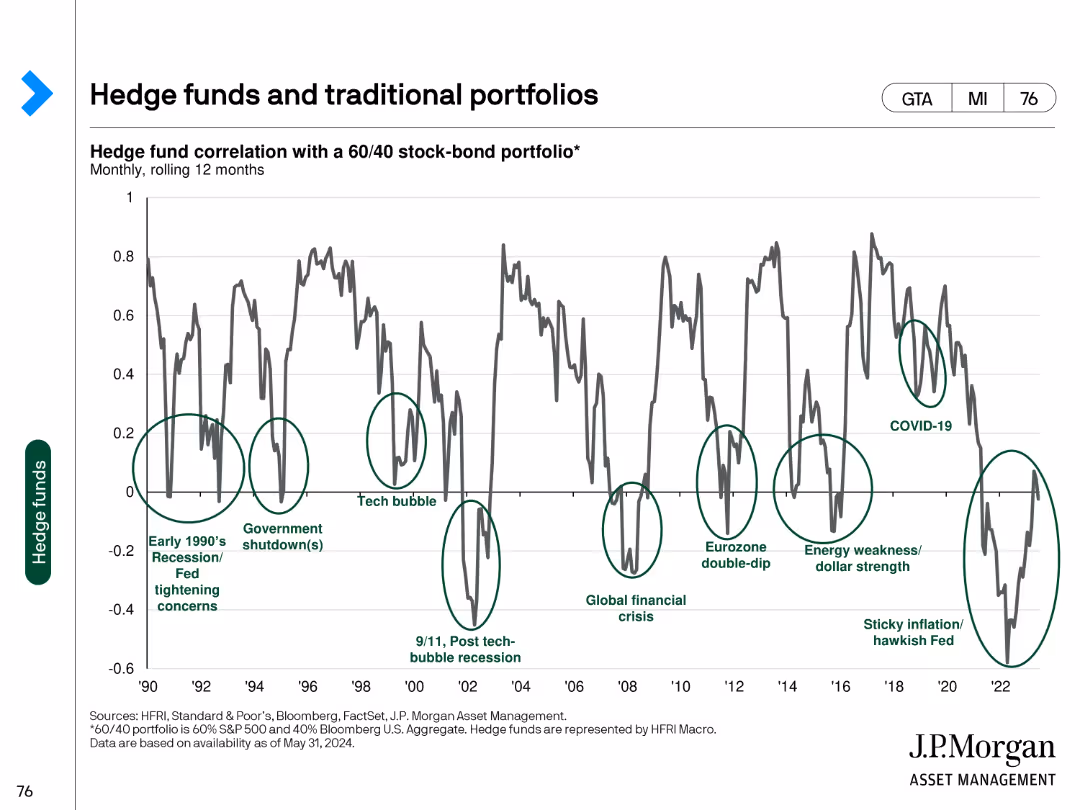
This slide features a line chart showing the correlation of hedge funds with a 60/40 stock-bond portfolio, highlighting major financial events from 1990 to 2024.
Investment Analysis
Financial Services
The slide analyzes the correlation between hedge fund performance and a traditional 60/40 portfolio, indicating how hedge funds behave in different economic conditions.
hedge funds, portfolios, correlation, financial events, investment analysis
false
Hedge funds and traditional portfoliosGuide to Alternatives
Single Chart
JP Morgan
View slide
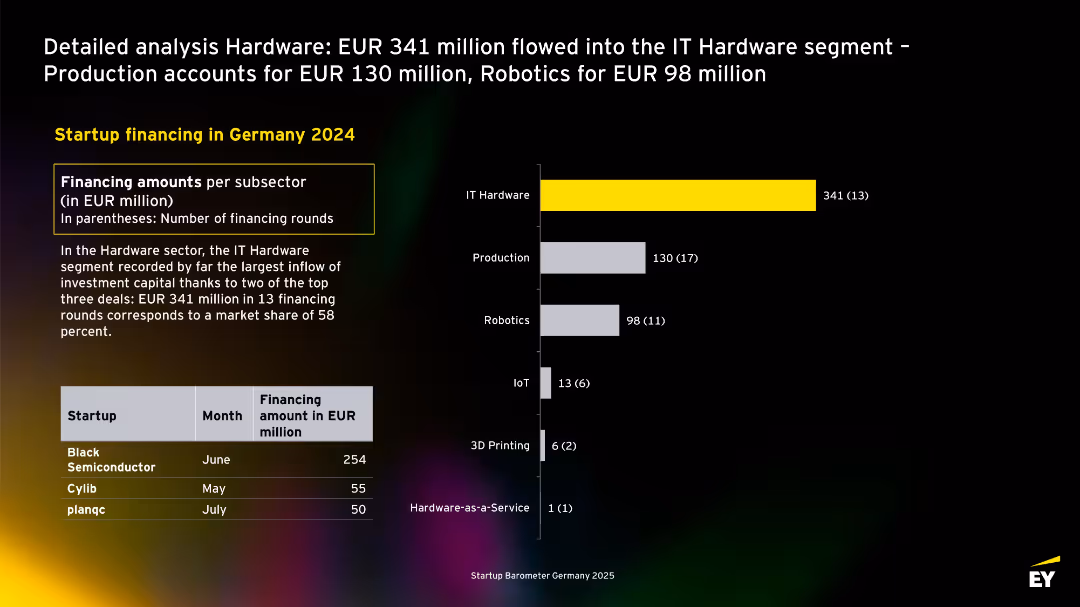
Layout with yellow-highlighted leading sector (IT Hardware), bar chart on right, and top startup table at bottom-left.
Investment Analysis
Technology & Software
The slide dissects hardware segment funding in 2024, led by IT Hardware (EUR 341M). It highlights significant investments into Black Semiconductor and others. Production and Robotics also secured notable shares.
IT hardware, robotics, production, startups, Germany, capital inflow, 2024, venture
false
Detailed analysis Hardware: EUR 341 million flowed into the IT Hardware segment – Production accounts for EUR 130 million, Robotics for EUR 98 millionEY Startup Barometer Germany
Mixed Chart
EY
View slide
Bar chart showing investor motivations for tokenizing assets, with text detailing benefits and hurdles. Includes icons and text highlighting factors like transaction costs, liquidity, and regulatory hurdles.
Market Analysis and Trends
Financial Services
Describes the main drivers for investors to switch to tokenization, emphasizing benefits like lower transaction costs and increased liquidity, while also highlighting hurdles such as regulatory uncertainty and lack of trusted service providers.
tokenization, investors, liquidity, transaction costs, regulatory hurdles
false
Lower transactions costs, increased liquidity are the main drivers for investors to switch to tokenization. However, uncertainty in regulatory environment holds them back…Towards the unified secondary market: The evolution of distribution channels and evaluation of Asset Tokenization Benefits
Mixed Chart
EY
View slide
A photo of Cologne Cathedral with a graph showing Germany's GDP growth and a detailed text explanation.
Market Analysis and Trends
Financial Services
This slide discusses Germany's economic conditions, highlighting GDP growth trends and the impact of COVID-19 on the economy.
Germany, GDP growth, economy, financial services, market analysis
false
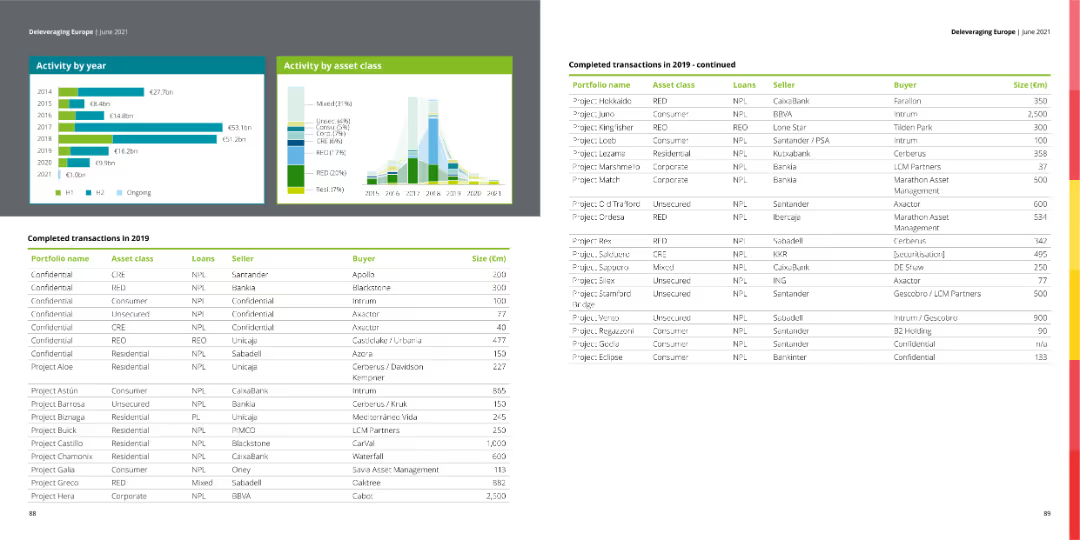
Confidential CRE NPL Santander Apollo 200Deleveraging Europe
Multiple Chart
Deloitte
View slide
This slide features a two-column layout with bulleted lists and percentage statistics. Icons are used to represent different concepts like growth and automation. The design is moderate, utilizing whitespace effectively for a clean and balanced appearance.
Industry Overview
Financial Services
The slide contrasts current business environmental assessments with adaptation strategies to the on-demand world. It is used for understanding key areas of focus in digital commerce and customer service improvements.
digital presence, customer needs, online demand, digital commerce, consumer expectations, convenience, adaptation, mobile spending, data
false
Assessing your environment todayKEEP MOVING FORWARD
Boxed
JP Morgan
View slide
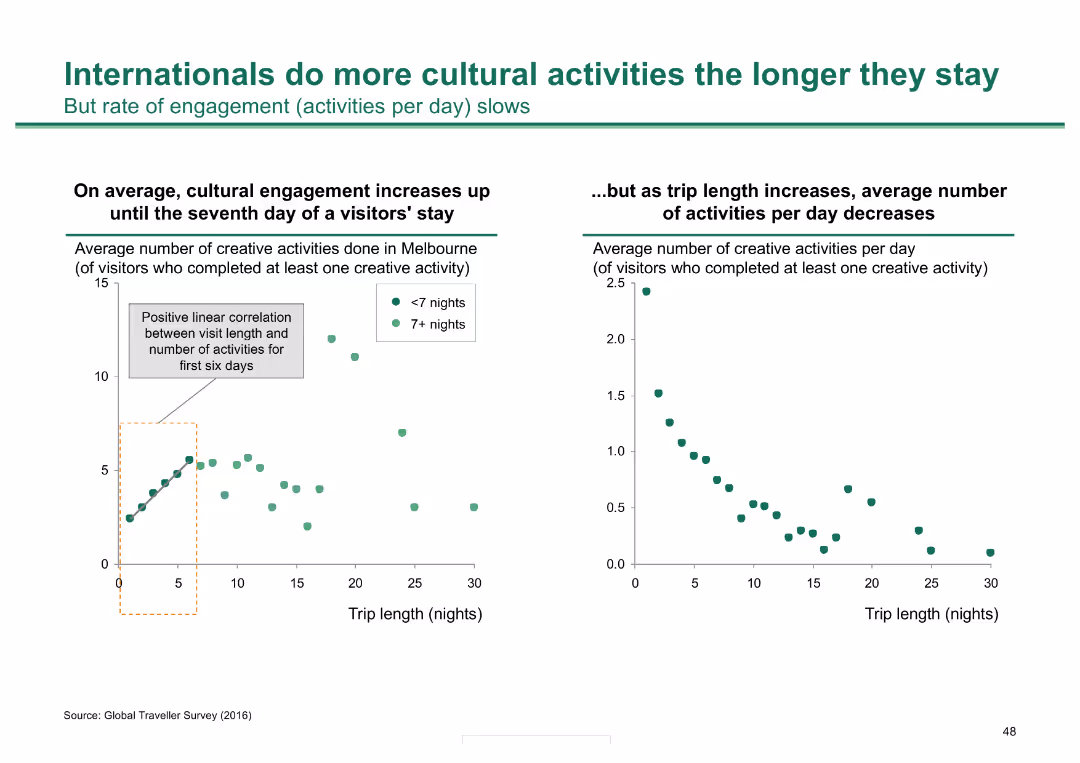
Two scatter plots: one shows a positive correlation between visit length and number of activities in Melbourne; the other shows the average number of activities per day decreases as stay lengthens.
Market Analysis and Trends
Hospitality & Tourism
Analyzes how international visitors' engagement with cultural activities in Melbourne increases with longer stays, though the rate of daily activities decreases over time.
cultural activities, visitor engagement, Melbourne, stay length, tourism
false
Internationals do more cultural activities the longer they stayMelbourne as a Global Cultural Destination
Multiple Chart
BCG
View slide
Moderate visual complexity, this slide uses iconography to represent the drivers behind the development and adoption of Emissions Management Systems (EMS). It is text-light but the icons are accompanied by concise bullet points that explain each driver in detail.
Technology and Digital Transformation
Industrial & Manufacturing
The slide focuses on the drivers stimulating the development of sophisticated Emissions Management Systems in process industries. It points out the significant contributions of these industries to greenhouse gas emissions and the resultant demand for EMS to reduce environmental impacts while ensuring compliance with stringent governmental regulations.
Emissions Management, Environmental sustainability, Regulatory compliance, EMS drivers
false
Process industries significantly contribute to greenhouse gas emissions, which are driving / stimulating development of sophisticated Emissions Management Systems (EMS)Process Automation: A quickly growing market with structural tailwinds and investment opportunities
Pillar
LEK
View slide
This slide includes a column chart series showing trends over years and a separate opportunity section with two vertical bar charts. There are icons with brief text descriptions at the bottom, and the design is structured with a mix of blue tones.
Financial Performance
Financial Services
The slide depicts strategic growth through advisor hiring, client referrals, and assets, along with investment in future planning, innovation, and market awareness, showcasing trends and future opportunities in the private banking sector.
Growth, Strategy, Investment, Banking, Trends, Opportunities, Innovation, Planning, Financial Services, Market Share
false
Global Private Bank: Consistently growing the business, while investing for the futureAsset & Wealth Management 2020
Multiple Chart
JP Morgan
View slide
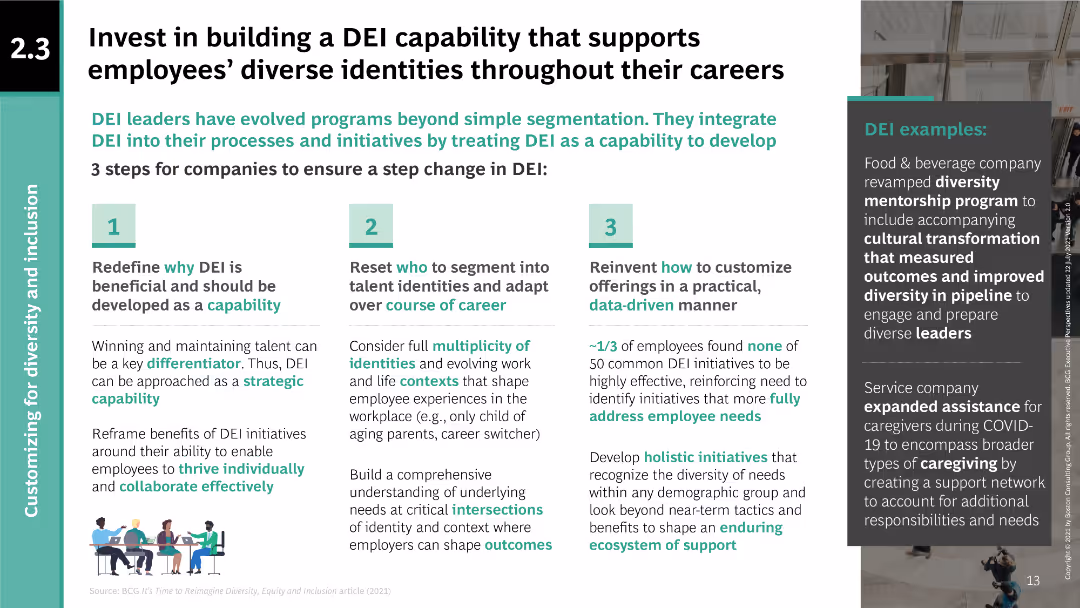
Three-step process diagram for building DEI capability; text explaining steps and examples.
Human Resources and Talent Management
Professional Services
Provides a framework for integrating DEI into company processes, highlighting steps to redefine, reset, and reinvent DEI initiatives to support diverse employee identities.
DEI, diversity, equity, inclusion, employee support, capability building, company processes, strategic initiatives, diversity mentorship
false
Invest in building a DEI capability that supports employees’ diverse identities throughout their careersInvesting to Win Talent
Linear Flow
BCG
View slide
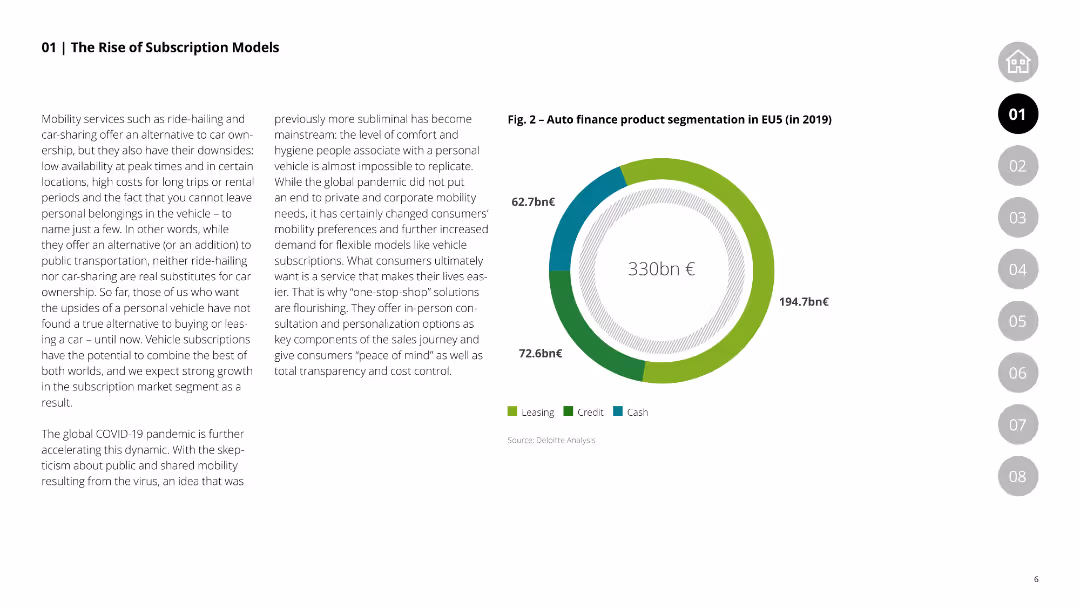
This slide includes a column chart showing product segmentation in the EU5 auto finance market for 2019, comparing leasing, credit, and cash products.
Market Analysis and Trends
Financial Services
Details the segmentation of auto finance products in the EU5 market, emphasizing the shift towards subscription models and how it caters to changing consumer preferences.
auto finance, product segmentation, EU5, leasing, credit, cash, subscription models
false
Fig. 2 – Auto finance product segmentation in EU5 (in 2019)Vehicle-as-a-Service From vehicle ownership to usage-based subscription models
Mixed Chart
Deloitte
View slide
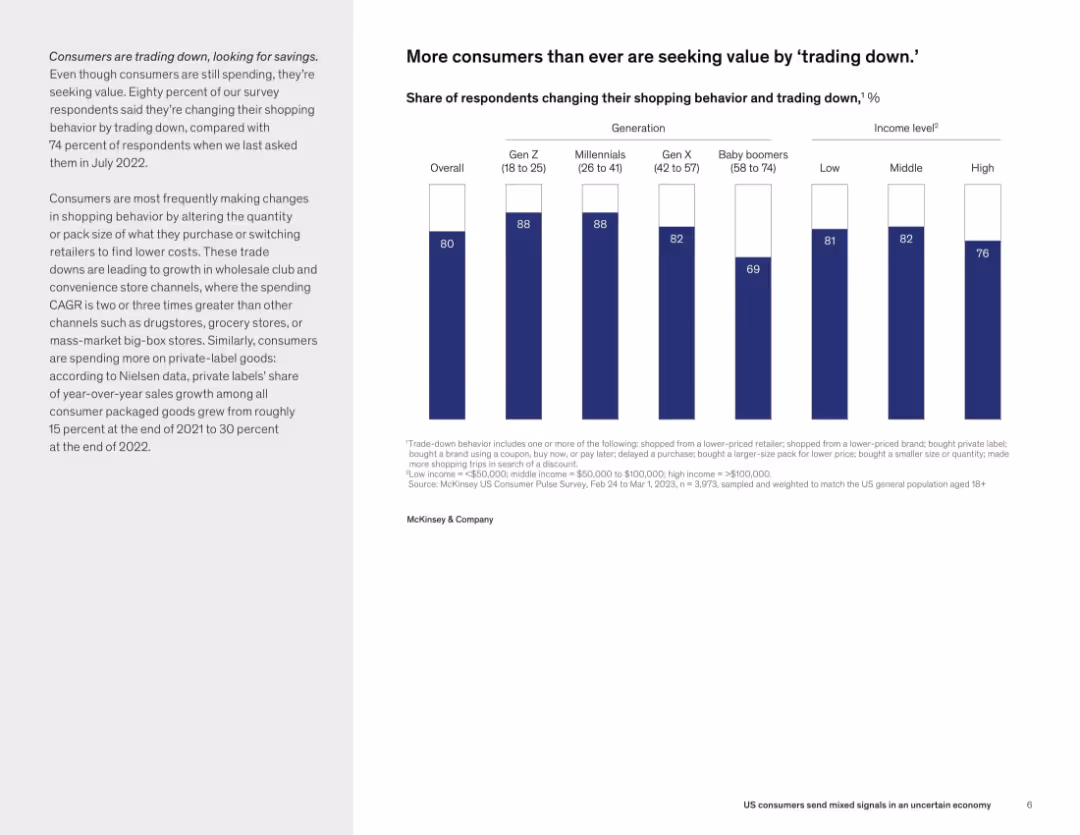
Text on left and bar chart on right showing percentage of respondents changing behavior by generation and income level.
Customer and Market Segmentation
Consumer Goods
80% of respondents report altering their shopping habits to save money—primarily by switching brands or buying smaller packs. Gen Z and millennials lead this trend, indicating a wide adoption of cost-saving behaviors across demographics.
trade down, consumer behavior, savings, Gen Z, income level, shopping trends, private label
false
More consumers than ever are seeking value by ‘trading down.’US consumers send mixed signals in an uncertain economy
Mixed Chart
McKinsey
View slide
The slide includes a column chart showing medium-term expenses and the three main drivers of expense reduction.
Operational Efficiency
Financial Services
This slide details the medium-term expense drivers, focusing on organizational simplification, stranded costs, and transformation efforts.
Medium-term, Expenses, Drivers, Reduction, Organizational, Simplification, Transformation, Efficiency, Financial, Analysis
false
Drivers of medium-term expensesEarnings Results Presentation Fourth Quarter and Full Year 2023
Mixed Chart
Citigroup
View slide
Featuring column charts and bar charts, the slide displays the likelihood of purchasing crypto assets within the next 12 months, comparing data from 2023 and 2022, and showing demographics of responses.
Market Analysis and Trends
Financial Services
The slide analyzes the purchase intent of Canadians regarding crypto assets over the next year, with a focus on how likelihood has changed from 2022 to 2023, including demographic insights.
purchase intent, crypto assets, next 12 months, demographics, comparison
false
Plan to Purchase Crypto Assets in Next 12 MonthsCRYPTO ASSET SURVEY 2023
Mixed Chart
IPSOS
View slide
This slide contrasts 2008 and 2018 data through blue column charts, showing growth over a decade. It incorporates icons and bullet points that highlight key strategic actions contributing to growth.
Financial Performance
Financial Services
Analyzes the growth of the commercial banking sector over ten years, reflecting on client coverage, team enablement, core capabilities, process investment, and discipline. It's suitable for demonstrating to stakeholders the results of sustained investment and growth strategies.
ten-year retrospective, growth, investment, client coverage, banking sector, team enablement, capabilities
false
Ten year retrospective – consistent investment and disciplined growthCommercial Banking 2019
Multiple Chart
JP Morgan
View slide
This slide provides a timeline from the 1980s to the 2010s, detailing the evolution of services with a blue and white color scheme.
Organizational Structure and Change
Financial Services
This slide could be used to depict the growth and diversification of a company's services over decades, emphasizing its established presence in the industry.
Evolution, Services, Growth, Diversification, Decades, Fixed Income, Equity, Advisory, ESG, Real Estate Credit
false
Franchise Built Over 30+ Years; Difficult to Replicate Breadth and DepthGoldman Sachs Investor Day
Linear Flow
Goldman Sachs
View slide
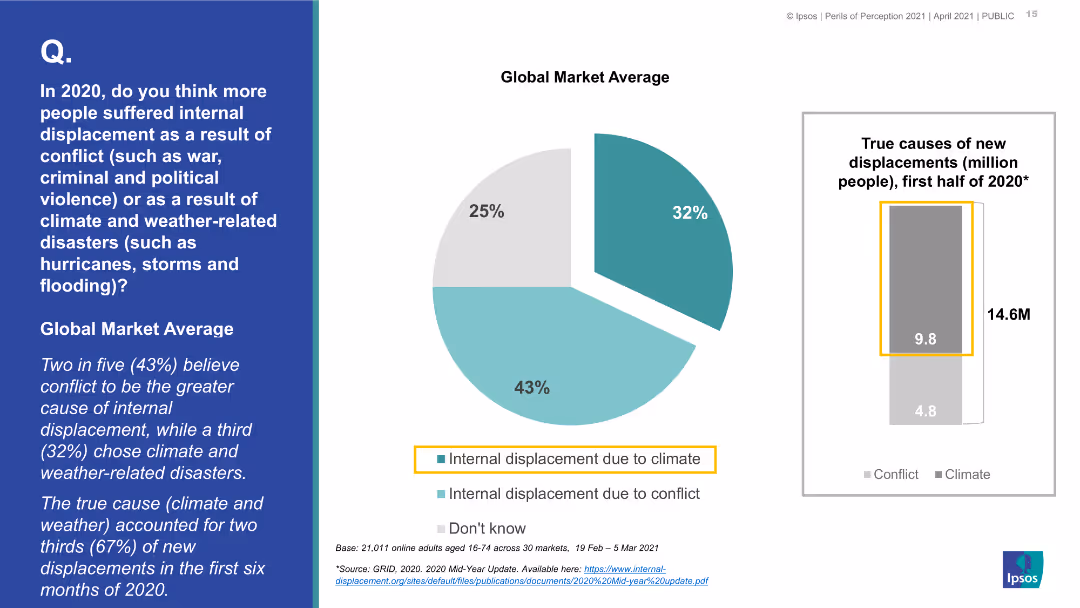
A comparative bar chart showing the perceived causes of internal displacement (conflict vs. climate/weather-related) for various countries, with Great Britain highlighted.
Market Analysis and Trends
Environmental Services & Sustainability
This slide contrasts public perceptions across different countries regarding the primary causes of internal displacement in 2020, comparing conflict and climate/weather-related disasters, with Great Britain highlighted.
internal displacement, conflict, climate disasters, public perception, country comparison, Great Britain
false
In 2020, do you think more people suffered internal displacement as a result of conflict (such as war, criminal and political violence) or as a result of climate and weather-related disasters (such as hurricanes, storms and flooding)? Global Market AveragePERILS OF PERCEPTION
Multiple Chart
IPSOS
View slide
Slide includes a flow diagram and three numbered lists with green accent texts and icons, detailing steps in transforming business operations through AI.
Technology and Digital Transformation
Technology & Software
This slide encourages businesses to adopt agile methodologies and cross-functional teams to enhance AI project outcomes. It outlines steps from initial pilots to full enterprise agility.
enterprise agility, AI implementation, cross-functional teams, agile methodologies, operational transformation
false
Change your ways of working and operating model to enable enterprise agility by leveraging cross-functional teams, platforms, and modularityArtificial Intelligence: Ready to Ride the Wave?
Vertical Flow
BCG
View slide
Two donut charts showing the distribution of podcast campaign types by revenue in 2015 and 2016, with a shift towards brand awareness and the emergence of branded content.
Market Analysis and Trends
Media & Entertainment
Discusses the evolution of revenue-generating campaign types in podcasting, highlighting shifts towards brand awareness and branded content. Key for strategic discussions on content and advertising models in media.
podcast, campaign types, revenue, media
false
Revenue by Campaign Type – 2015 to 2016IAB Podcast Ad Revenue Study: An Analysis of the Largest Players in the Podcasting Industry
Multiple Chart
PwC/Strategy&
View slide
Features a bar chart on the left and a pie chart on the right, displaying digital solutions and their perceived importance.
Technology and Digital Transformation
Professional Services
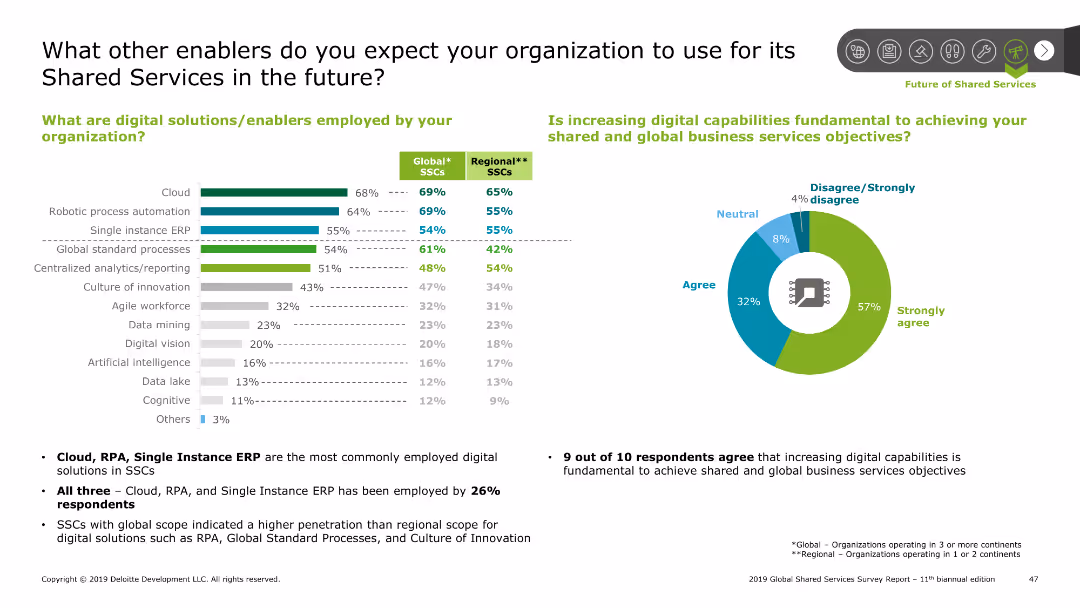
Highlights the digital solutions used by organizations in Shared Services, like cloud and RPA, and the perceived importance of increasing digital capabilities.
enablers, digital, solutions, cloud, RPA, ERP, analytics, innovation, workforce
false
What other enablers do you expect your organization to use for its Shared Services in the future?2019 Global Shared Services Survey Report 11th biannual edition
Multiple Chart
Deloitte
View slide
Split layout with left-side statistics on appointment frequency and expectations, and right-side chart showing frequency of director appointments; bottom section features quotes and an image; clean, corporate visual style.
Human Resources and Talent Management
Professional Services
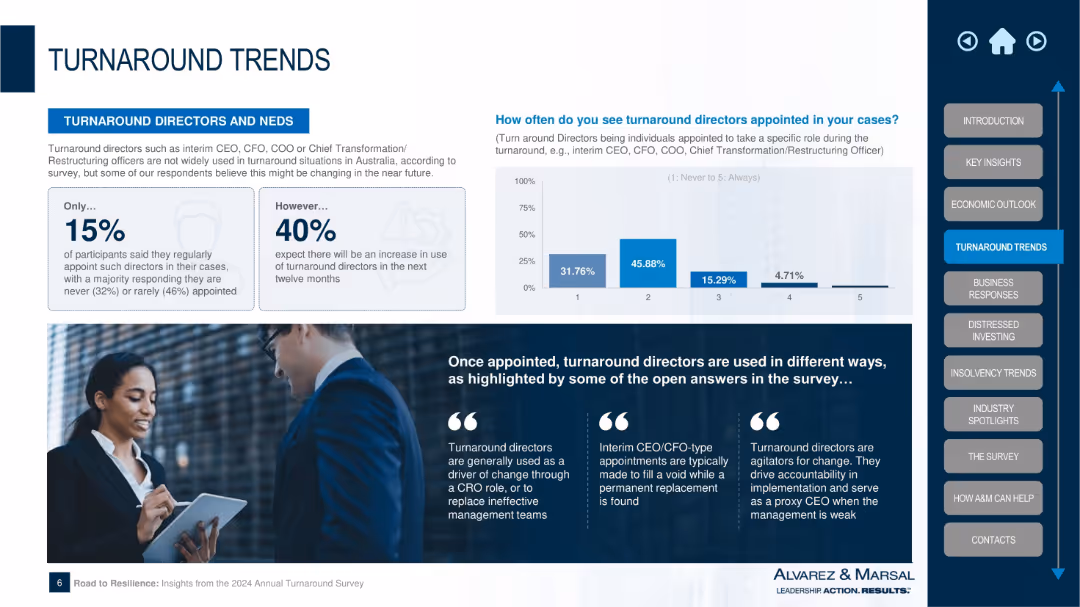
This slide covers the role and appointment trends of turnaround directors in restructuring situations. Only 15% regularly appoint such roles, though 40% expect increased usage. Once appointed, these directors often act as agents of change, filling leadership gaps or executing transformation strategies. Quotes from participants provide qualitative insights into their value.
turnaround directors, leadership, interim roles, restructuring, Alvarez & Marsal, talent trends, CEO/CFO interim, organizational change
false
TURNAROUND DIRECTORS AND NEDSROAD TO RESILIENCE
Mixed Chart
Alvarez & Marsal
View slide
This slide features a complex table correlating SDG goals with business metrics like new markets, sustainable operations, and risk management, indicating areas of high and low potential for value creation with color shading.
Strategic Planning
Professional Services
Discusses how businesses perceive the potential for value creation through responsible consumption and production, decent work, and partnerships, according to SDGs, focusing on sectors with significant operational and strategic impacts.
SDGs, value creation, business strategy, operational efficiency
false
Responsible consumption and production, decent work, and partnerships are considered the largest opportunities for value creationSDG Guide for Business Leaders
Table
McKinsey
View slide
This slide contains a pie chart detailing portfolio by industry and a line graph illustrating net charge-off performance, accompanied by text boxes.
Risk Assessment and Management
Financial Services
The slide presents a portfolio summary, market commentary, and performance metrics for commercial and industrial (C&I) lending, discussing risk management and credit performance.
Risk Discipline, C&I Lending, Portfolio, Market Commentary, Performance, Credit Quality
false
Maintaining risk discipline – C&ICOMMERCIAL BANKING 2020
Multiple Chart
JP Morgan
View slide
This slide includes a column chart on the left showing the global credit maturity schedule and a line chart on the right detailing global corporate refinancing costs over time.
Risk Assessment and Management
Financial Services
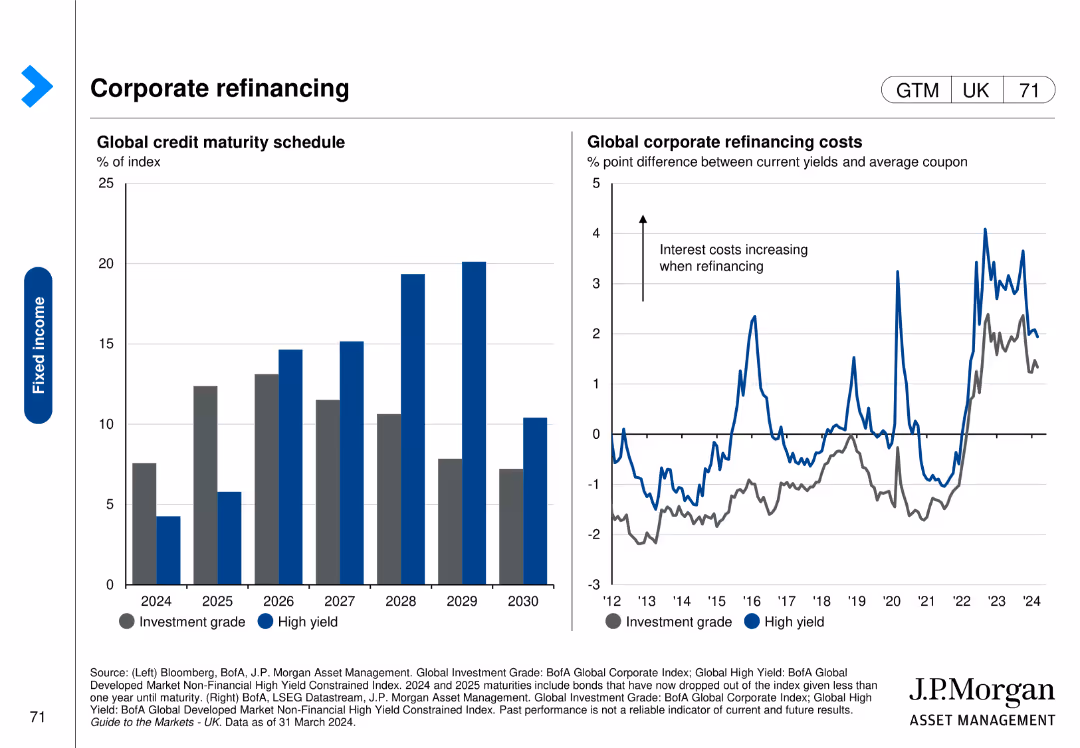
The slide examines the global corporate refinancing landscape, focusing on the maturity schedule of credit and the impact on refinancing costs.
refinancing, corporate, credit, maturity schedule, costs
false
Corporate refinancingGuide to the Markets UK | Q2 2024
Multiple Chart
JP Morgan
View slide
A timeline illustrating key dates and milestones in the development of the US BIOSECURE Act, with descriptive text boxes explaining each step and future projections.
Strategic Planning
Healthcare & Pharmaceuticals
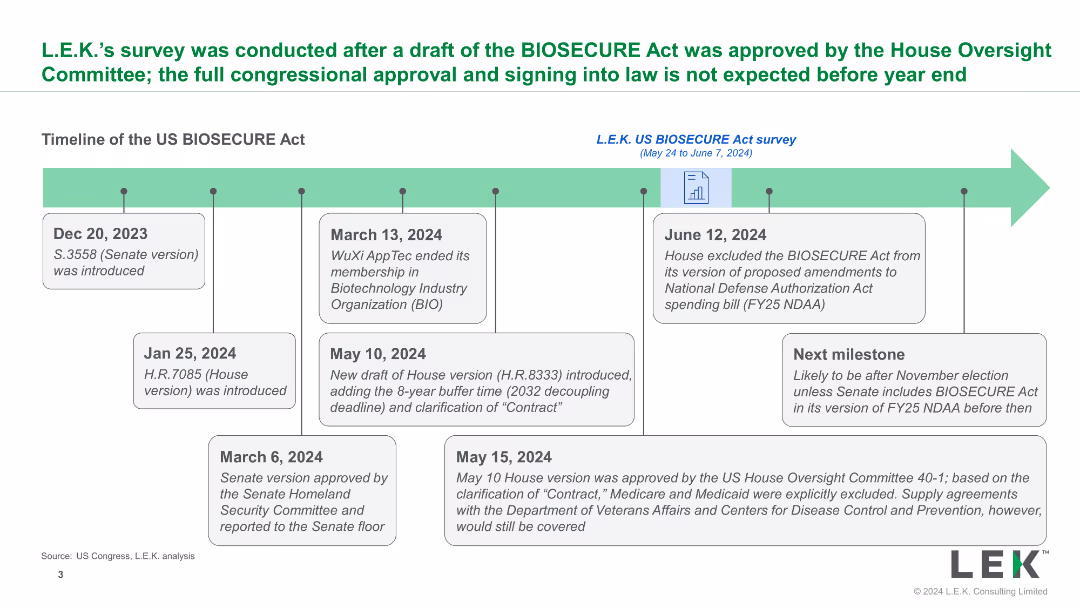
The slide provides a detailed timeline of the US BIOSECURE Act, from its introduction to expected future steps, outlining significant legislative milestones and impacts.
BIOSECURE Act, timeline, legislation, milestones, U.S.
false
L.E.K.’s survey was conducted after a draft of the BIOSECUREAct was approved by the House Oversight Committee; the full congressional approval and signing into law is not expected before year endImpact of the US BIOSECURE Act on Biopharmas, Contract Services and Investors
Linear Flow
LEK
View slide
Column chart showing changes in Aircastle's debt structure over time, emphasizing shifts to unsecured debt.
Financial Performance
Transportation & Logistics
Analyzes changes in financial structure, focusing on debt types and shareholder equity to assess financial health.
capital, debt, equity, financial health, unsecured, structure
false
Capital Structure EvolutionDeutsche Bank 11th Annual Aircraft Finance & Leasing Conference
Mixed Chart
Deutsche Bank
View slide
The slide uses a dark blue to light blue gradient column chart to showcase revenue growth from 2010 to 2018, with a projection line indicating the target. The layout includes a footer with small text and numbers denoting client, loan, and deposit details.
Market Analysis and Trends
Financial Services
Presents revenue growth in the middle market sector, with historical data and future targets, emphasizing the successful execution of the bank's organic expansion strategy. Ideal for investor briefings or market analysis presentations.
middle market, revenue growth, expansion strategy, historical data, future targets, organic growth
false
Executing our organic Middle Market expansion strategyCommercial Banking 2019
Single Chart
JP Morgan
View slide
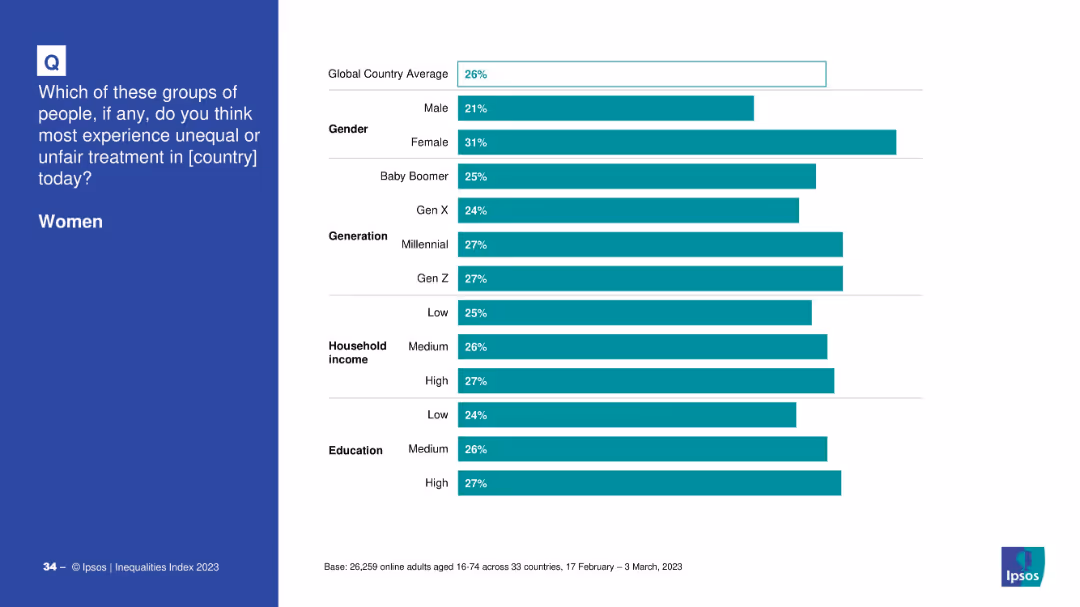
Demographic breakdown of perceptions about women experiencing unequal treatment.
Customer and Market Segmentation
Government & Public Sector
This slide analyzes perceptions of unequal treatment of women across gender, generation, income, and education groups. Female respondents and younger generations are more likely to view women as experiencing unfair treatment.
women, inequality, perception, demographics, gender bias, generational differences
false
Which of these groups… experience unequal or unfair treatment? – WomenIPSOS EQUALITIES INDEX 2023
Mixed Chart
IPSOS
View slide
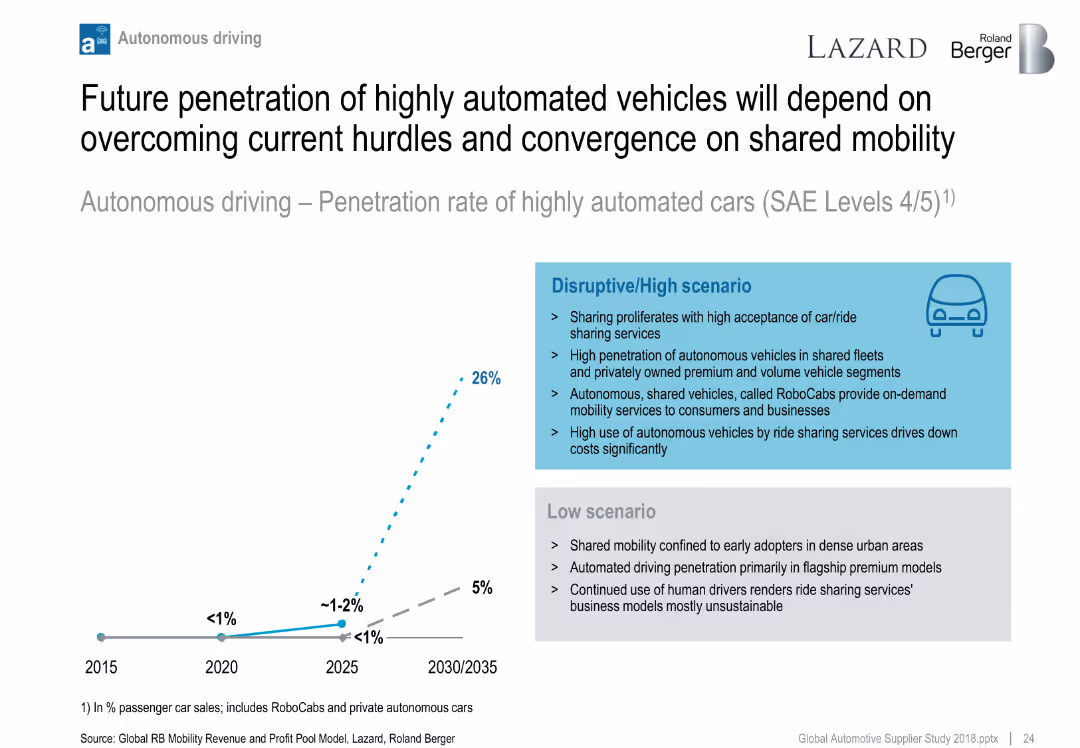
Line chart showing two scenarios for autonomous vehicle penetration (low vs. high); side text compares scenario assumptions.
Technology and Digital Transformation
Industrial & Manufacturing
Projects adoption of highly automated vehicles (SAE Level 4/5) under different market scenarios. Highlights role of shared mobility, ride-hailing, and RoboCabs in accelerating adoption under a disruptive path.
autonomous driving, RoboCabs, mobility, adoption forecast, automation scenarios
false
Future penetration of highly automated vehicles will depend on overcoming current hurdles and convergence on shared mobilityThe overall positive sentiment was also reflected in the supplier valuation levels that still trade above their long-term average
Mixed Chart
Roland Berger
View slide
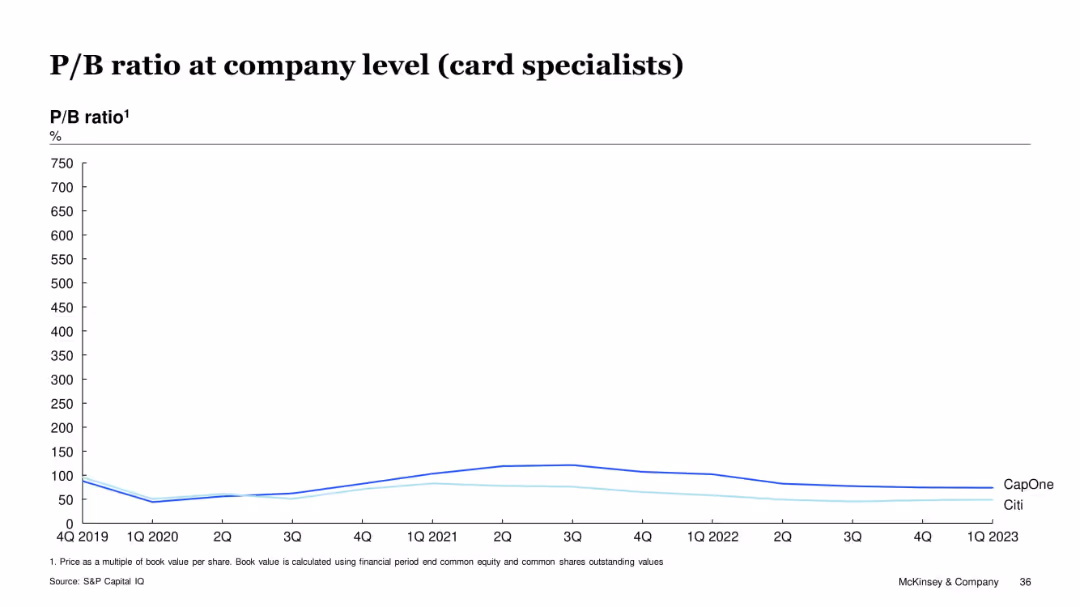
Line chart on white background comparing P/B ratios (%) over time (2019–2023) for CapOne and Citi, with a clean layout and minimal design.
Financial Performance
Financial Services
This slide compares the price-to-book (P/B) ratio trends for Capital One and Citibank over several years, showing fluctuations and relative valuations of these card-specialist companies. CapOne consistently shows a higher P/B ratio than Citi across the timeframe.
P/B ratio, CapOne, Citi, card specialists, valuation, financial trend, equity, bank performance, S&P Capital IQ
false
P/B ratio at company level (card specialists)US Credit Card Issuer Performance, 1Q 2023
Single Chart
McKinsey
View slide
Contains a circular flow diagram with icons representing different aspects of diligence such as Valuation, Commercial, and Tax. Clear, simple design with labeled segments and a central title.
Investment Analysis
Professional Services
This slide emphasizes the uniqueness of A&M's integrated diligence approach, showing how it combines various elements like Financial Accounting and Tax to create a comprehensive service.
Integrated, Diligence, Financial, Tax, Solution
false
Our Integrated Diligence is a Unique SolutionIntroduction to A&M Services in Asia
Framework
Alvarez & Marsal
View slide
A bar graph on the right compares the number of new digital services adopted by consumers during the pandemic years. The left side details the increase in purchases made in digital services.
Financial Performance
Technology & Software
Examines the growing number of digital service purchases made by existing consumers, indicating market growth and the potential for new service development.
consumer purchases, digital services, pandemic, market growth, service development, adoption rates
false
Usage frequency and spend on digital services have mostly increasede-Conomy SEA 2021 Roaring 20s: The SEA Digital Decade
Single Chart
Bain
View slide
The slide includes vertical bar graphs with predictions for market size in 2020, sub-sector growth drivers are also listed to provide context to the data showcased.
Financial Performance
Consumer Goods
This slide provides an estimation of the digital consumer spending in various sectors by 2020, emphasizing the growth in market size and the sub-sectors driving this growth, such as apparel & consumer electronics, and international air travel.
Market size, digital spending, consumer electronics, air travel
false
$100 Bn digital consumer spending by 2020Digital consumer spending in India: A $100 Bn opportunity
Single Chart
BCG
View slide
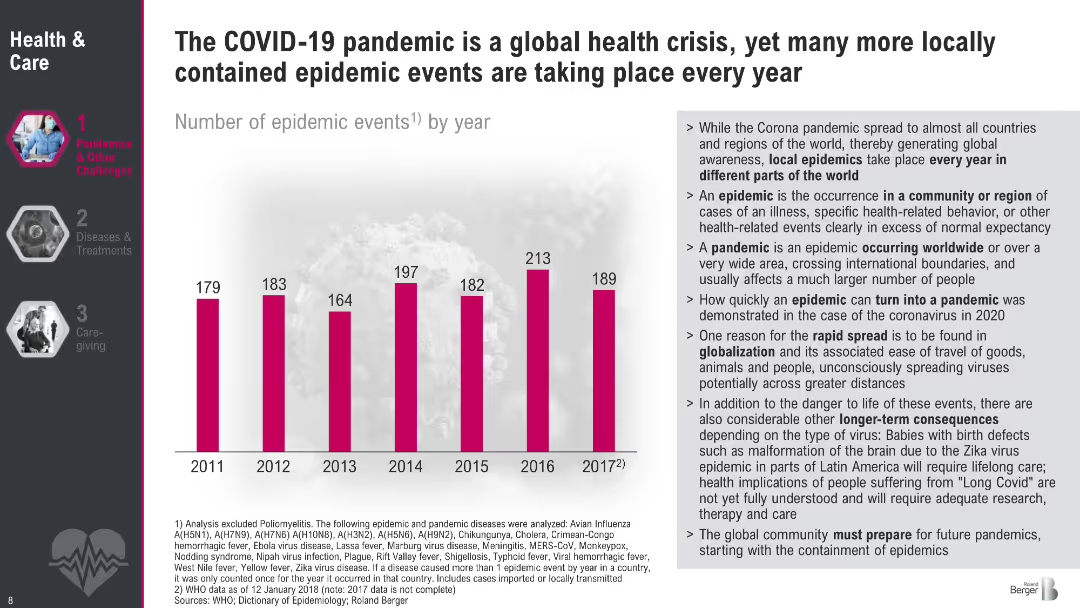
Bar chart layout (2011–2017) on left, text explanations on the right in bullet format; uses pink bars and gray text; background includes faded virus image; structured and clean design; left-hand navigation visible.
Risk Assessment and Management
Healthcare & Pharmaceuticals
Shows data on annual epidemic events and explains why local epidemics can become global pandemics. Key factors discussed include globalization, mutation speed, and long-term health impacts. Emphasizes the importance of early containment and preparedness in mitigating the spread and consequences of epidemics.
epidemics, local outbreaks, pandemic risk, containment, global health, virus spread, globalization
false
The COVID 19 pandemic is a global health crisis, yet many more locally contained epidemic events are taking place every yearMegatrend 2 Health & Care
Mixed Chart
Roland Berger
View slide
Slide includes a column chart with year-on-year revenue data and growth projections for Hong Kong.
Market Analysis and Trends
Media & Entertainment
Analyzes the projected overall growth in Hong Kong's entertainment and media sector from 2016 to 2025, detailing the recovery from the pandemic.
Hong Kong, E&M, growth, forecast, pandemic
false
Hong Kong projects the entire E&M growth will be 4.4% within 2021-2025Global & Entertainment Media Outlook 2021-2025: Hong Kong summary
Single Chart
PwC/Strategy&
View slide
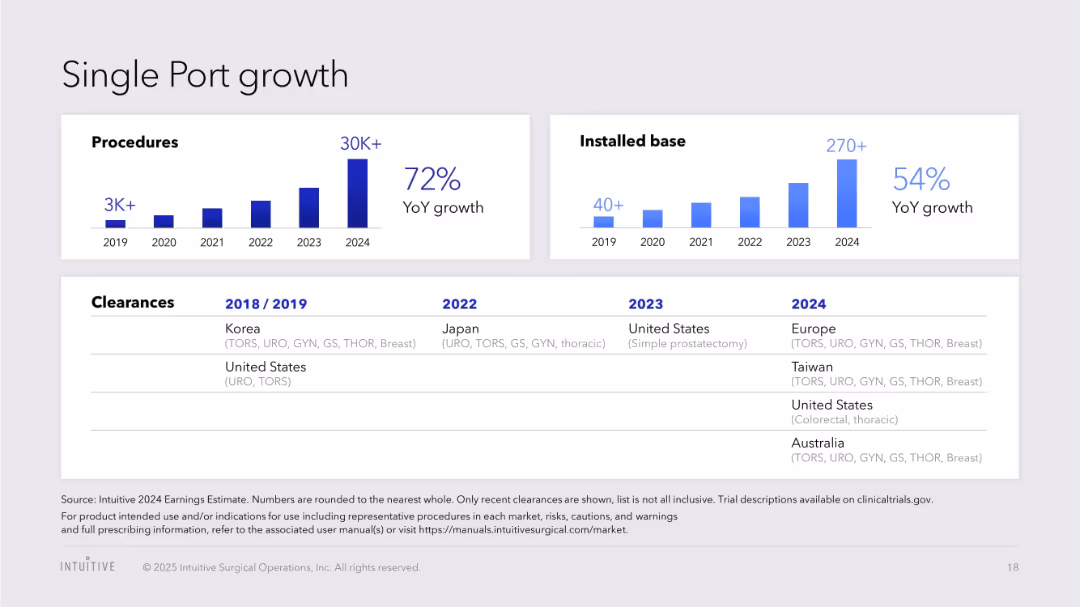
Bar charts for procedures and installed base; global regulatory clearance table
Product and Service Analysis
Healthcare & Pharmaceuticals
Reviews the expansion of Single Port technology with YoY growth in procedures and installations, supported by a timeline of regional clearances.
Single Port, procedures, regulatory approvals, installations, da Vinci, global growth, healthcare robotics
false
Single Port growthJ.P. Morgan Healthcare Conference 2025
Multiple Chart
JP Morgan
View slide
A clear and structured table lists various business groups with corresponding Basel III Capital and ROE data. It's flanked by bar charts illustrating these metrics, providing a comparative and temporal visual analysis.
Regulatory and Compliance
Financial Services
Aimed at conveying Macquarie's capital adequacy and return on equity under Basel III regulations, the slide targets financial analysts and regulatory stakeholders interested in compliance and financial health metrics.
Basel III, capital, ROE, compliance, financial, regulatory, adequacy, analysis, business, metrics
false
Approximate business Basel III Capital and ROEGoldman Sachs 16thAnnual Australia and New Zealand Investment Forum
Table
Goldman Sachs
View slide
The slide uses horizontal bar charts for country-specific results and a pie chart for overall results on the effectiveness of EU tax directives.
Market Analysis and Trends
Financial Services
It details respondents' views on whether EU tax directives simplify compliance obligations, with a country breakdown and overall results.
survey, bar charts, EU directives, compliance
false
Question 25 (new question) 80% of respondents do not consider the EU tax directives to be successful in simplifying tax compliance obligations across th e E U"Deloitte’s 2022 Global Tax Survey: Beyond BEPS
Multiple Chart
Deloitte
View slide
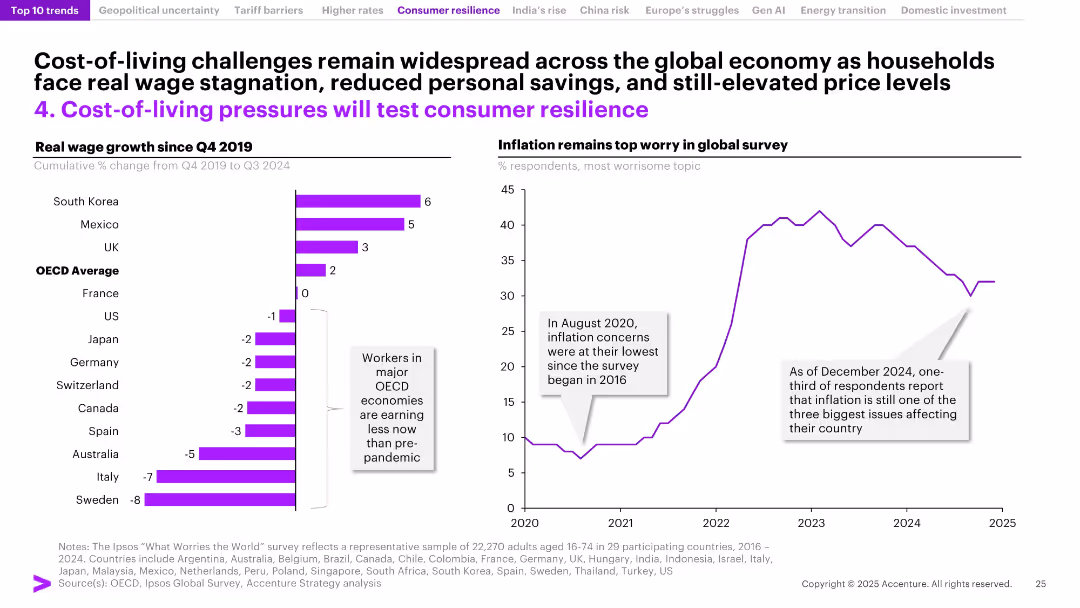
Dual-panel slide with bar chart of wage growth across countries and line chart of global inflation concern trends; uses purple for emphasis.
Strategic Planning
Consumer Goods
The slide examines declining real wages in OECD countries since 2019 and high global inflation concerns. Despite nominal growth in some regions, many major economies are experiencing wage stagnation, fueling consumer anxiety. It highlights inflation as a persistent concern and a significant test of consumer resilience.
real wages, cost of living, inflation, OECD, consumer resilience, income stagnation, savings decline, global concern, wage growth, economic pressure
false
Cost-of-living challenges remain widespread across the global economy as households face real wage stagnation, reduced personal savings, and still-elevated price levelsJanuary Macro Brief
Multiple Chart
Accenture
View slide
Utilizes a stacked area chart to depict the distribution of new COVID-19 cases across US regions from April to July 2020, colored by region.
Market Analysis and Trends
Healthcare & Pharmaceuticals
Presents the regional distribution of new COVID-19 cases in the US, showing how the case load has shifted from the Northeast to the Southern and Western states, providing insights into the dynamics of the pandemic’s domestic spread.
COVID-19, US, cases, regional, 2020
false
The distribution of new cases in the US has shifted from the Northeast to the Southern and Western statesCovid 19: Briefing Materials
Single Chart
McKinsey
View slide
This slide features a detailed diagram and images emphasizing the importance of social impact in luxury purchasing decisions among younger generations. It combines text and visual elements like charts to convey complex social dynamics.
Market Analysis and Trends
Consumer Goods
Highlighting the growing importance of social impact in luxury purchasing, this slide discusses how younger generations, particularly Millennials and Gen Z, prioritize values like diversity and environmental sustainability in their buying decisions. It suggests a shift in luxury market strategies to accommodate these evolving consumer values.
luxury purchasing, social impact, Millennial and Gen Z, diversity, sustainability
false
In particular, urgency for social impact is growing, with younger generations increasingly valuing diversity, equity and inclusion when choosing to buyBAIN-ALTAGAMMA 2020 WORLDWIDE LUXURY MARKET MONITOR
Diagram
Bain
View slide
The slide features two column charts. The left chart shows the composition of the US federal deficit over time. The right chart displays the US federal debt as a percentage of GDP. The charts are moderately dense with detailed annotations and forecast lines.
Market Analysis and Trends
Financial Services
This slide provides an overview of the US federal deficit and debt trends, highlighting forecasted changes. It is useful for analyzing fiscal policy and economic health.
US federal deficit, federal debt, GDP, fiscal policy, economic trends
false
US focus: Fiscal challengesGuide to the Markets UK | Q2 2024
Multiple Chart
JP Morgan
View slide
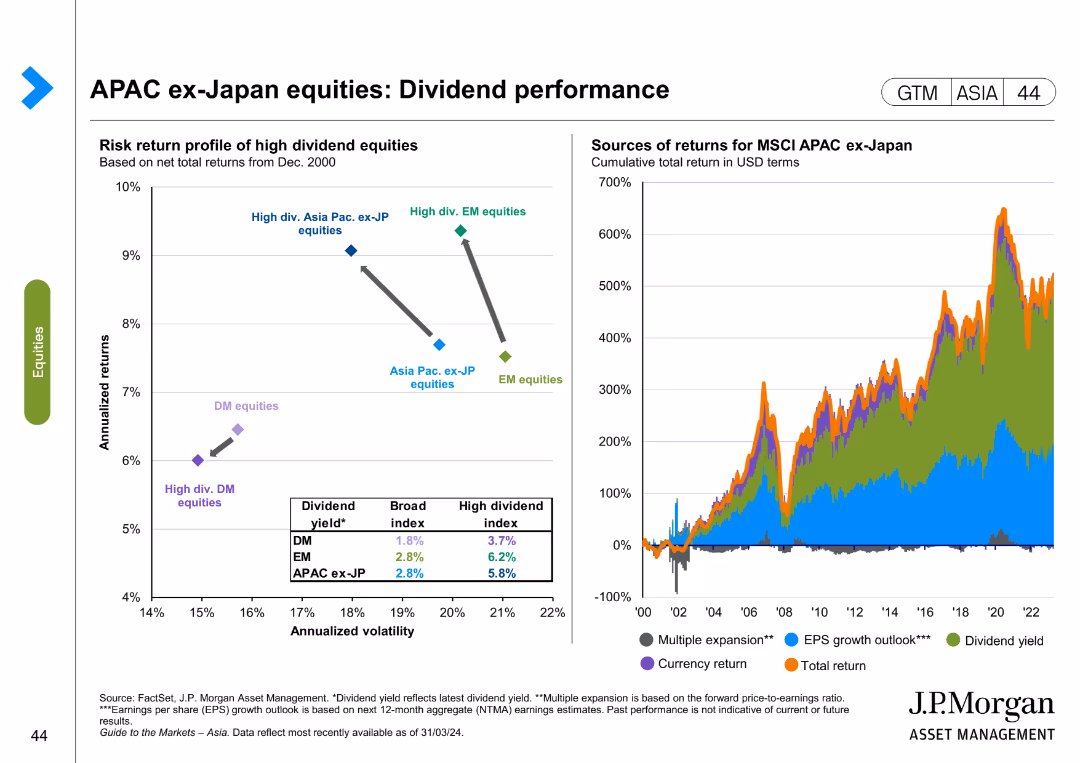
The slide includes a scatter plot showing the risk-return profile of high dividend equities and a line chart depicting sources of returns for MSCI APAC ex-Japan equities. Color coding is used to differentiate data points.
Financial Performance
Financial Services
This slide evaluates dividend performance for APAC ex-Japan equities, comparing risk-return profiles and sources of returns. It is useful for financial performance analysis and investment strategy development.
APAC, dividend performance, risk-return, equities, MSCI, financial analysis, investment strategy
false
APAC ex-Japan equities: Dividend performanceGuide to the Markets Asia | 2Q 2024
Multiple Chart
JP Morgan
View slide
The slide features a detailed case study on HEFA (Hydroprocessed Esters and Fatty Acids) as a viable solution for bio jet fuels in the US, covering the process description, key metrics, feedstock characteristics, and environmental performance.
Client Case Studies
Transportation & Logistics
This slide examines HEFA as a technically viable solution for producing bio jet fuels in the US, detailing the conversion process, key metrics, feedstock characteristics, and environmental impacts associated with HEFA production.
HEFA, bio jet fuel, US, case study, process description, key metrics, feedstock characteristics, environmental performance
false
HEFA appears as the most viable solution from a technical perspective to produce bio jet fuelsDeveloping sustainable carbon circularity Looking at advanced applications and business models
Mixed Chart
Kearney
View slide
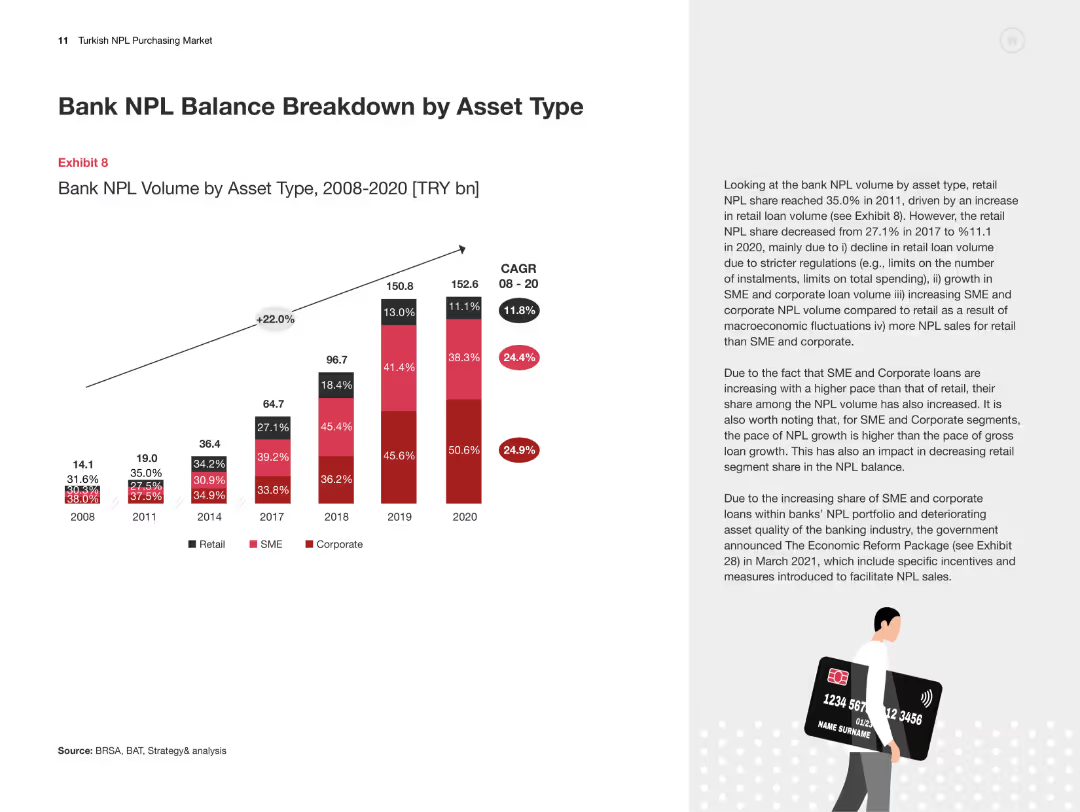
The slide includes a column chart showing the NPL volume by asset type from 2008 to 2020, with detailed text explaining the trends and contributing factors.
Risk Assessment and Management
Financial Services
This slide examines the breakdown of non-performing loan balances by asset type in Turkish banks, highlighting the significant trends and influencing factors over time.
NPL Balance, Asset Type, Turkey, Non-Performing Loans, Risk Factors
false
Bank NPL Balance Breakdown by Asset TypeTurkish NPL Purchasing Market Overview and the way forward
Mixed Chart
PwC/Strategy&
View slide
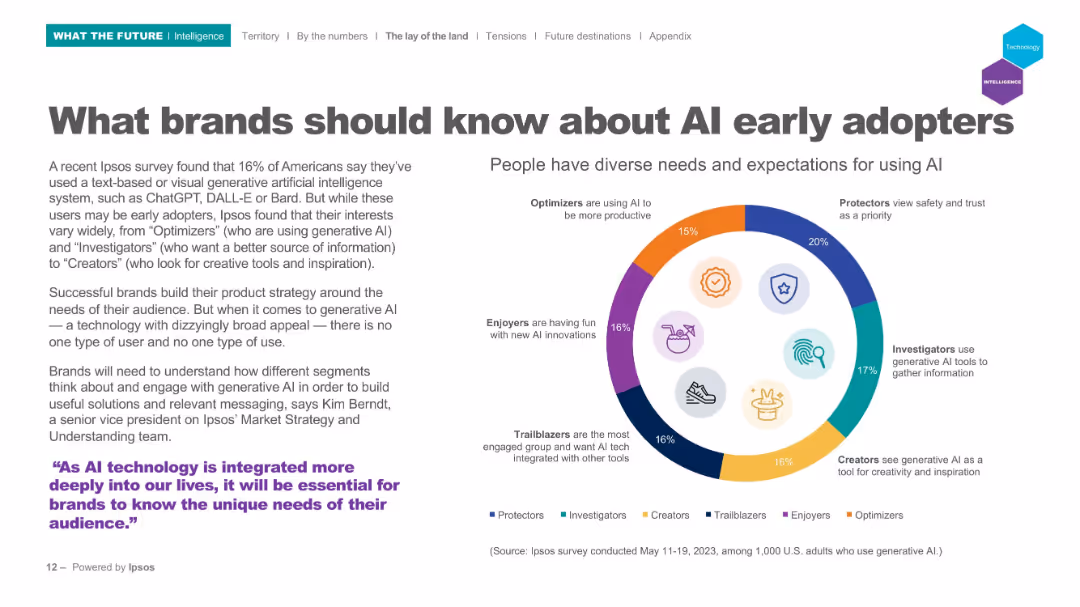
Left-aligned text on white background; right side contains donut chart visualizing six AI user segments.
Customer and Market Segmentation
Technology & Software
Explains the segmentation of early AI adopters into six types: Protectors, Investigators, Creators, Trailblazers, Enjoyers, and Optimizers. Emphasizes the importance of tailoring brand strategies to the varying needs and motivations of each group.
early adopters, segmentation, AI personas, user behavior, brand strategy, Ipsos, generative AI
false
What brands should know about AI early adoptersWHAT THE FUTURE: INTELLIGENCE
Mixed Chart
IPSOS
View slide
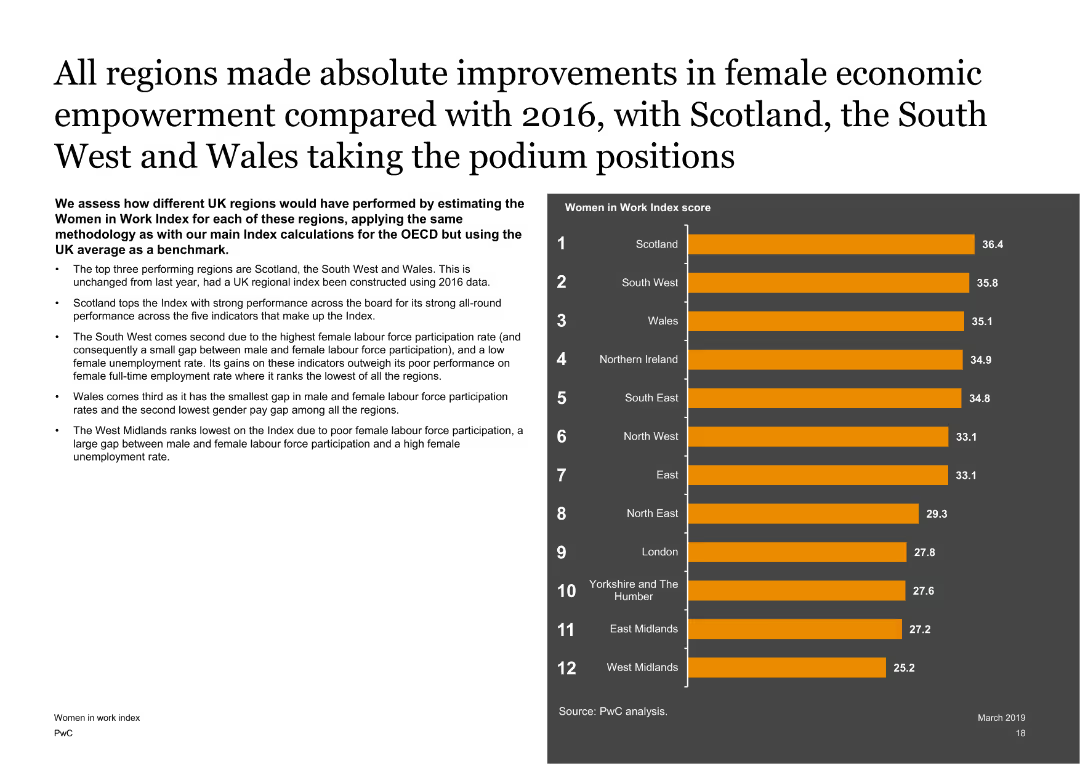
Features a text on the left with a column chart on the right showing Women in Work Index scores for different UK regions. The slide is visually balanced with clear regional comparisons.
Market Analysis and Trends
Government & Public Sector
Assesses the performance of different UK regions on the Women in Work Index, highlighting the top-performing regions like Scotland, the South West, and Wales, and discussing the factors contributing to their scores.
UK regions, Women in Work Index, economic empowerment, regional analysis
false
All regions made absolute improvements in female economic empowerment compared with 2016, with ScotlandWomen in Work Index 2019
Mixed Chart
PwC/Strategy&
View slide
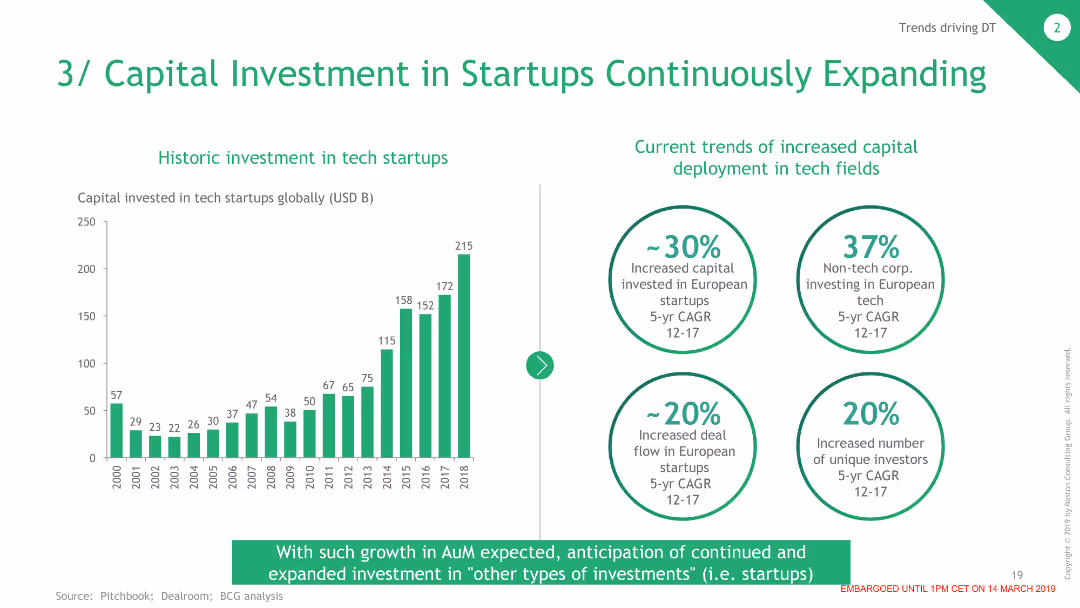
The slide contains a column chart on the left showing historic investments in tech startups and four circular data points on the right summarizing current trends in capital investment.
Investment Analysis
Financial Services
This slide shows the growth in capital investment in tech startups over time and highlights significant trends in increased investment and deal flow in European startups.
Investment, Startups, Capital, Trends, Financial
false
3/ Capital Investment in Startups Continuously ExpandingThe Dawn of the Deep Tech Ecosystem
Mixed Chart
BCG
View slide
Table layout with use case types, average impact, and evolution across waves, using yellow impact indicators.
Operational Efficiency
Financial Services
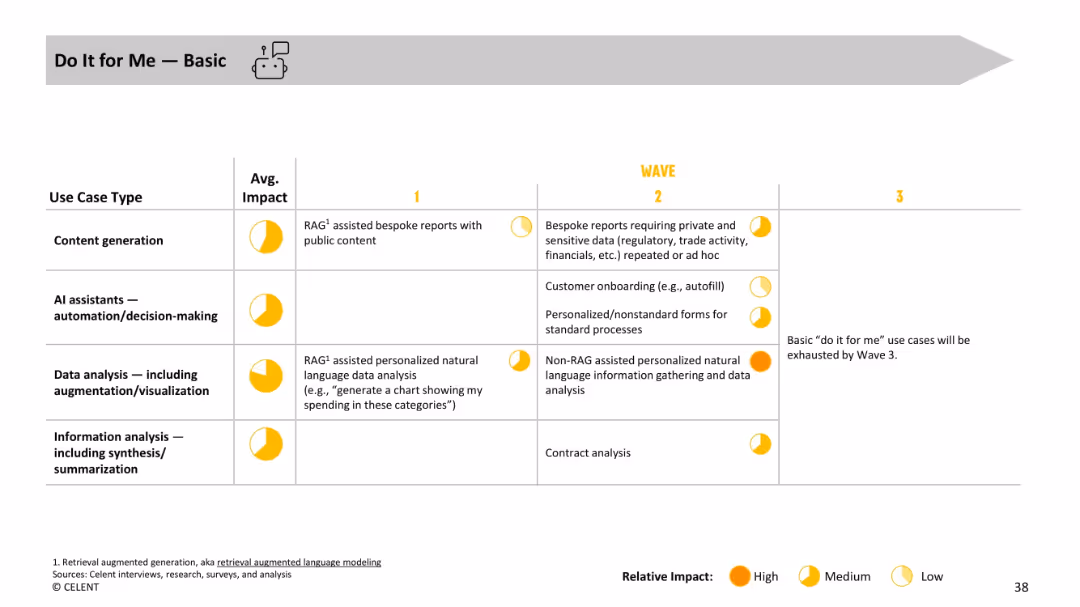
Covers basic “do it for me” GenAI tasks such as generating reports and autofilling forms. Use cases include personalized data visualizations and natural language analysis, showing progression toward non-standard, high-impact use cases.
automation, onboarding, personalization, RAG, reports, natural language processing
false
Do It for Me — BasicGenerative AI Making Waves
Single Chart
Oliver Wyman
View slide
Split layout with left-side chart and right-side analysis; includes data table, bar graph, and callout highlights
Market Analysis and Trends
Transportation & Logistics
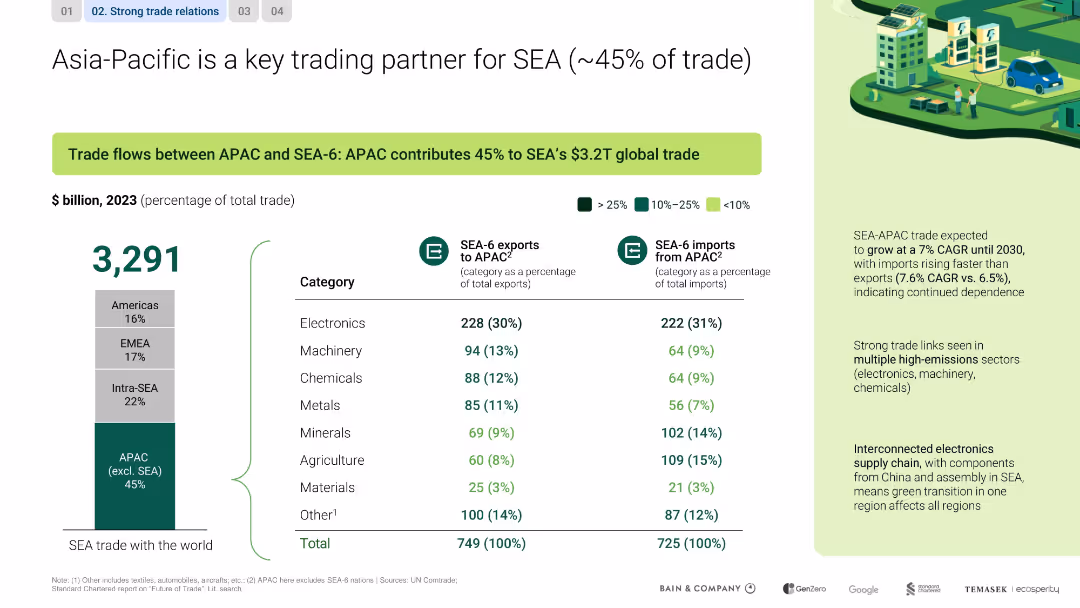
This slide emphasizes APAC’s dominant share (45%) in SEA’s global trade, highlighting electronics, machinery, and chemicals. It notes strong trade growth (7% CAGR) and interdependence in electronics supply chains between regions.
SEA, APAC, trade, electronics, CAGR, interdependence, supply chain
false
Asia-Pacific is a key trading partner for SEA (~45% of trade)Southeast Asia's Green Economy
Mixed Chart
Bain
View slide
Features a column chart for Prime Finance Client Balances by Product Region and a column chart for Synthetics as a percentage of Total Global Prime Finance Revenue.
Financial Performance
Financial Services
Examines the growth in Prime Finance across different regions and the increasing revenue contribution from synthetic products.
prime finance, growth, revenue, synthetic products
false
Market share gains in all regions yielded record revenue and client balances in Prime FinanceCorporate & Investment Bank 2019
Multiple Chart
JP Morgan
View slide
Two-panel chart: top showing Brent crude oil spot prices, bottom showing global inventory changes (bar graph), annotated with key events.
Market Analysis and Trends
Energy & Utilities
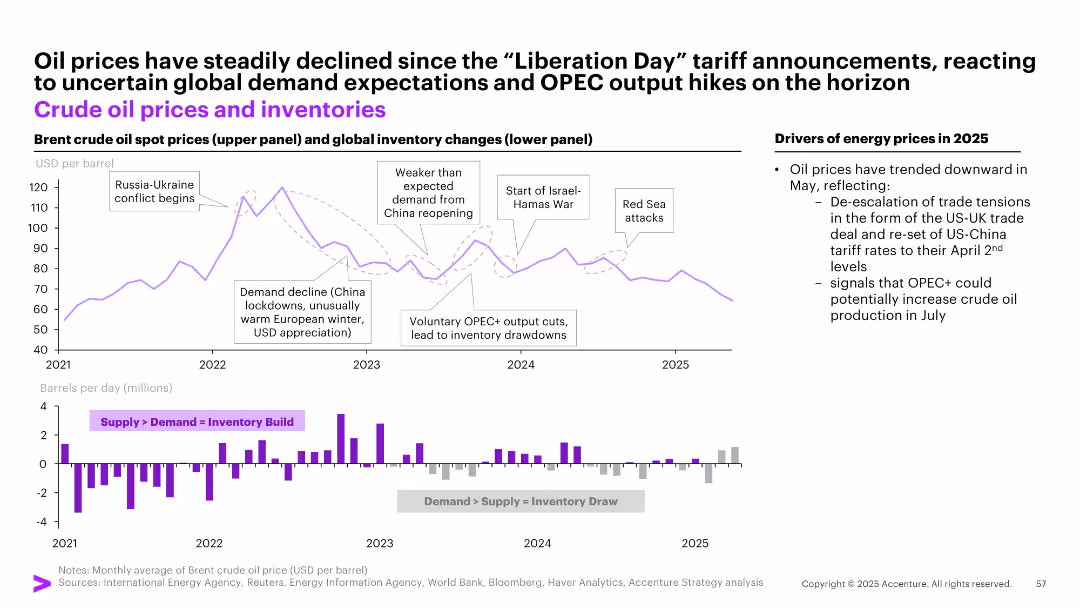
Explains price volatility in crude oil markets from 2021–2025, attributing changes to OPEC+ output adjustments, demand fluctuations, and geopolitical factors like Russia-Ukraine and Israel-Hamas conflicts. Oil prices fell post-tariff announcements amid easing tensions.
oil prices, OPEC+, inventory, Russia, demand, tariff, energy markets, supply shock, war, crude
false
Oil prices have steadily declined since the “Liberation Day” tariff announcements, reacting to uncertain global demand expectations and OPEC output hikes on the horizonMay Macro Brief Consumer spending in flux
Multiple Chart
Accenture
View slide
Shows various graphs and charts detailing the segmentation of the European Earth Observation market over time.
Market Analysis and Trends
Technology & Software
Examines the changes and strategies within the European Earth Observation market, focusing on large satellite segments.
Market evolution, strategy, European EO market, satellite segmentation
false
THE EARTH OBSERVATION UPSTREAM MARKET IN EUROPECOPERNICUS Market report February 2019
Multiple Chart
PwC/Strategy&
View slide
Left panel gives overview of BCG's DMA tool; right panel shows a radar chart with multiple KPIs. Icons and brief explanations summarize off-the-shelf AI solutions and their limitations.
Industry Overview
Technology & Software
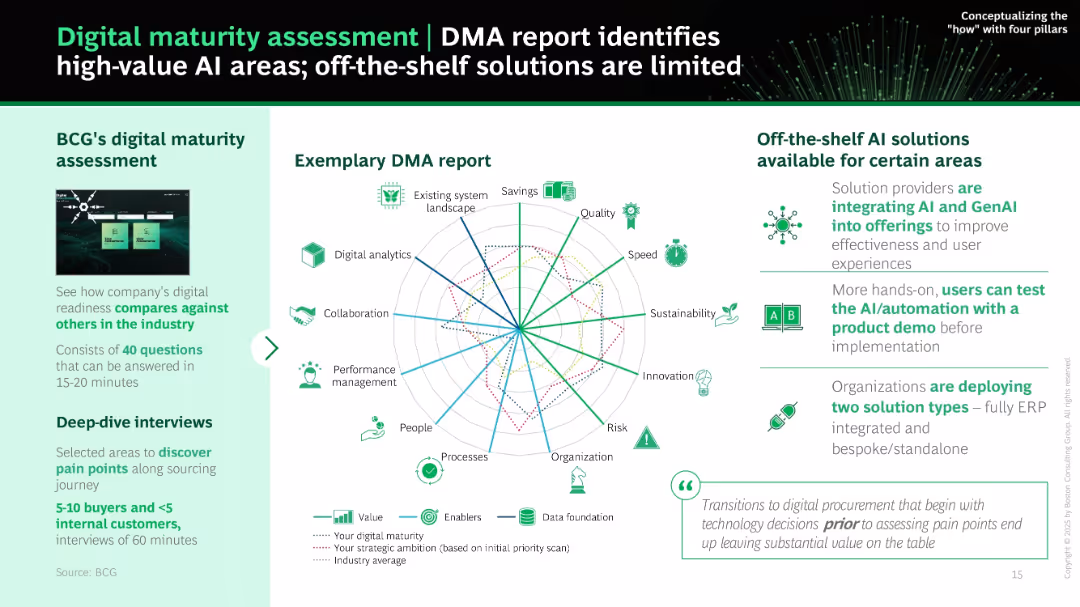
This slide promotes BCG’s digital maturity assessment (DMA) to identify strategic AI implementation areas. It highlights the value of evaluating current readiness and pain points via surveys and interviews before choosing AI tools. Charts illustrate current gaps vs. strategic ambitions.
DMA, maturity assessment, radar chart, AI readiness, off-the-shelf, BCG, pain points, procurement tools
false
Digital maturity assessment | DMA report identifies high-value AI areasMaximizing Value Potential from AI in 2025
Mixed Chart
BCG
View slide
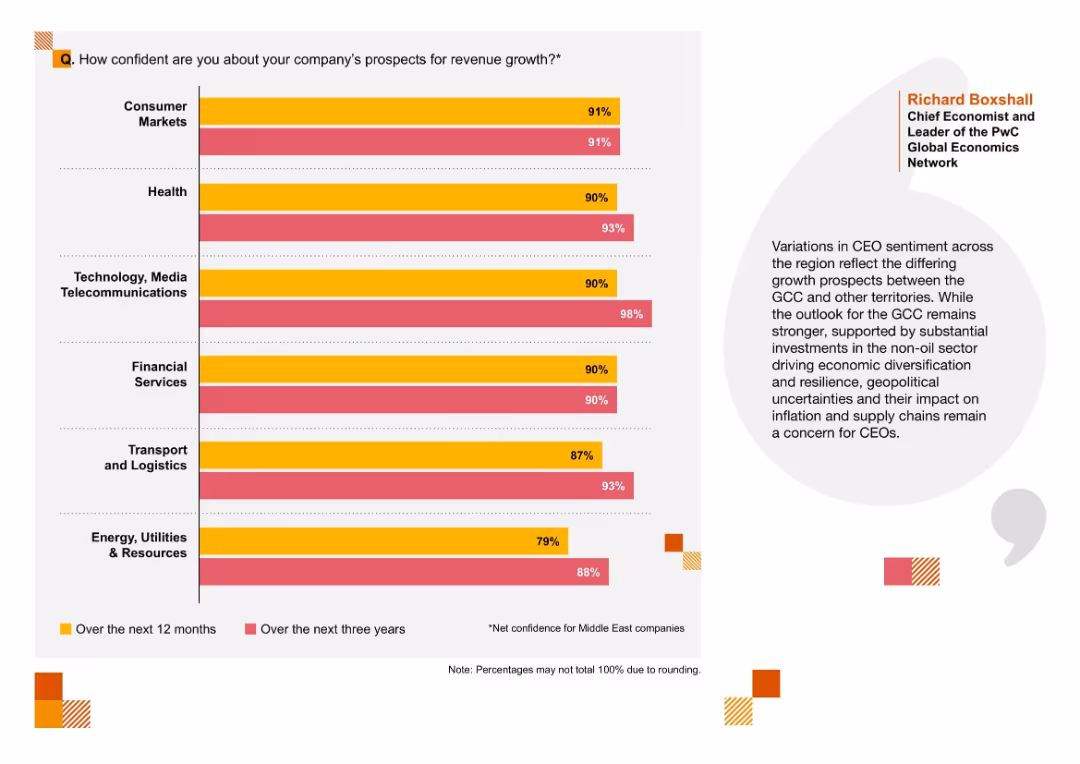
Vertical bar chart comparing confidence levels across industries for revenue growth over 12 months vs three years. Minimalist design with strong color contrast.
Financial Performance
Professional Services
This slide presents CEO confidence in revenue growth across various sectors, showing strongest outlooks in Consumer Markets, Technology, and Health sectors. It uses dual bars per industry to represent confidence over short- and mid-term horizons and reflects regional growth sentiment.
revenue growth, confidence, sectors, short-term, long-term, GCC, consumer markets
false
Q. How confident are you about your company’s prospects for revenue growth?*Capturing opportunities today, reinventing for tomorrow
Mixed Chart
PwC/Strategy&
View slide
Column chart slide with three campaigns showing increases in impressions and corresponding revenue. Each column has a different color representing before and after Nielsen SS.
Financial Performance
Media & Entertainment
Illustrates the impact of increased impressions on revenue, showing significant growth across three campaigns with Nielsen Streaming Signals.
impressions, revenue, campaigns, Nielsen, growth, streaming signals
false
Increasing impressions mean big upsideSpring 2022 National Client Meeting
Single Chart
Nielsen
View slide
Featuring a box plot distribution chart, the slide has a title, descriptive subtext, and clearly labeled axes. Each box plot indicates the inter-quartile and 90th percentile ranges of year-to-date total shareholder returns by industry.
Risk Assessment and Management
Financial Services
Showcases the variability of shareholder returns within industries, highlighting that even companies within the same sector can experience widely different financial performances. Designed for risk analysis within sectors.
Shareholder returns, Variability, Industry analysis, Risk management, Financial performance
false
Even within sectors, there is significant variance between companies Distribution of year-to-date total shareholder returns by industry percent1COVID-19: Briefing Note
Single Chart
McKinsey
View slide
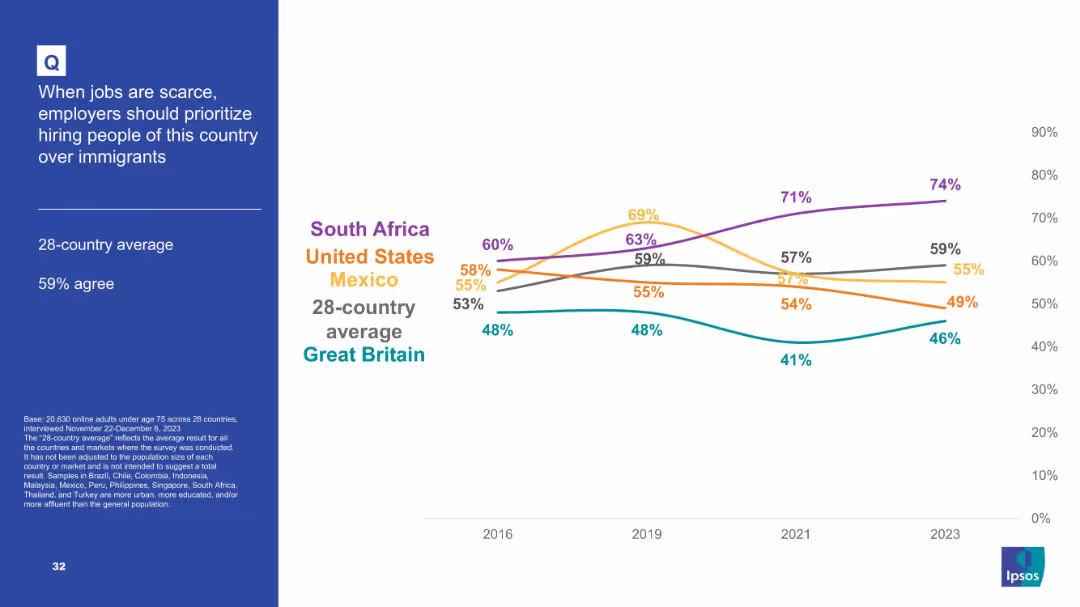
Split layout: left panel with question and stats, right panel features a line chart showing trend data (2016–2023) for selected countries; uses color-coded lines.
Market Analysis and Trends
Government & Public Sector
This slide presents a longitudinal comparison of agreement with the statement that employers should prioritize native citizens over immigrants when jobs are scarce. The line chart tracks sentiment across five countries and a 28-country average from 2016 to 2023, highlighting increasing support in some countries.
immigration, employment, public opinion, trend analysis, labor market, nationalism, Ipsos, 2023 data, country comparison, native preference
false
When jobs are scarce, employers should prioritize hiring people of this country over immigrantsPOPULISM IN 2024
Mixed Chart
IPSOS
View slide
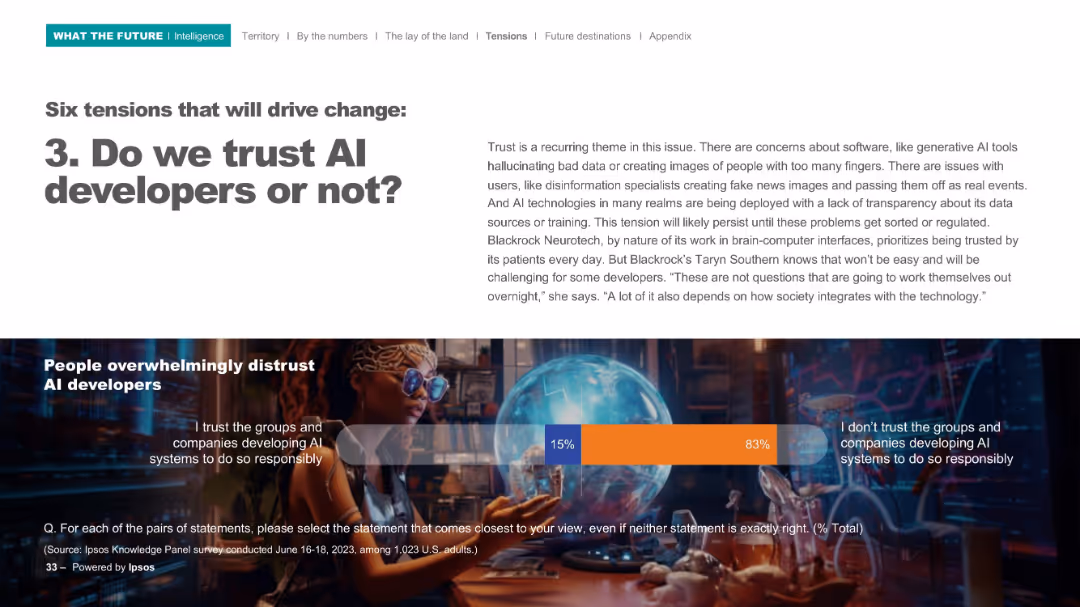
Upper portion includes title and commentary; lower section shows a bar chart indicating trust levels, against a sci-fi visual background.
Risk Assessment and Management
Artificial Intelligence
This slide emphasizes the distrust in AI developers. The majority of people surveyed do not trust companies to develop AI responsibly, reflecting transparency concerns and ethical challenges in AI deployment.
trust, developers, ethics, AI systems, survey
false
3. Do we trust AI developers or not?WHAT THE FUTURE: INTELLIGENCE
Mixed Chart
IPSOS
View slide
Displays column charts comparing net new households and wealth management referrals over several years. The graphs are accompanied by textual explanations and key growth drivers.
Strategic Planning
Financial Services
Discusses the organic growth and enterprise connectivity strategies, highlighting new household acquisition and referral trends within the business, underpinned by a variety of strategic growth drivers.
Organic Growth, Enterprise Connectivity, Net New Households, Wealth Management, Referrals, Growth Drivers, BAC, Market Connectivity
false
Organic Growth and Enterprise Connectivity Power Our BusinessMorgan Stanley Financials Conference
Multiple Chart
Morgan Stanley
View slide
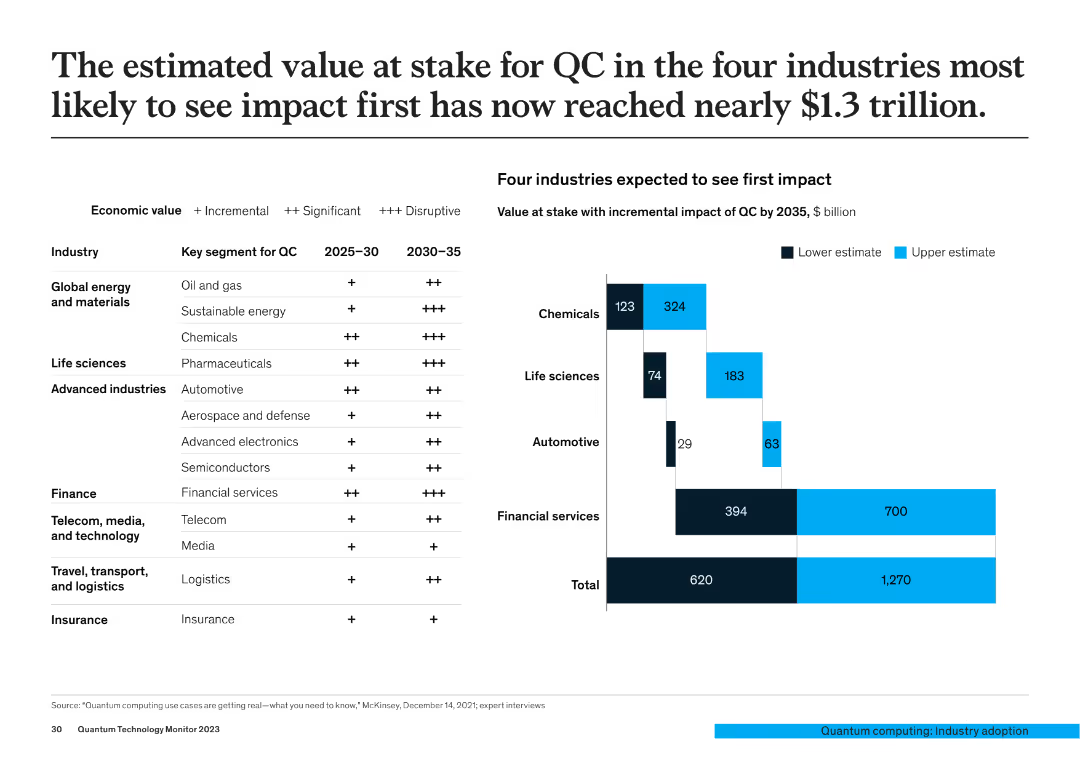
The slide features a table showing economic value segments for QC across different industries and a bar chart detailing the incremental impact value of QC in chemicals, life sciences, automotive, and financial services by 2035.
Market Analysis and Trends
Financial Services
This slide estimates the potential economic impact of QC across four key industries, projecting a nearly $1.3 trillion value at stake, with detailed breakdowns by industry segment.
QC impact, economic value, industry analysis, financial projections, market trends
false
The estimated value at stake for QC in the four industries most likely to see impact first has now reached nearly $1.3 trillion.Quantum Technology Monitor
Mixed Chart
McKinsey
View slide
The slide displays a column chart depicting net profit contribution over five years, paired with a pie chart outlining net operating income by category. The visuals are paired with clear descriptive texts.
Market Analysis and Trends
Financial Services
It outlines the company's profit growth over time and breaks down income by category. The pie chart shows the distribution of operating income, providing insights into the financial structure of the company’s commodities and global markets segment.
Net Profit, Operating Income, Commodities, Financial Analysis, Growth
false
Commodities and Global Markets Provides clients with access to markets, financing, financial hedging, research and market analysis and physical executionGoldman Sachs 16thAnnual Australia and New Zealand Investment Forum
Multiple Chart
Goldman Sachs
View slide
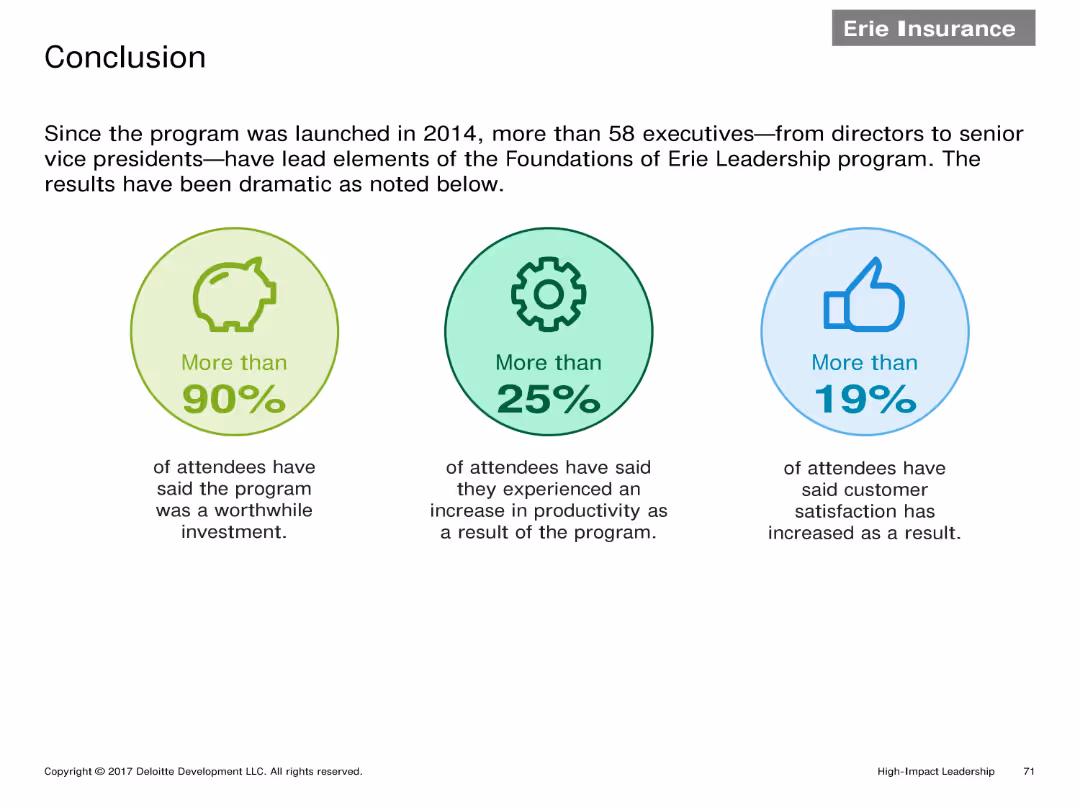
Three infographic elements highlighting key statistics: More than 90% found the program worthwhile, More than 25% saw productivity increase, More than 19% saw customer satisfaction improvement.
Client Case Studies
Financial Services
Summarizes the impact of the Erie Leadership program with key statistics showing high satisfaction rates, increased productivity, and improved customer satisfaction among participants.
Conclusion, statistics, leadership program, satisfaction, productivity
false
Conclusion Since the program was launched in 2014,High-Impact Leadership Master Deck
Pillar
Deloitte
View slide
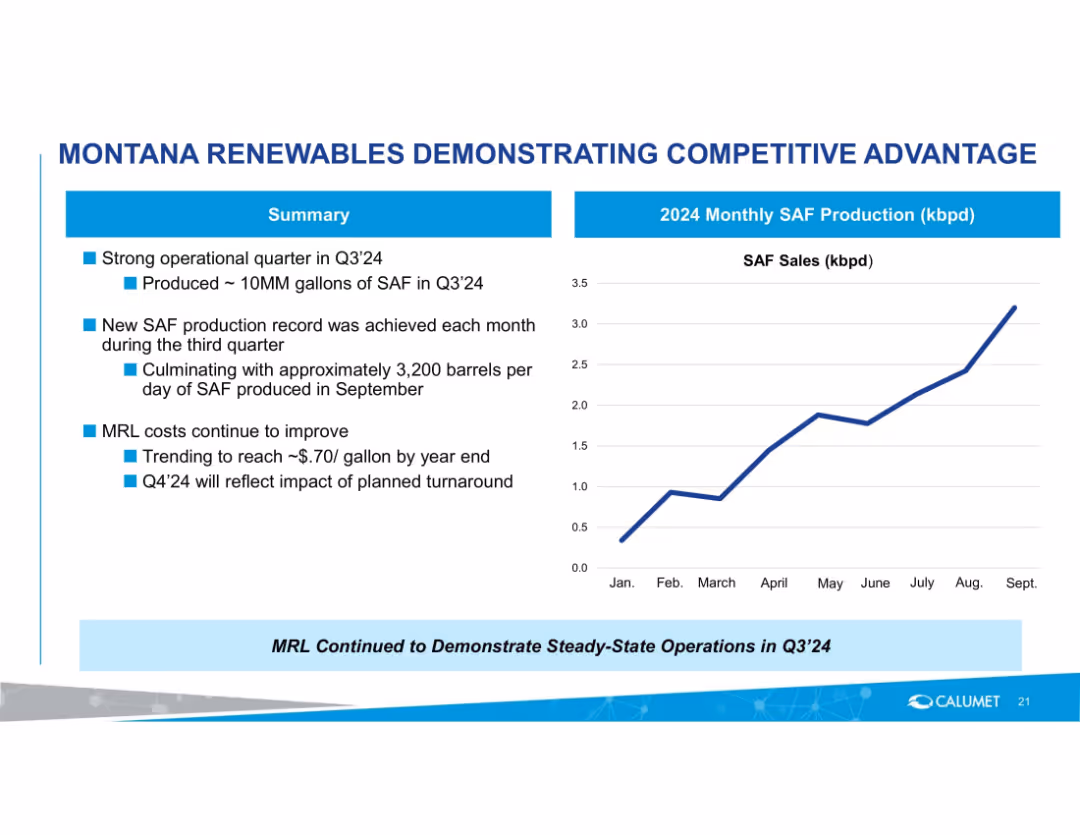
Left side summary bullets with a right side line chart showing monthly SAF production trend in 2024.
Performance Metrics and KPIs
Energy & Utilities
Reports strong Q3'24 production of SAF with monthly growth, culminating at 3,200 barrels/day in September. Notes ongoing cost improvements and anticipated impact of turnaround in Q4'24.
SAF, sustainable aviation fuel, production growth, Q3'24, cost improvement, operations, monthly metrics
false
MONTANA RENEWABLES DEMONSTRATING COMPETITIVE ADVANTAGEGoldman Sachs Carbonomics Conference
Mixed Chart
Goldman Sachs
View slide
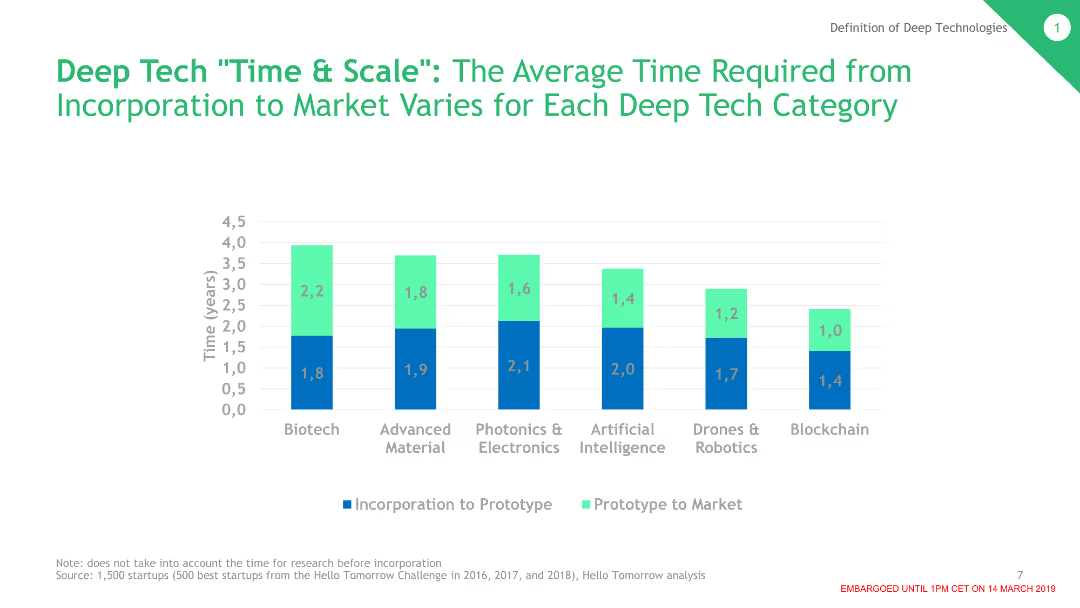
The slide contains a column chart showing the average time required from incorporation to market for various deep tech categories. Each category is represented with different colored columns indicating the stages from incorporation to prototype to market.
Technology and Digital Transformation
Technology & Software
This slide presents data on the time needed for different deep tech categories to go from incorporation to market. Categories include Biotech, Advanced Material, Photonics & Electronics, AI, Drones & Robotics, and Blockchain.
Deep Tech, Time to Market, Biotech, AI, Robotics, Blockchain
false
Deep Tech "Time & Scale": The Average Time Required from Incorporation to Market Varies for Each Deep Tech CategoryThe Dawn of the Deep Tech Ecosystem
Single Chart
BCG
View slide
Contains mainly dense text that describes the number of startups involved in AgTech and their focus areas. The slide is dense with data and uses color to differentiate between segments.
Market Analysis and Trends
Agriculture & Food Production
This slide analyses the precision farming sector within the AgTech industry, highlighting the number of startups, investment trends, and key players in the market. It underlines the significance of sustainable agriculture practices.
AgTech, precision farming, sustainable agriculture, investment, startups
false
Precision FarmingThe Swiss FoodTech Ecosystem 2021
Header Vertical
Accenture
View slide
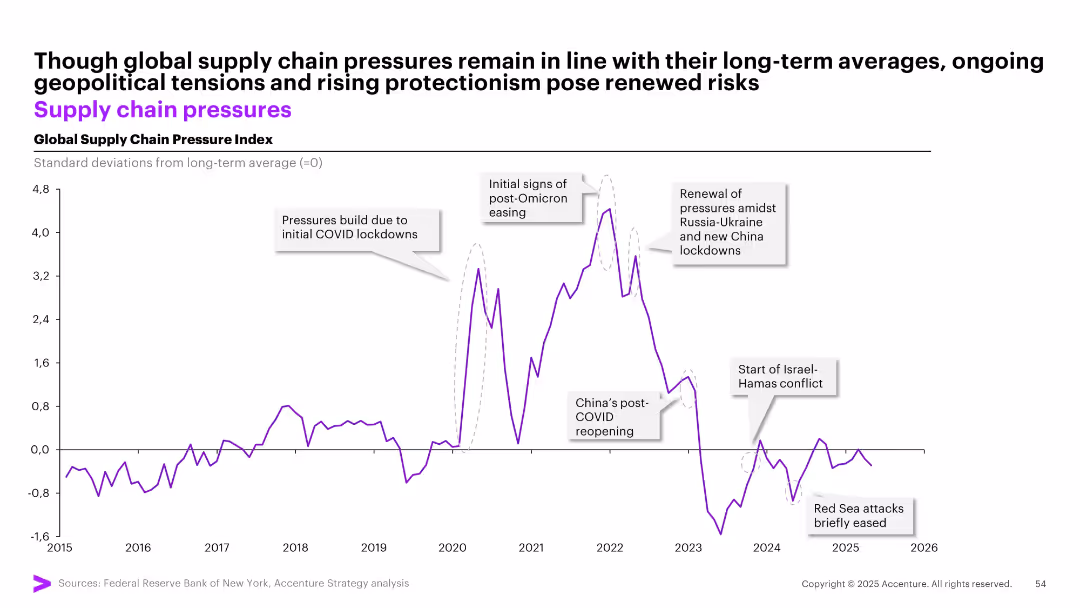
Line chart with annotations and key geopolitical events labeled, showing deviations in global supply chain pressures from the long-term average.
Market Analysis and Trends
Transportation & Logistics
Tracks global supply chain pressure index from 2015 to 2026, highlighting disruptions from events such as COVID-19 lockdowns, Russia-Ukraine conflict, and Red Sea attacks. Despite fluctuations, pressures are nearing long-term average, but risks from protectionism persist.
supply chain, COVID-19, geopolitical risk, logistics, index, pressure, trend, Russia, China, Omicron, Hamas
false
Though global supply chain pressures remain in line with their long-term averages, ongoing geopolitical tensions and rising protectionism pose renewed risksMay Macro Brief Consumer spending in flux
Single Chart
Accenture
View slide
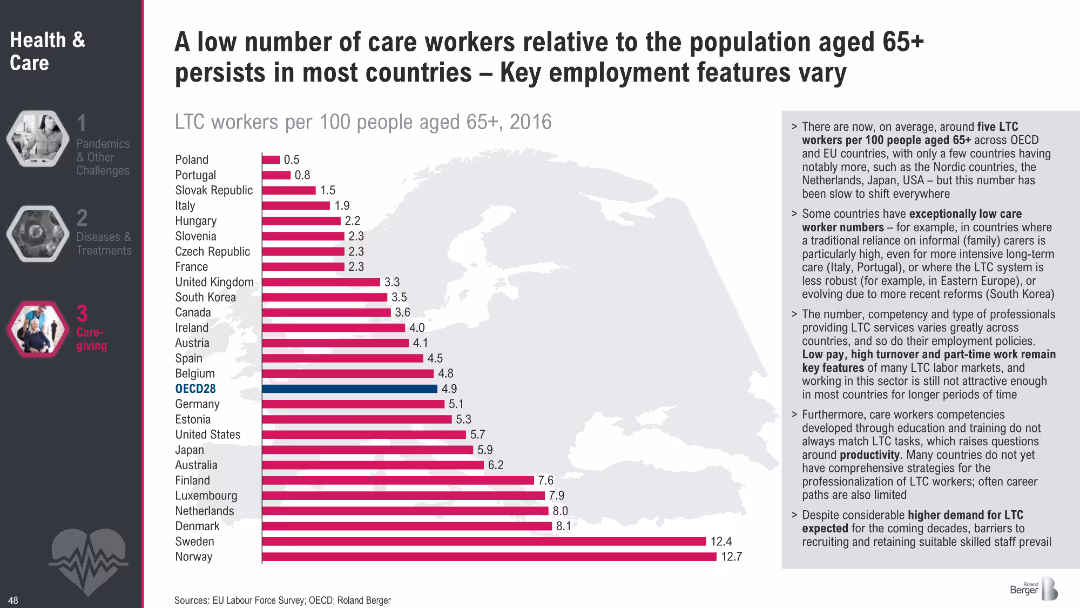
Bar chart ranking countries by LTC workers per 100 people aged 65+; side text outlines causes for variation and key challenges in care employment.
Human Resources and Talent Management
Healthcare & Pharmaceuticals
This slide highlights the low number of LTC workers relative to aging populations in most countries, with wide variations. It points to systemic employment challenges, including low pay, high turnover, and insufficient professional training.
LTC workforce shortage, care worker density, aging population, eldercare employment, international comparison, labor market
false
A low number of care workers relative to the population aged 65+ persists in most countries Key employment features varyMegatrend 2 Health & Care
Mixed Chart
Roland Berger
View slide
A scatter plot showing the relationship between IT spending per employee and value-added per employee for different countries. The countries are grouped and color-coded into different regions.
Market Analysis and Trends
Technology & Software
The slide analyzes IT intensity across various countries by comparing IT spending per employee to the economic value added per employee, used for international market comparisons.
IT Intensity, Country Analysis, Economic Value, IT Spending, International Comparison
false
Country Level IT IntensityGartner delivers actionable, objective insight, guidance and tools to enable stronger performance on your organization’s mission critical priorities
Single Chart
Gartner
View slide
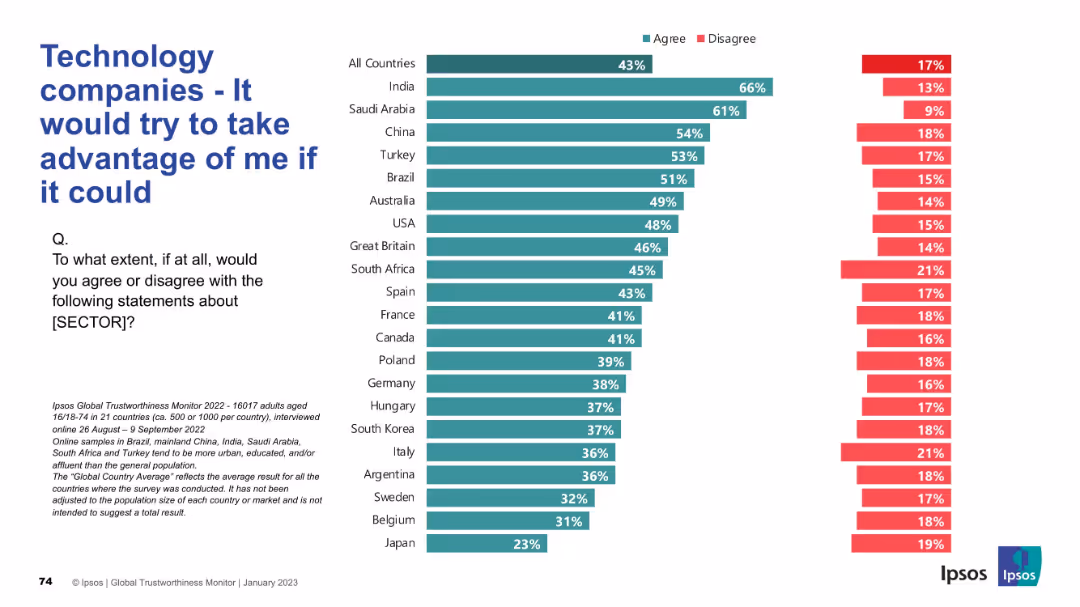
Agreement and disagreement stats across countries; negative sentiment focus; bar chart format.
Risk Assessment and Management
Technology & Software
The slide reflects public concern over the perceived exploitative potential of technology companies, with data showing who believes firms would act unethically if they could.
exploitation, distrust, tech sector, risk, ethics, Ipsos, negative sentiment, public opinion, global survey, corporate behavior
false
Technology companies - It would try to take advantage of me if it couldIPSOS GLOBAL TRUSTWORTHINESS MONITOR January 2023
Mixed Chart
IPSOS
View slide
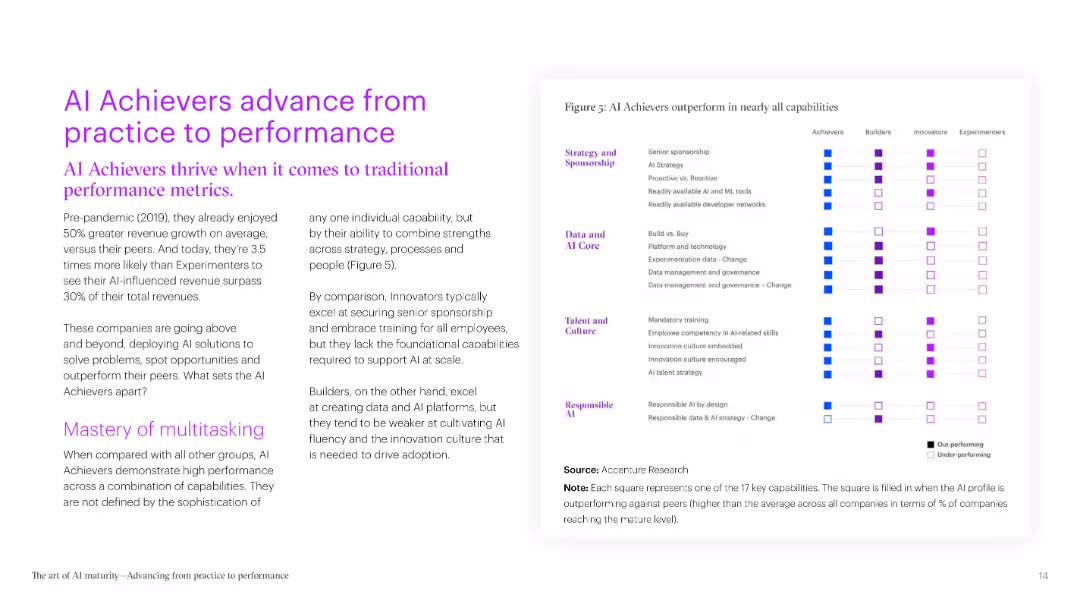
The slide includes a horizontal bar chart showing the stages of AI use in different functions. It features clear distinctions between Achievers and Experimenters, making the data easy to interpret.
Technology and Digital Transformation
Technology & Software
It discusses the transition of AI projects from pilot phases to full production, using Procter & Gamble as a case study. The slide highlights the effectiveness of scaling AI solutions across enterprises.
AI production, case study, scalability, implementation, pilot projects
false
AI Achievers advance from practice to performanceThe art of AI maturity Advancing from practice to performance
Boxed
Accenture
View slide
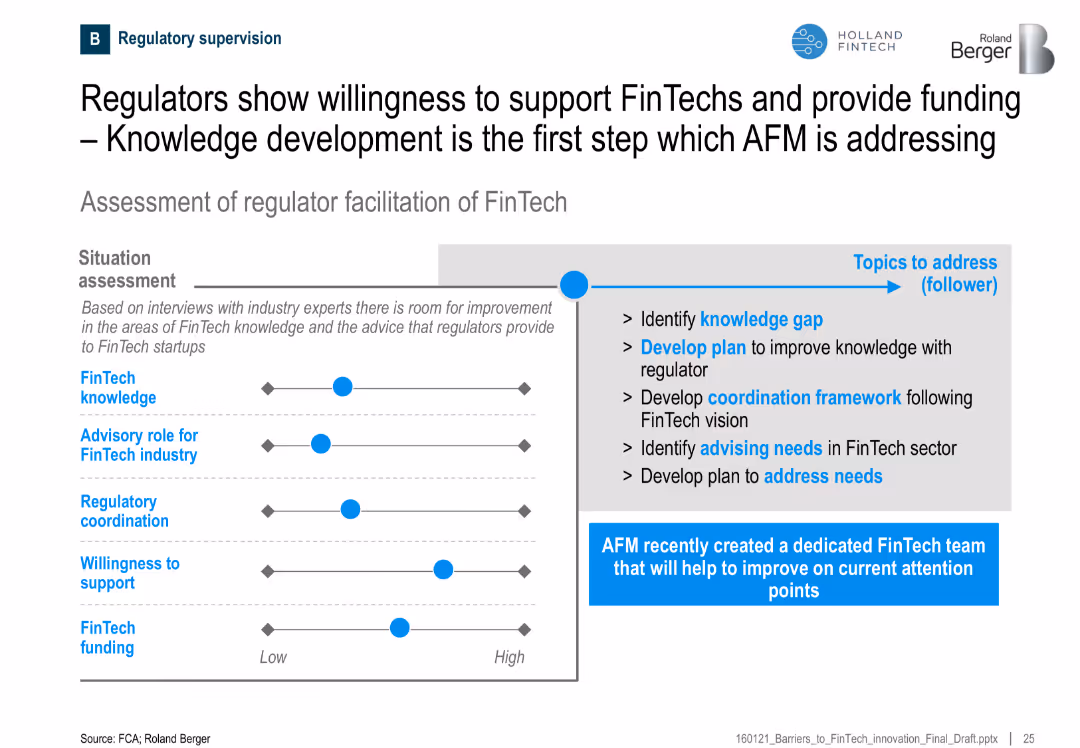
Horizontal layout with a slider-style assessment of regulatory aspects on the left and action points on the right
Regulatory and Compliance
Financial Services
This slide assesses the current state of regulator support for FinTechs and suggests areas of improvement, including knowledge development, coordination, and advisory roles. A dedicated FinTech team by AFM is highlighted.
FinTech, regulators, knowledge, support, coordination, advisory, funding, AFM
false
Regulators show willingness to support FinTechs and provide funding – Knowledge development is the first step which AFM is addressingBarriers to FinTech innovation in the Netherlands
Mixed Chart
Roland Berger
View slide
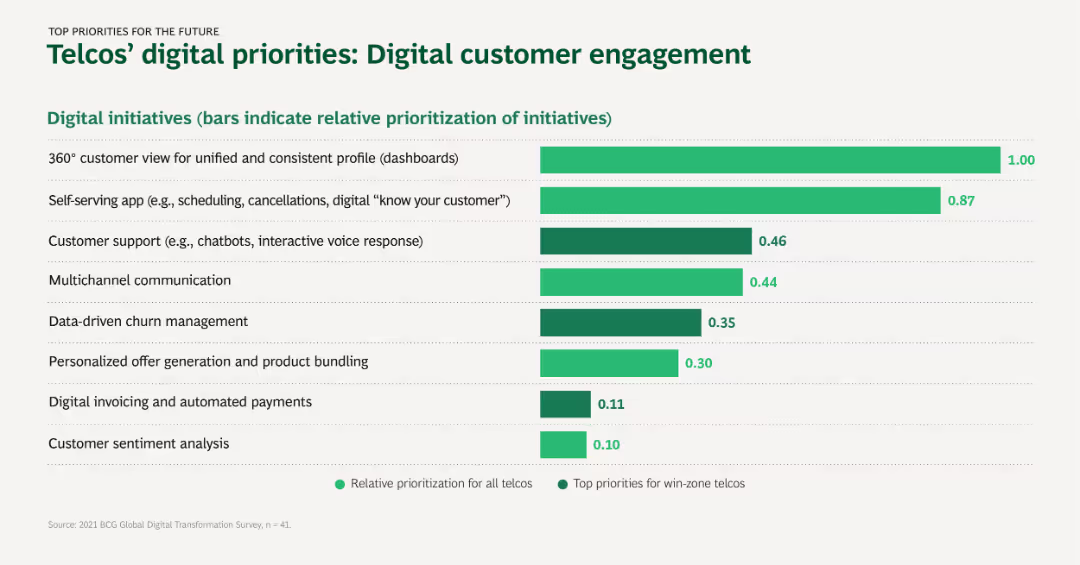
The slide features a bar chart ranking digital initiatives by their prioritization among telcos, with a focus on 360° customer view and self-serving apps.
Customer and Market Segmentation
Telecommunications
This slide highlights the top digital initiatives prioritized by telcos for enhancing customer engagement, emphasizing the importance of a unified customer view and interactive customer support tools.
Digital customer engagement, Telcos, Prioritization, 360° customer view, Self-serving apps
false
Telcos’ digital priorities: Digital customer engagementTELECOMMUNICATIONS The Rates of Success, Goals, and Future Priorities of Digital Transformations, by Sector
Single Chart
BCG
View slide
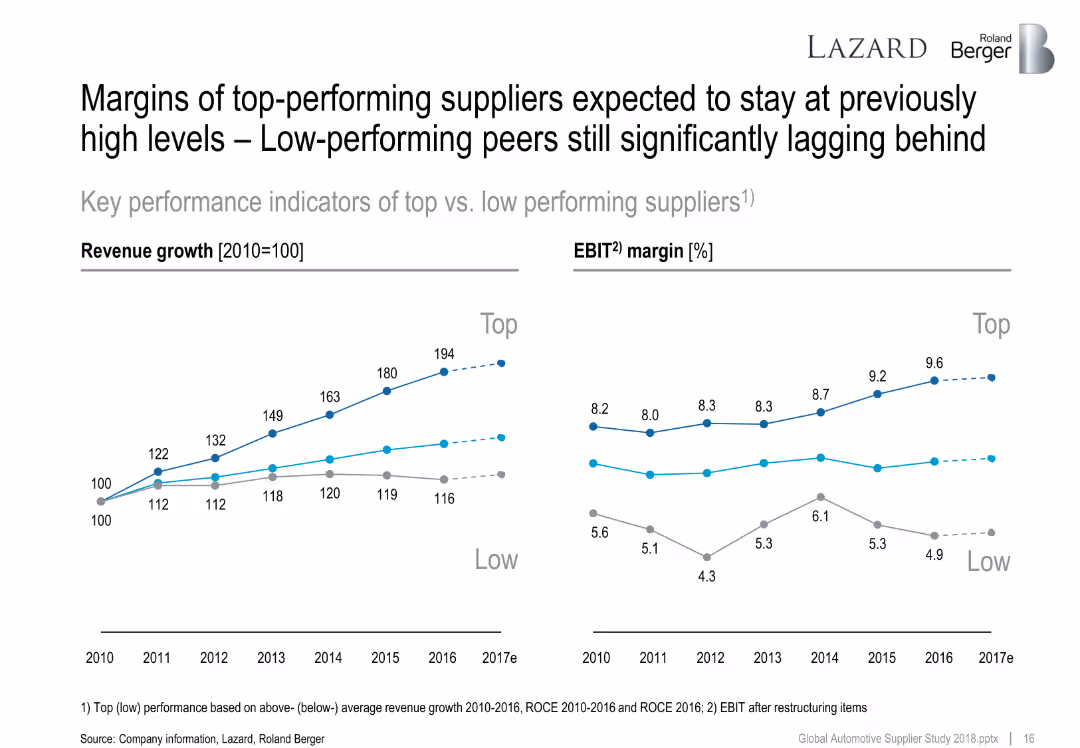
Line graphs showing revenue growth and EBIT margins from 2010–2017 for top vs. low performing suppliers.
Performance Metrics and KPIs
Industrial & Manufacturing
Highlights long-term margin and revenue growth differences between top and low performers. Top players maintain higher EBIT and consistent revenue increases, underscoring structural competitive advantages.
revenue growth, EBIT margin, performance comparison, suppliers, top vs low performers
false
Margins of top-performing suppliers expected to stay at previously high levels – Low-performing peers still significantly lagging behindThe overall positive sentiment was also reflected in the supplier valuation levels that still trade above their long-term average
Multiple Chart
Roland Berger
View slide
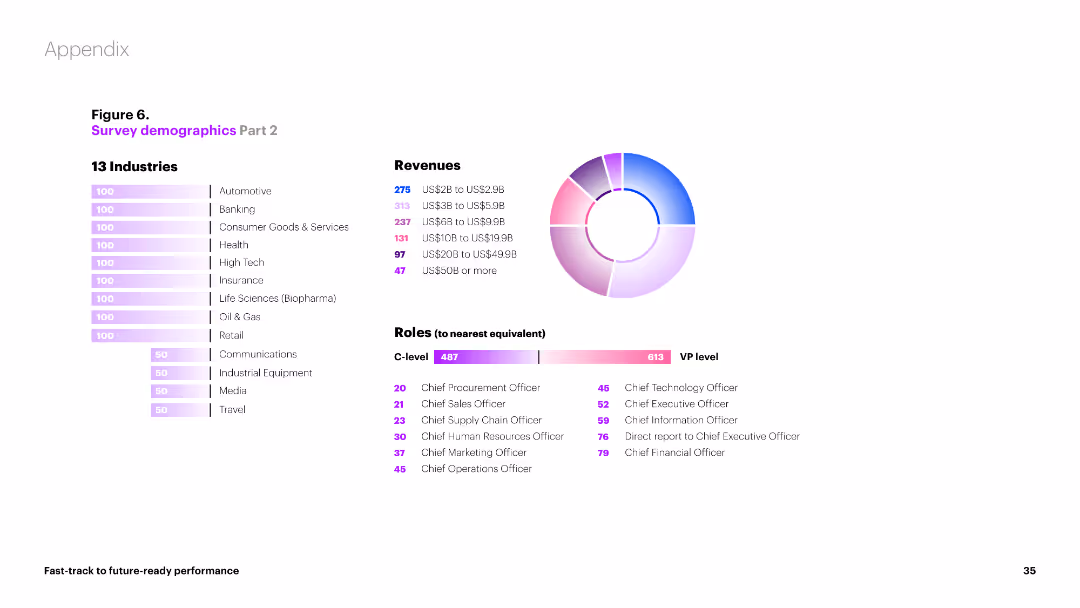
Bar charts and a pie chart showing the distribution of survey participants by industry, revenue, and roles. Different colors and sections indicate various categories.
Market Analysis and Trends
Professional Services
This slide provides a breakdown of survey participants by industry, revenue brackets, and roles. It includes visual data on the number of participants from different sectors and their respective revenues.
demographics, industry, revenue, roles, participants
false
Figure 6. Survey demographics Part 2FAST-TRACK TO FUTURE-READY PERFORMANCE
Multiple Chart
Accenture
View slide
Timeline slide depicting steps before and after becoming a public company, focusing on SOX compliance. Clear labels and distinct phases marked.
Regulatory and Compliance
Financial Services
Outlines the timeline for SOX compliance readiness, detailing pre-IPO and post-IPO activities and requirements.
SOX, compliance, timeline, IPO, public company, regulatory, finance
false
Illustrative SOX readiness timelineMerging with a SPAC & preparing for life as a public company
Table
PwC/Strategy&
View slide
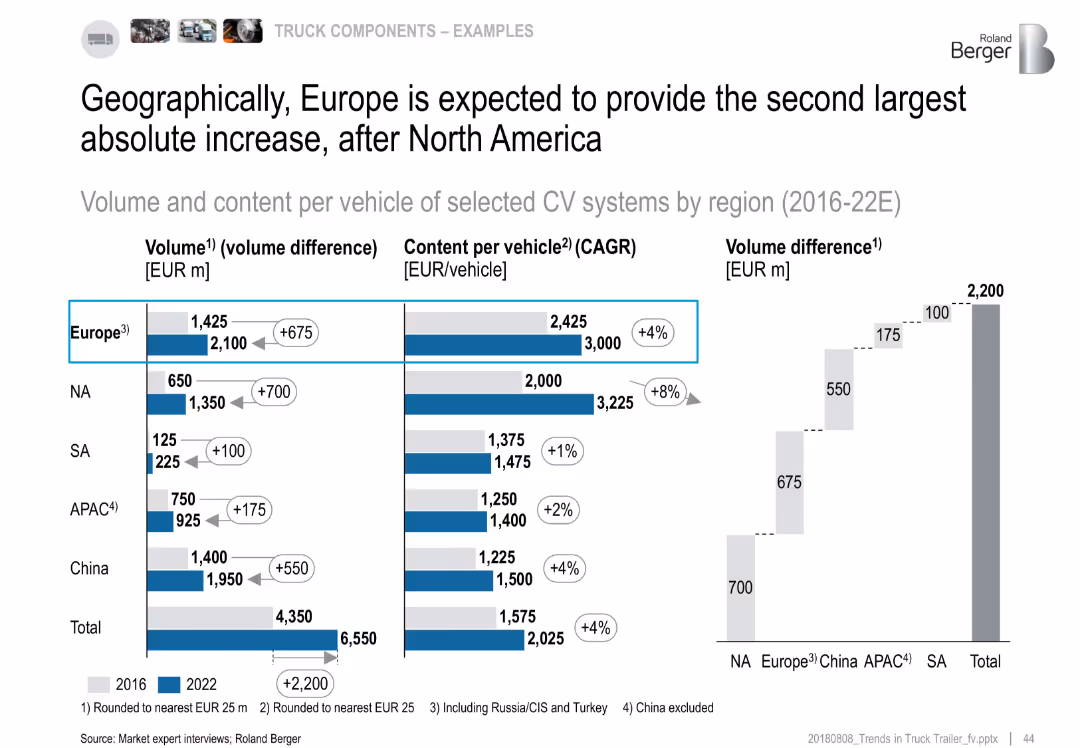
Multi-panel bar chart showing regional CV system market growth (volume & content per vehicle) between 2016–22
Market Analysis and Trends
Industrial & Manufacturing
Europe is projected to contribute €675m in CV system value growth, second only to North America. NA shows the highest CAGR in content per vehicle (8%). China, APAC, and SA also show positive growth, but at lower absolute or percentage levels.
regional growth, CV systems, Europe, North America, CAGR, content per vehicle, 2016–22
false
Geographically, Europe is expected to provide the second largest absolute increase, after North AmericaTrends in the truck & trailer market
Multiple Chart
Roland Berger
View slide
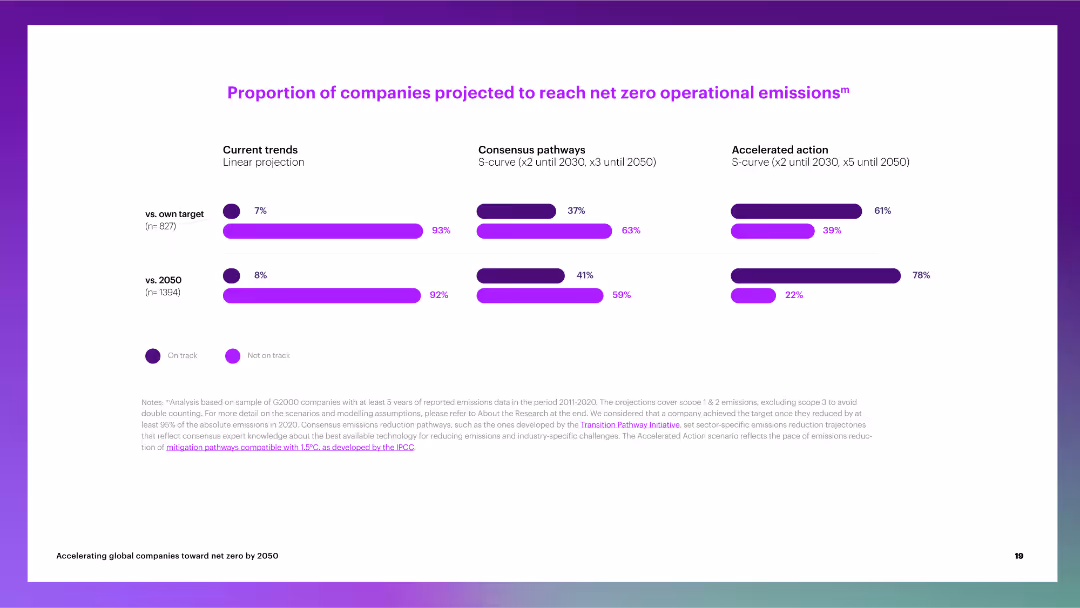
The slide includes a set of column charts comparing current trends, consensus pathways, and accelerated actions for reaching net zero emissions.
Market Analysis and Trends
Environmental Services & Sustainability
The slide evaluates the likelihood of companies reaching net zero operational emissions under different scenarios, highlighting significant gaps in current trends.
net zero, operational emissions, current trends, consensus pathways, accelerated actions, projections
false
Proportion of companies projected to reach net zero operational emissionsmAccelerating global companies toward net zero by 2050
Multiple Chart
Accenture
View slide
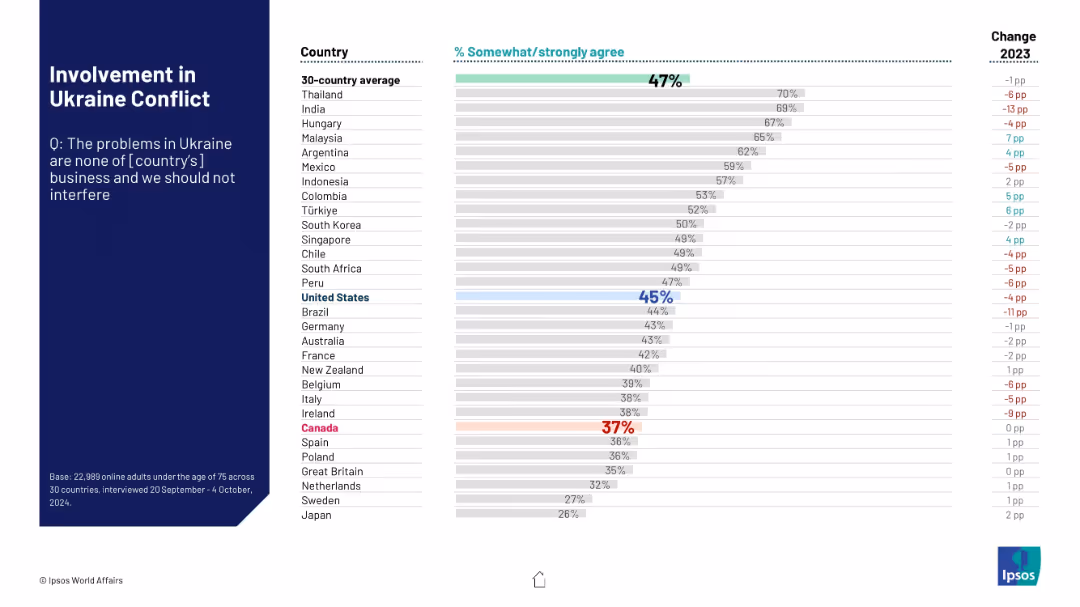
Horizontal bar chart ranking agreement that Ukraine is not their country’s concern. Sidebar on the left with title and survey question.
Risk Assessment and Management
Government & Public Sector
This slide assesses the level of agreement among different populations that their country should not interfere in the Ukraine conflict. Data reveals contrasting degrees of neutrality or disengagement sentiment among surveyed nations.
Ukraine war, international involvement, neutrality, Ipsos, public sentiment, foreign policy, disengagement, global conflict, survey data
false
Involvement in Ukraine ConflictWORLD AFFAIRS
Mixed Chart
IPSOS
View slide
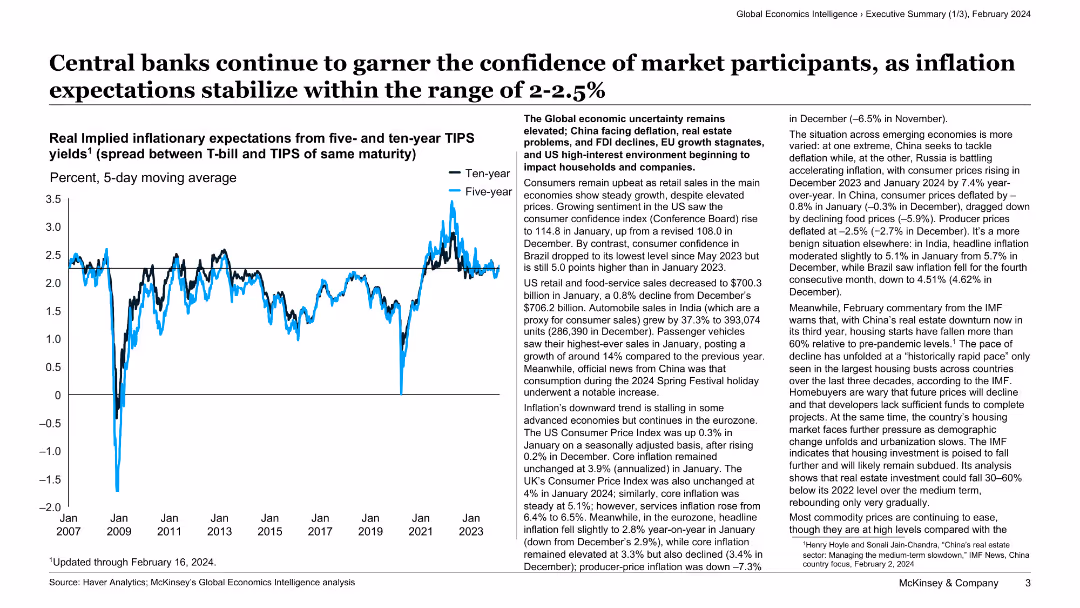
The slide has a white background with a line chart depicting inflation expectations and a text block summarizing economic trends.
Market Analysis and Trends
Financial Services
This slide discusses the stability of inflation expectations and central bank confidence, supported by a line chart showing real implied inflationary expectations for five- and ten-year TIPS.
central banks, inflation, market confidence, economic trends, financial services, analysis, stability, TIPS, expectations, overview
false
Central banks continue to garner the confidence of market participants, as inflation expectations stabilize within the range of 2-2.5%Global Economics Intelligence January 2024
Mixed Chart
McKinsey
View slide
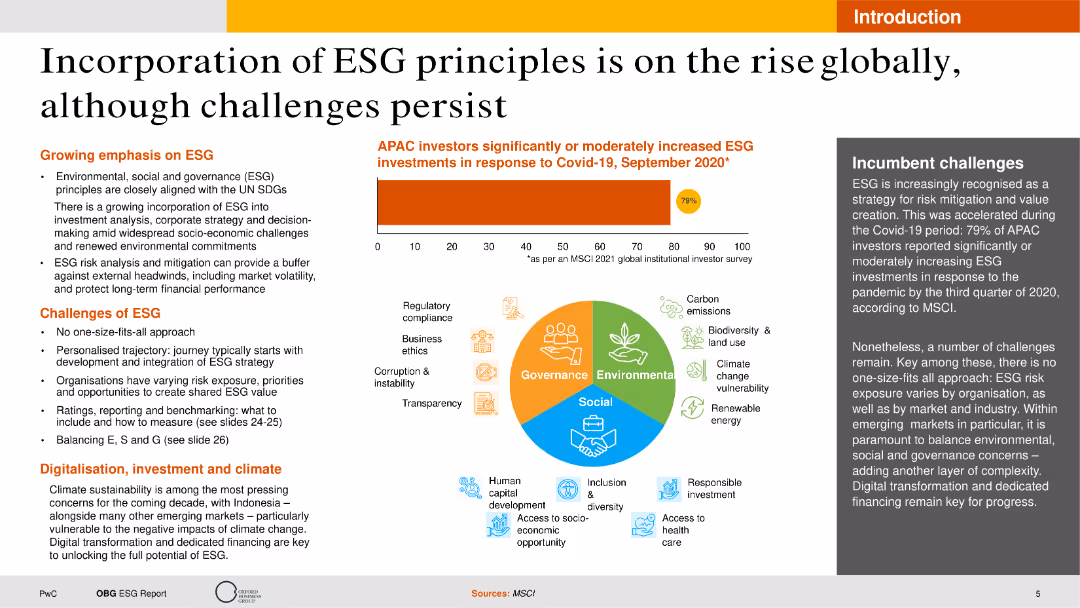
The slide features multiple text sections with a column chart showing ESG investment increases and an infographic illustrating governance, environmental, and social components. The layout is visually balanced with ample white space.
Strategic Planning
Environmental Services & Sustainability
This slide explains the growing emphasis on ESG principles, highlighting challenges, digital investment, and climate sustainability. It provides insights into the importance of ESG in investment analysis and long-term financial performance.
ESG, Sustainability, Investment, Challenges, Trends
false
Incorporation of ESG principles is on the rise globally, although challenges persistIndonesia’s Sustainable Transformation
Mixed Chart
PwC/Strategy&
View slide
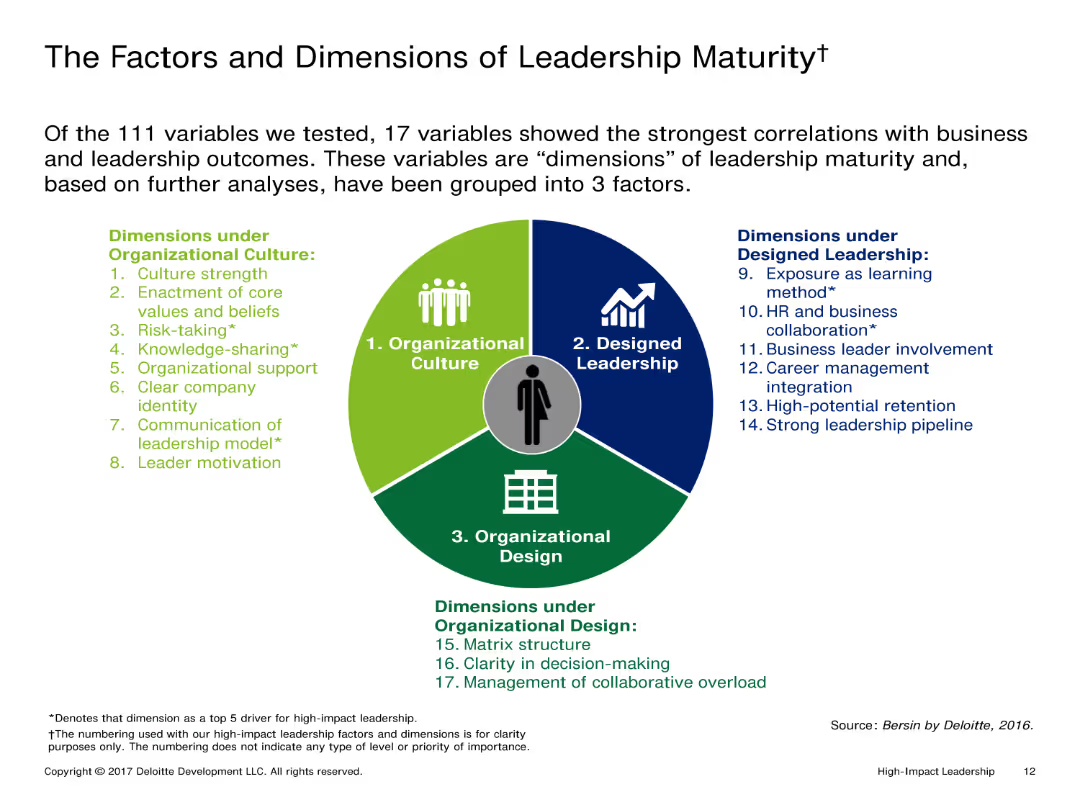
This slide features a circular diagram divided into three segments, each representing different factors of leadership maturity. The diagram is colorful, with icons and text annotations explaining each segment.
Market Analysis and Trends
Professional Services
The slide outlines 17 variables of leadership maturity, grouped into three main factors: Organizational Culture, Designed Leadership, and Organizational Design. It emphasizes the correlation between these variables and leadership outcomes.
Leadership, Maturity, Organizational Culture, Design, Development
false
The Factors and Dimensions of Leadership Maturity†High-Impact Leadership Master Deck
Diagram
Deloitte
View slide
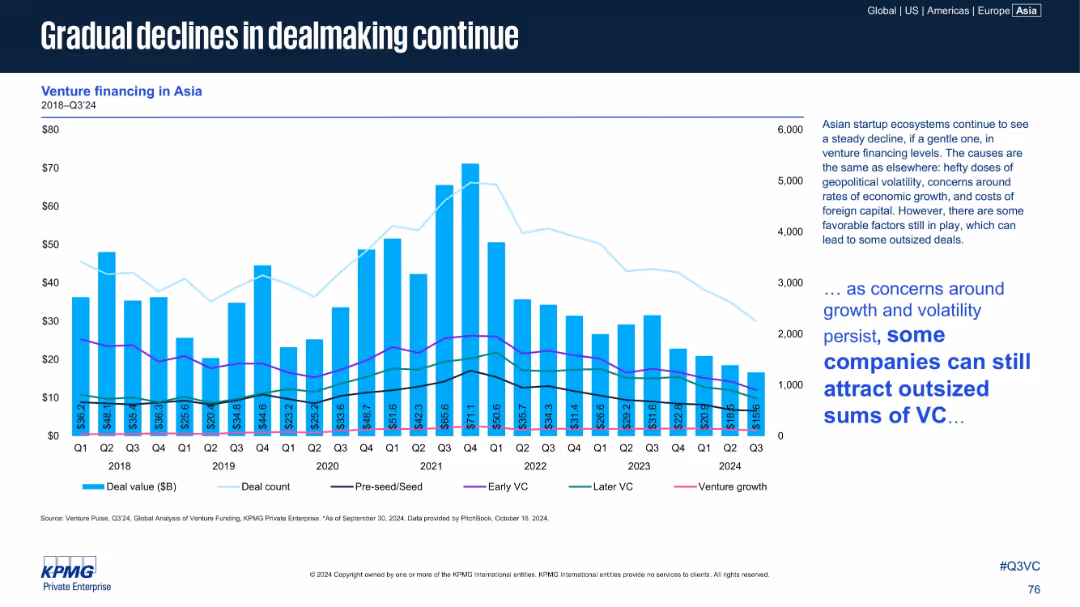
Bar chart (deal value) with multi-line overlays (deal count, pre-seed, early VC, later VC, venture growth). Text box at right provides analysis and contextual interpretation.
Market Analysis and Trends
Financial Services
Highlights sustained decline in venture dealmaking across Asia from 2018 to Q3 2024. Despite headwinds like geopolitical volatility and foreign capital costs, some companies still attract large investments.
Asia, VC Trends, Early Stage, Later VC, Venture Growth, Deal Count, 2024 Q3
false
Gradual declines in dealmaking continueVenture Pulse Q3 2024
Mixed Chart
KPMG
View slide
The slide showcases the digital transformation in the T&T sector with a diagram illustrating five pillars: Data Hub, Digital ID, Smart Destination, Smart Business, and Digital Skills. There are descriptions of each pillar and related initiatives.
Technology and Digital Transformation
Hospitality & Tourism
Highlights the acceleration of digital transformation in the Greek T&T sector, focusing on initiatives like Data Hub, Digital ID, and smart applications to improve profitability and reduce environmental impact. Details strategic goals and actions.
Digital transformation, Technology, T&T sector, Smart applications, Digital skills
false
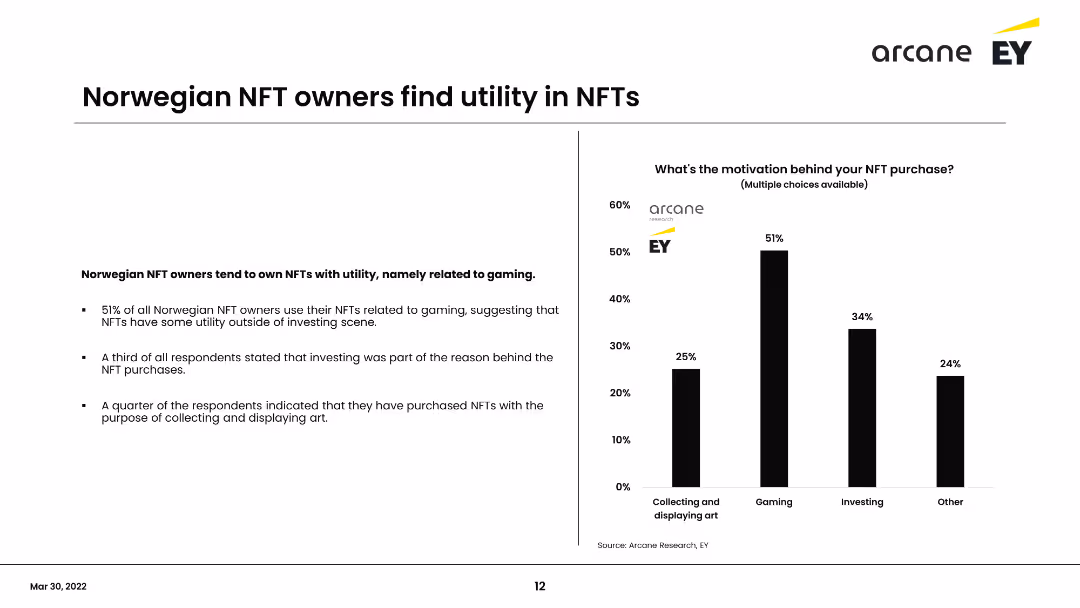
Norwegian NFT owners find utility in NFTsNorwegian Crypto Adoption Survey 2022
Mixed Chart
EY
View slide
Two bar charts comparing job vulnerability by income bands, with a side bar chart showing the percentage of vulnerable jobs in each income bracket.
Risk Assessment and Management
Financial Services
Presents the proportion of vulnerable jobs within various income bands during the COVID-19 crisis.
income, job vulnerability, COVID-19, financial analysis, risk management
false
Seventy-four percent of vulnerable jobs pay less than $40,000 a yearResponding to COVID-19: Addressing the economic impact of the crisis
Multiple Chart
McKinsey
1
...
Next
Load More
Hold On!
We are searching in our database
If nothing, comes up, please try different filters!
Create a FREE account to continue browsing
Receive Instant Access to 1,000+ slides from companies like McKinsey, Google, and Goldman Sachs
First Name
Last Name
Email
Password
I agree to all
Terms & Privacy Policy
Thank you! Your submission has been received!
Oops! Something went wrong while submitting the form.
Have an account?
Sign in
Column Chart
Heatmap
Chevron
Org Chart
Infographic
Callouts
Timeline
List
Graphic
Picture
Process Flow
Diagram
Paragraph
Map
Table
Framework
Subtitle
Takeaway Box
Icon
Other Chart
Radar Chart
Waterfall Chart
Mekko Chart
Pie Chart
Scatter Plot
Line Chart
Bar chart
Bullet points