SELECT YOUR MODE
Charts, diagrams, frameworks, and more. Download individual slides in PowerPoint or Google Slides format. Mix and match to build your perfect deck.


PRO
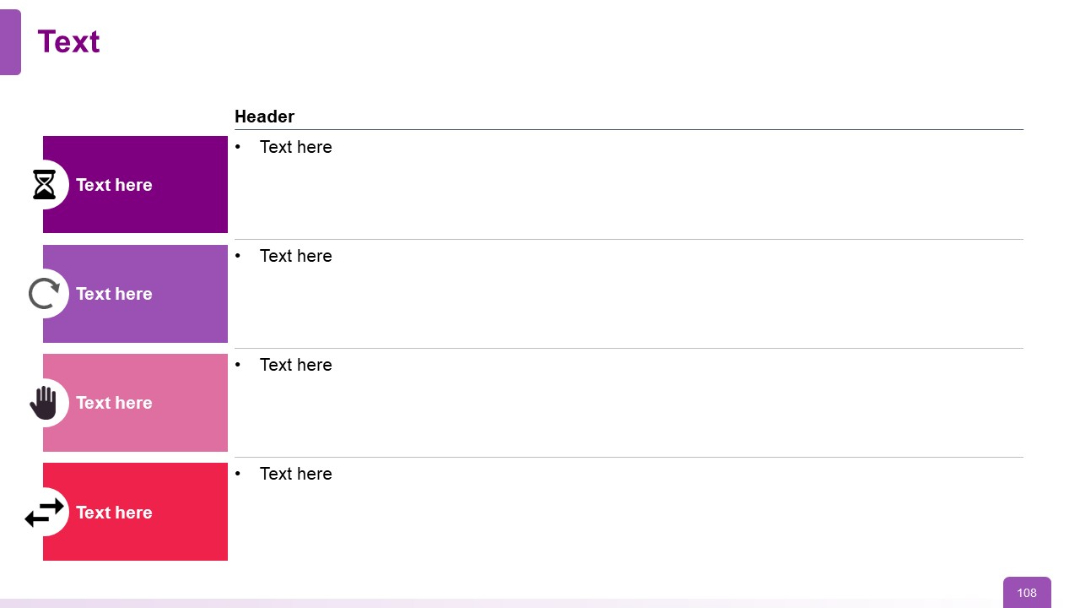
Vertical list with left-colored blocks (each with icons) and right-side bullets under a "Header" label. Flat two-column layout.
PRO
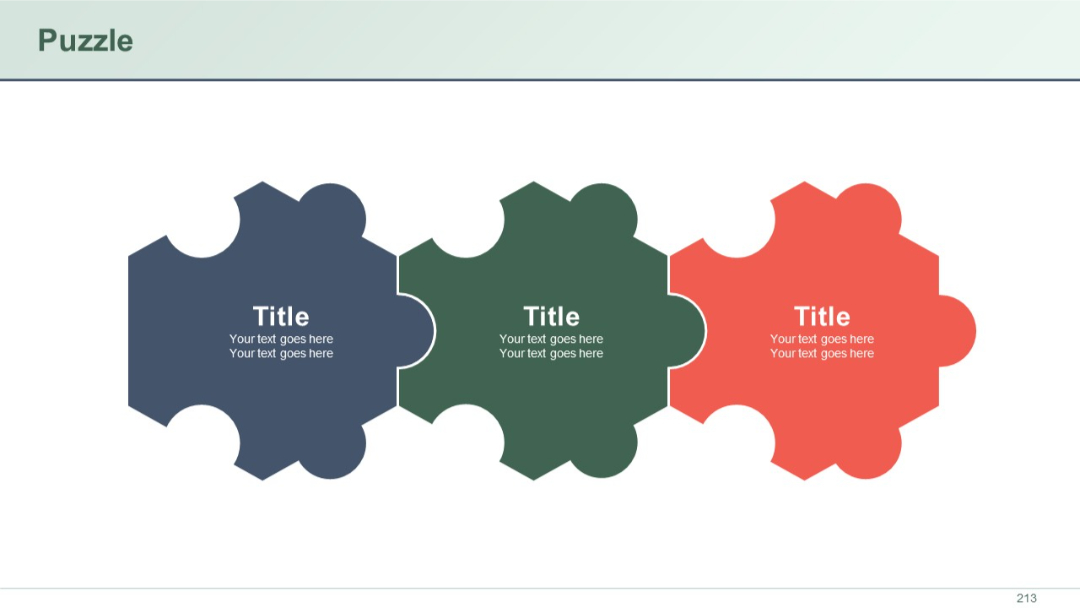
Three interlocked horizontal puzzle pieces in navy, green, and red, each with a central text box labeled "Title" and placeholder text beneath.
PRO
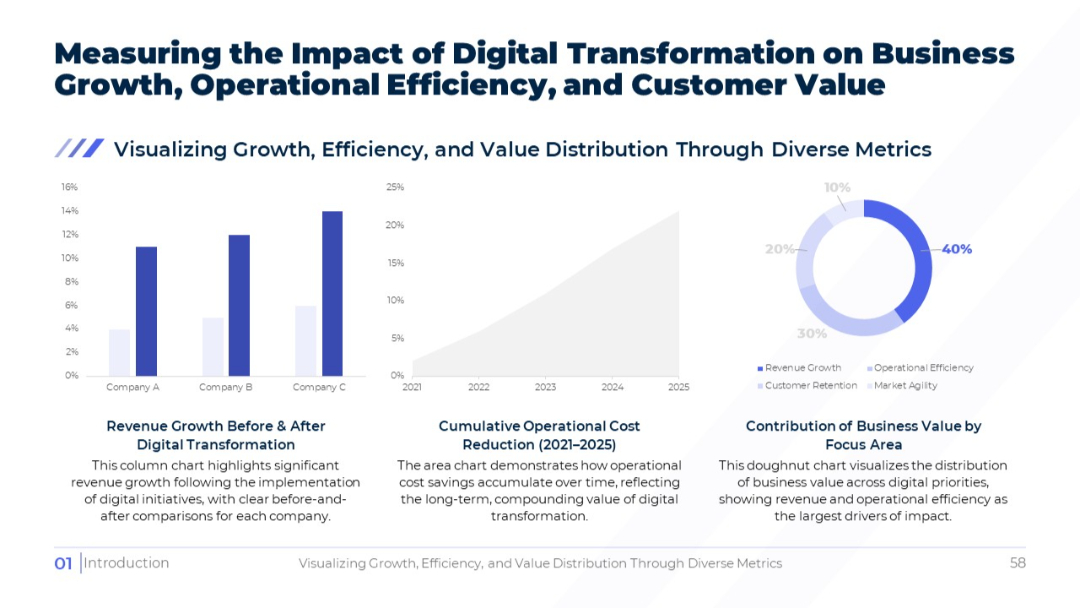
Three-chart layout: bar, area, and doughnut; focuses on revenue, cost savings, and business value distribution respectively.
PRO
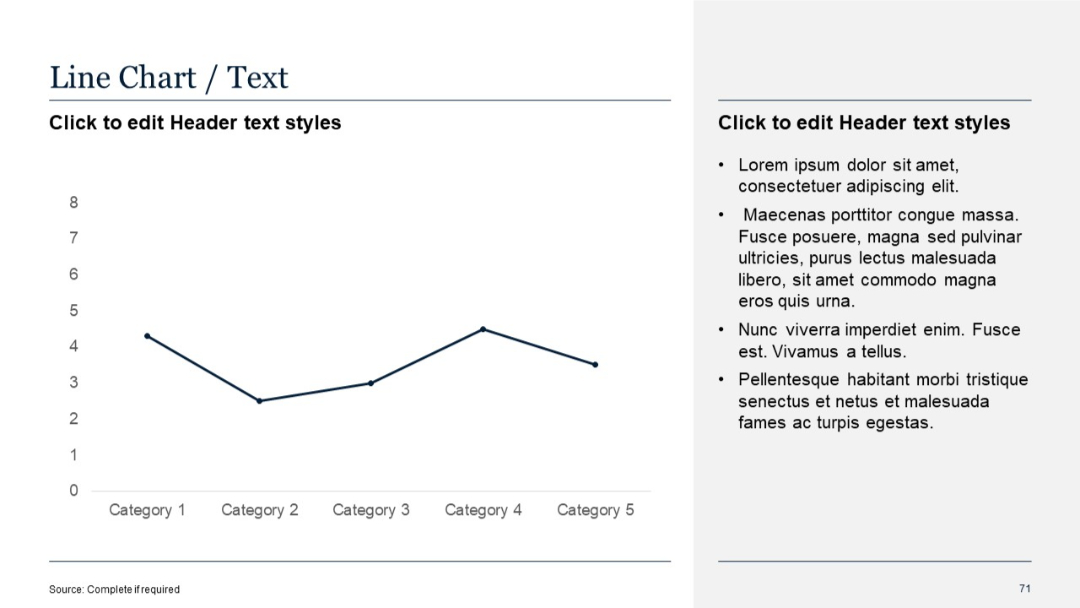
Split layout with a simple single-line chart on the left and bullet text section on the right. Minimalist design with a light background.
PRO
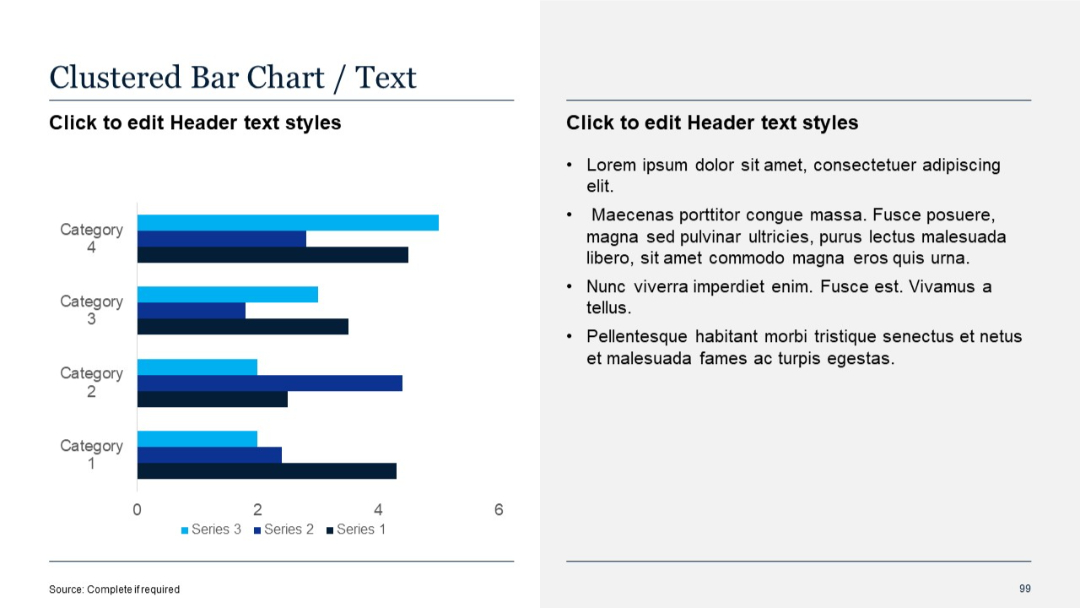
Clustered bar chart with three series per category; sidebar with bullet text.
PRO
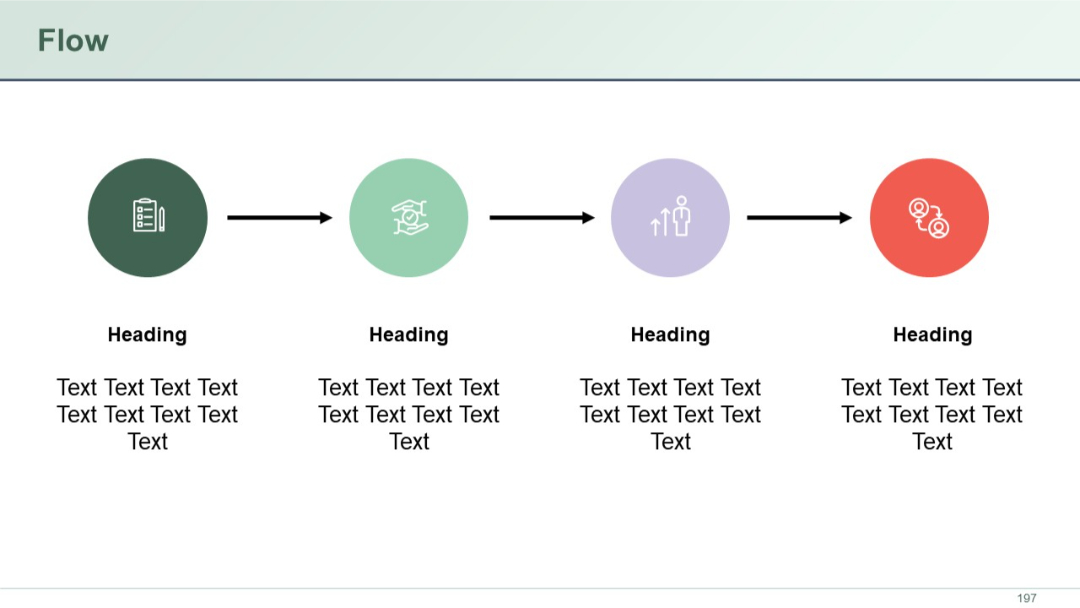
Four icons connected by right-facing arrows indicating flow or progression. Headings and descriptive text below each icon.
PRO
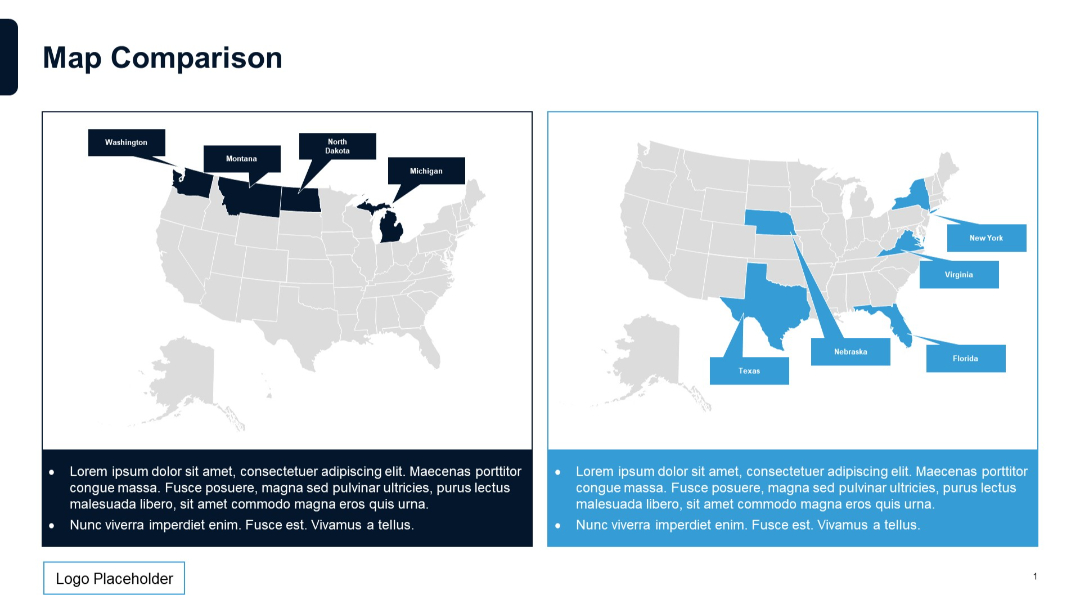
Side-by-side U.S. maps highlighting different states in blue and dark blue, with bullet text below each map.
PRO
Same structure as Template 11 but with avatar icons in the photo placeholders, enhancing visual representation of team members.
PRO
Dark blue background, bold gradient text, minimal elements with a date in the top-right corner.

PRO
Horizontal funnel graphic with two input sections (left) and one output section (right), connected via curved lines and icons. Clean, minimal layout.

PRO
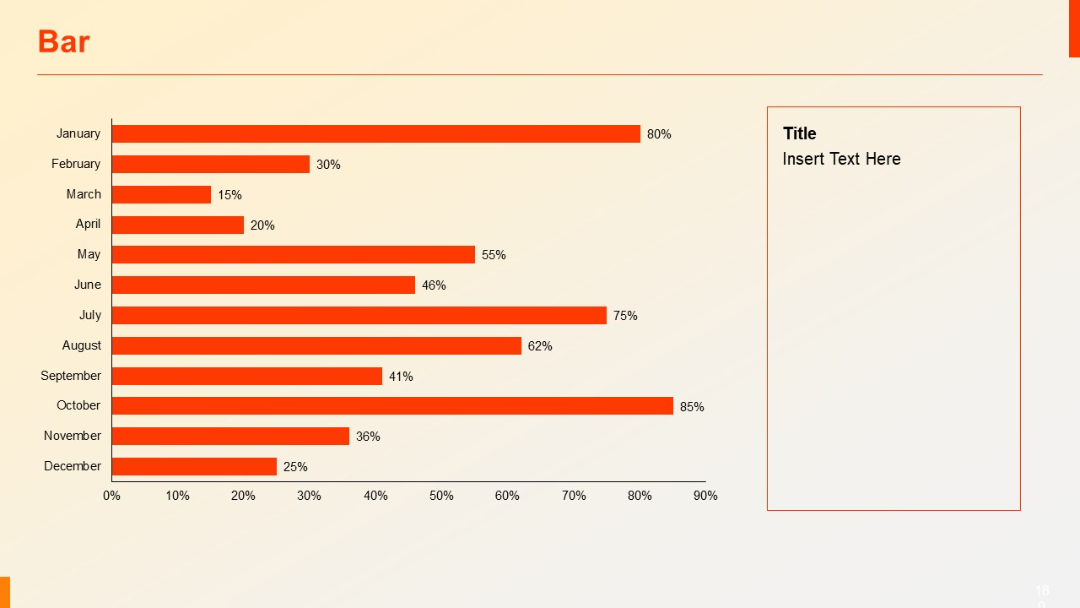
Horizontal bar chart showing months (January to December) on Y-axis, with orange bars and percentages. Text placeholder box on the right.
PRO
Section title slide with large "02" and the label "Quantitative Slides"; minimal design with angled lines on the right.

PRO
Single large quote section with a headline block in red. Quotation area framed with icons and large text field.

PRO
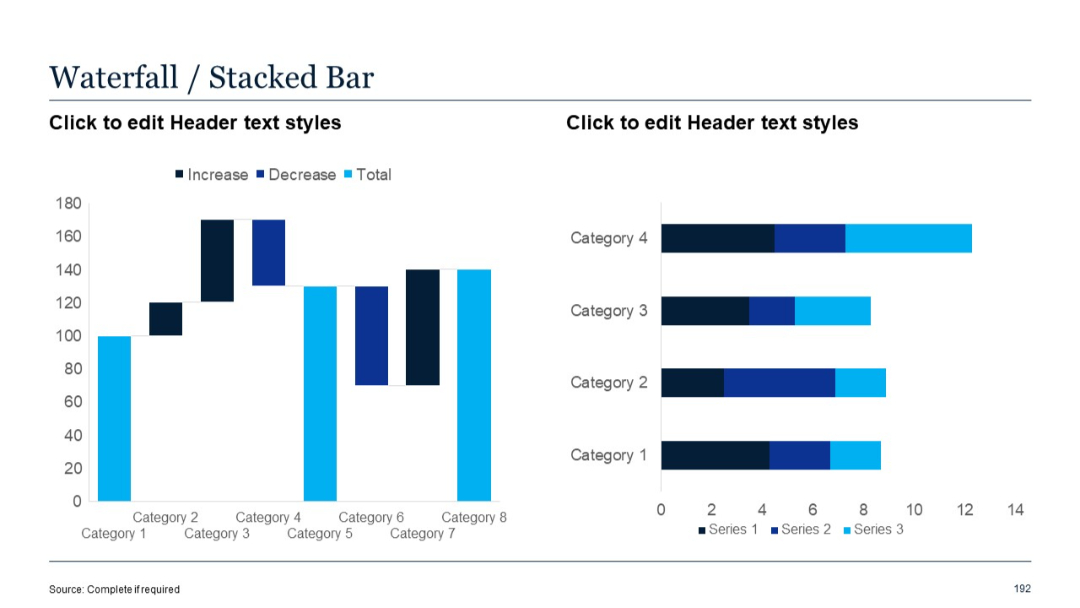
Similar layout to slide 191 but replaces the standard bar chart with a stacked bar chart on the right.
PRO
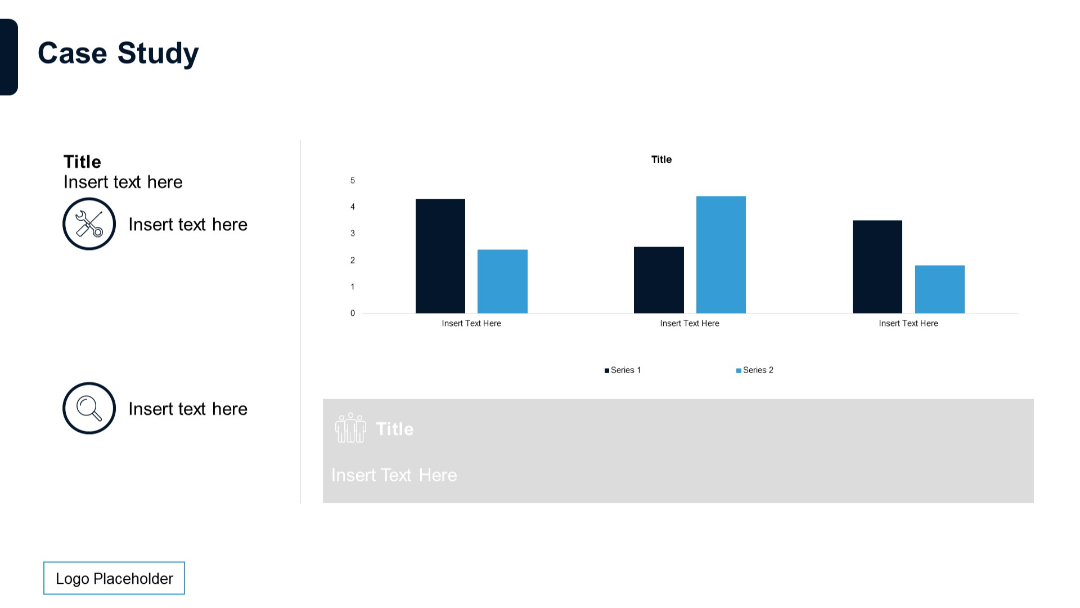
Bar chart with two data series and text blocks with icons on the left. Layout includes placeholders for titles and explanations.
PRO
Uniform grid of icons focused on communication, data, analytics, and digital tools, drawn in thin purple outlines.
PRO
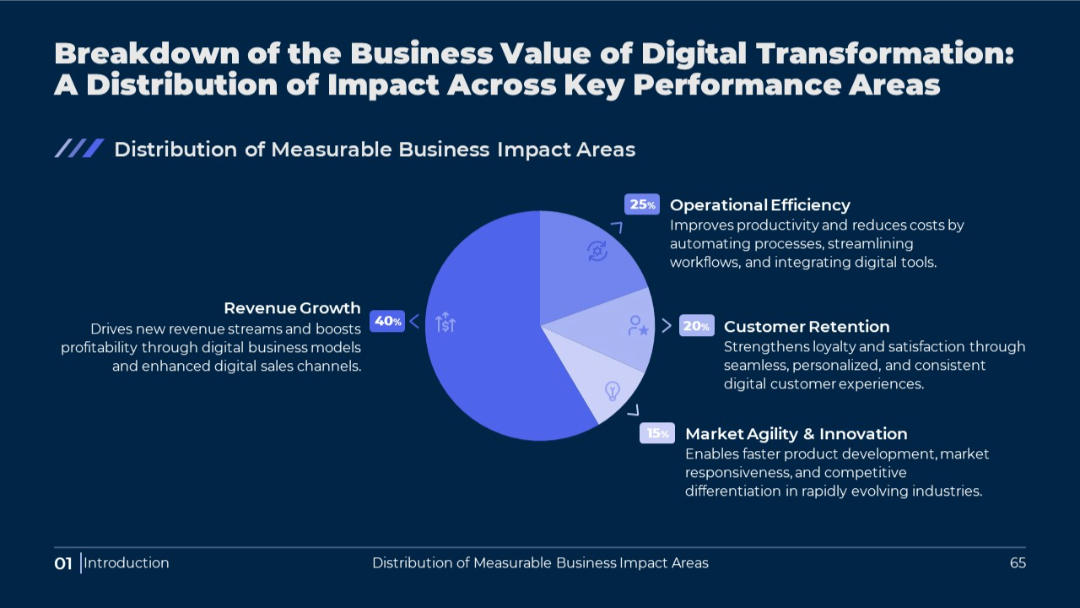
Circular pie chart in the center, surrounded by value descriptions. Dark background with light blue accents. Percentages highlighted for each segment.
PRO
Grid layout with rectangular orange vertical bars inside cells, arranged in three rows and eight columns, each column with a header title.

PRO
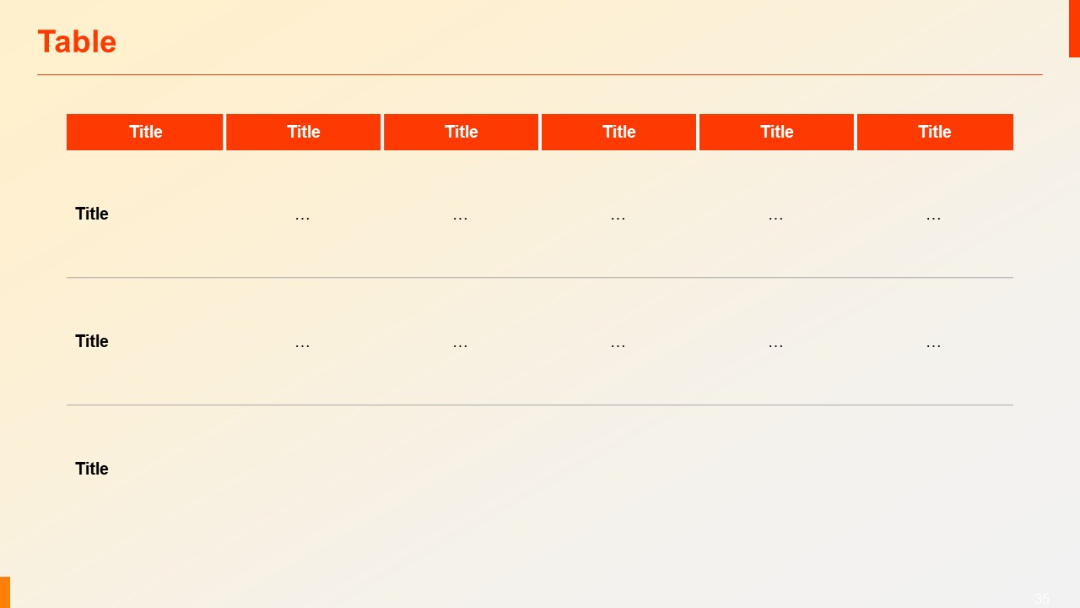
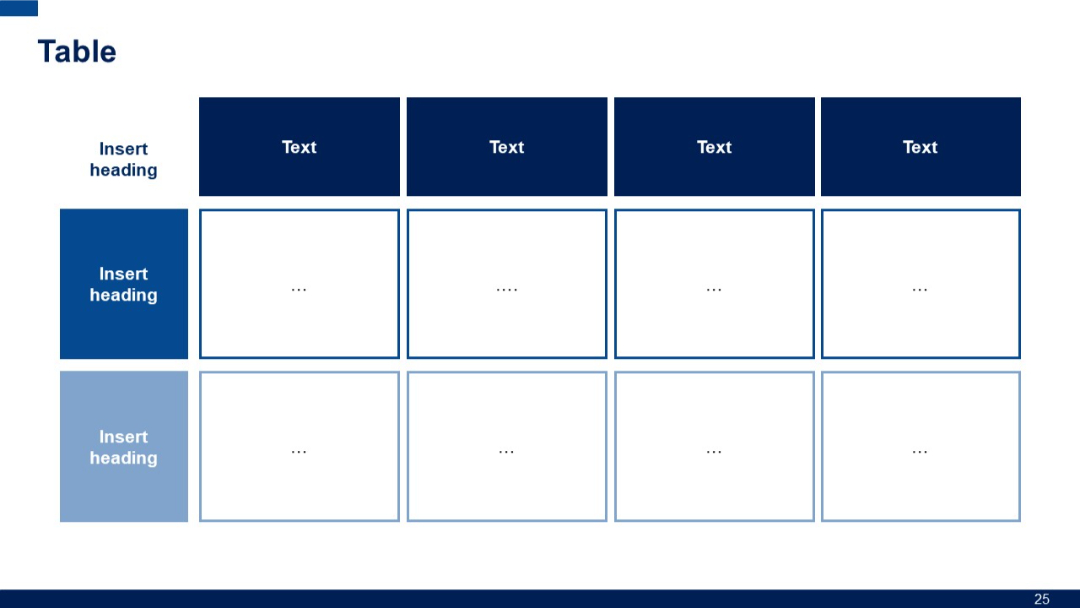
Similar layout to previous, but includes three rows. Top headers in red, lower rows with dotted placeholder content (“...”).
PRO
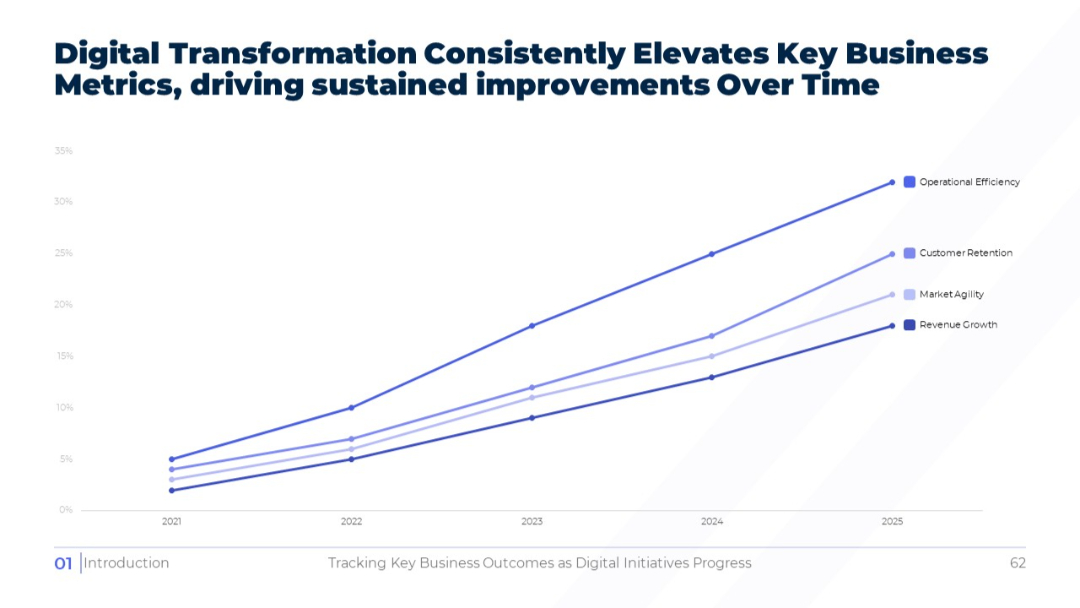
Full-width line graph on white background showing upward trends for key metrics from 2021 to 2025. Legend to the right identifies lines by color and label.
PRO
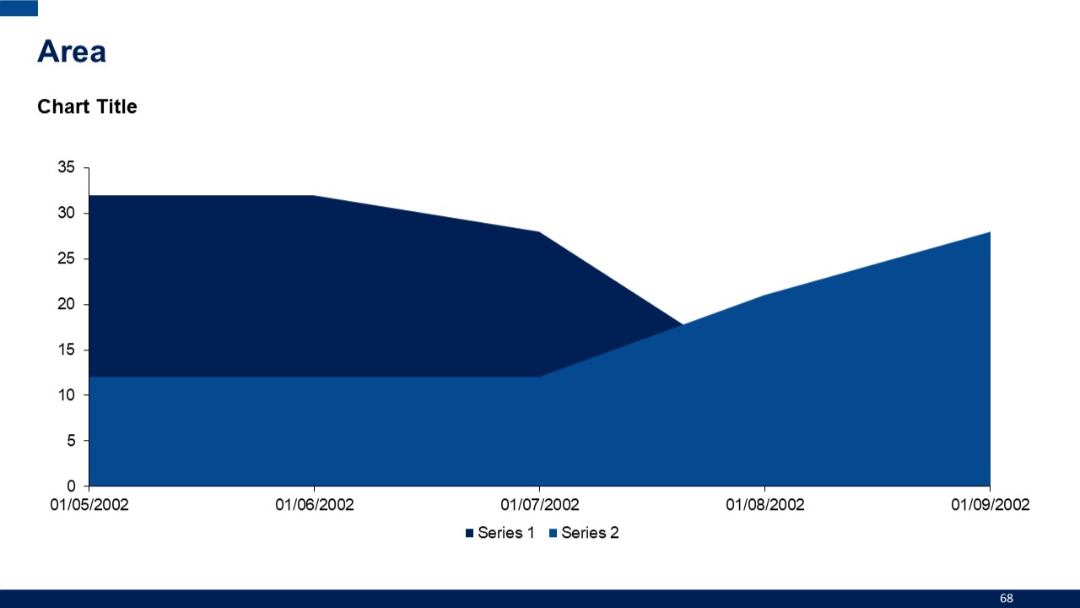
Area chart with two stacked segments (Series 1 and Series 2). Blue tones with a date-based x-axis and values on the y-axis.
PRO
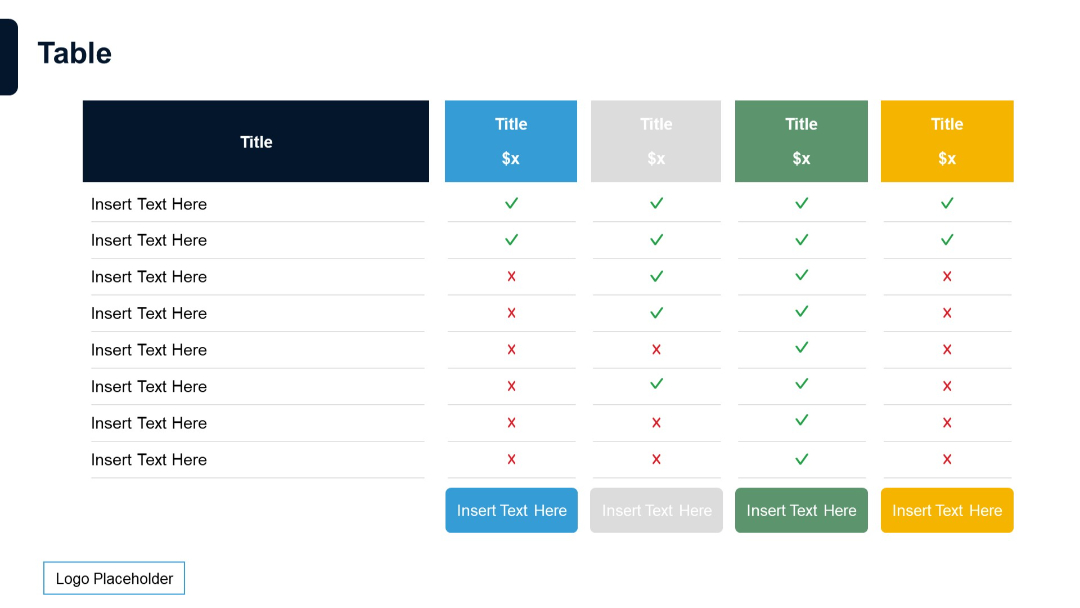
Extended feature comparison table with five pricing tiers, each in distinct color, with status icons and insert text prompts.
PRO
Four-column SWOT-style layout with circular progress bars and bullets

PRO
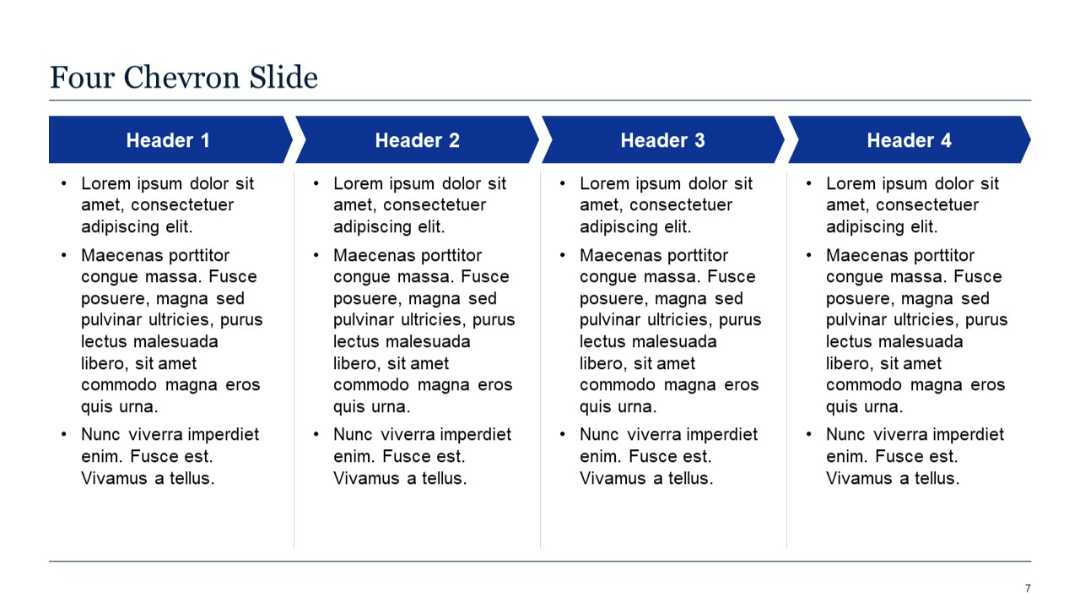
Four horizontal chevrons with associated text sections underneath.
PRO
A 6-column by 6-row table with blue headers and editable placeholder text in each cell. White background with simple, clean layout and gridlines.
PRO
3x4 grid with left and top headers in blue, alternating row colors, and dots in each cell. A basic matrix for attribute presence or evaluation.
PRO
A 2x2 grid of interlocking puzzle pieces in bold colors (red, orange, yellow, blue) representing SWOT components with sample text placeholders.

PRO
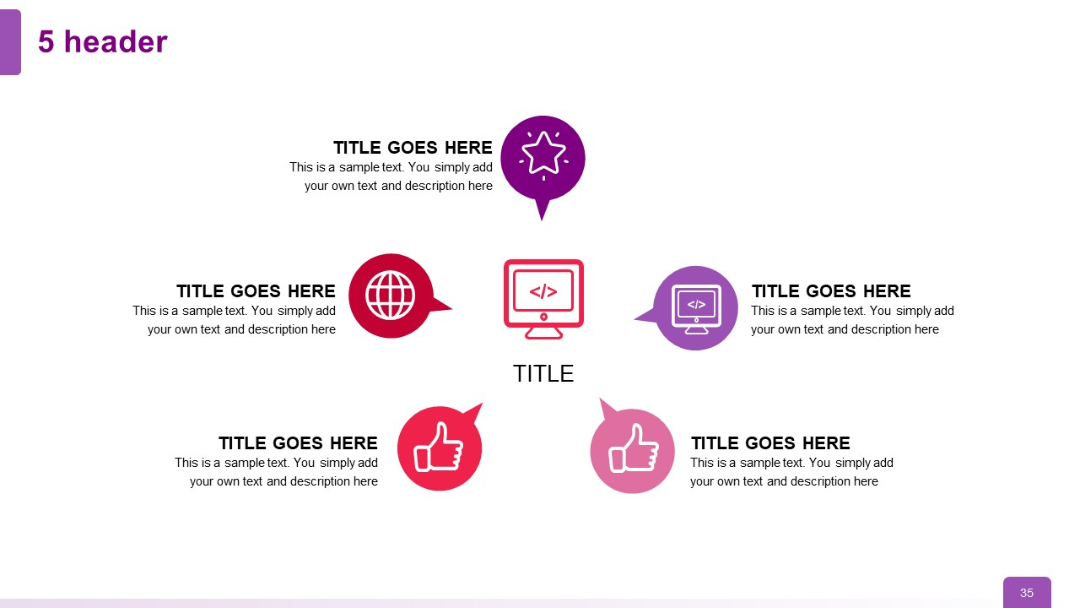
Pentagonal layout around a central icon, with five surrounding icons and corresponding text blocks, maintaining circular balance.
PRO
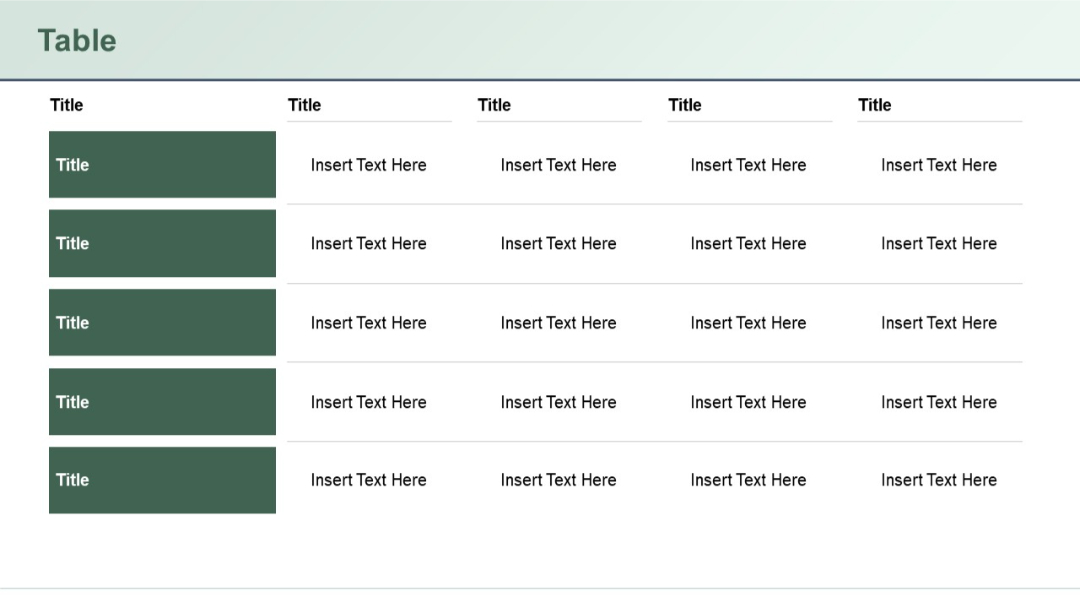
Five-row vertical layout with shaded title blocks on the left, paired with corresponding horizontal rows of four text-entry cells each.
PRO
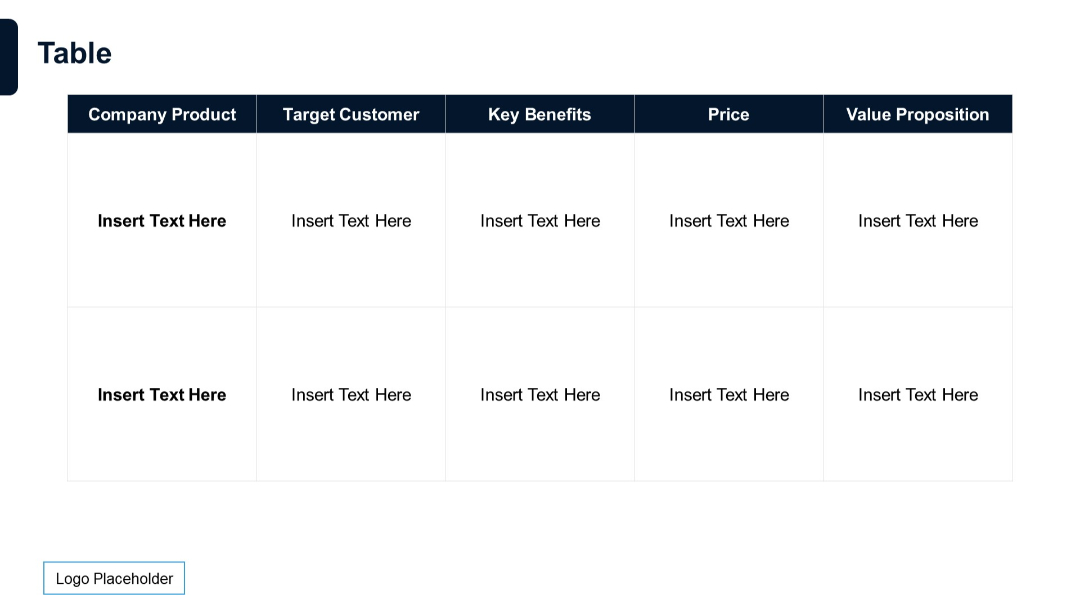
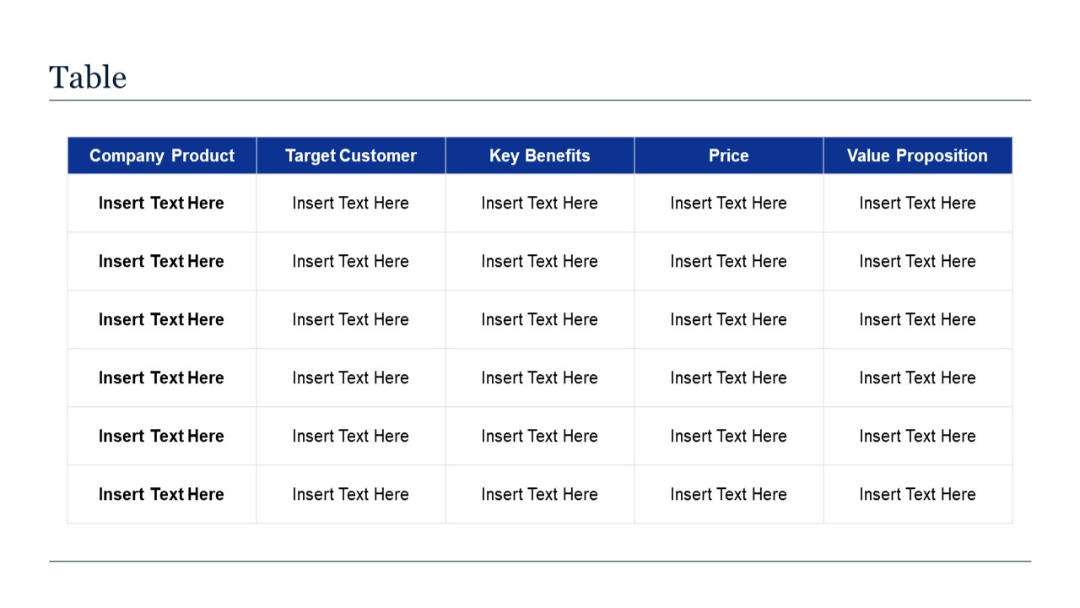
Two-row, five-column grid with bolded column headers: Company Product, Target Customer, Key Benefits, Price, and Value Proposition.