SELECT YOUR MODE
Charts, diagrams, frameworks, and more. Download individual slides in PowerPoint or Google Slides format. Mix and match to build your perfect deck.


PRO
Four text boxes arranged around a central puzzle-piece graphic in a circular format, each piece in a different pastel shade with quote icons.

PRO
Seven icons in a circular, fully interconnected network with central icon; all connected via dotted lines; bullet list included.
PRO
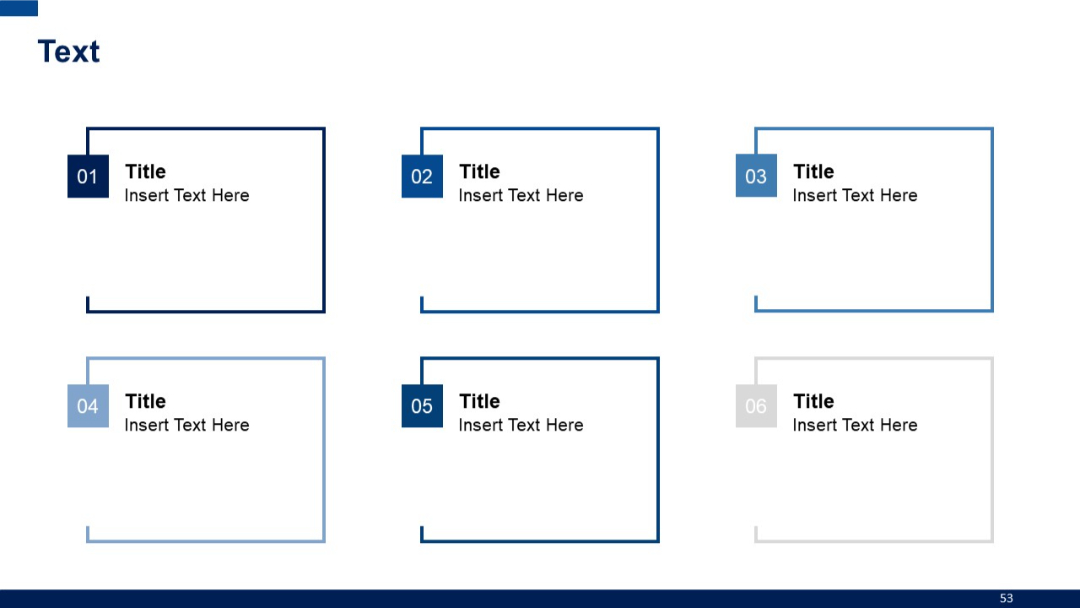
Grid layout with six outlined square boxes, each with a number tab and text inside.
PRO
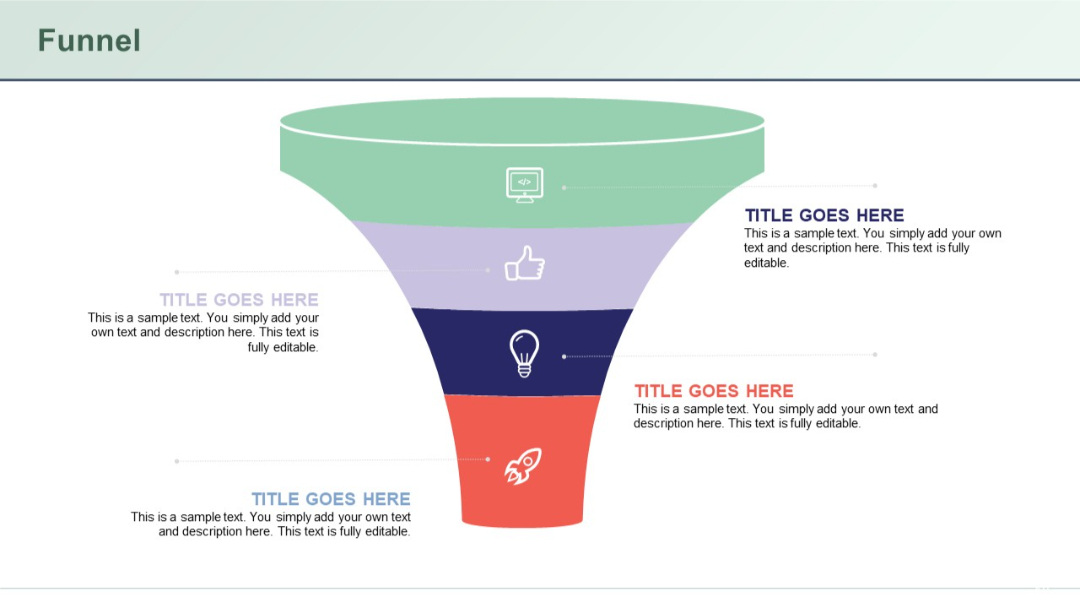
Inverted vertical funnel diagram with 4 color-coded segments, each with an icon and text box aligned to left or right.
PRO
Top row of icons linked by a line, with matching arrow-tipped horizontal text blocks below. Four-stage process visualization.

PRO
Same structure as previous, extended to six rows; enables broader product comparisons.
PRO
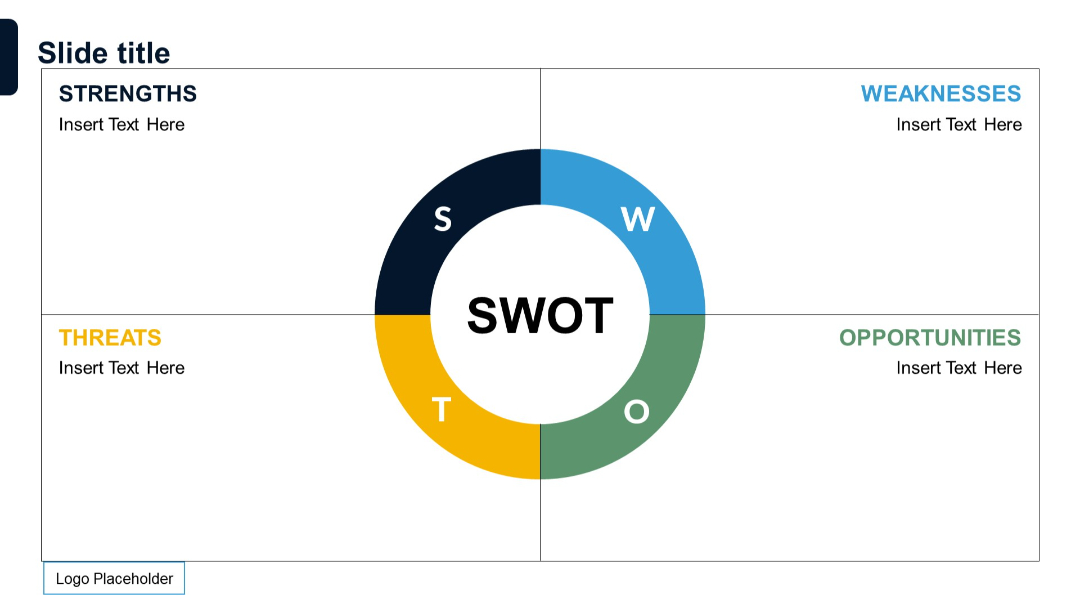
Circular quadrant with SWOT sections around a donut chart in center; each quadrant labeled and color-coded.
PRO
Clustered horizontal bar chart with three series compared across four categories. On the right, four icon-labeled colored boxes serve as space for commentary.

PRO
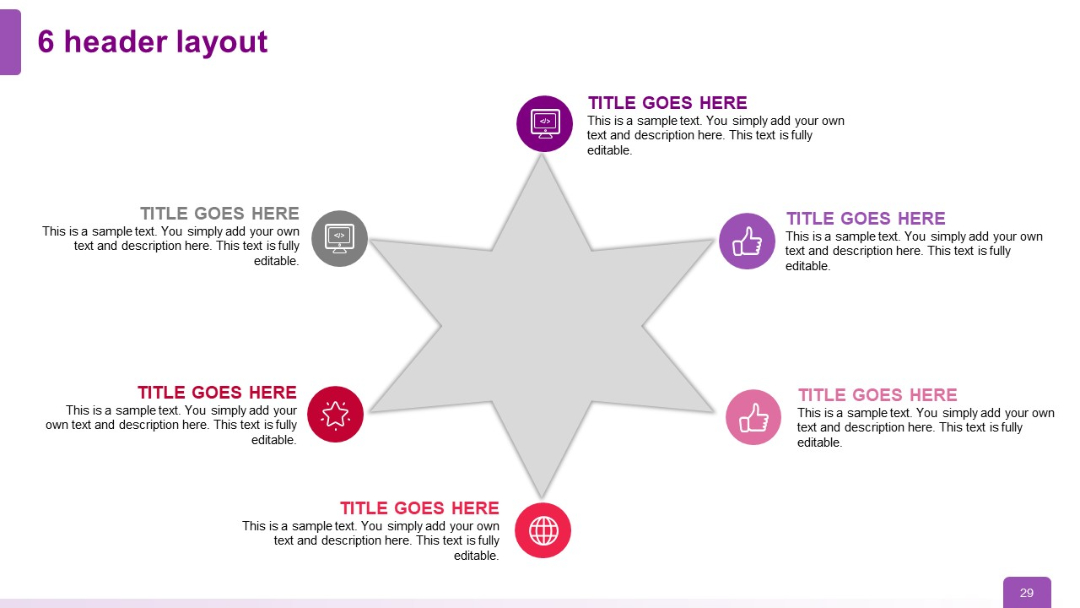
Six-pointed star layout with matching headers and icons surrounding a central shape. Text sections aligned with each icon.
PRO
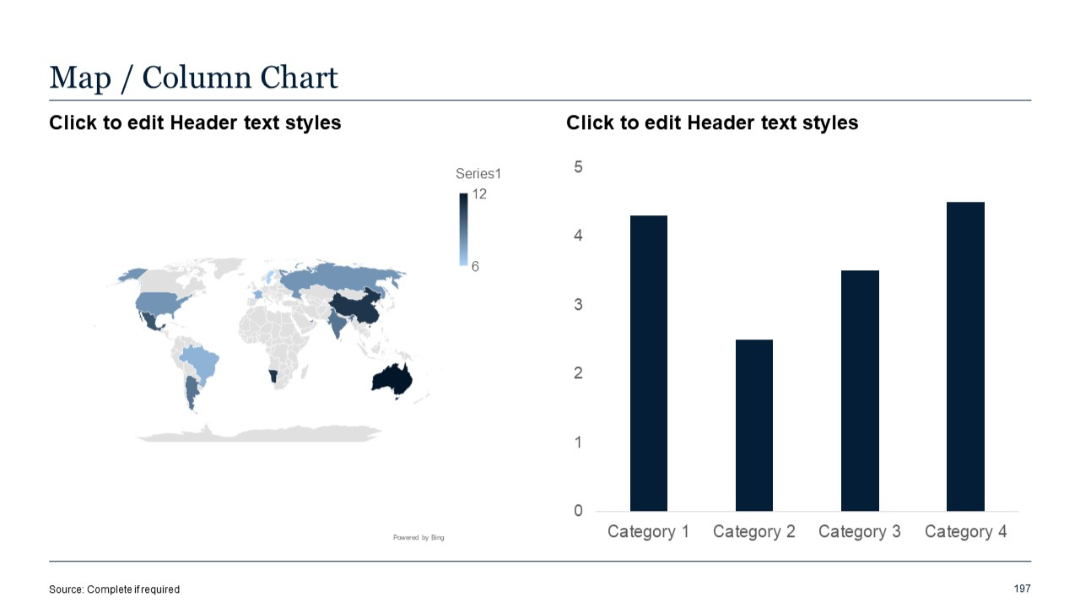
Left: world heat map; Right: vertical column chart comparing four categories.
PRO
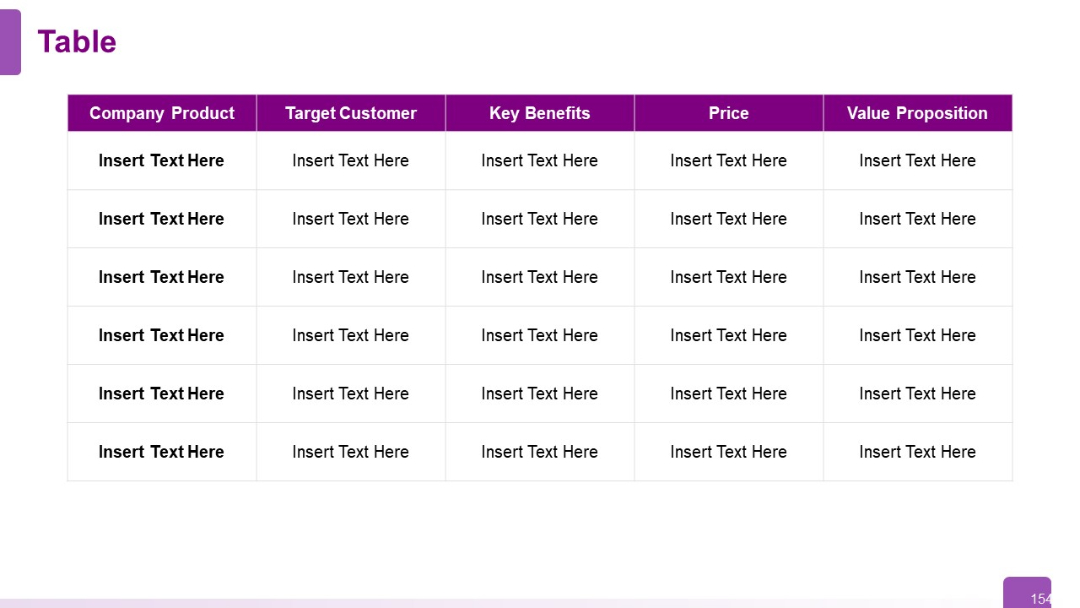
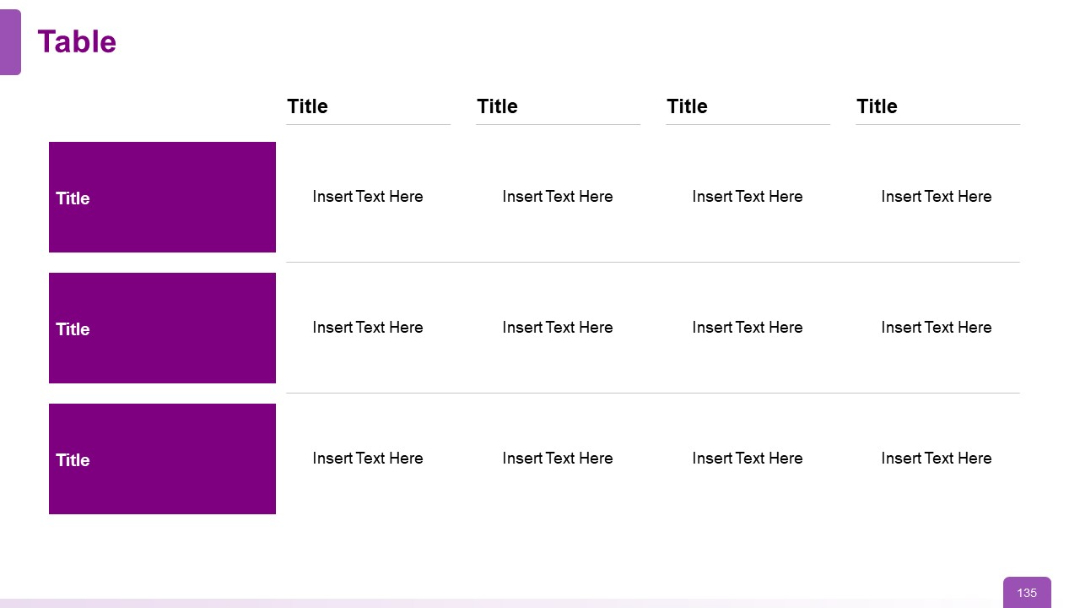
Horizontal table with left column in solid purple and rows labeled “Title.” Right columns include placeholder text under each heading. Clean grid structure.
PRO
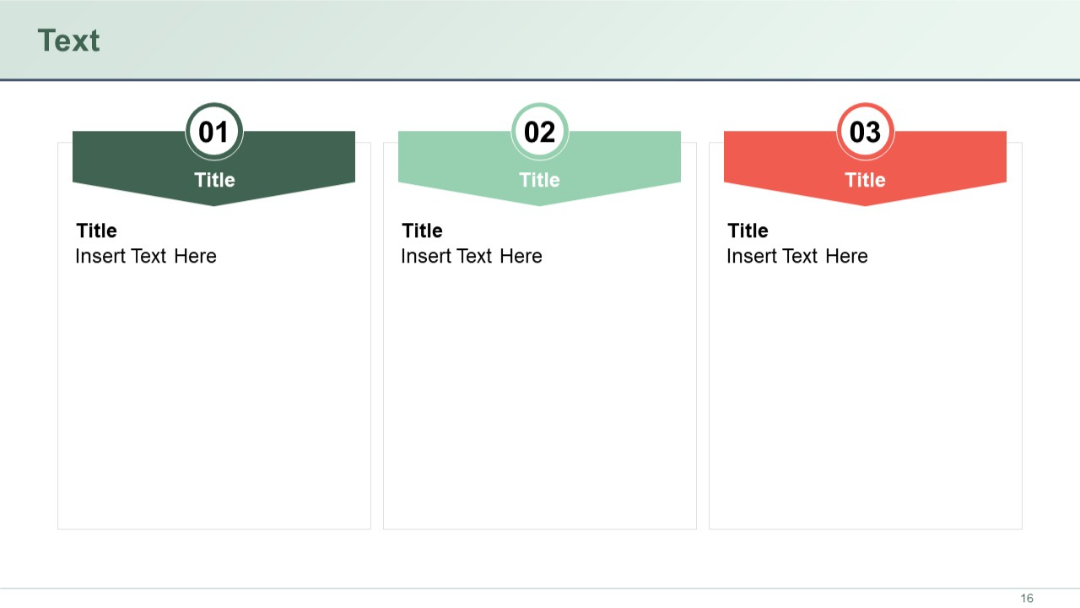
Three-column layout with top-centered numbered tags (01–03) above arrow-tab headers; content boxes beneath each for title and text.
PRO
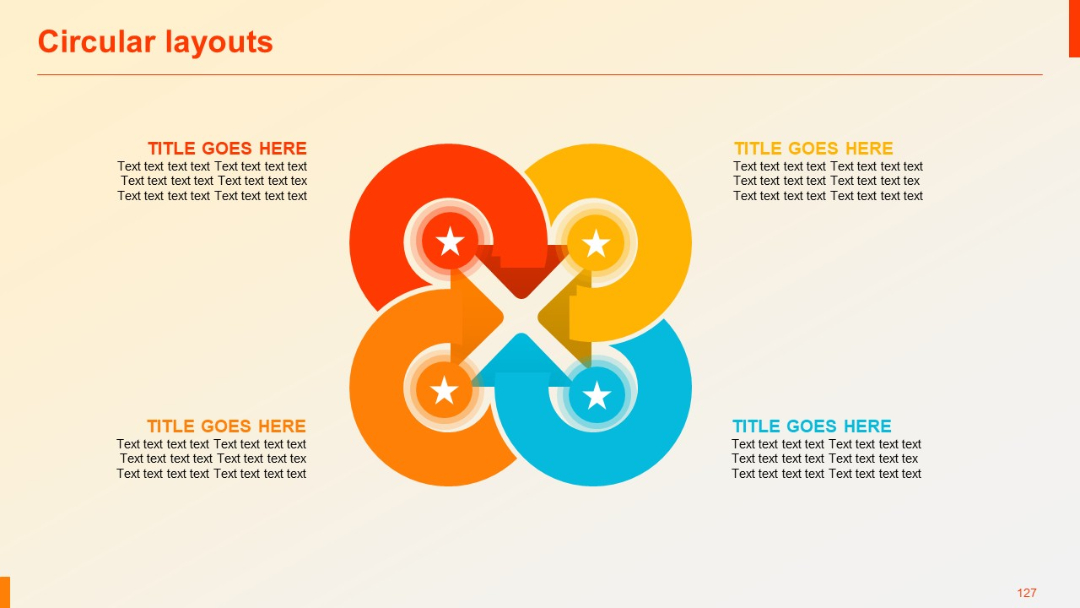
Four circular segments with stars at each point forming an X-shape; each quadrant paired with a header and text.
PRO
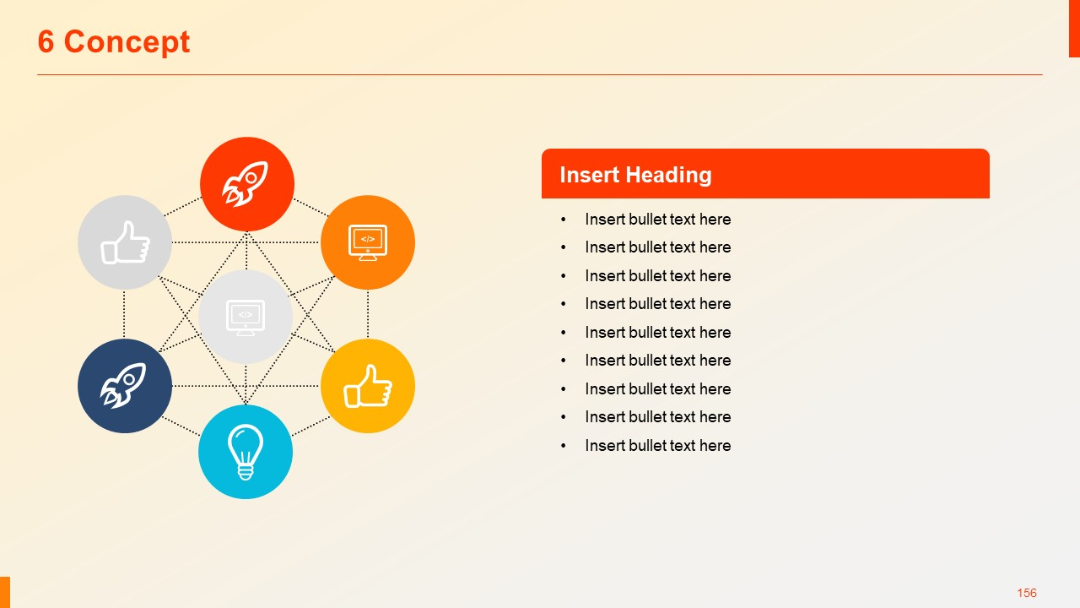
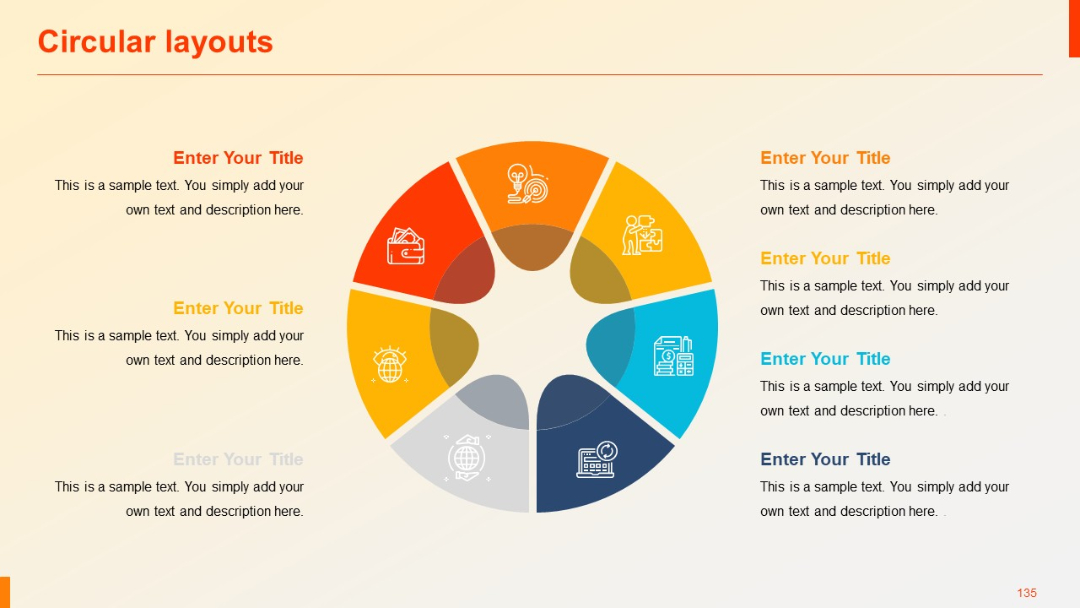
Circular layout with seven icons surrounding a central icon; variation in icon shapes (star, thumbs-up, globe) enhances visual interest.

PRO
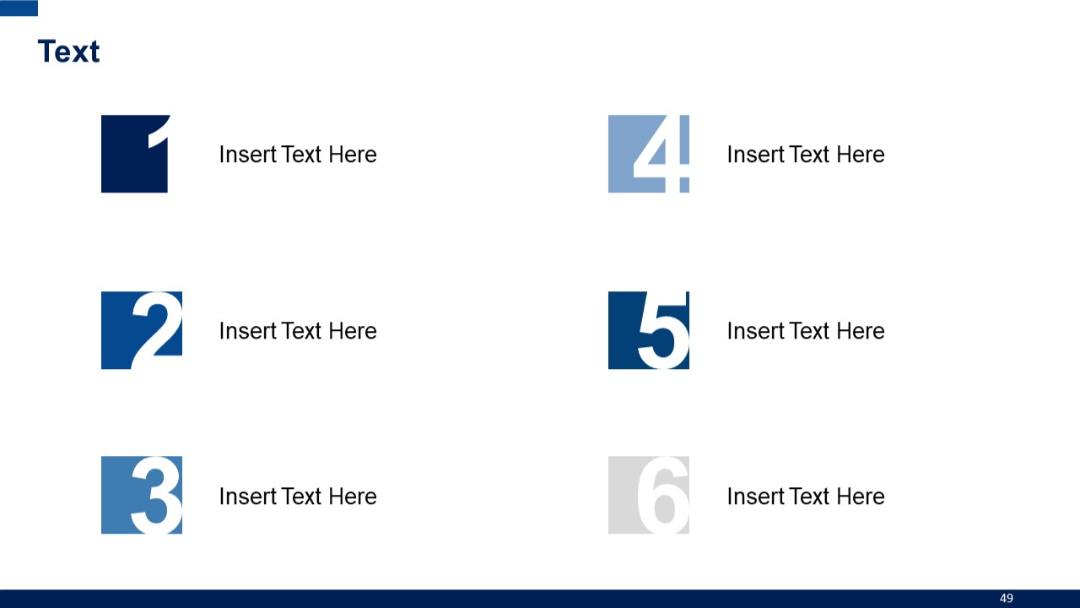
Grid layout with large numbers in boxes on alternating sides and placeholder text next to each.
PRO
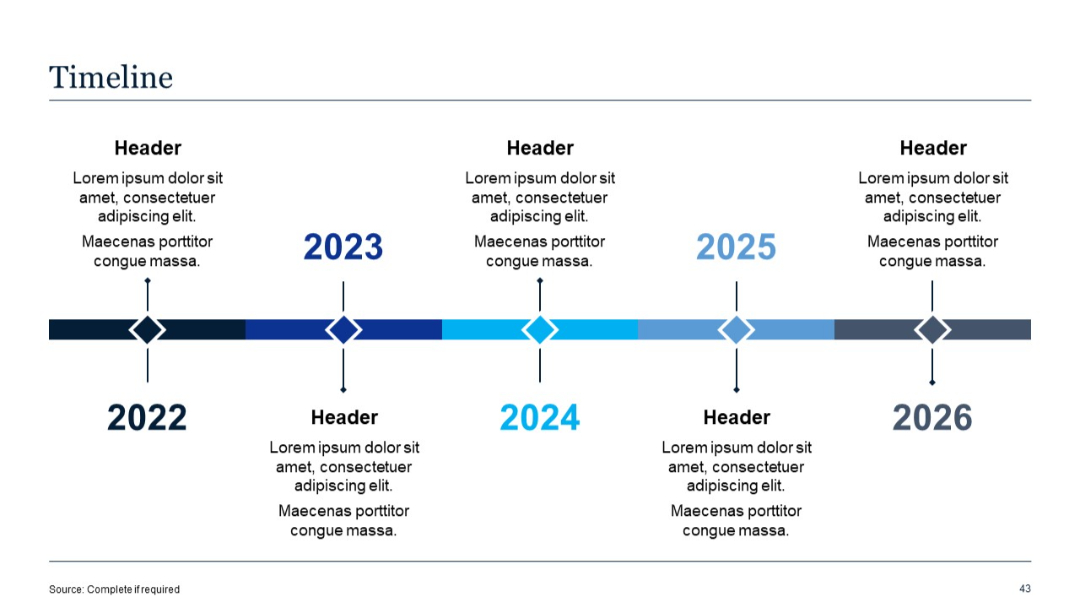
Horizontal timeline spanning 2022–2026, with alternating text boxes above and below a segmented line. Each year marked by a diamond shape.
PRO
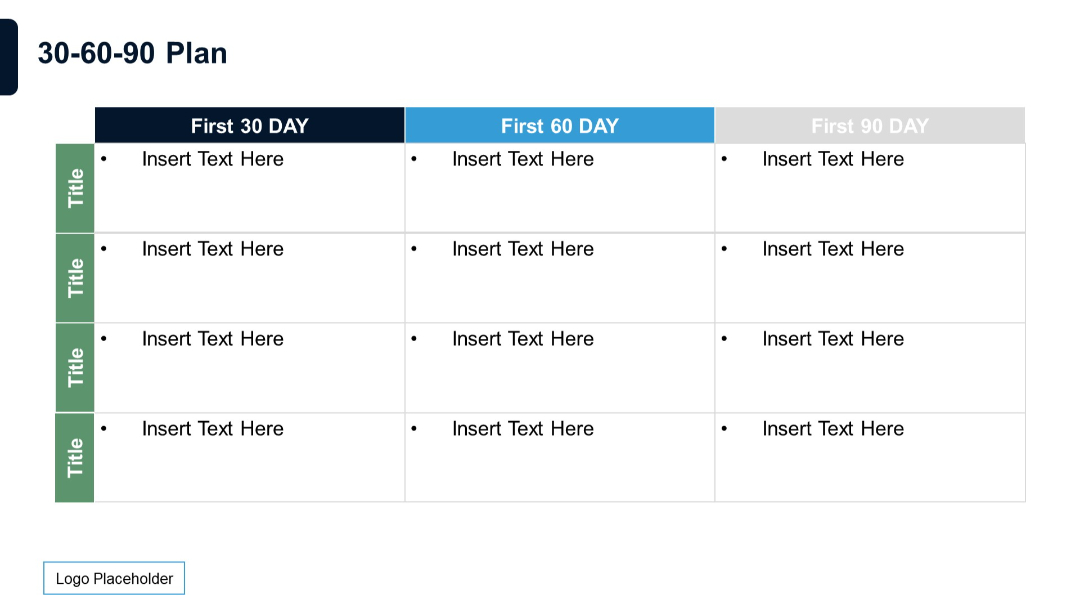
Table format with row titles and column headers labeled for each 30-60-90 day phase, featuring bullet points.
PRO
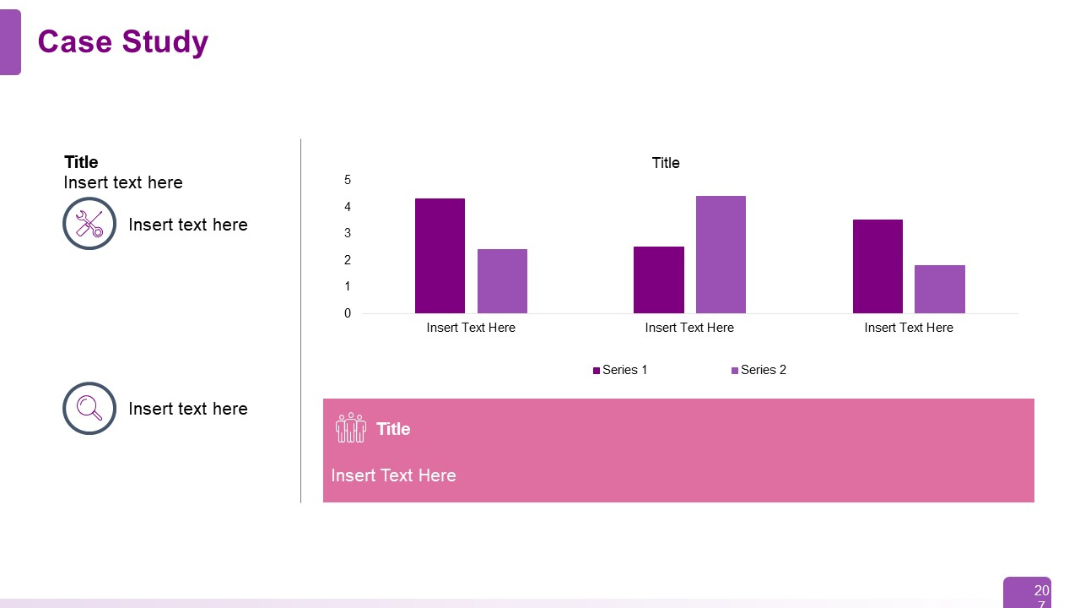
Split layout with left-side icons and titles, central bar chart (two series), and a lower pink block with an icon and additional content title.
PRO
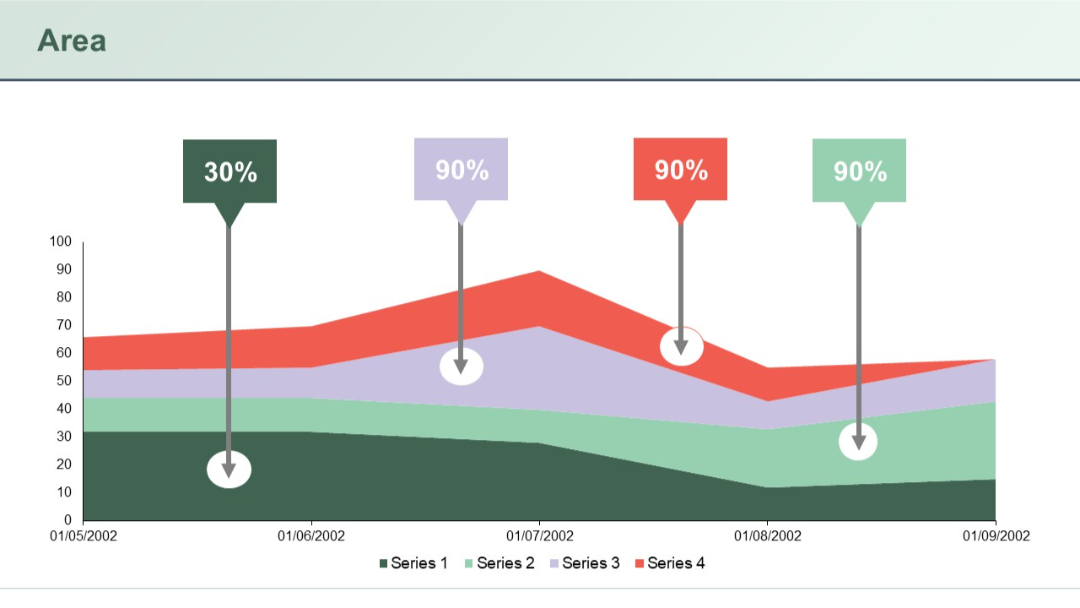
A colorful, multi-series stacked area chart with four data series, each highlighted with prominent percentage labels above.
PRO
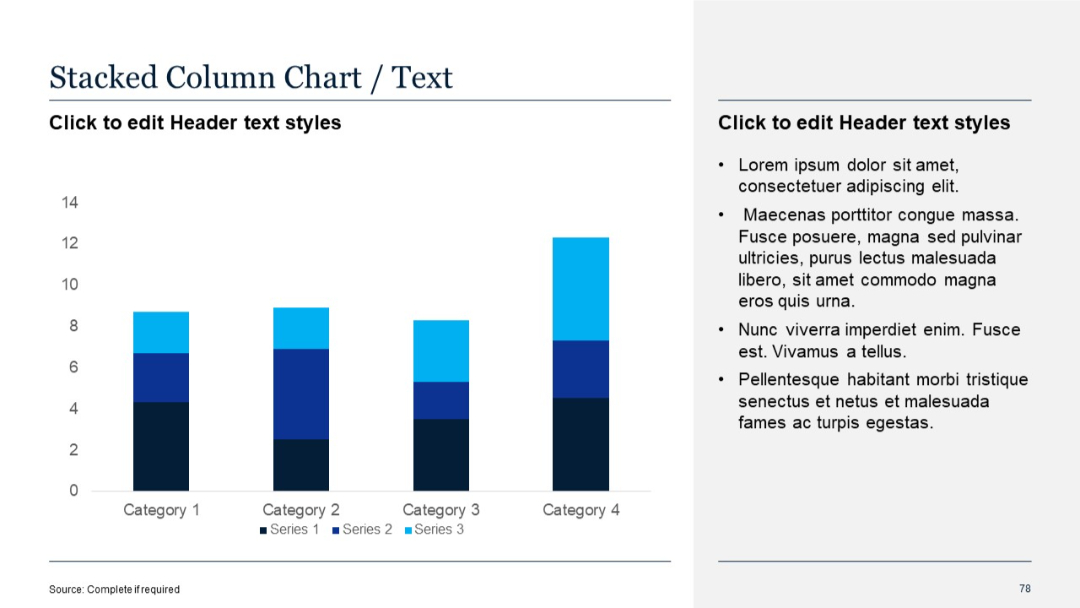
Vertical stacked column chart showing cumulative values for three series across four categories. Distinct color coding for each series.
PRO
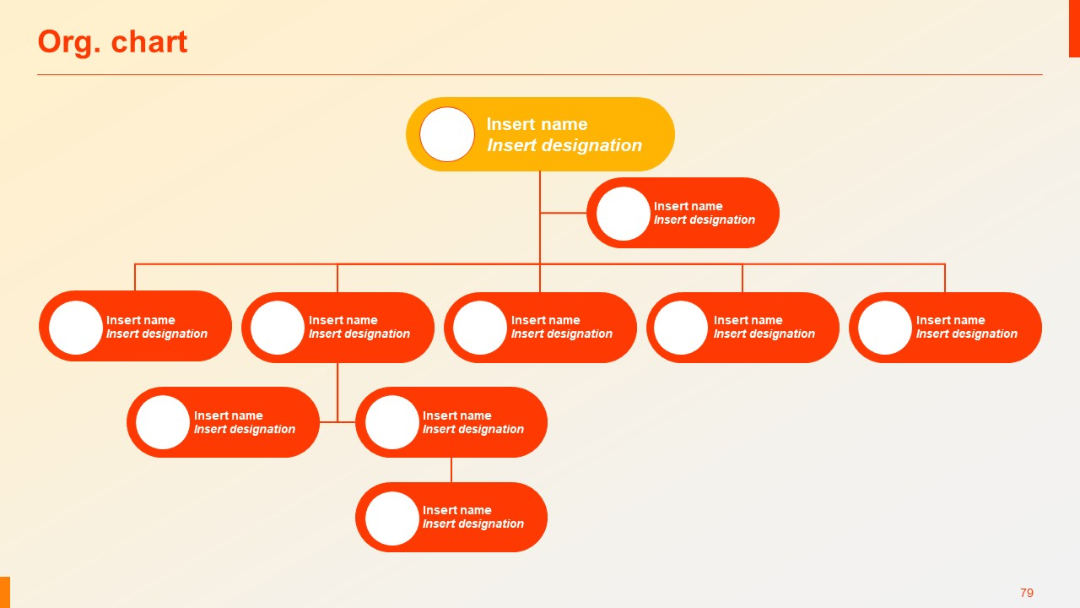
Modern horizontal org chart using rounded rectangles and photos/icons for each position.
PRO
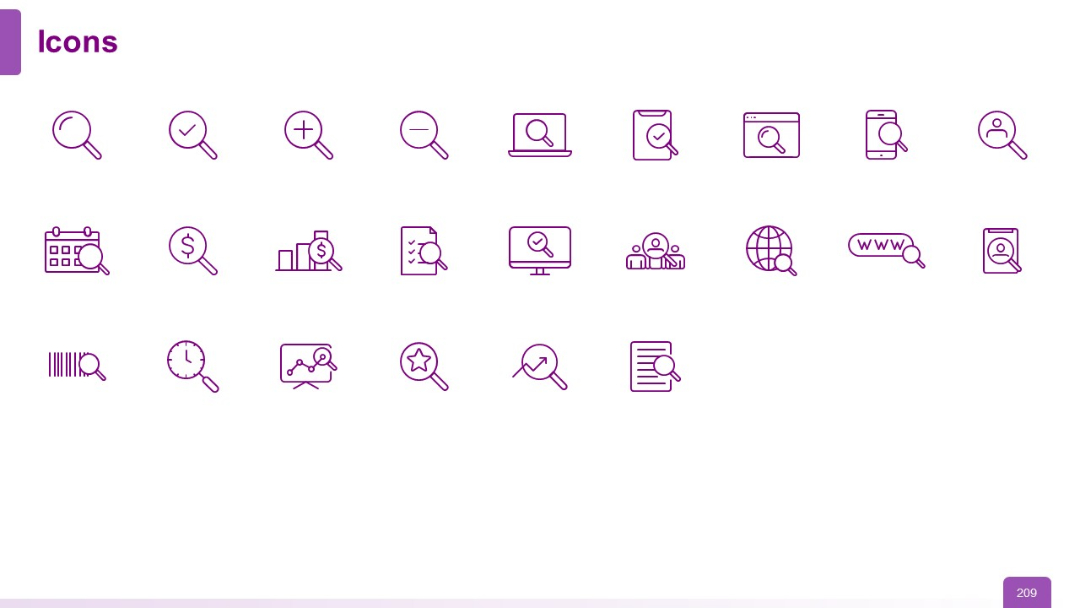
White background with evenly spaced purple outline icons, all magnifying glass or research-related graphics arranged in a clean 4x6 grid.
PRO
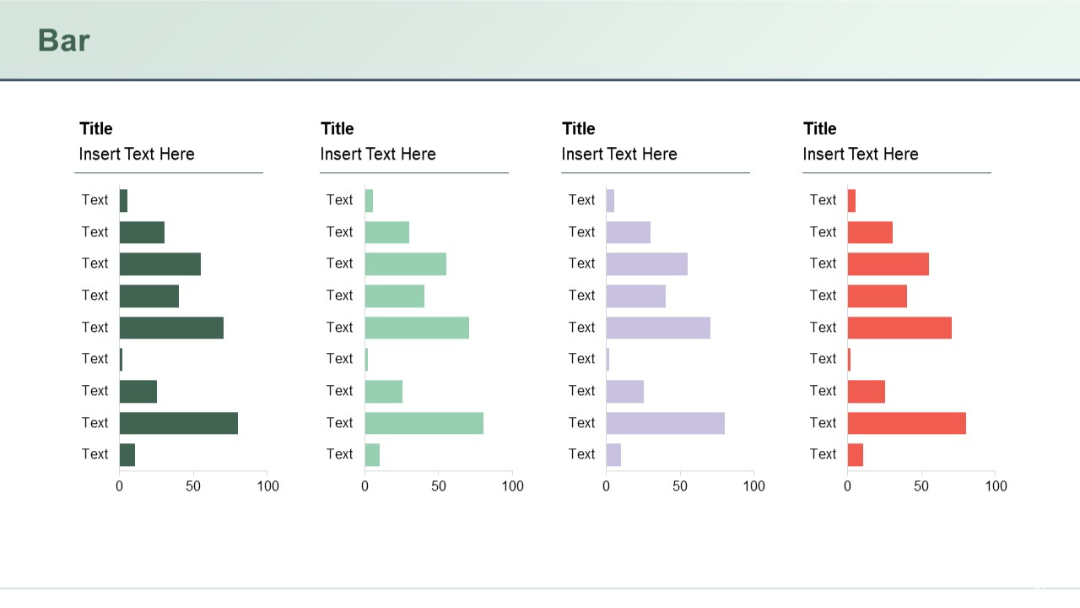
Four small horizontal bar charts in columns, each color-coded, showing data distribution across seven rows.
PRO
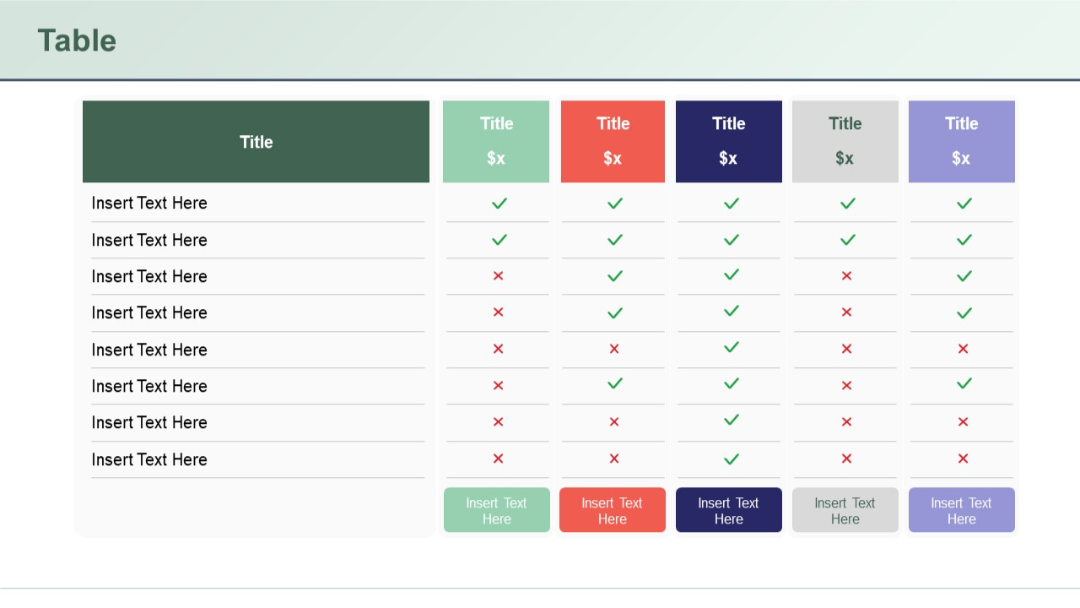
Six-column comparison layout with color-coded column headers and check/X symbols; header and bottom “Insert Text Here” fields for each column.
PRO
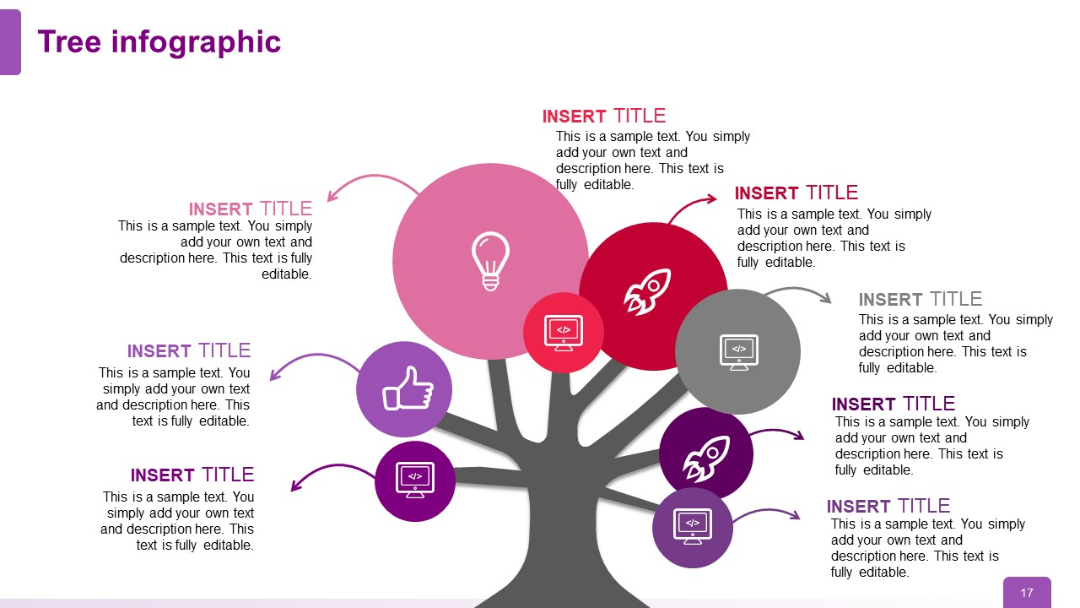
Fully built-out tree with eight circular nodes including a mix of lightbulb, rocket, thumbs up, and computer icons in various colors and sizes.
PRO
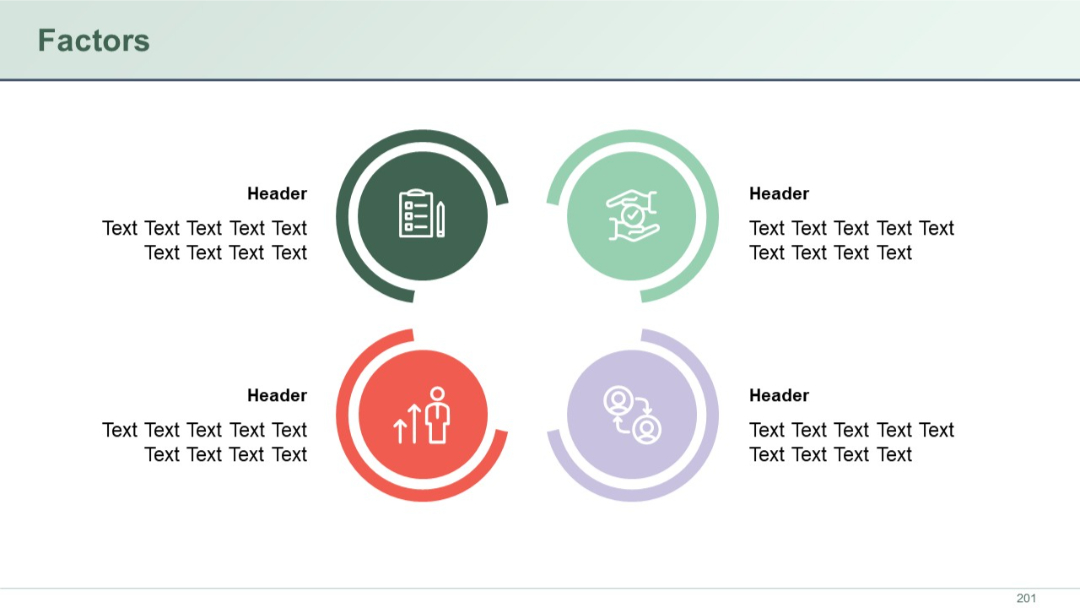
Four circular icons arranged in a 2x2 grid, each with a colored ring and header text beside it. Clean layout with balanced white space.
PRO
4-column table with header rows; structured for tabular text; white background.

PRO
Light-themed comparison table showing regional maturity levels from 2020 to 2025 across five global regions.

PRO
Eight-part pie-style radial diagram with segment-specific icons and mirrored text placement on both sides.
PRO
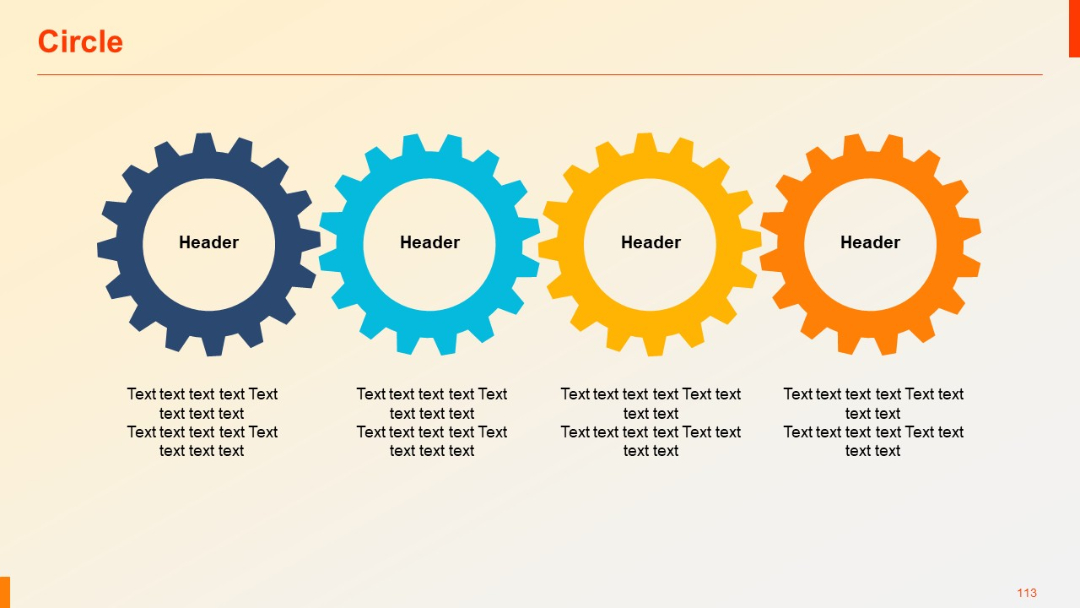
Four large gear icons arranged horizontally. Each gear is a different color and contains a header and description below.