PRO
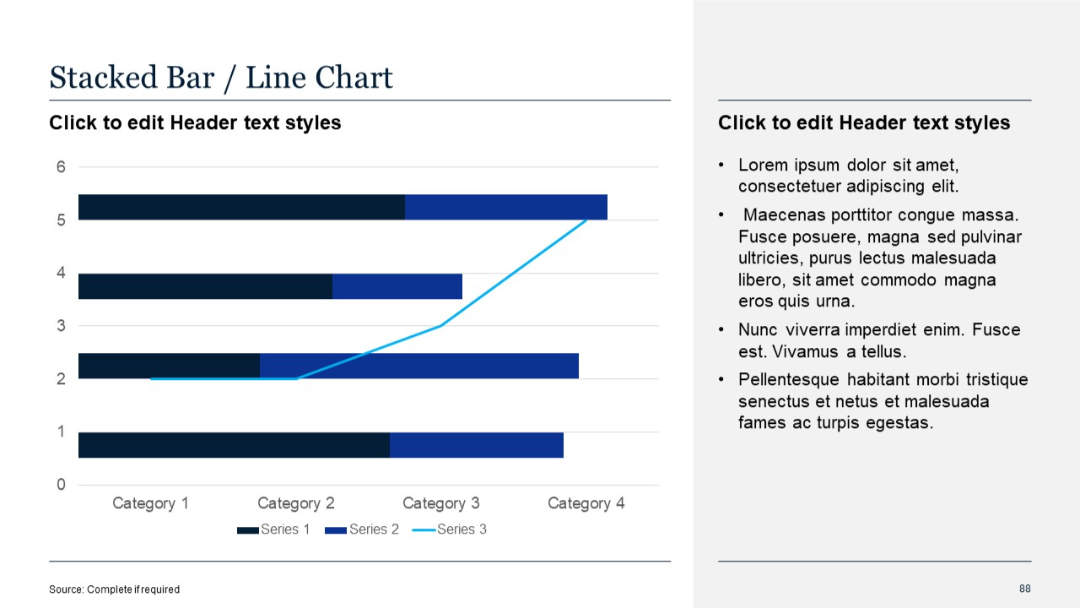
Horizontal stacked bar chart combined with line graph; two-column layout
PRO
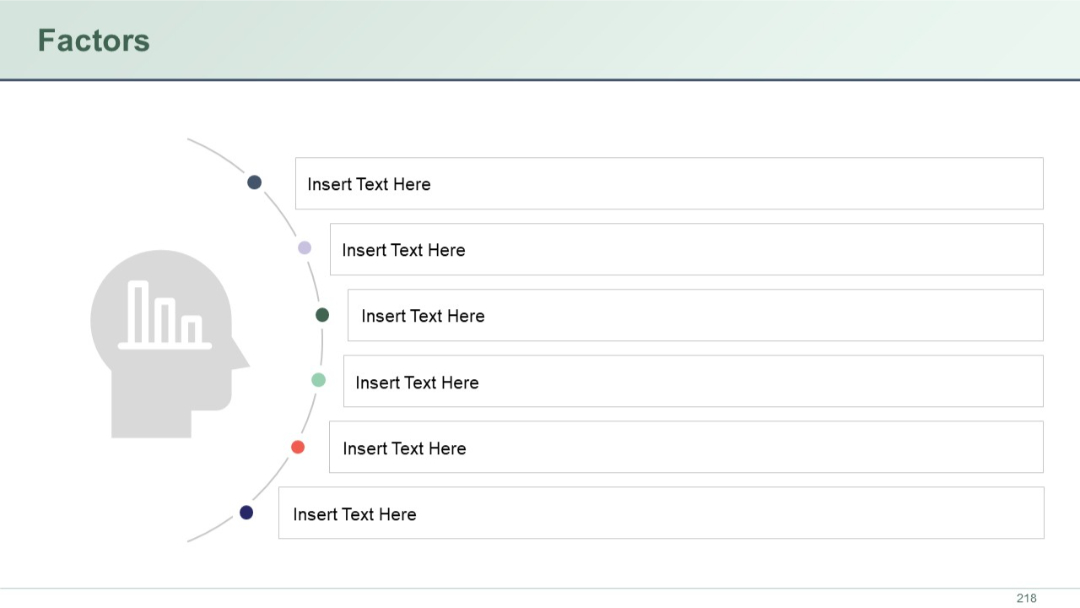
Silhouette of a human head with a chart inside on the left, and six rectangular text blocks radiating outward on the right, aligned along a curved path.
PRO
100% horizontal stacked bar chart; bars scaled to 100%; uniform height.

PRO
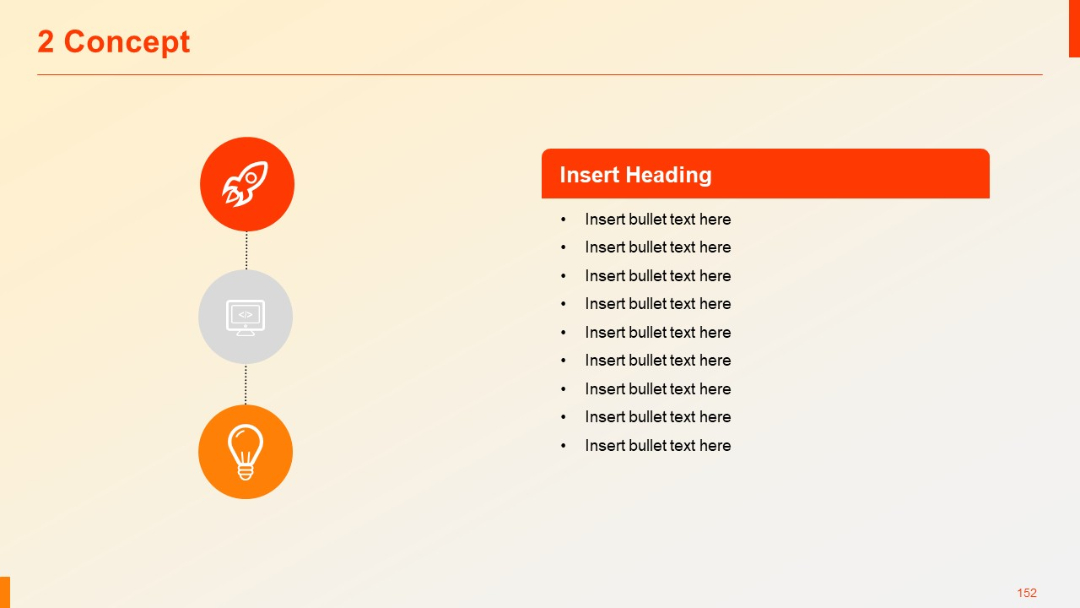
Vertical process flow with three circular icons (rocket, code, bulb) on the left connected by dotted line; text box with bullets on the right.
PRO
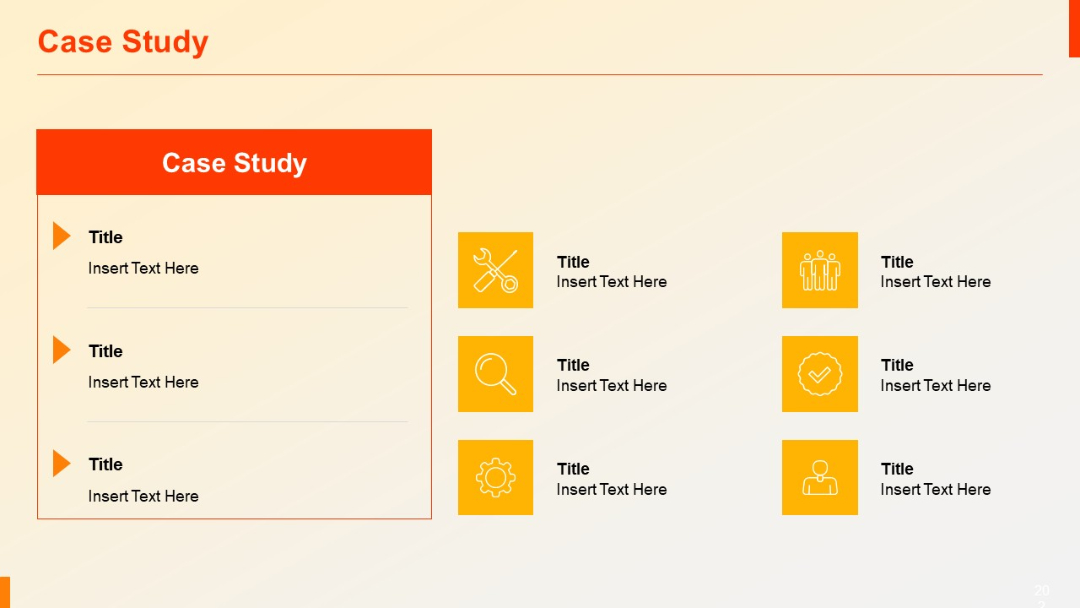
Two-column layout: left side has list items with triangle bullets, right side displays paired icons with titles.
PRO
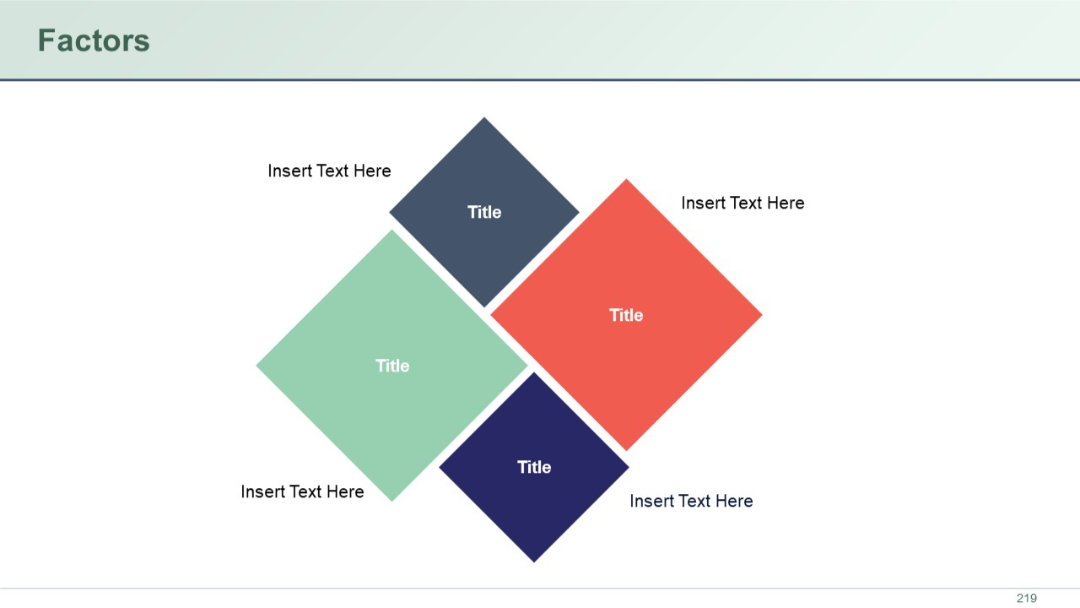
Four diamond-shaped blocks in a square arrangement, each labeled “Title” with accompanying placeholder text on each side.
PRO
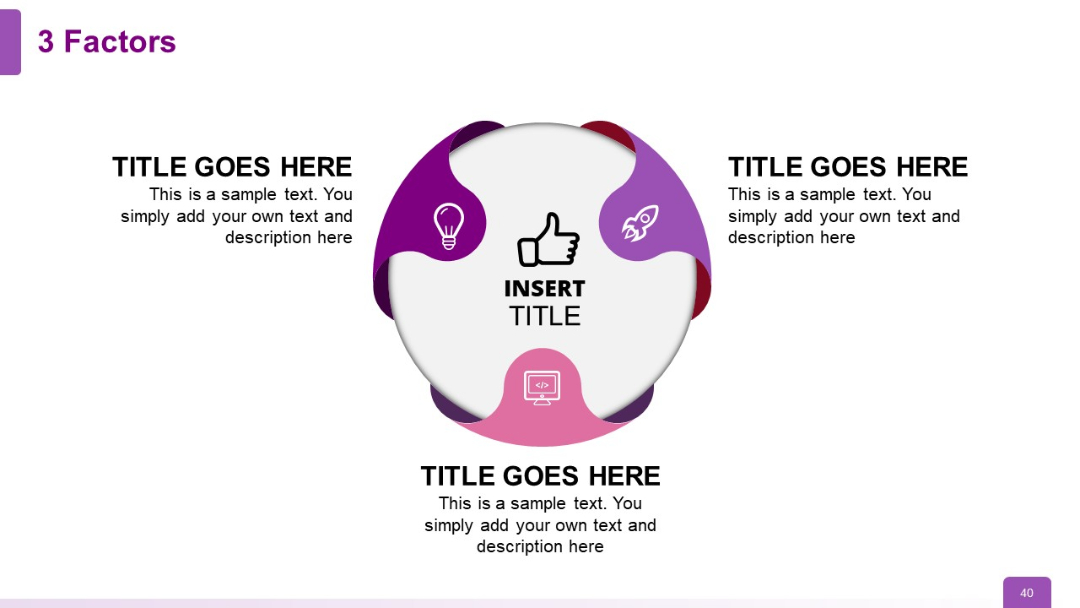
Circular design with three evenly spaced headers/icons surrounding a central thumbs-up icon; symbols imply innovation, launch, and development.
PRO
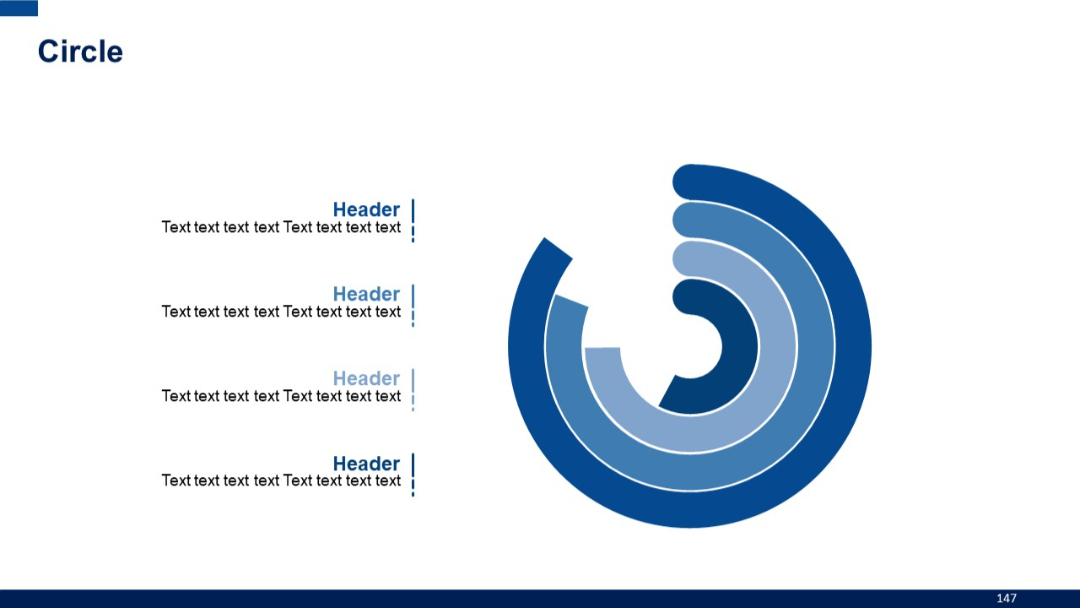
Layered spiral/radar-style circle diagram with 4 curved layers on the right, matched with corresponding headers and descriptions on the left.
PRO
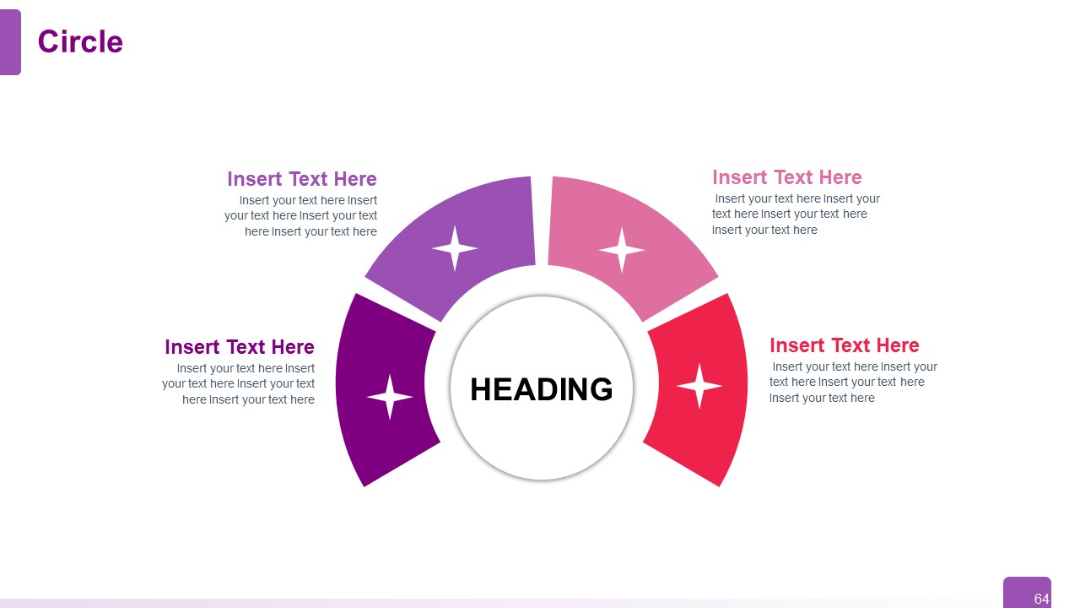
Semi-circle arc infographic with four segments surrounding a central circle labeled "Heading." Text boxes above and below each arc segment.
PRO
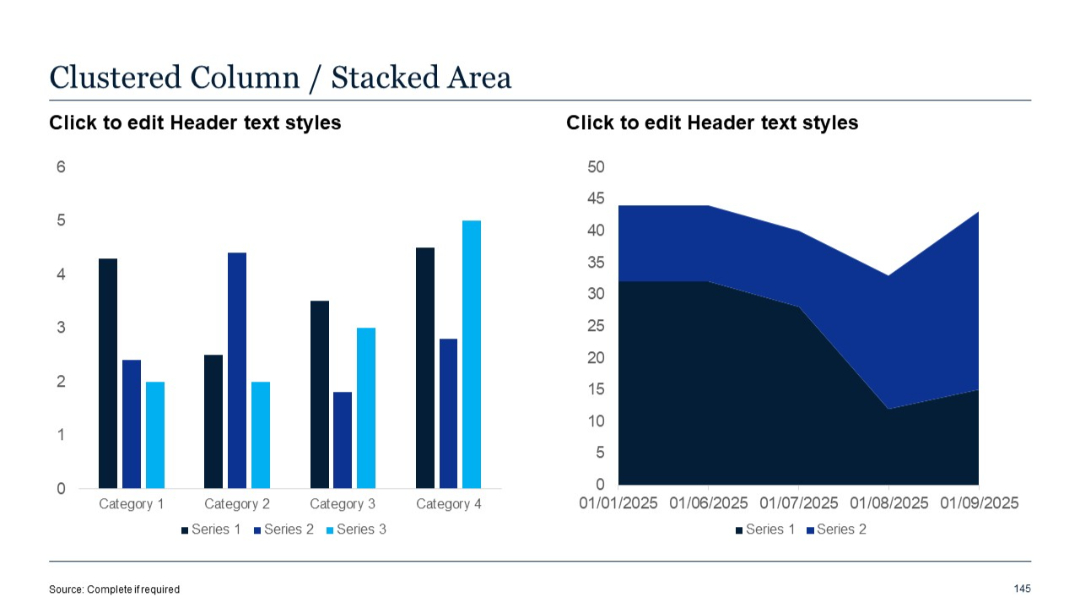
Left side is a clustered column chart, and the right shows a stacked area chart. Blue color palette used throughout.
PRO
Three-column format with purple header bars for subtitles; structured for side-by-side textual comparison; placeholders provided.

PRO
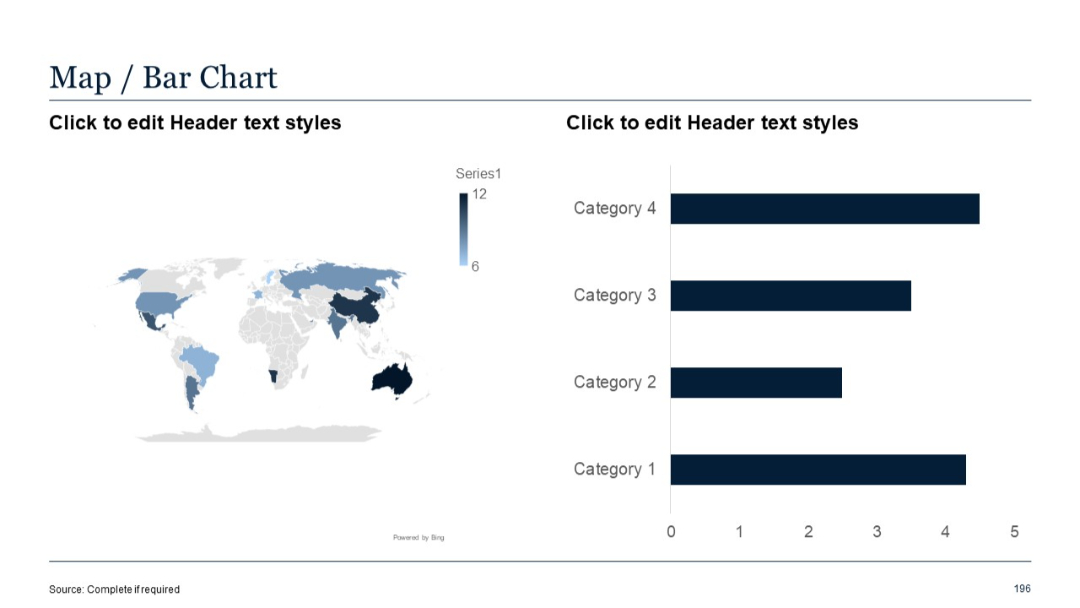
Left: world map with heat shading; Right: horizontal bar chart comparing values across four categories.
PRO
Clean white background with a left-aligned title and date; placeholder for logo; diagonal color accents on the bottom right.

PRO
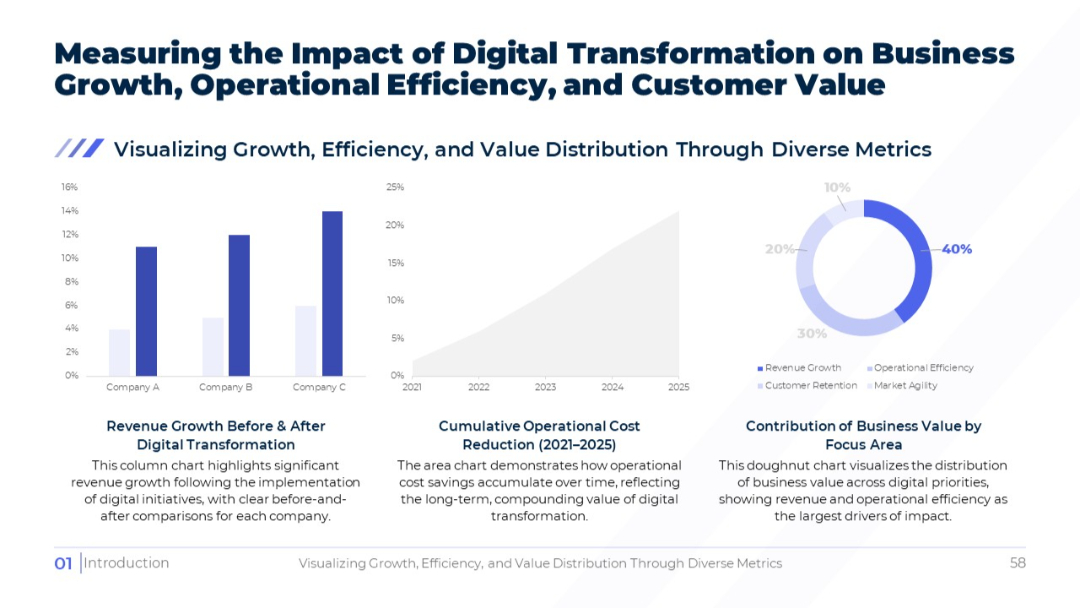
Three-chart layout: bar, area, and doughnut; focuses on revenue, cost savings, and business value distribution respectively.
PRO
Vertical checklist icons connected by a line on the left, with text placeholders aligned to the right.

PRO
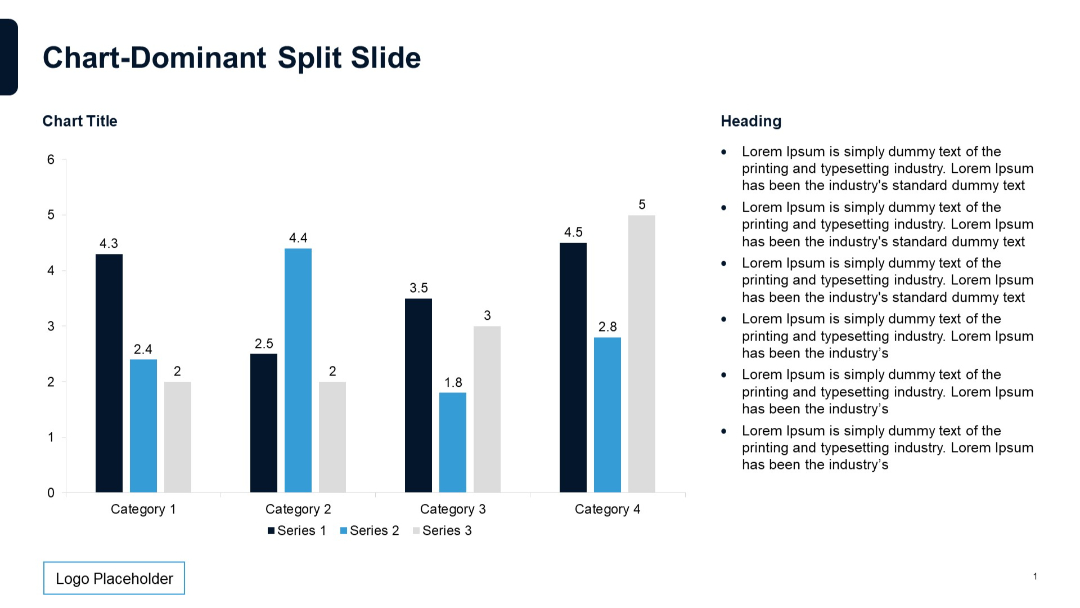
Vertical bar chart on the left; bullet list on the right; three-color series; labels above each bar.
PRO
Two large columns with bold red headers. Subtitles are emphasized with strong color blocks above text areas.

PRO
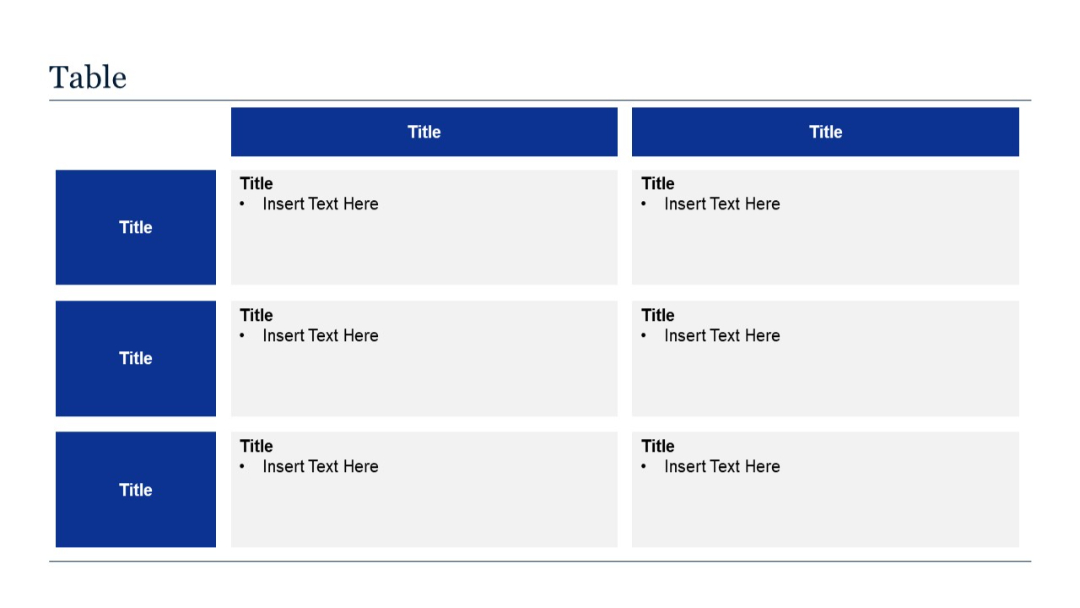
Grid-based layout with two major columns and multiple rows; each row uses left-aligned blue cells with corresponding content blocks to the right.
PRO
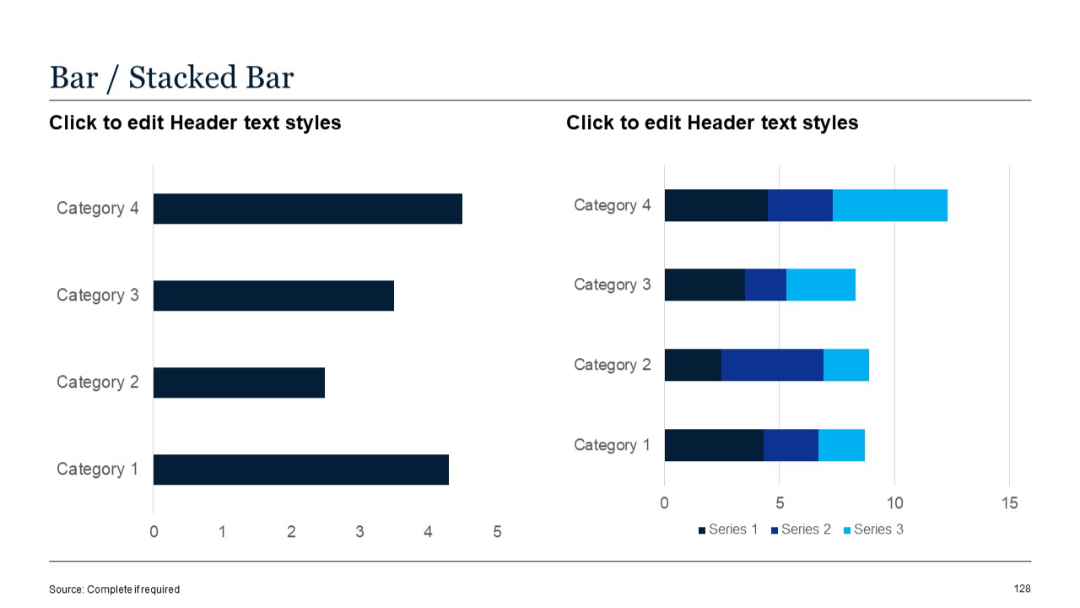
Left: standard horizontal bar chart; Right: stacked horizontal bar chart.
PRO
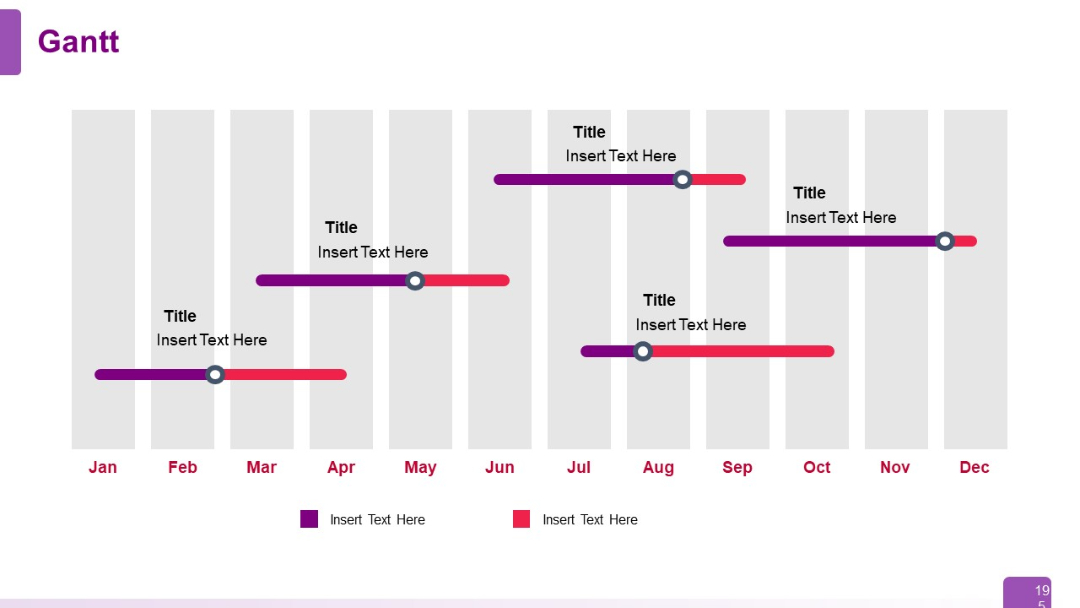
Calendar-based Gantt chart with vertical month divisions and horizontal task bars; markers for milestones.
PRO
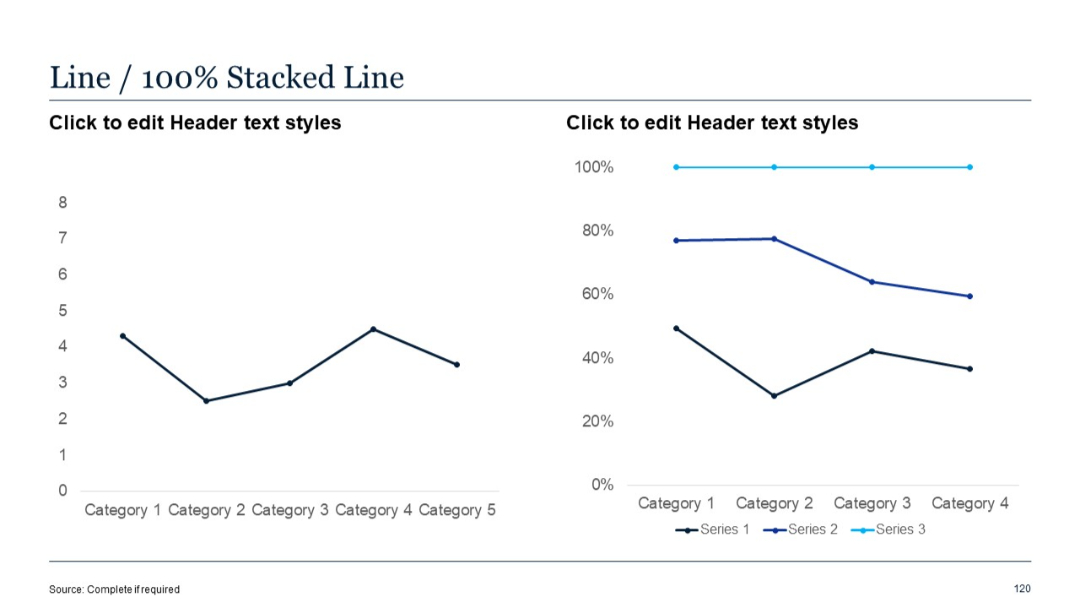
Two-panel layout: one line chart, one 100% stacked line chart; used to compare absolute and percentage trends.
PRO
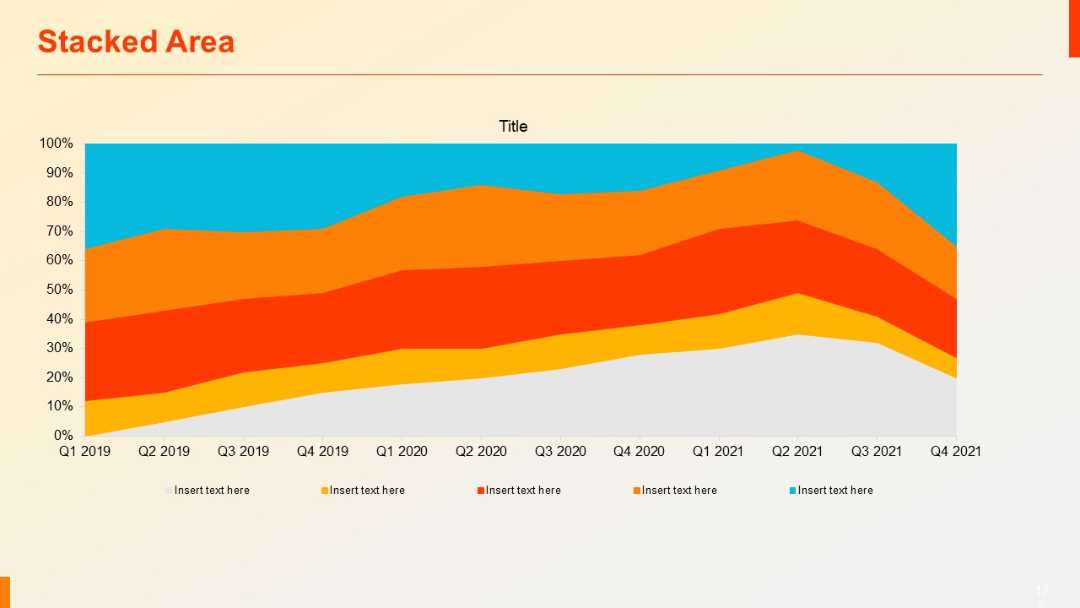
Stacked area chart with six color layers representing different series over time (Q1 2019 to Q4 2021). Clean and data-focused design.
PRO
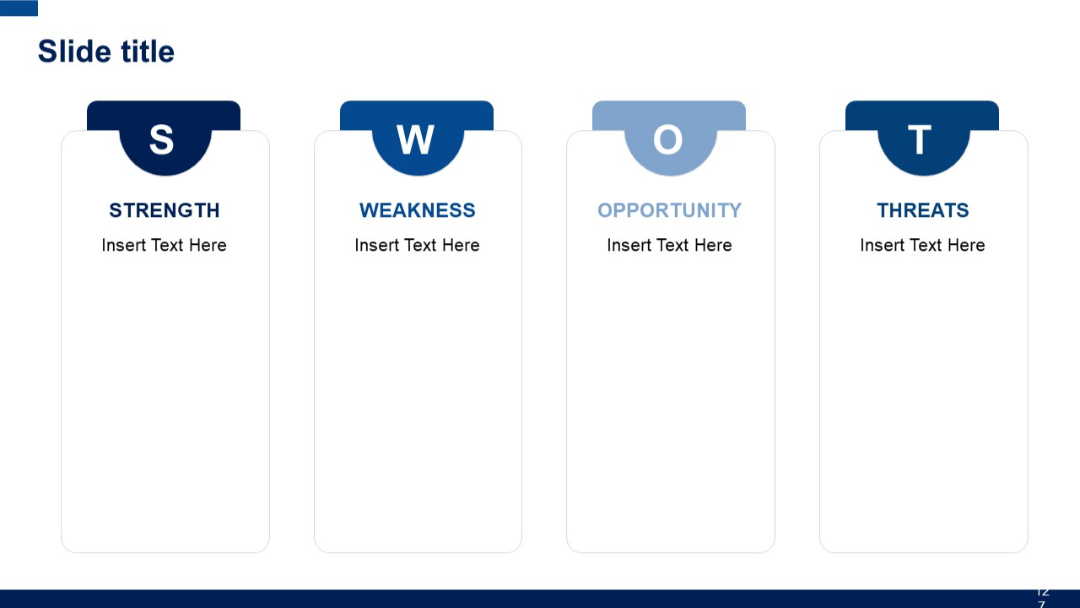
Vertical pill-shaped boxes labeled S, W, O, T at the top, each with a corresponding full-width section beneath for textual content.
PRO
Slide presents four vertical columns, each with a heading and bulleted list. Compact layout, evenly spaced.

PRO
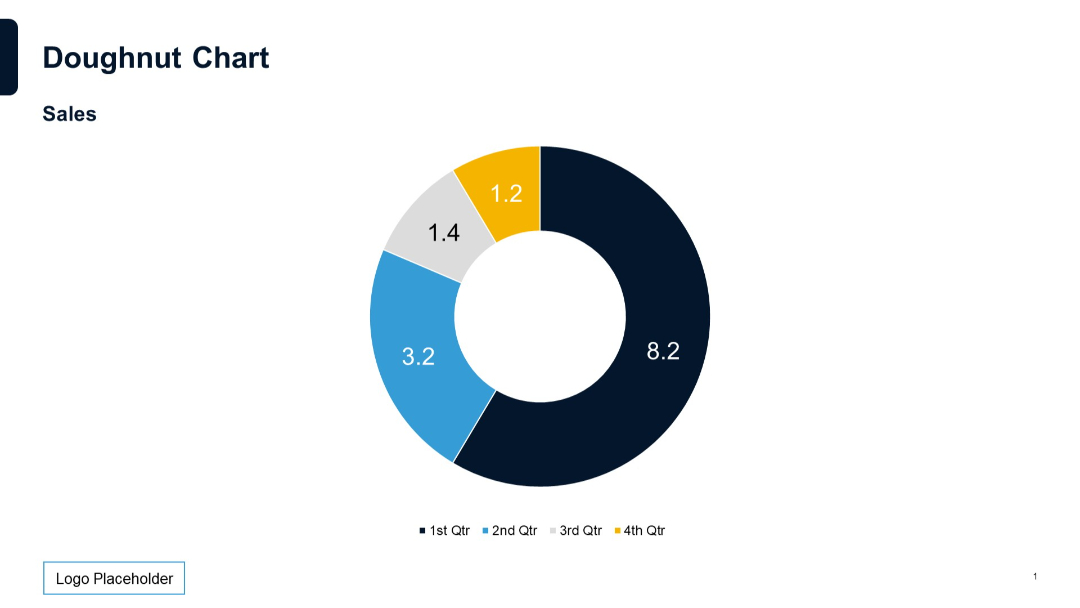
Circular doughnut chart with four color-coded segments, center cutout, and labeled data values; includes title and legend at the bottom.
PRO
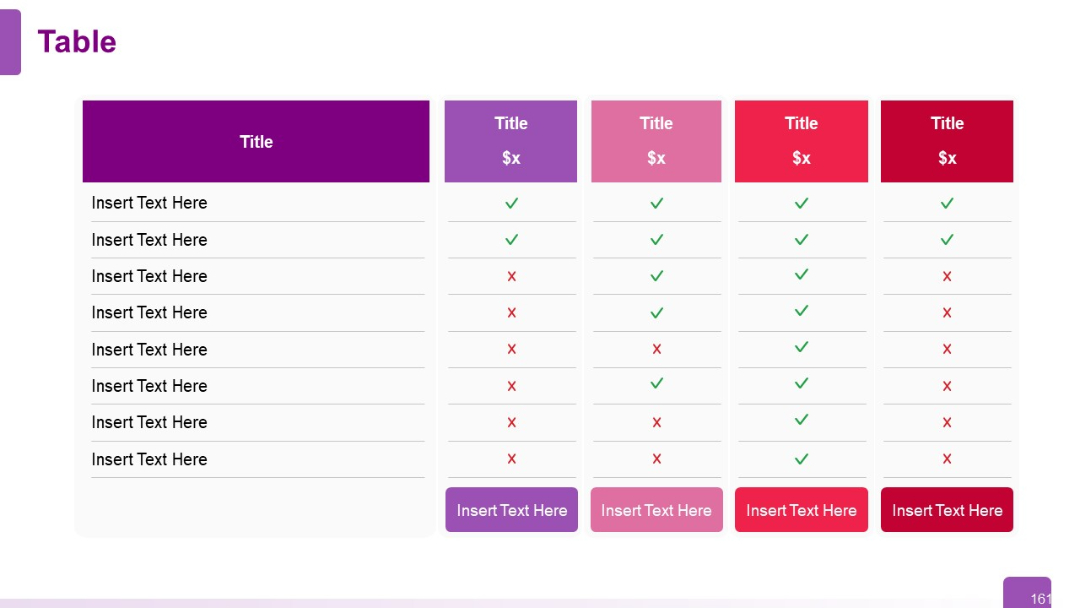
A five-column comparison table with colorful headers and checkmark/cross icons to indicate feature inclusion; purple-themed design.
PRO
Vertical gear-linked checklist with checkmark icons and horizontal lines connecting them.

PRO
Simple gradient slide with large "02" section number and title “Qualitative Slides.” Acts as a divider or chapter header.

PRO
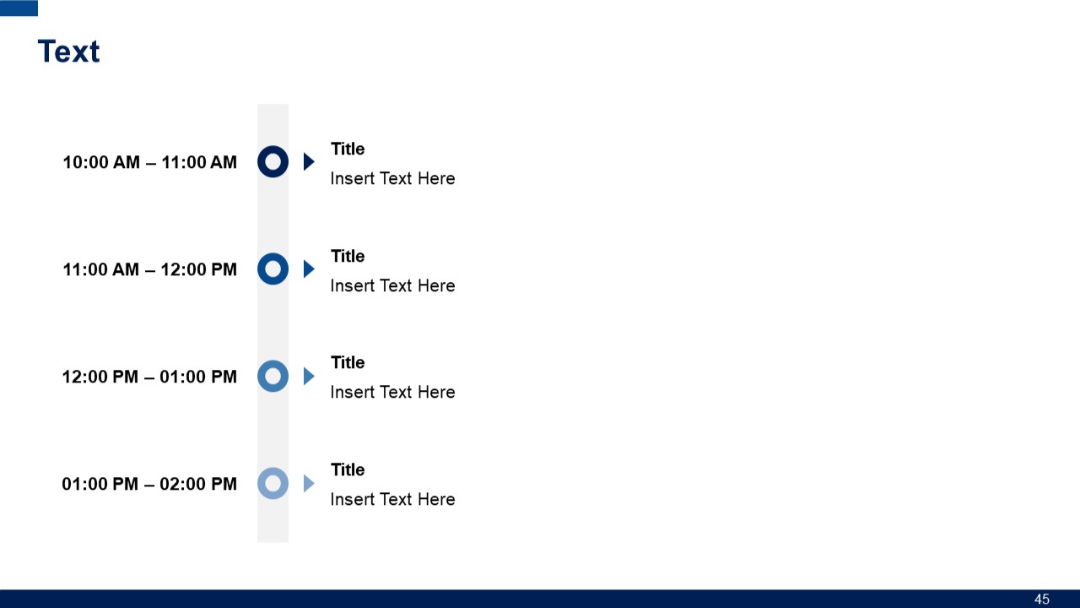
Left-aligned timeline with vertical blocks of time and arrow icons pointing to content boxes.
PRO
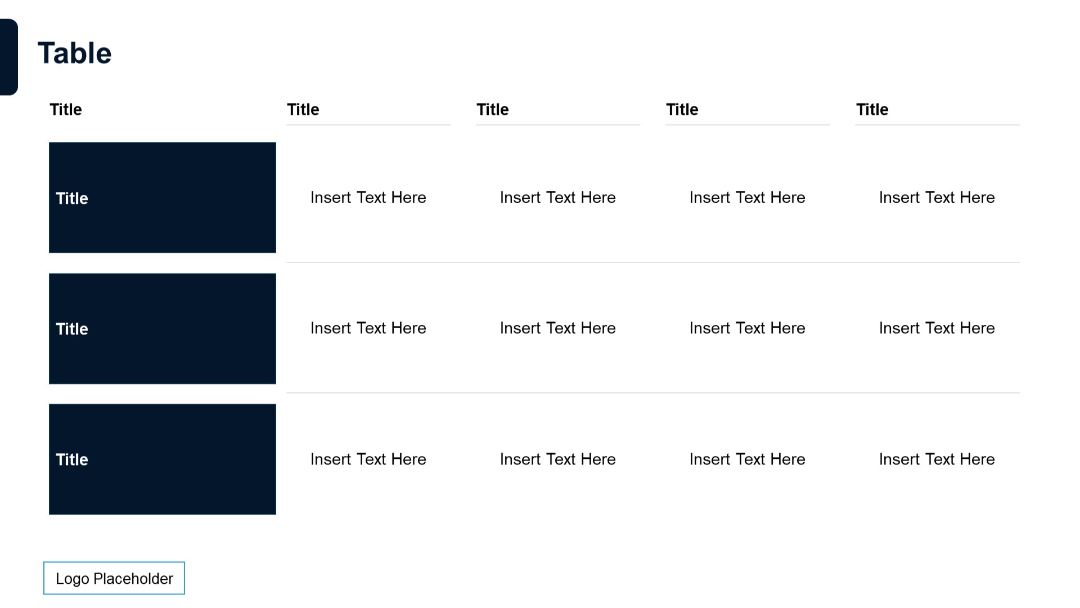
A 5-column, 3-row table layout with bold row headers on the left in dark blue. Minimalist design with ample white space. Logo placeholder at bottom left.