PRO
Horizontal layout with a bold title bar on top and six rows of text entries marked with arrow icons. Simplistic, linear, and clean.
PRO
Numbered list layout with colored blocks for numbers on the left and horizontal bars stretching across with text on a white background.

PRO
Symmetrical horizontal timeline with circles connecting to alternating left and right text blocks. Strong central divider.
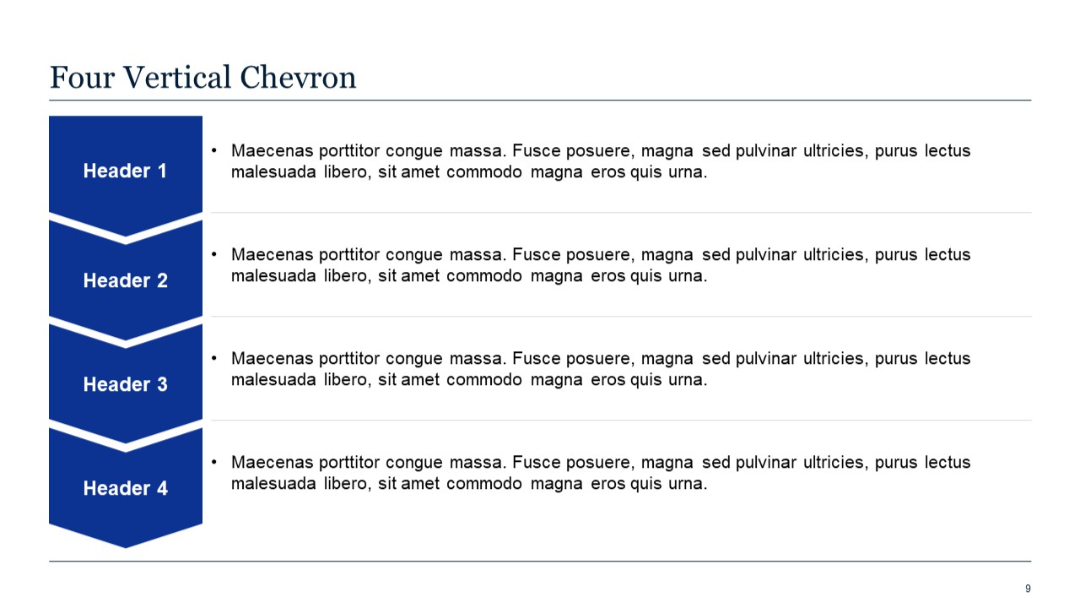
PRO
Vertical stack of four chevrons with right-aligned descriptive content.
PRO
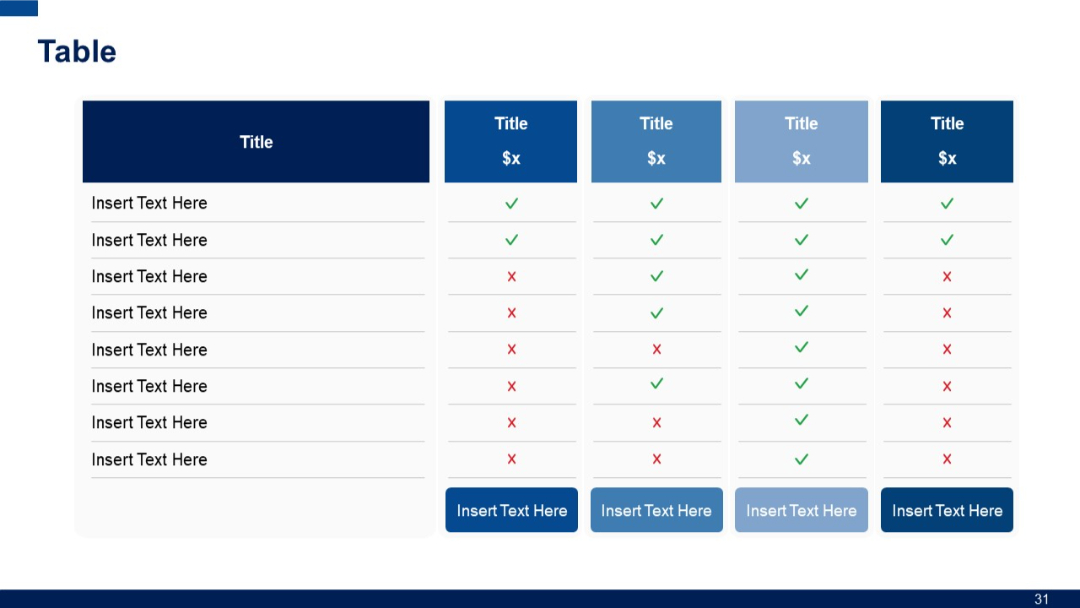
Horizontal comparison table with five vertical columns and eight horizontal rows; columns have colored headers and cells use checkmarks or crosses.
PRO
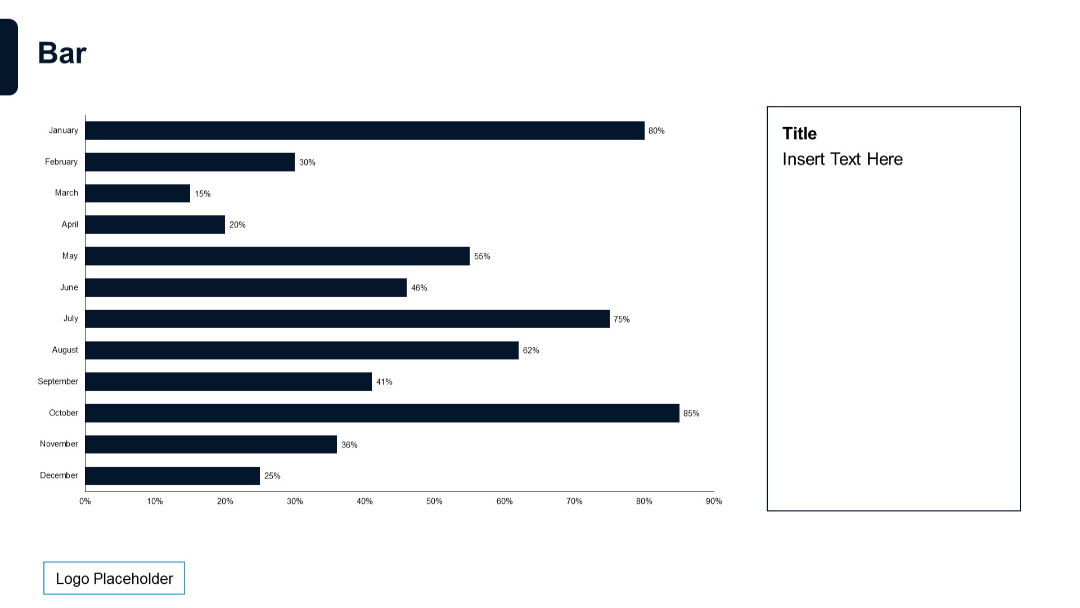
Monthly horizontal bar chart from January to December with percentages on each bar. Right side includes a white box for title and text.
PRO
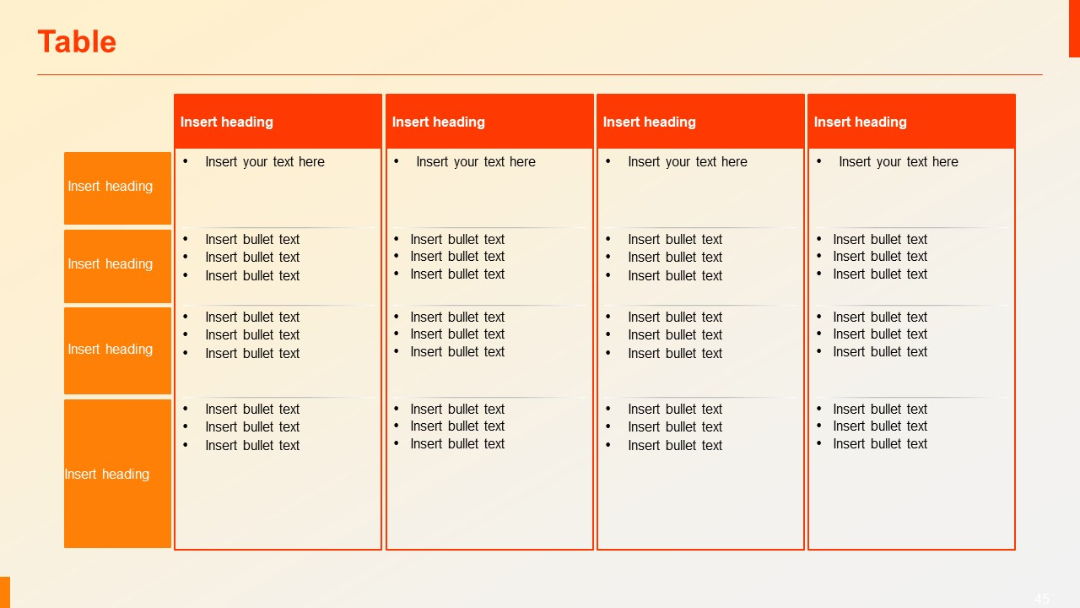
Grid table with vertical side headers and vertical bullet lists in each column. Five columns, four rows. Alternating orange headers.
PRO
Finance and people-focused icons in red outline. Includes wallets, cash, people in groups, and POS systems.

PRO
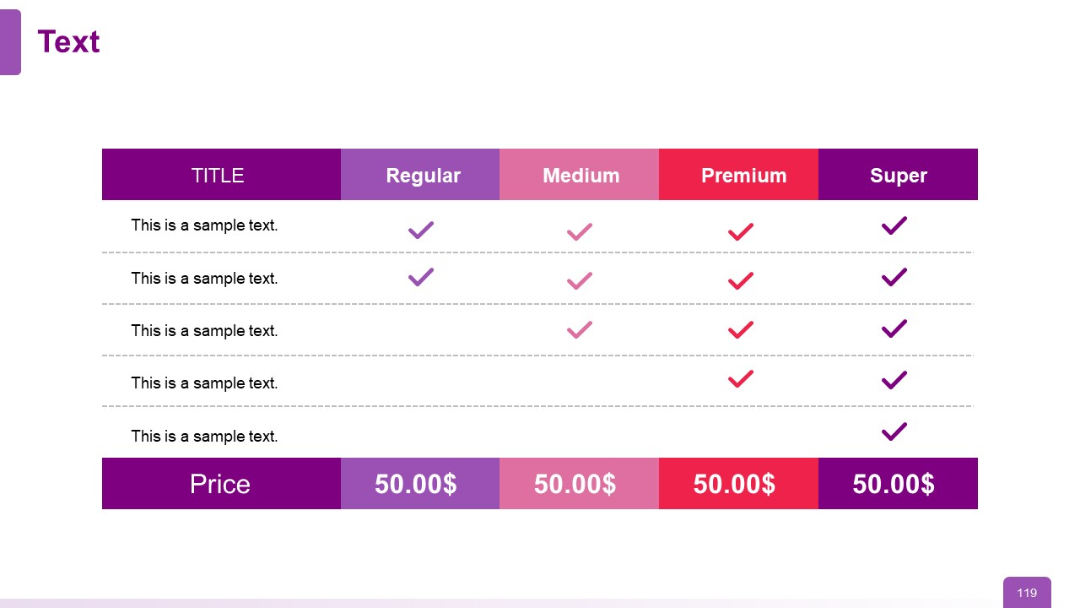
Pricing table comparing Regular, Medium, Premium, Super plans with checkmarks
PRO
Four horizontal rounded-corner text blocks layered over a desk-themed background.
PRO
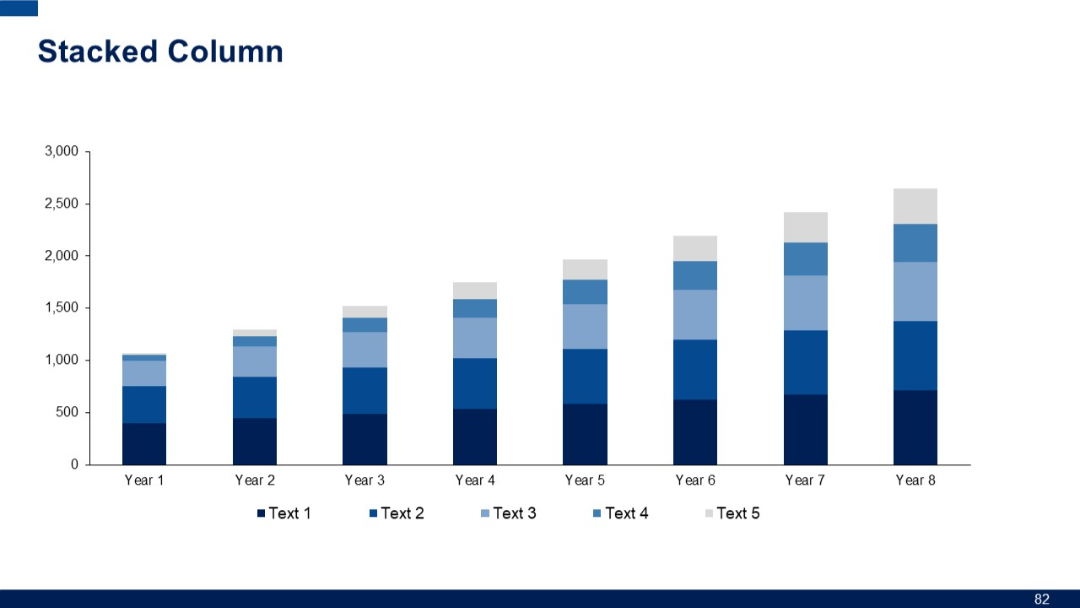
Full-width stacked column chart displaying eight years of data with five series. Uniform bar spacing and color variations for each series.
PRO
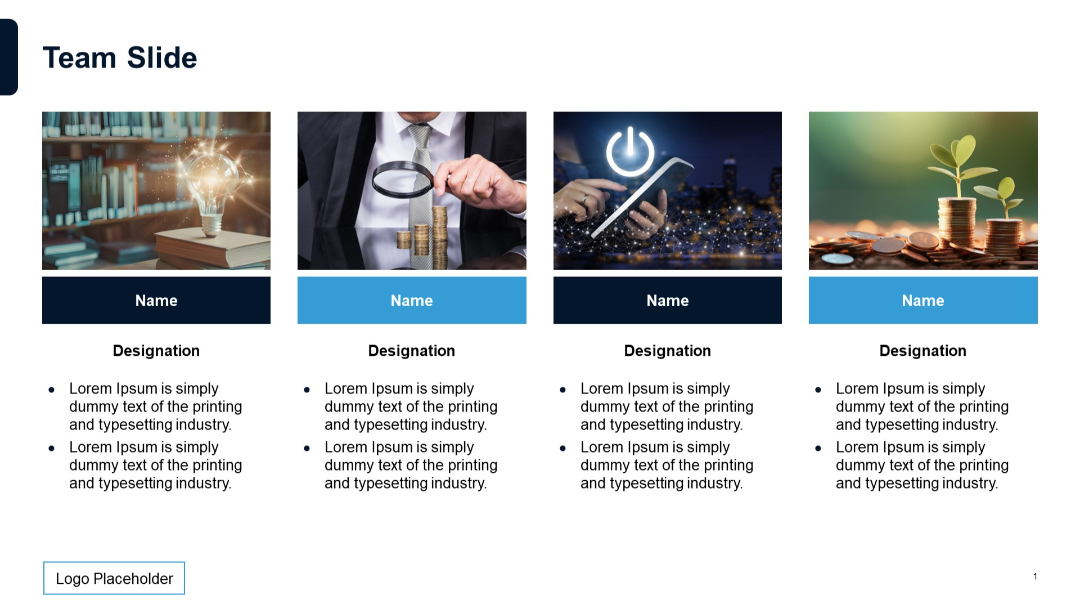
A slide with real photo placeholders above each profile section, adding visual context to team descriptions.
PRO
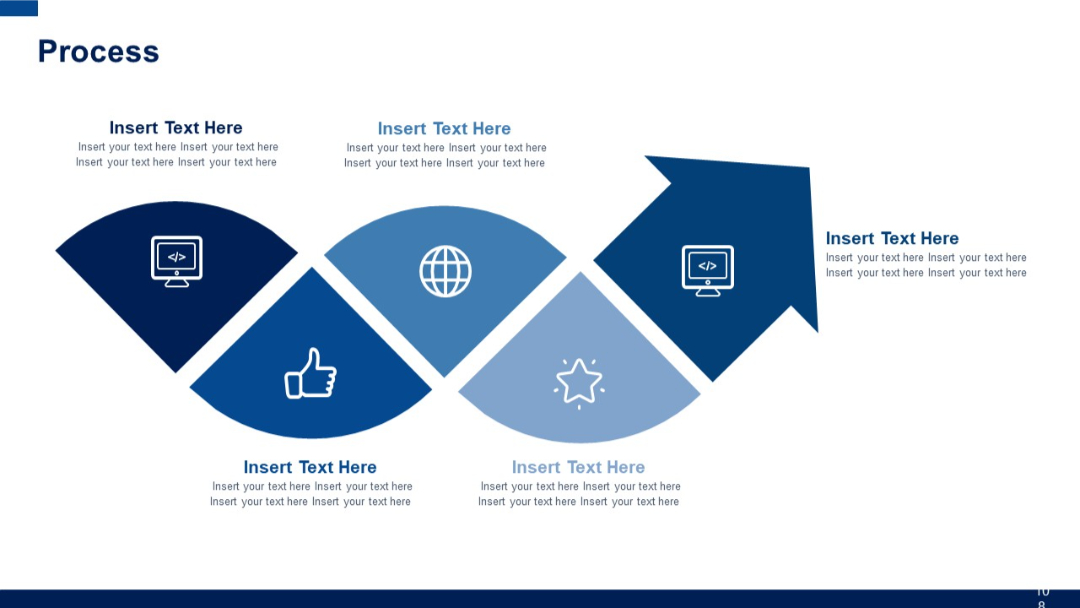
Curved segmented arrow with five interlinked shapes, each containing an icon, title, and placeholder description.
PRO
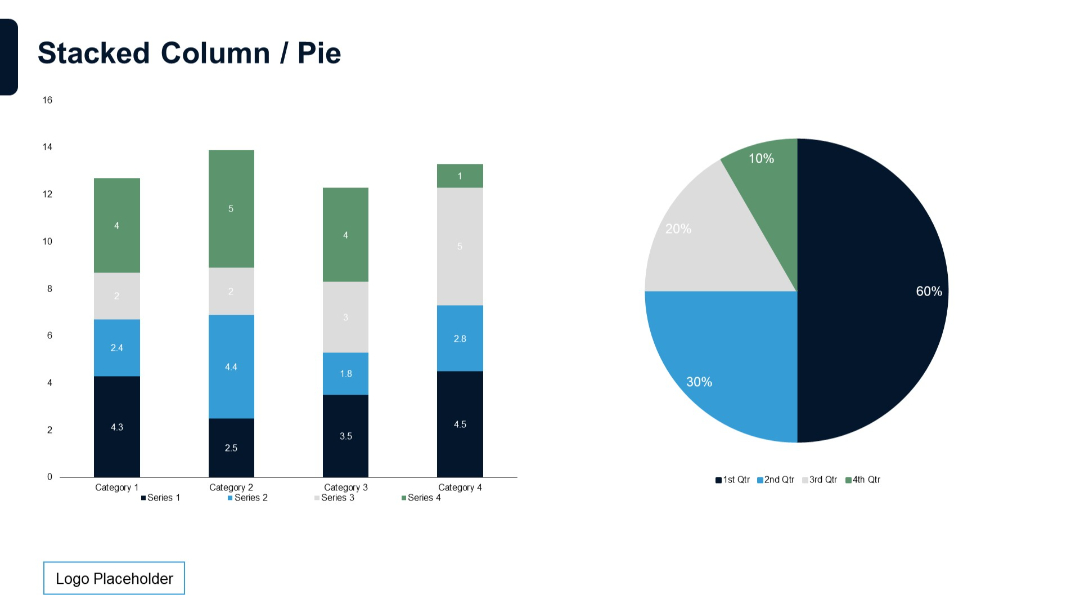
Left side features a multi-series stacked column chart; right side contains a matching pie chart.
PRO
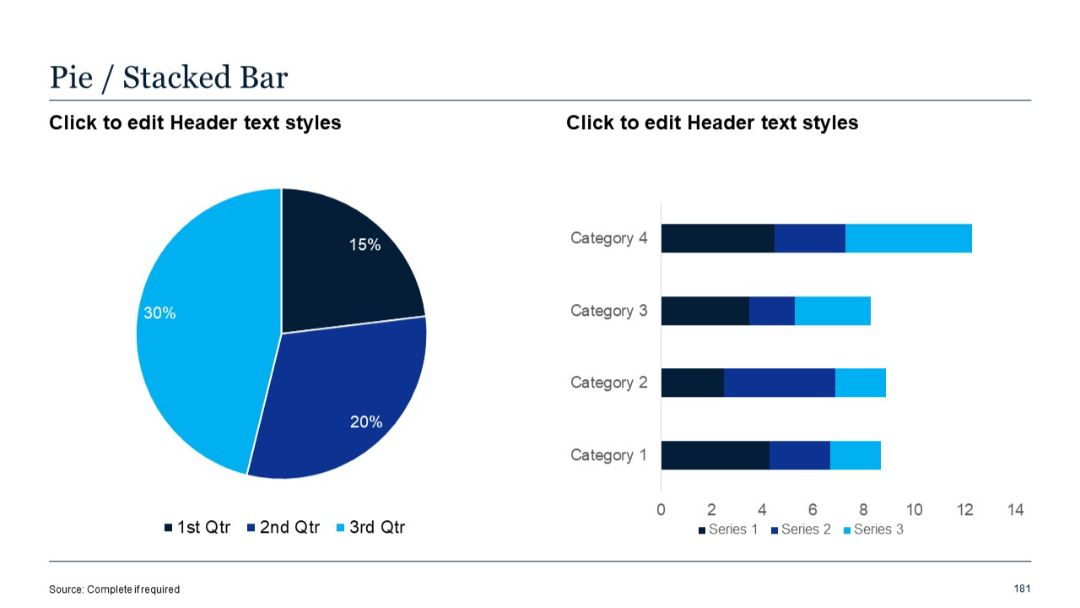
Split layout: left side features a pie chart with three labeled segments; right side shows a horizontal stacked bar chart with four categories and three data series.
PRO
Four doughnut-style pie charts with central percentage labels, symmetrically aligned and color-coded.

PRO
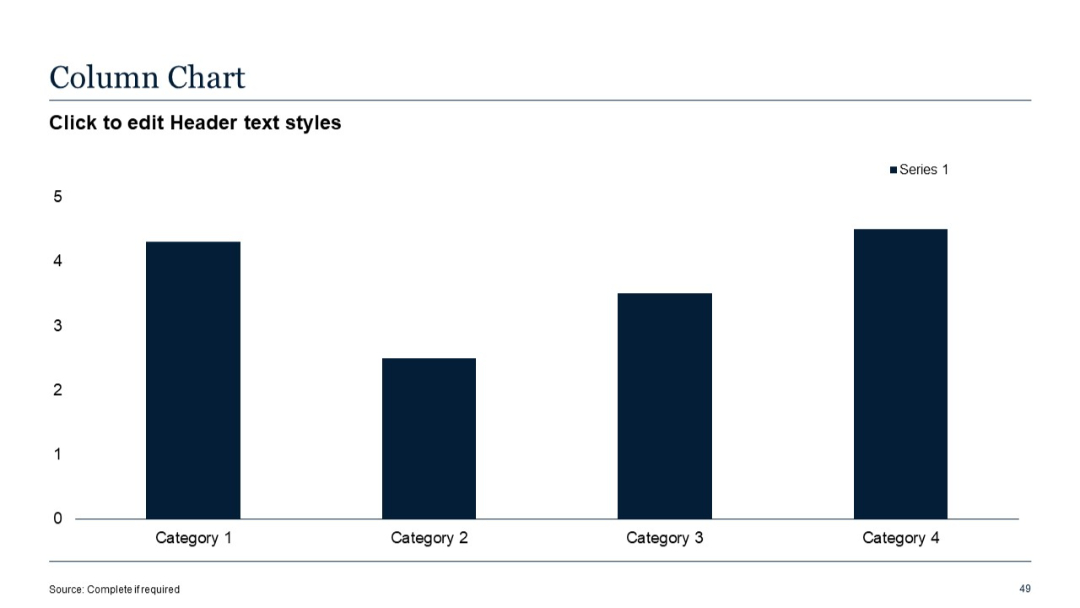
Vertical bar chart with one data series shown across four categories. Y-axis indicates value scale.
PRO
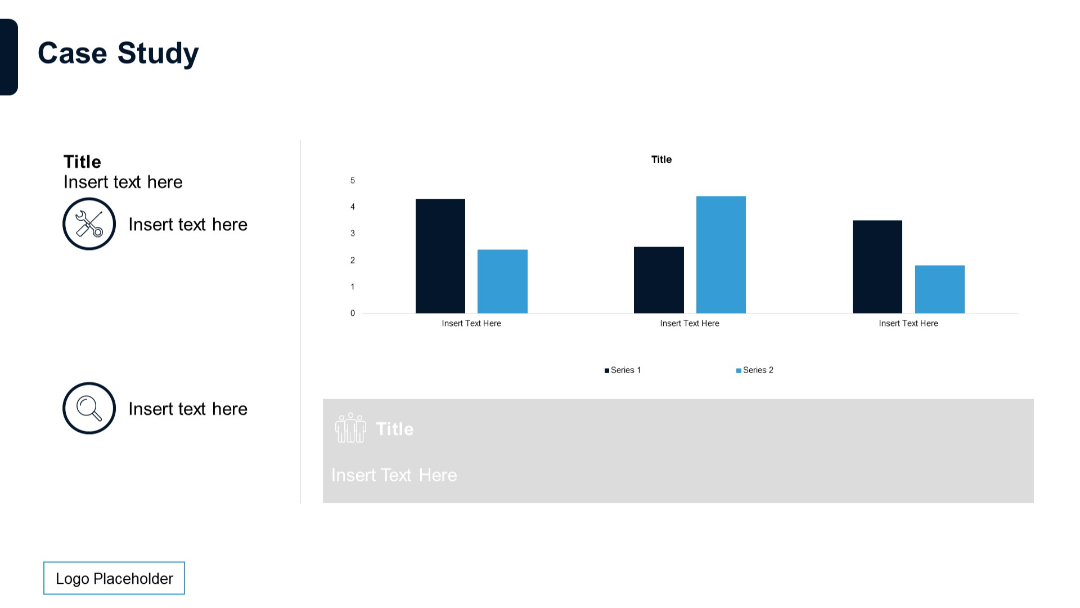
Bar chart with two data series and text blocks with icons on the left. Layout includes placeholders for titles and explanations.
PRO
One large quote section with bold orange background and a contrasting white section. High visual contrast to highlight one powerful quote.

PRO
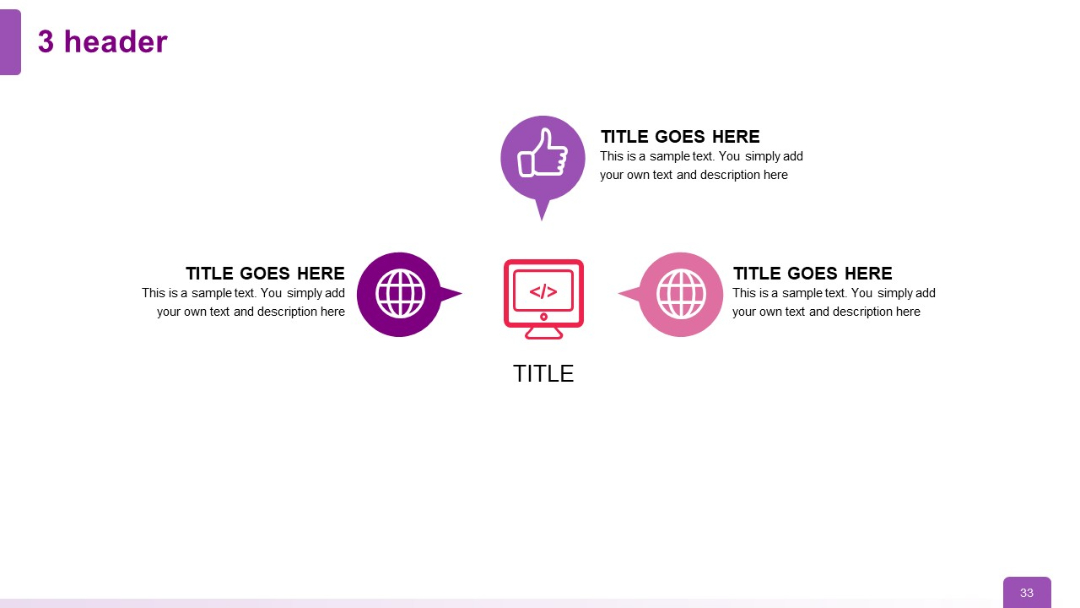
Linear and slightly vertical layout with one top icon and two side-by-side bottom headers; central icon emphasizes connectivity or code.
PRO
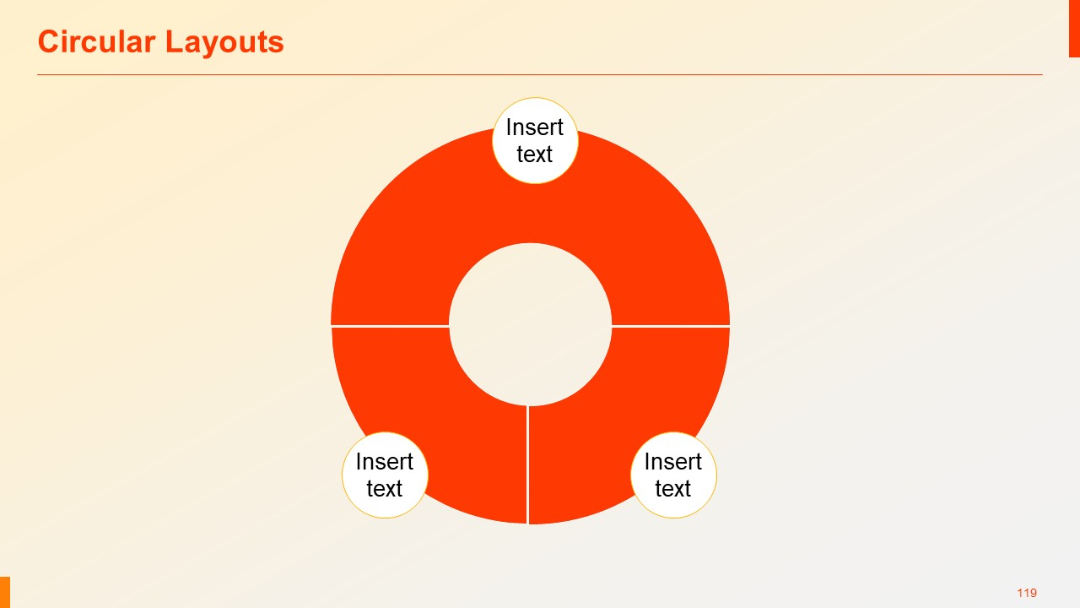
Circular chart split into four equal quadrants, each with a “Insert text” circle attached. Uses bold red color for emphasis.
PRO
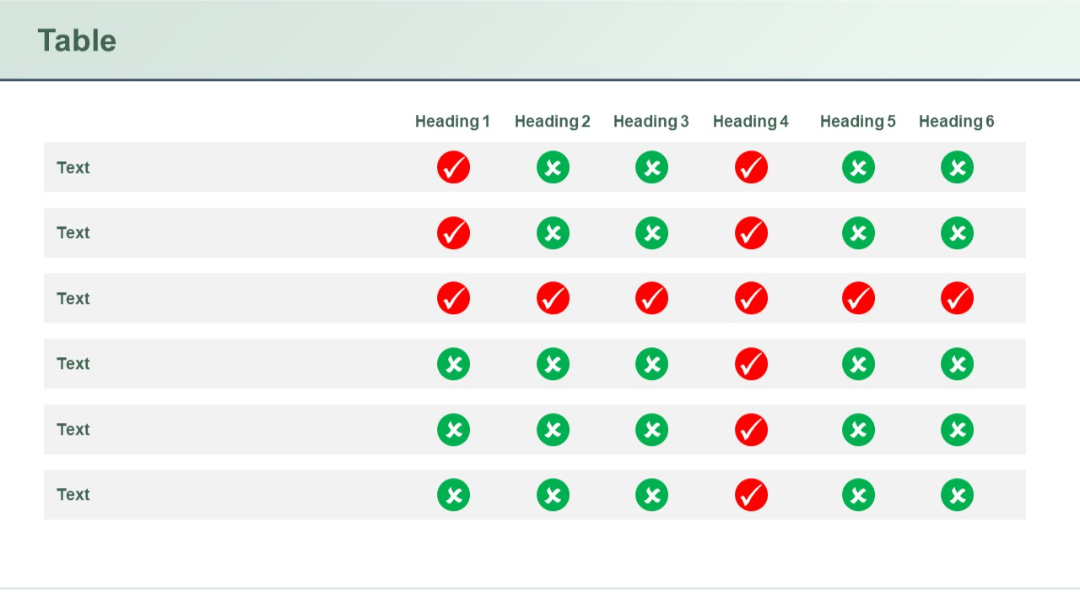
Comparison matrix with colored check/cross icons in a 6-column layout. Clear visual cue system for presence or absence of features.
PRO
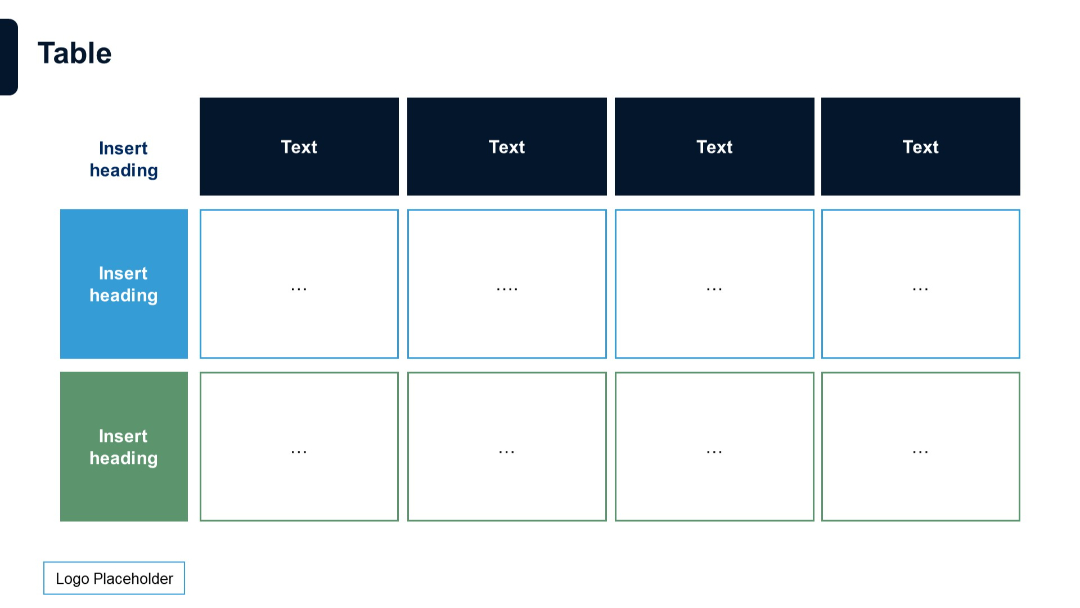
3x4 grid with horizontal and vertical headers in colored boxes; minimalist icons and placeholder text used throughout.
PRO
Vertical timeline agenda with time ranges, icons, and two columns for content distribution.
PRO
Grid layout of global and location-based icons including globes, location pins, maps, airplanes, and communication markers.
PRO
Vertical timeline layout with checkmarks and lines connecting text blocks on the right.
PRO
Four-row layout with colored badge numbers on the left and title-text fields aligned to the right.
PRO
Two-part circular diagram with central icons and surrounding gradient ring, orange-red color scheme.
PRO
Vertical timeline with hourly time blocks on the left, and corresponding content areas to the right; icons mark each time slot.

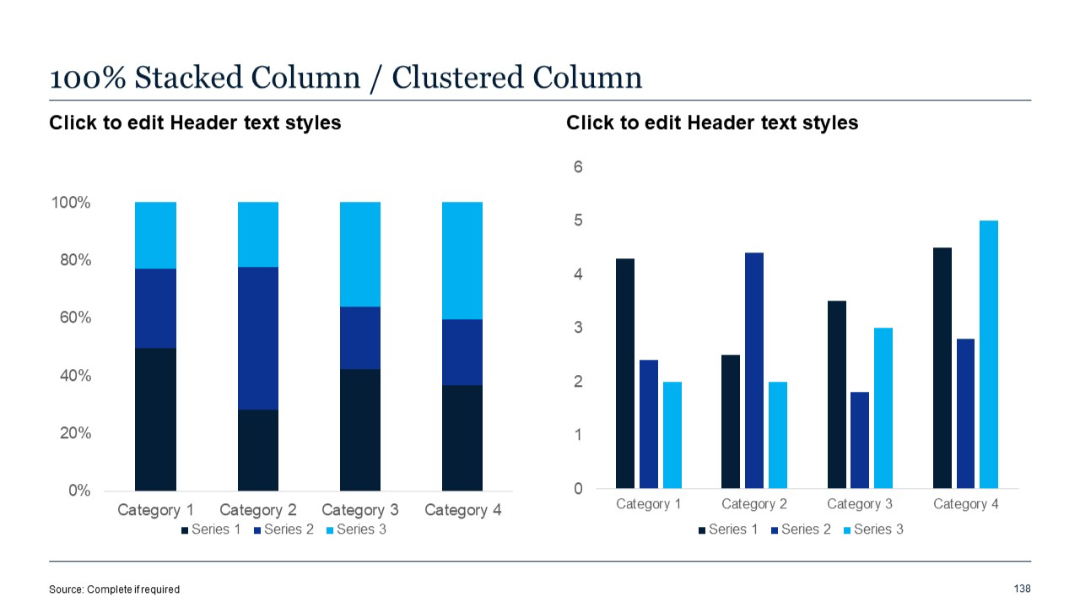
PRO
Left chart shows normalized 100% stacked columns; right chart displays clustered columns. Visual contrast in how series data is distributed and displayed.