PRO
Dual-column comparison tables with headers in bold and color-coded columns (purple and red variants). Simple alternating row structure for clarity.

PRO
Vertical timeline with five stages; left side has numbered circular markers, right has title and text.
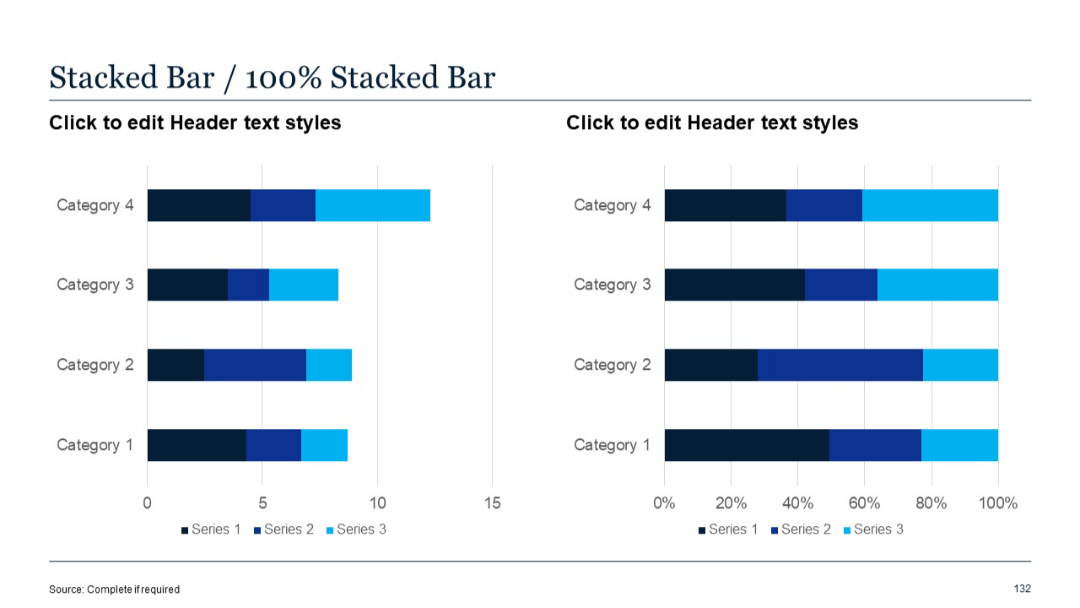
PRO
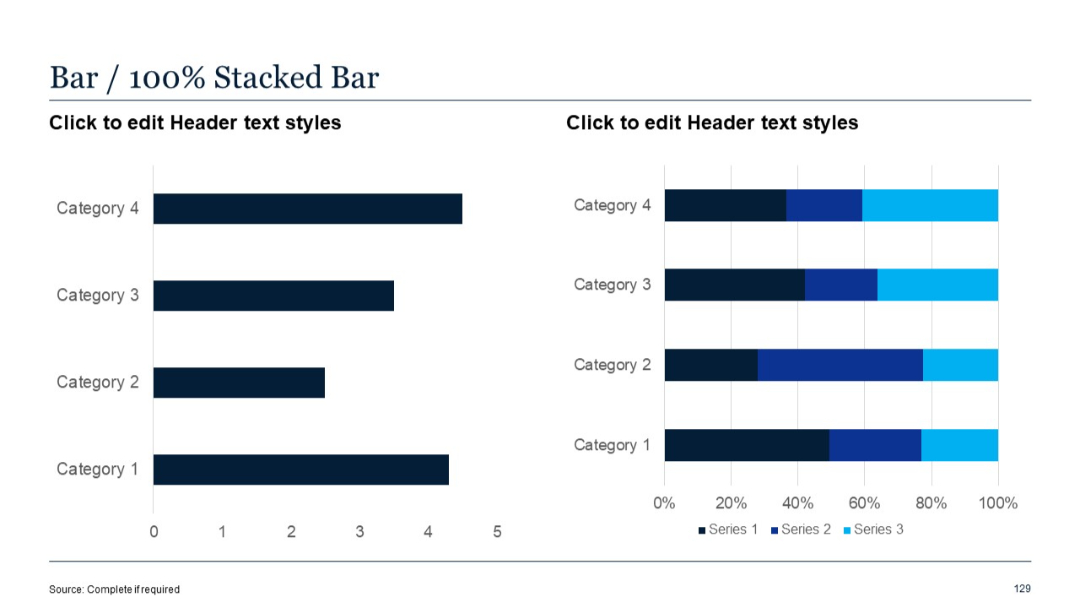
Left: simple bar chart; Right: 100% stacked bar chart. Bars are horizontal with three-color series breakdown.
PRO
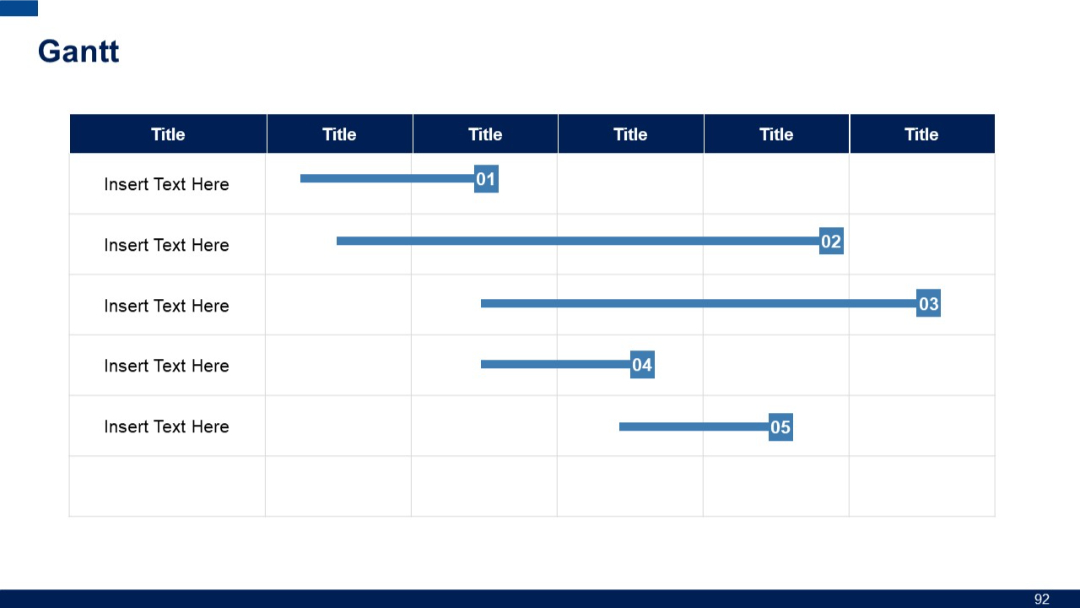
Horizontal Gantt chart with task bars across six time columns; each row has numeric labels and progress bars with labels.
PRO
Horizontal layout with map pin-style markers and text areas below each of the five numbered points.
PRO
Three-column layout with top-centered numbered tags (01–03) above arrow-tab headers; content boxes beneath each for title and text.
PRO
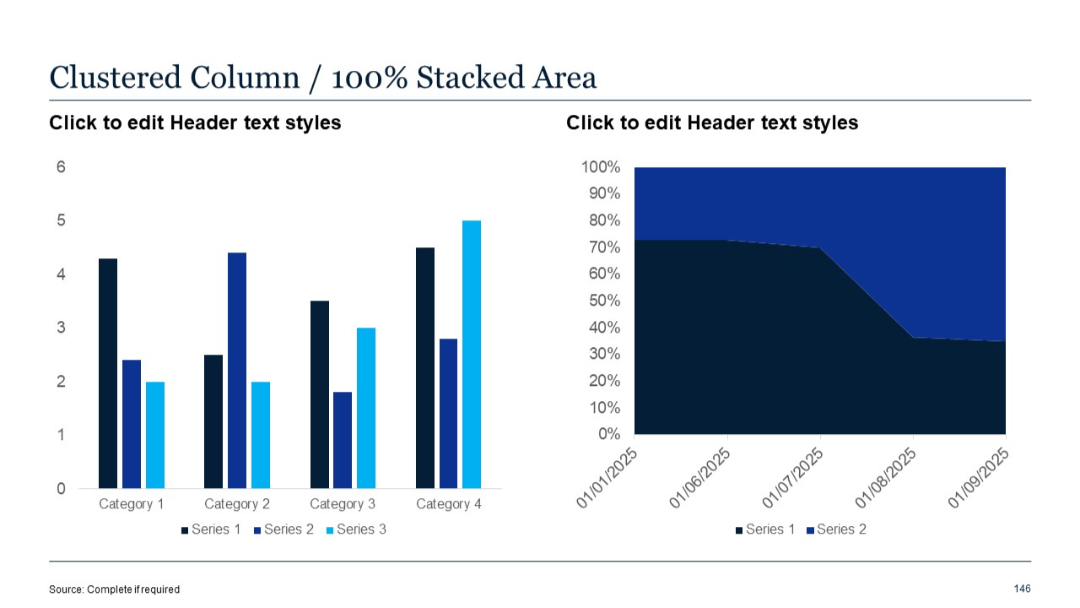
Left shows clustered columns (3 series), right presents a 100% stacked area chart. Vertical comparison on left, proportional timeline on right.
PRO
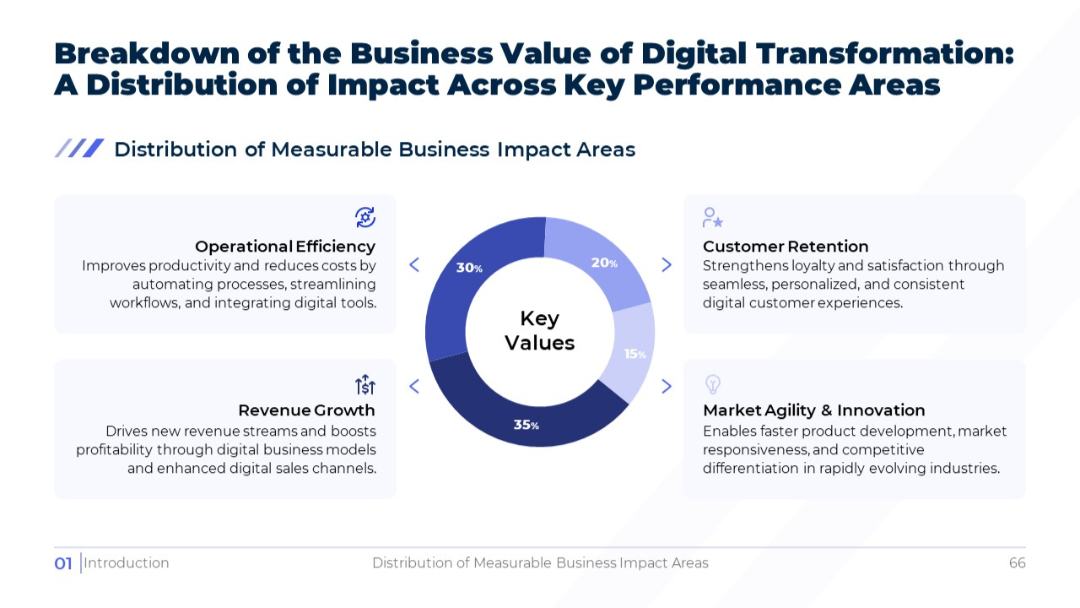
Circular donut chart at the center, with four surrounding labeled boxes explaining each impact area. Bright white background with blue tones.
PRO
Two horizontally aligned bar charts. Left is a regular stacked bar chart, right is 100% stacked bar showing percentage contributions across categories.
PRO
Divider slide with section number "03" and title "Graphic Slides"; bold blue gradient fills the top half, white bottom.

PRO
Four horizontal boxes with numbered tabs in vibrant colors, each aligned in a vertical stack.
PRO
Vertical list with checkmark icons and circle bullets aligned to the left, with line dividers.
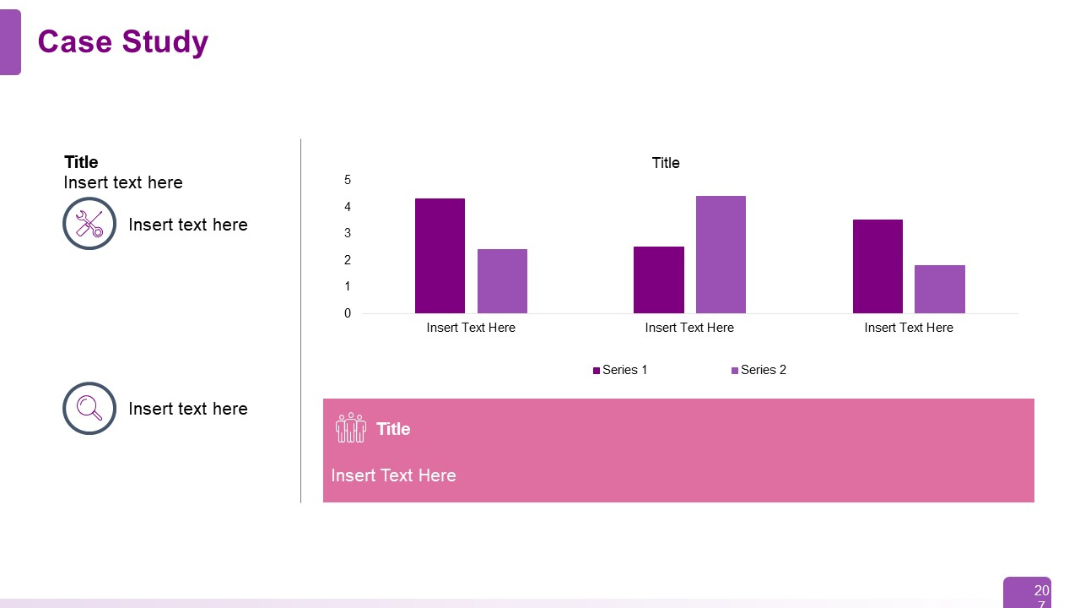
PRO
Split layout with left-side icons and titles, central bar chart (two series), and a lower pink block with an icon and additional content title.
PRO
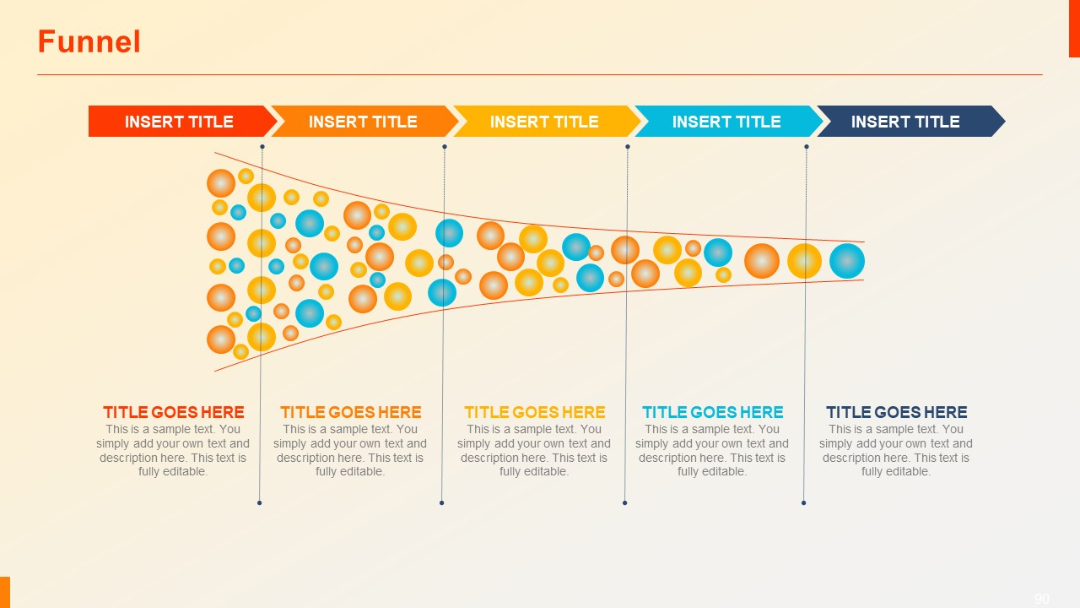
Wide funnel illustration with five sections narrowing from left to right. Filled with colored balls and labeled stages above and below.
PRO
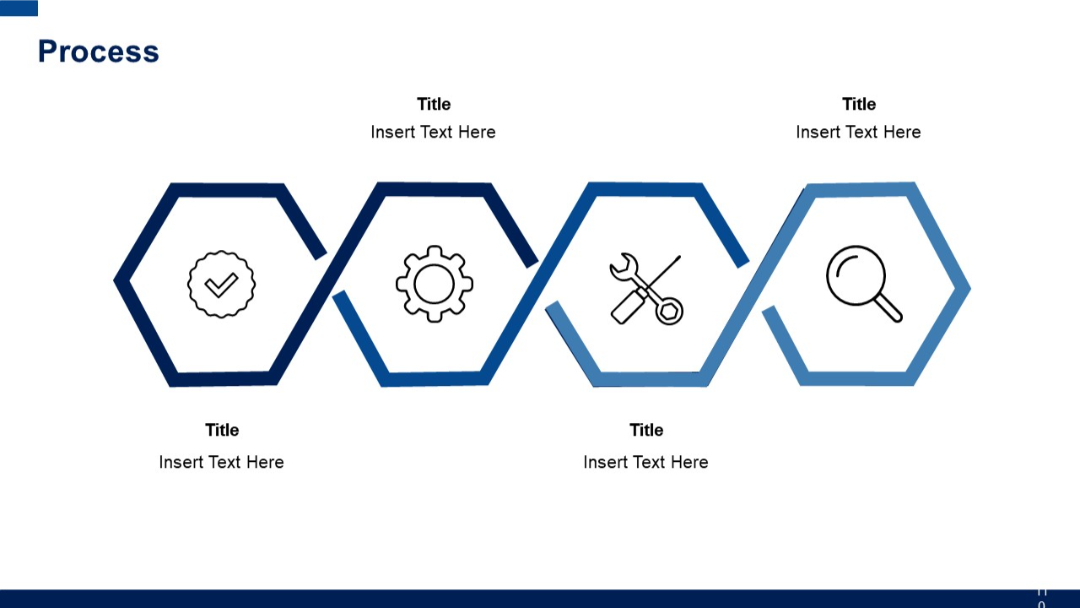
Four hexagonal shapes with icons inside, connected in a zigzag path, each labeled with a title and short text below.
PRO
Three-column format similar to previous slide but with narrower content blocks. Text headers and underlined subheadings above each column.
PRO
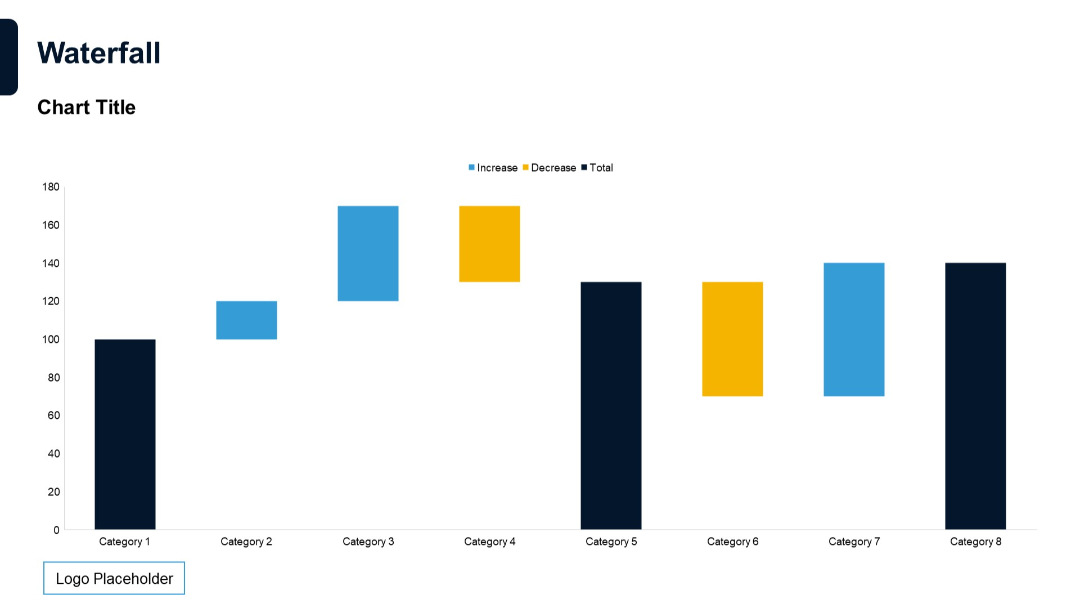
Classic waterfall chart with categories on x-axis and colored bars representing increase, decrease, and total values.
PRO
Vertical list layout with three quote sections. Each has a speaker icon on the left followed by space for text and a thin horizontal line guiding the eye.
PRO
Four large gear icons arranged horizontally. Each gear is a different color and contains a header and description below.
PRO
Dual-column table list format with “Title” and “Slide No.” placeholders. Two tables placed side-by-side, separated by vertical spacing.
PRO
Vertical list with a single thick line and large blue dot at top left; simple rectangular text blocks.
PRO
Same structure as Template 11 but with avatar icons in the photo placeholders, enhancing visual representation of team members.
PRO
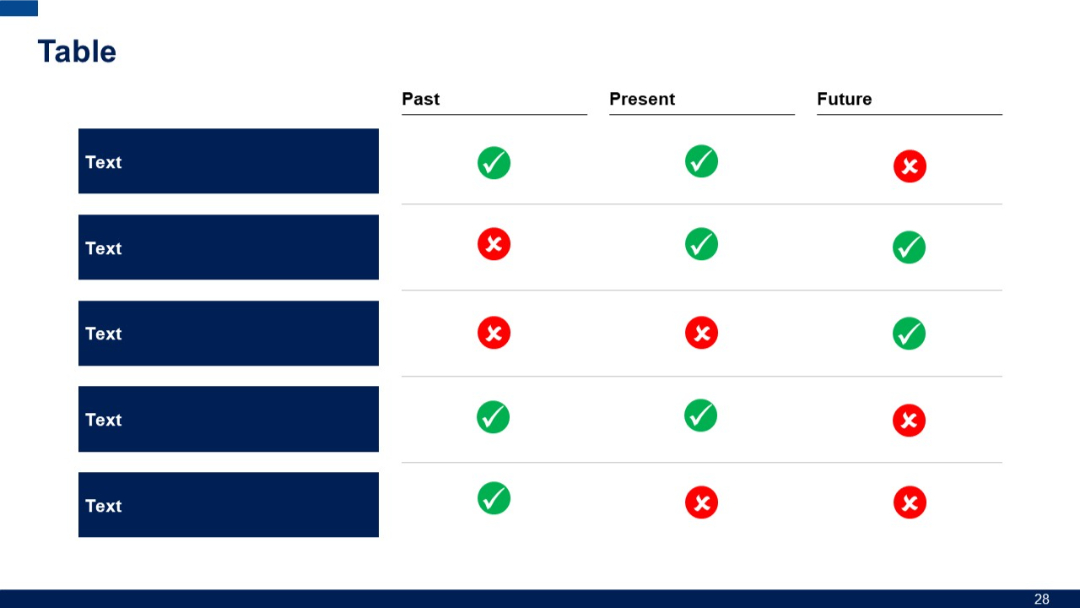
3-column comparison with row headers on the left and top headings labeled "Past", "Present", "Future". Colored check/cross icons used in each cell.
PRO
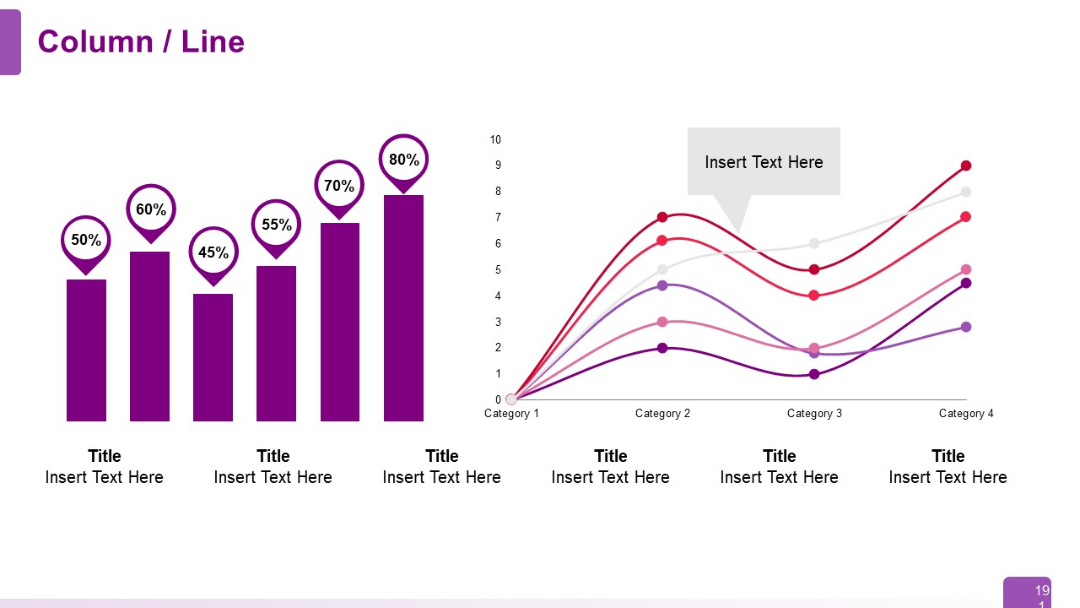
Split layout with vertical column chart (left) and a multi-line graph (right); modern, flat design.
PRO
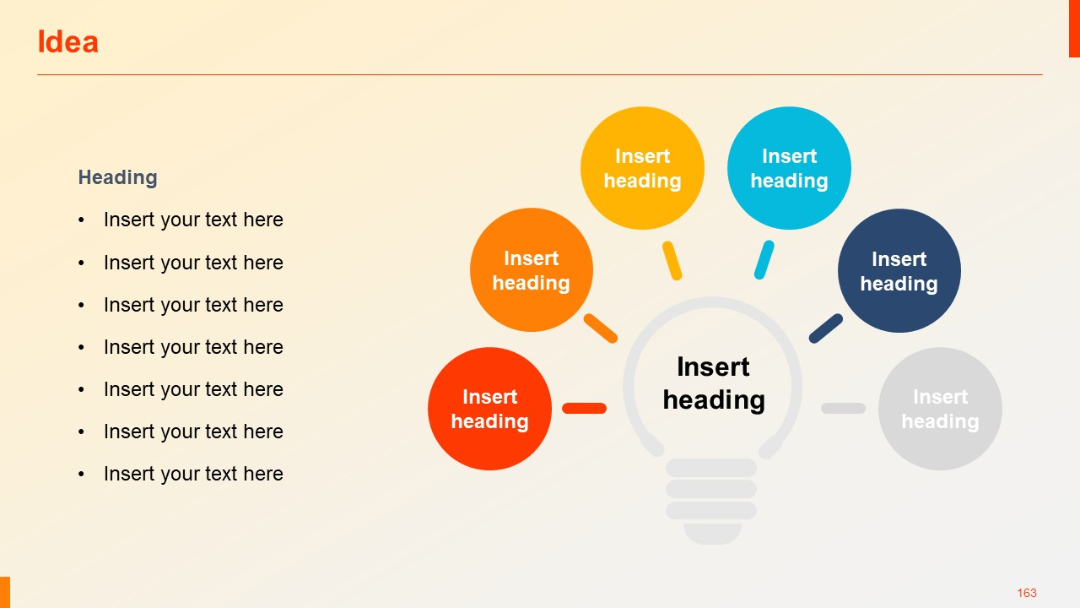
Same layout as 162, now featuring six circles including a faded grey one, suggesting future or optional ideas.
PRO
Horizontal funnel graphic with two input sections (left) and one output section (right), connected via curved lines and icons. Clean, minimal layout.

PRO
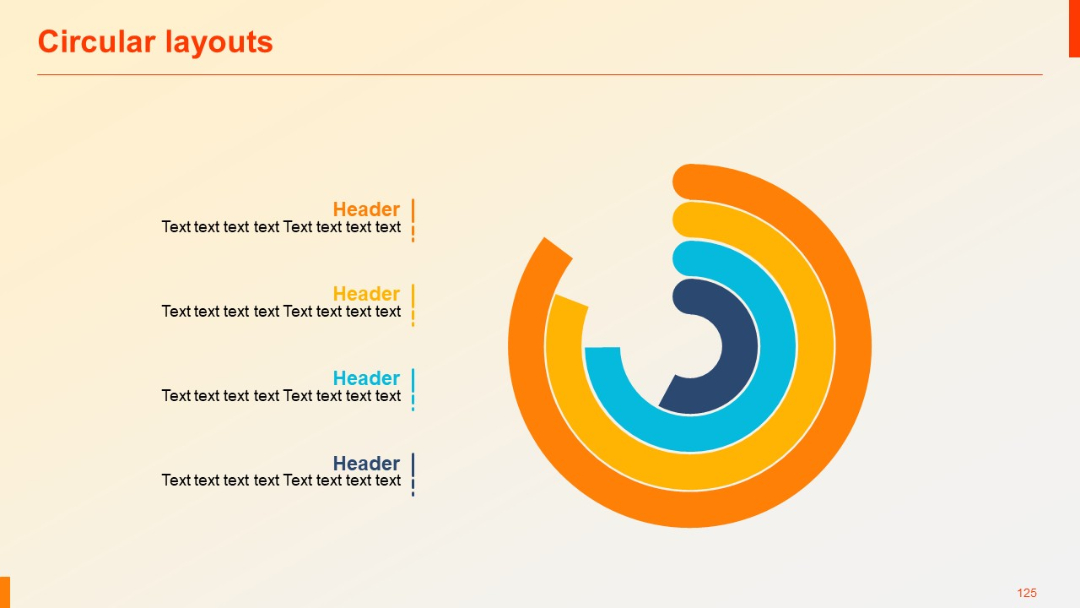
A four-layered radial chart with arc segments in yellow, orange, and blue tones; text headers aligned on the left.
PRO
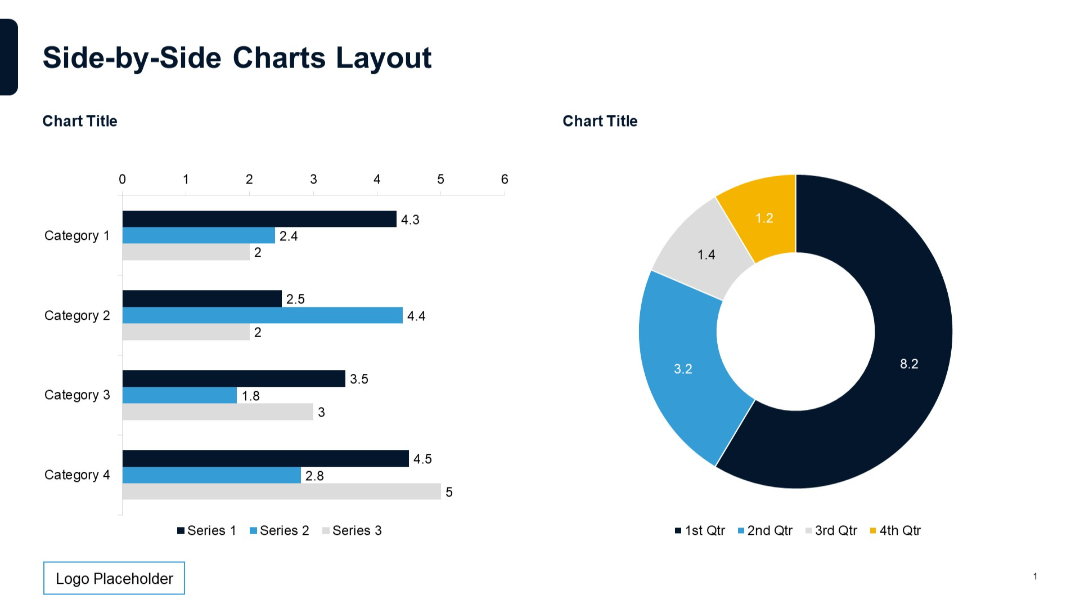
Horizontal bar chart on the left, doughnut chart on the right. Both use the same color scheme and category breakdowns.
PRO
Four-step horizontal layout with numbered circular endpoints and left-aligned text. Each row uses dotted lines with different shades of purple/red.

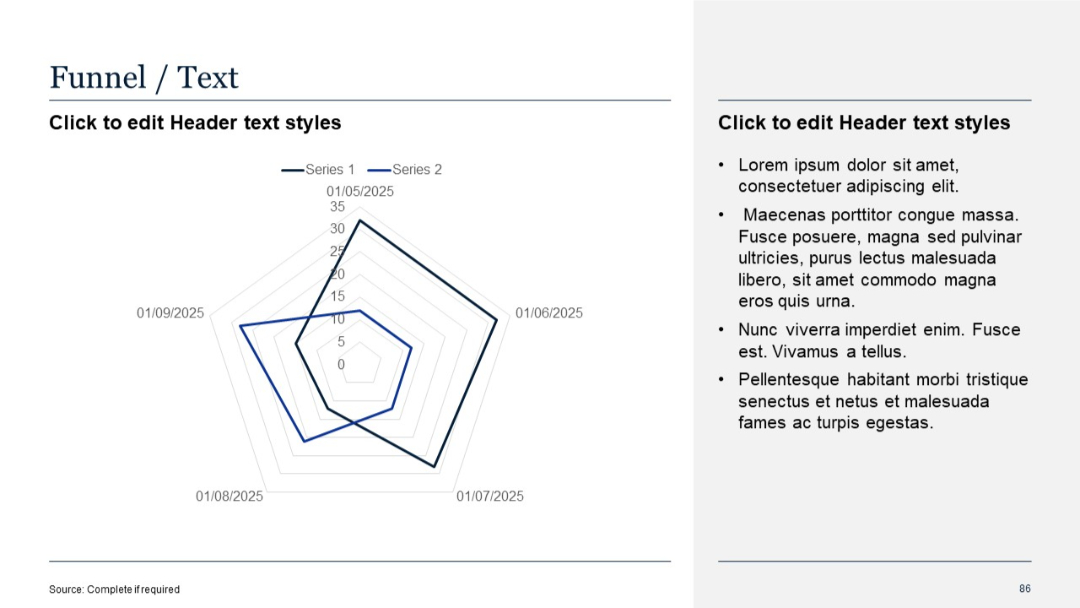
PRO
Radar (spider) chart styled as a funnel; text explanations on the right