PRO
Starburst layout with seven icons and headers positioned around a star. Icons include thumbs-up, computers, globe, and star.

PRO
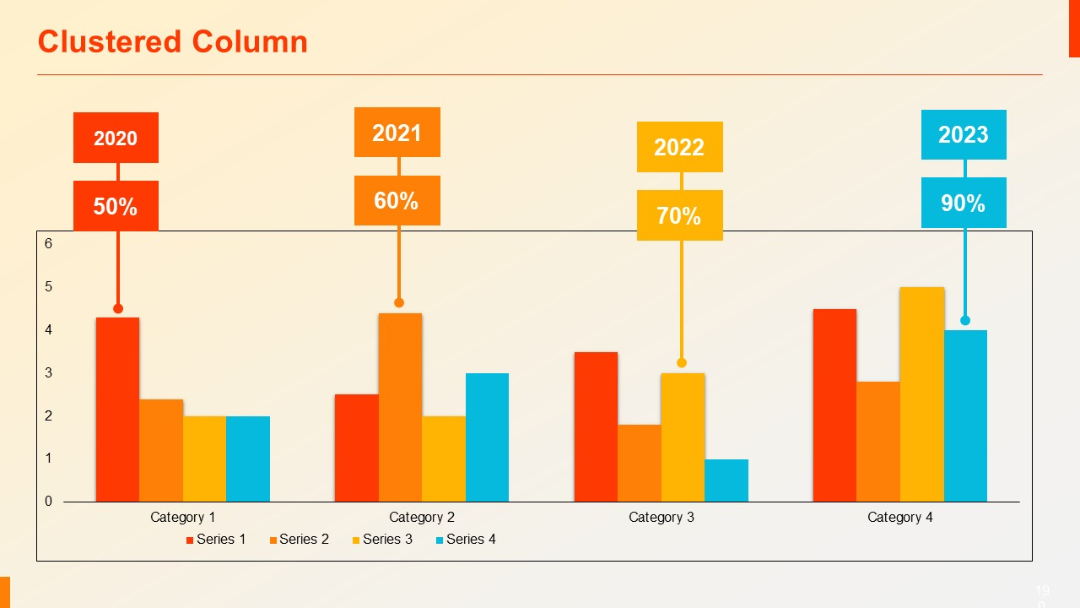
Vertical clustered column chart with year-label callouts (2020–2023) and large percentage annotations above each column group.
PRO
Horizontal stacked purple bars with white circular icons on the left for bullet points. Bold and clean.
PRO
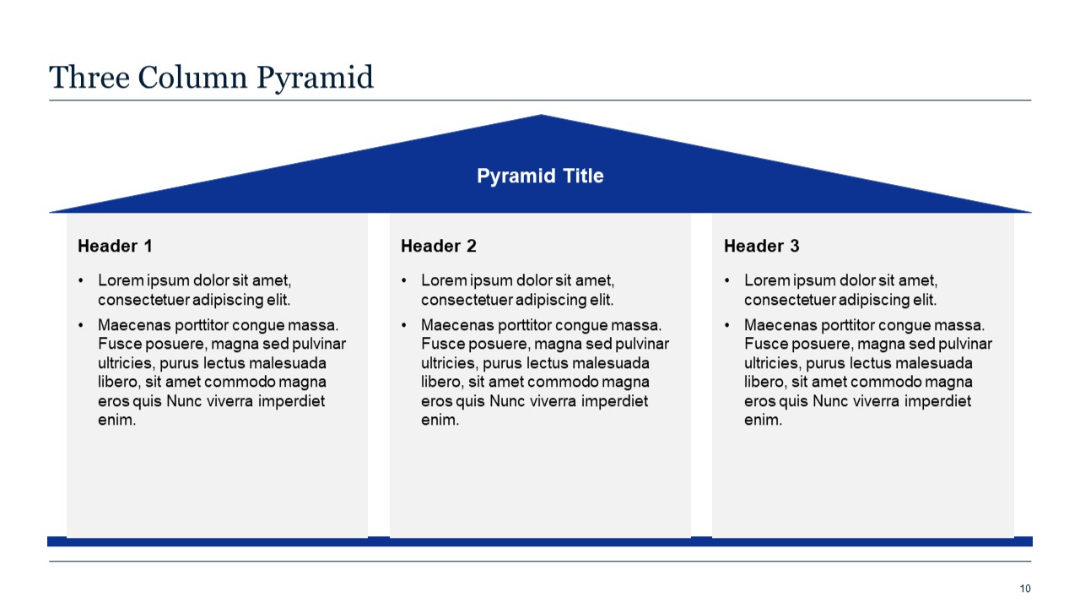
Pyramid-shaped graphic spanning three columns with headers and bullets.
PRO
Four shaded cells stacked vertically on the left, aligned with four rows of horizontal cells to the right, each row having four textual columns.
PRO
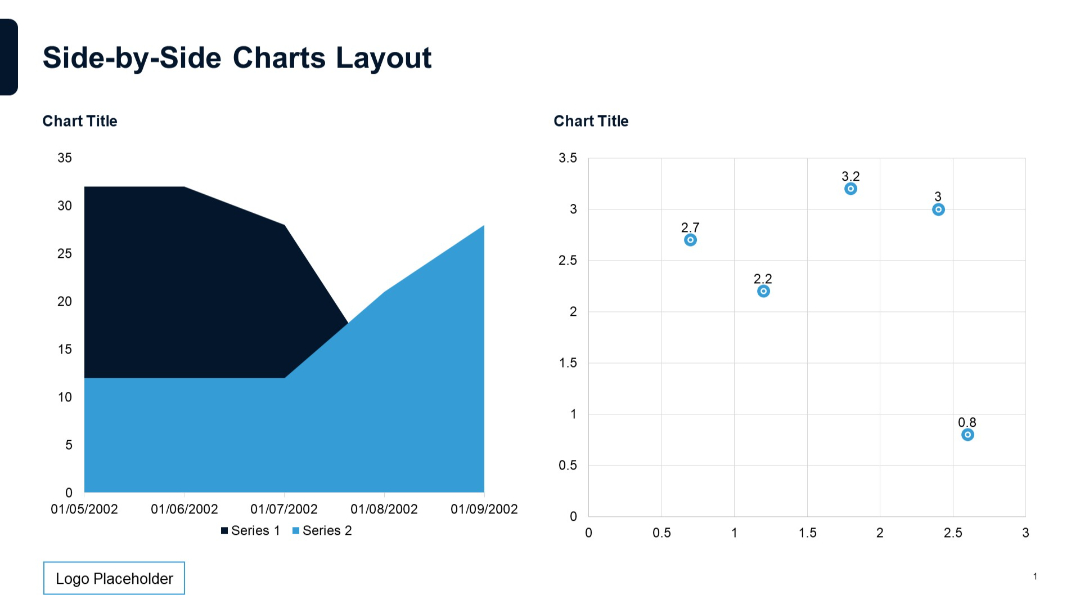
Area chart on the left, scatter plot on the right. Both charts utilize contrasting shapes and color fills for clarity.
PRO
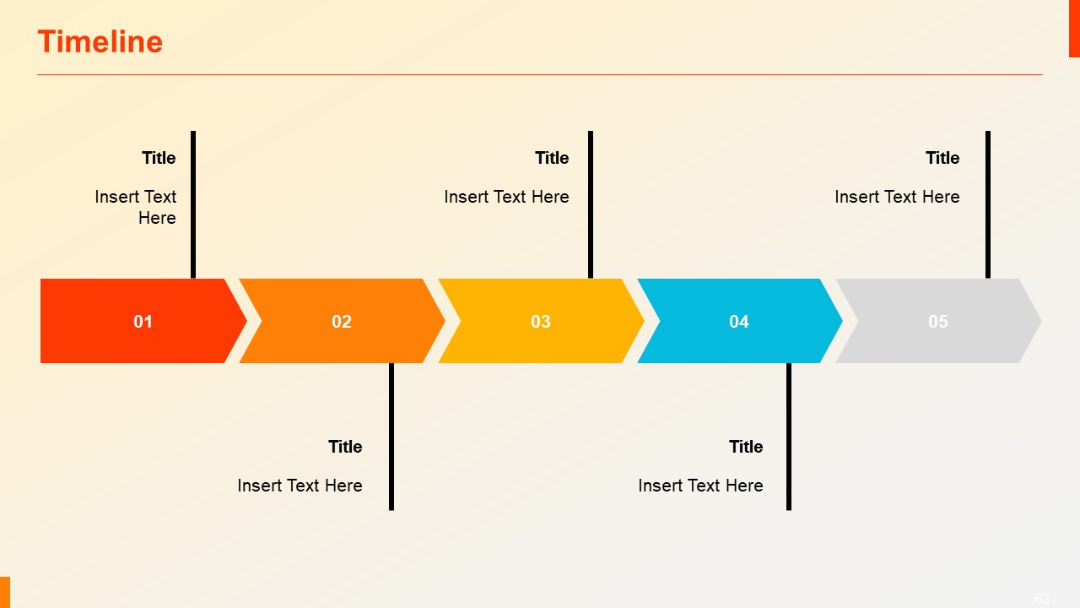
Horizontal arrow-shaped segments connected in sequence, with vertical lines linking to text areas.
PRO
Gear-shaped icons numbered 1–5 aligned vertically with adjacent titles and descriptions. Neutral background.

PRO
Basic line chart over five categories on left; placeholder text on the right.

PRO
Vertical funnel with four layers in descending order. Each section contains an icon and corresponding editable text area on the right.

PRO
Two wide columns with subtitles in bold white on blue, and body text below. Clean separation and balance between the columns.
PRO
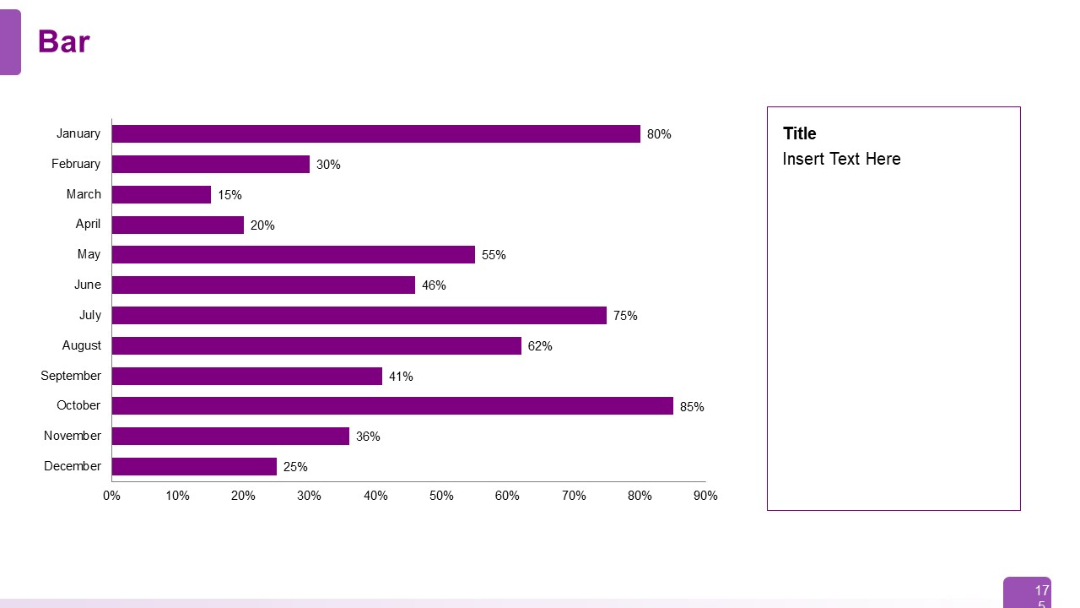
Horizontal bar chart showing monthly data from January to December. Text box area on the right for insights. Bars are labeled with percentage values.
PRO
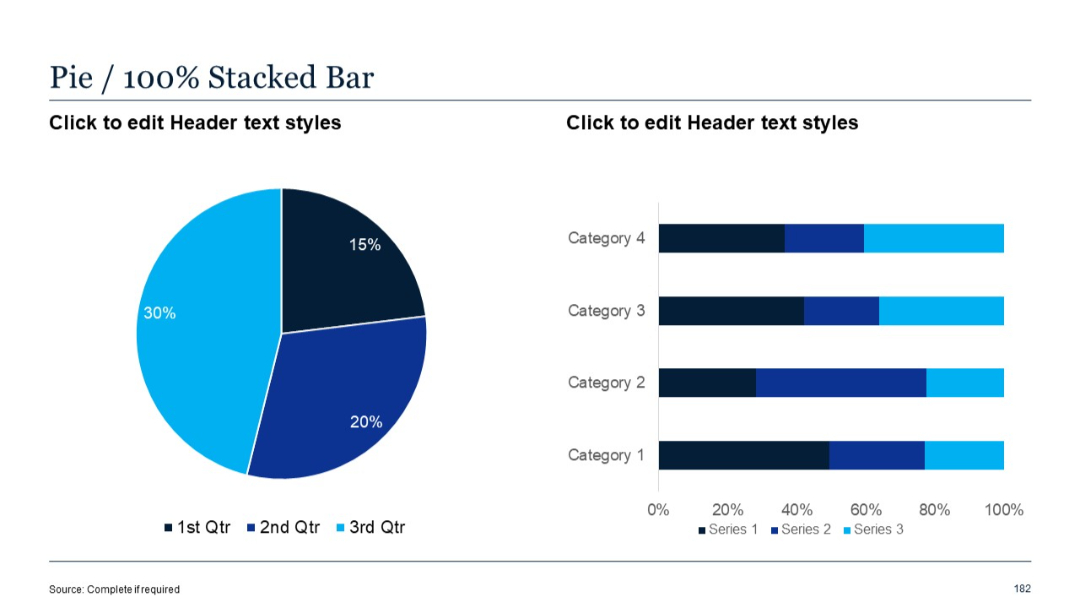
Similar layout to slide 181, but right side uses 100% stacked bar chart for percentage distribution, while left side retains the same pie chart.
PRO
Two-row, five-column table; first column has bold purple boxes for row titles; other columns are text fields. Clean, structured layout.
PRO
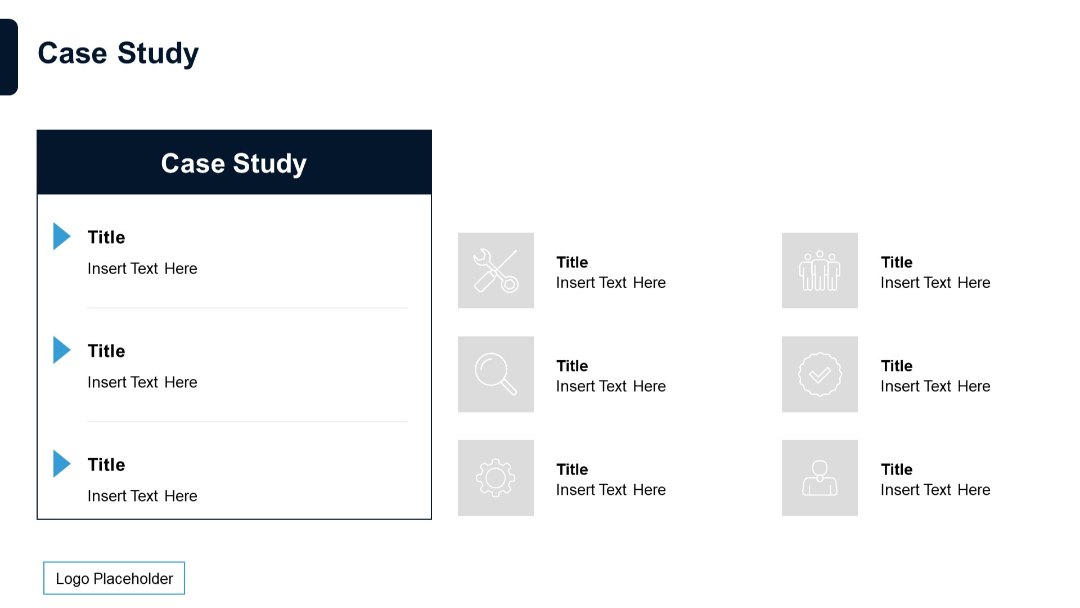
Left-aligned vertical content list with blue arrows, paired with faded icon-labeled blocks on the right.
PRO
Horizontal bar chart with four categories; single data series; minimalist layout.

PRO
Four-column layout with bold colored headers for each SWOT component (Strength, Weakness, Opportunity, Threat). Minimalist white background.
PRO
Two large hexagons side by side with icons and text. Light green left, dark green right. Separated by a vertical divider.
PRO
Zigzag timeline with circular steps connected by vertical and horizontal lines and text next to each step.
PRO
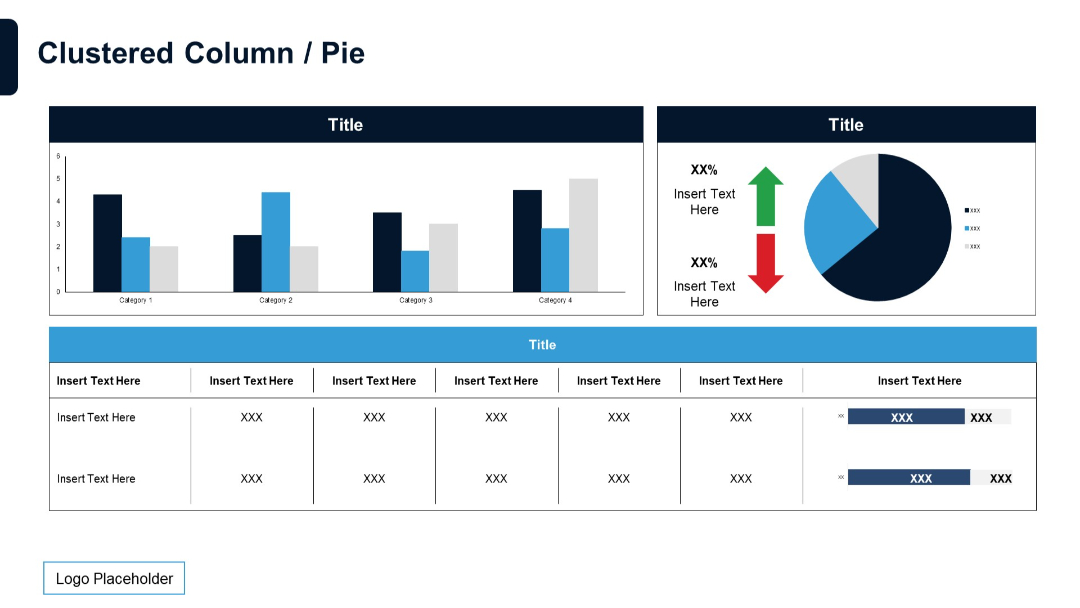
Combination of clustered column chart and pie chart in the upper section. Lower part shows a data table with bar charts embedded.
PRO
Left sidebar in dark blue with vertical title text; three horizontal content boxes to the right with arrows pointing from title to text.
PRO
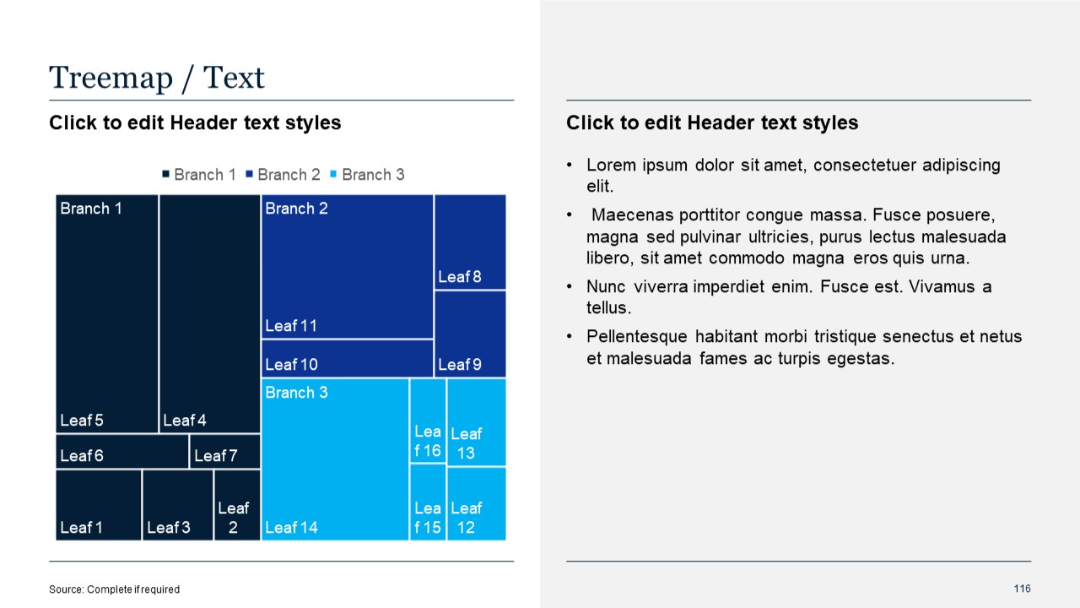
Treemap chart on left with hierarchical blocks; text placeholder on right side in standard format.
PRO
Simple title slide with large section number "03" and title "Graphic Slides" over a green gradient background.

PRO
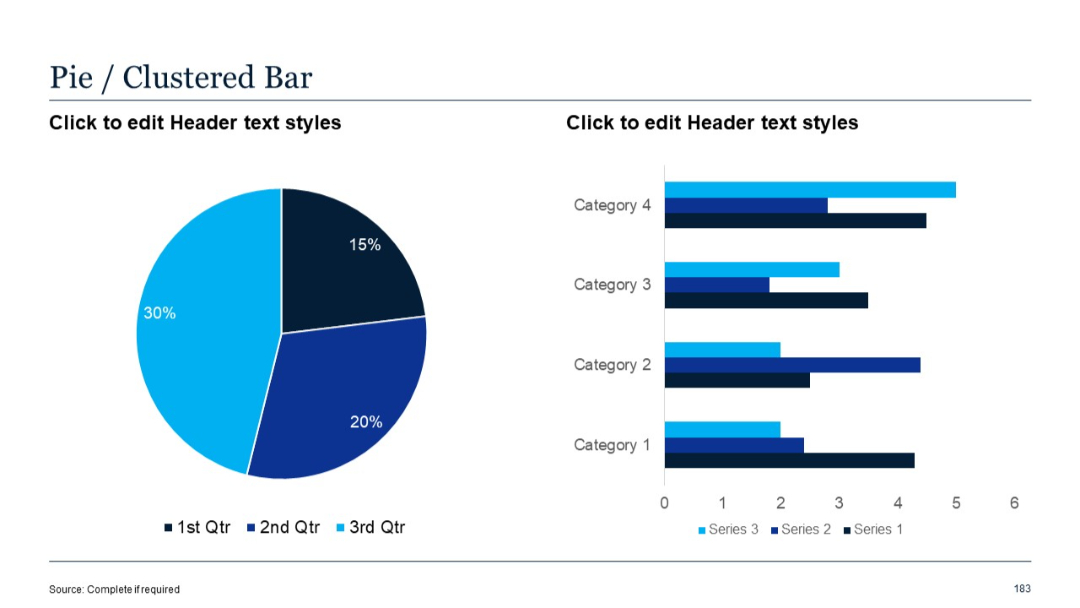
Left pane contains pie chart; right side displays clustered bar chart with three data series per category, aligned side-by-side.
PRO
Six purple rectangular blocks in a 3x2 grid with white placeholder text centered within each box. Uniform size and layout.
PRO
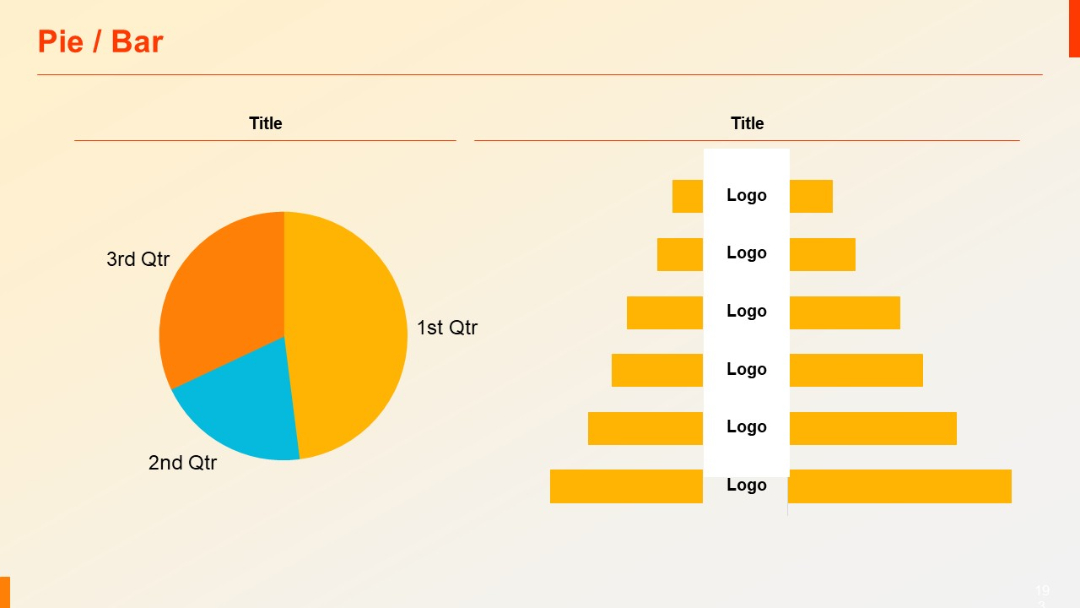
Left side features a pie chart, right side has a bar layout with logo placeholders; clean separation.
PRO
Split layout with a green gradient upper half and white bottom half. Minimalistic and number-labeled.

PRO
A radial layout with a central circle surrounded by six horizontally aligned rectangular blocks, three on each side, each colored and labeled with placeholder text.
PRO
Centralized network of six icons in a hexagonal pattern, fully interconnected. Right panel maintains bullet format with dark blue header.
PRO
Visual builds to seven total circles, maintaining same lightbulb layout with left-side bullet list.