PRO
Four-column layout repeated across three segments; each section contains title, text, and slide number.

PRO
Slide divided into two parts: left side with vertical step list, right with six small icons and titles; uses contrasting blue tones for clarity.
PRO
Split layout with two columns of numbered lists (01–04) in dark boxes followed by a blue-highlighted horizontal block and an icon section below.
PRO
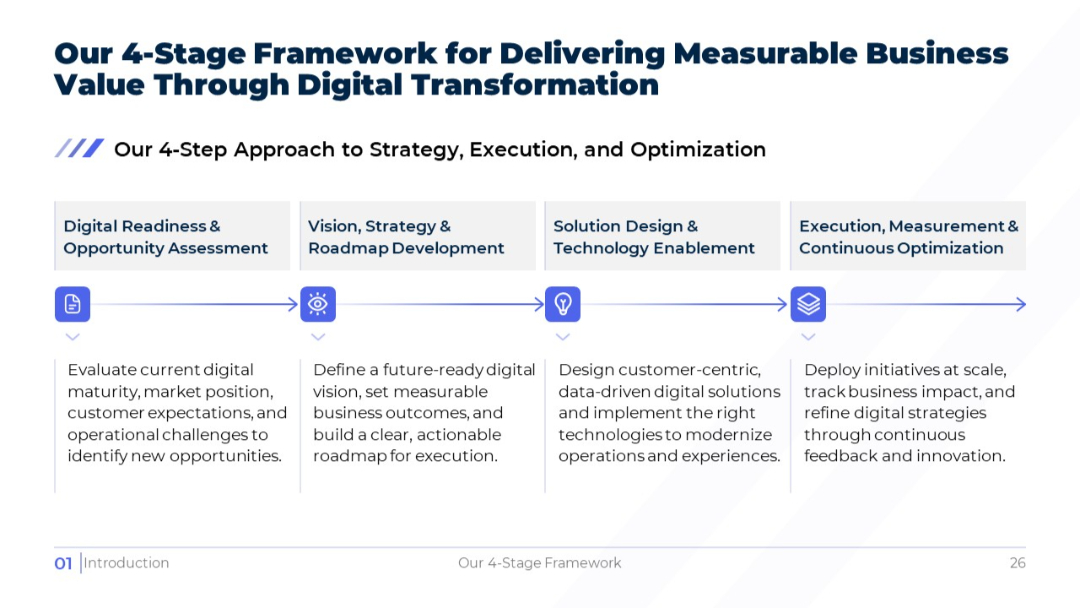
Light version of the prior slide with four horizontal stages, each with icon and description beneath.
PRO
Title slide with dark background, bold “Case Study” label, and a horizontal line ending in a circle for visual effect.

PRO
A comparison table with a left-aligned title row and multiple columns, each with check marks and crosses. Color-coded columns and a placeholder for logo.

PRO
Dark-themed title slide with "Graphic Slides" in bold text. A single horizontal line with a white circle and arrow dot motif pointing right. Bottom-left logo. Minimalist layout.

PRO
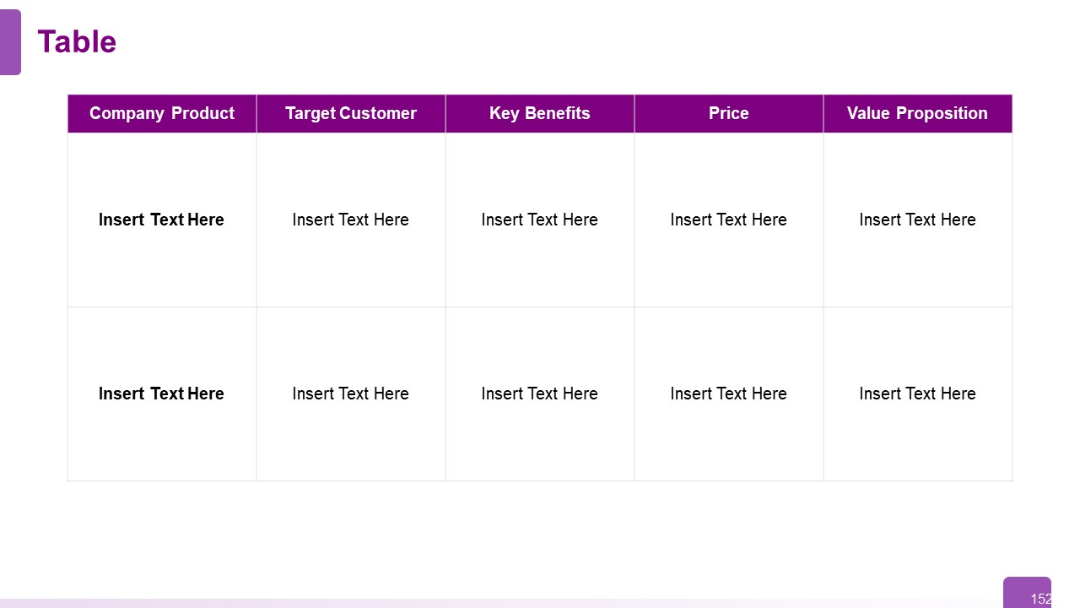
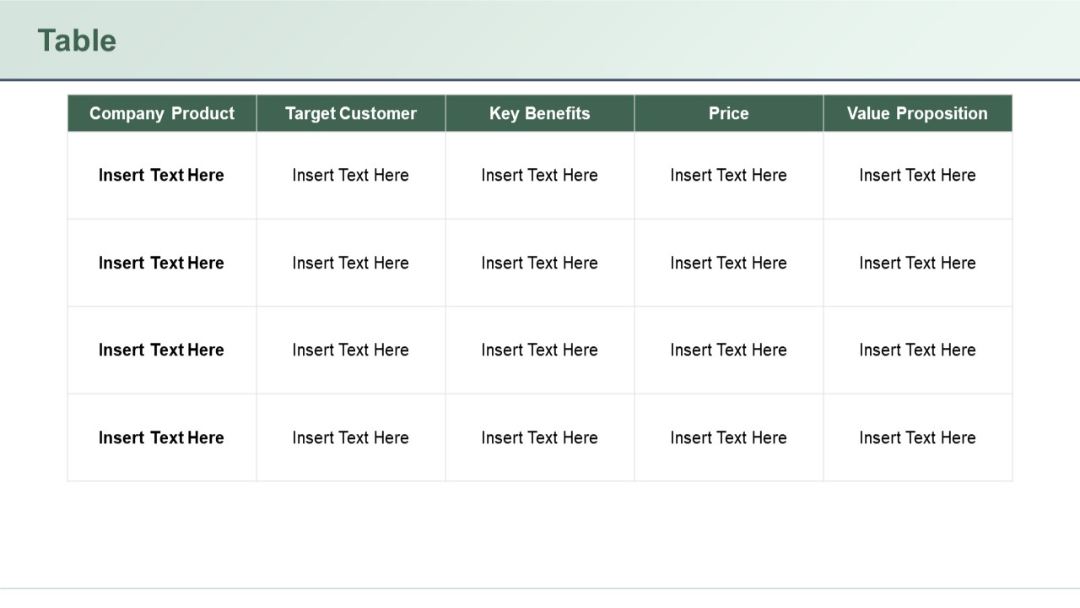
Horizontal table with six columns and two rows; bold headers in purple; placeholders for company, product, target customer, benefits, price, and value.
PRO
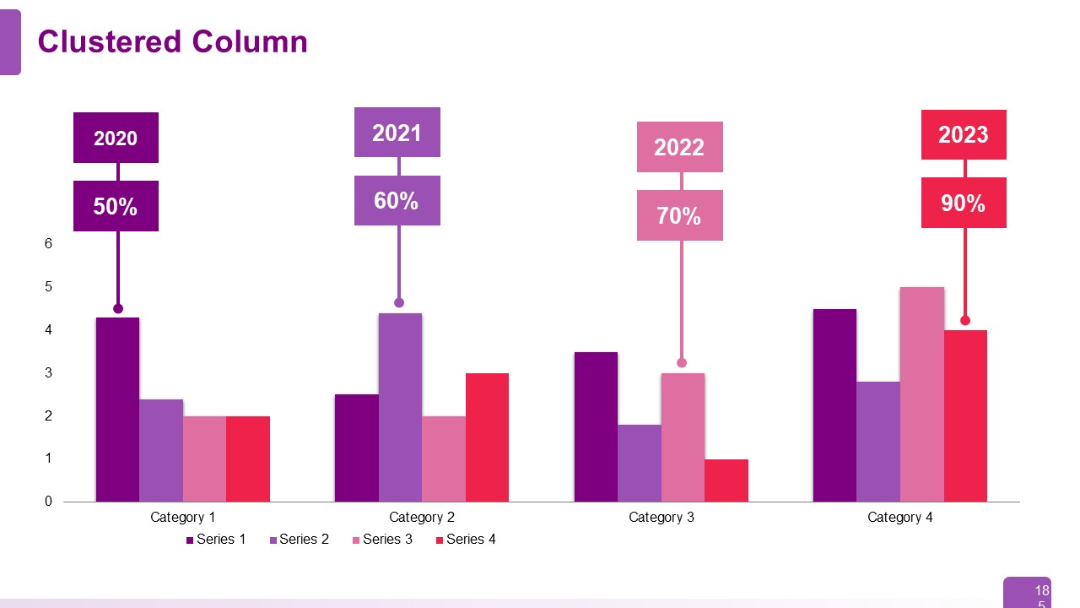
Clustered column chart with labels above each category indicating year (2020–2023) and percentage values. Multi-series with four color bands.
PRO
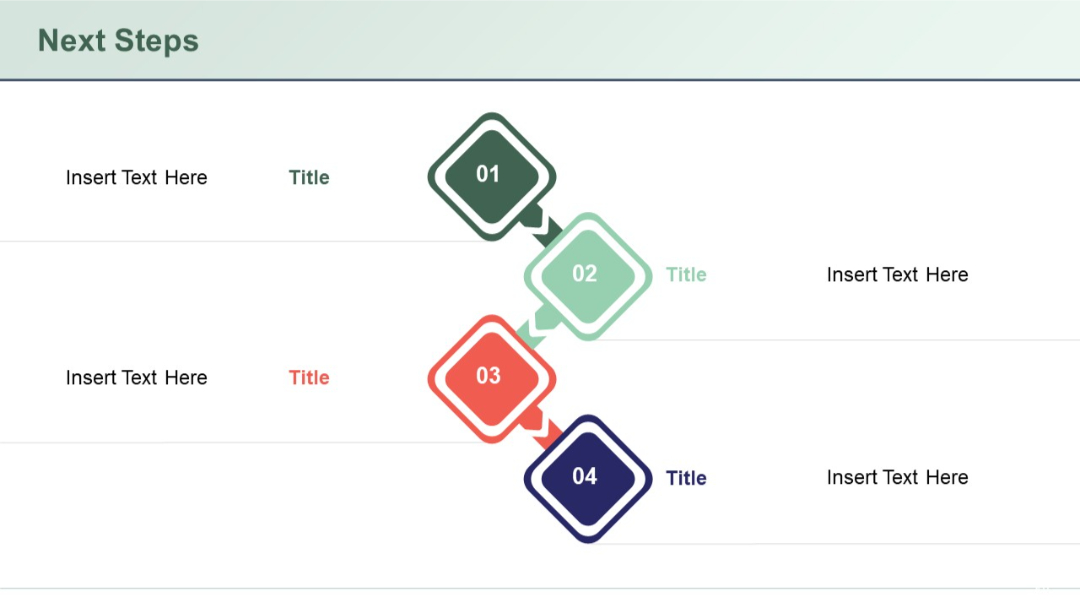
Zigzag arrow flow with four diamond-shaped step indicators numbered 01–04, flanked by title and placeholder text.
PRO
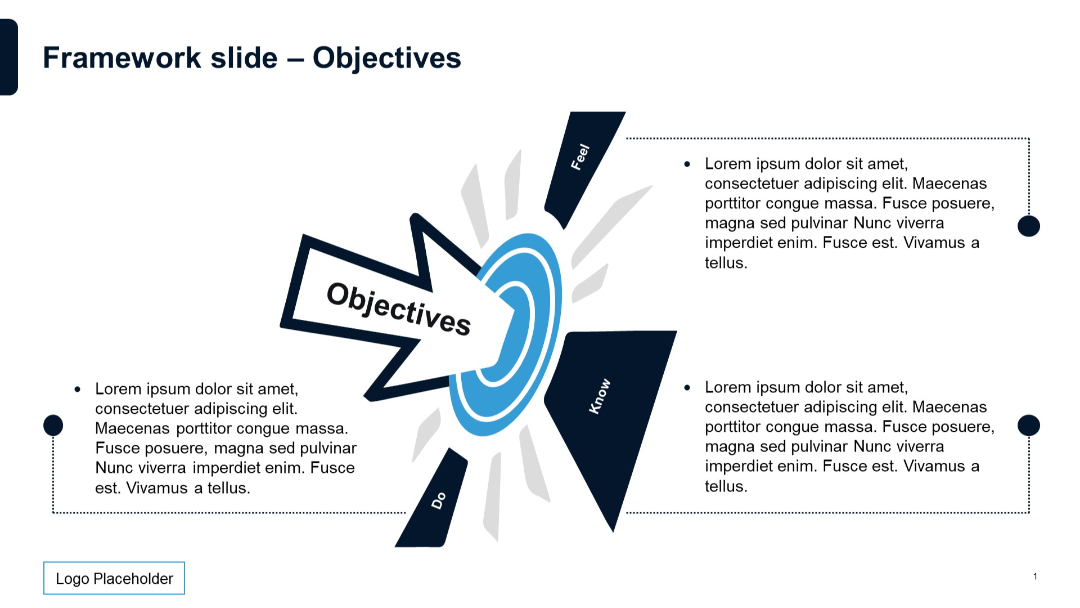
Central target icon with arrow and “Objectives” text; surrounding labeled points with descriptions.
PRO
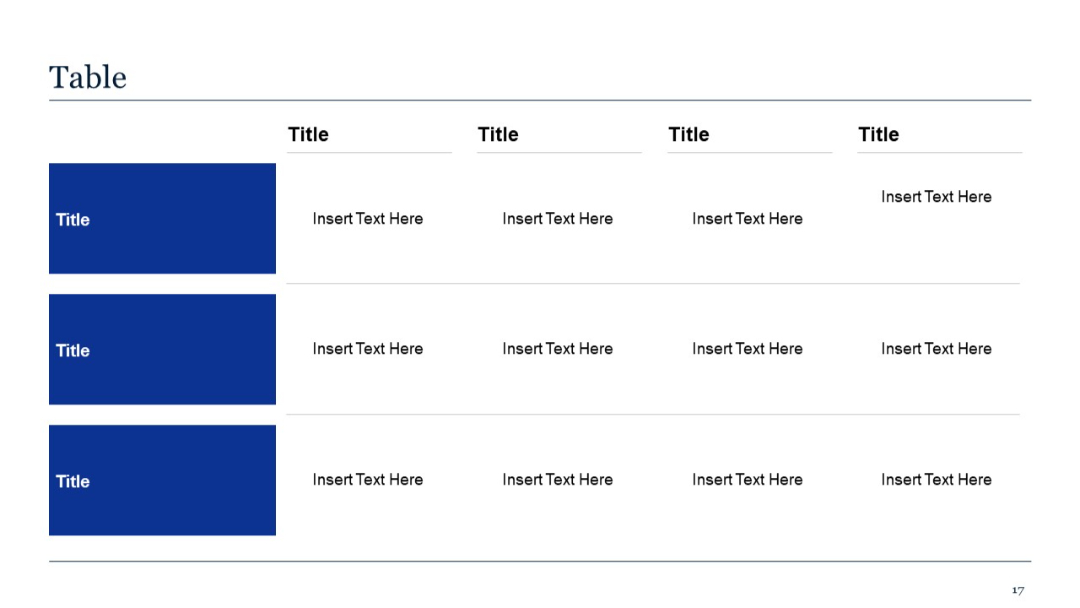
Expanded table format with three rows and four columns. Consistent with slide 16 but offers more data points.
PRO
Extended version of the previous slide (93), with 4 rows and 5 columns. Repeated layout with identical formatting.
PRO
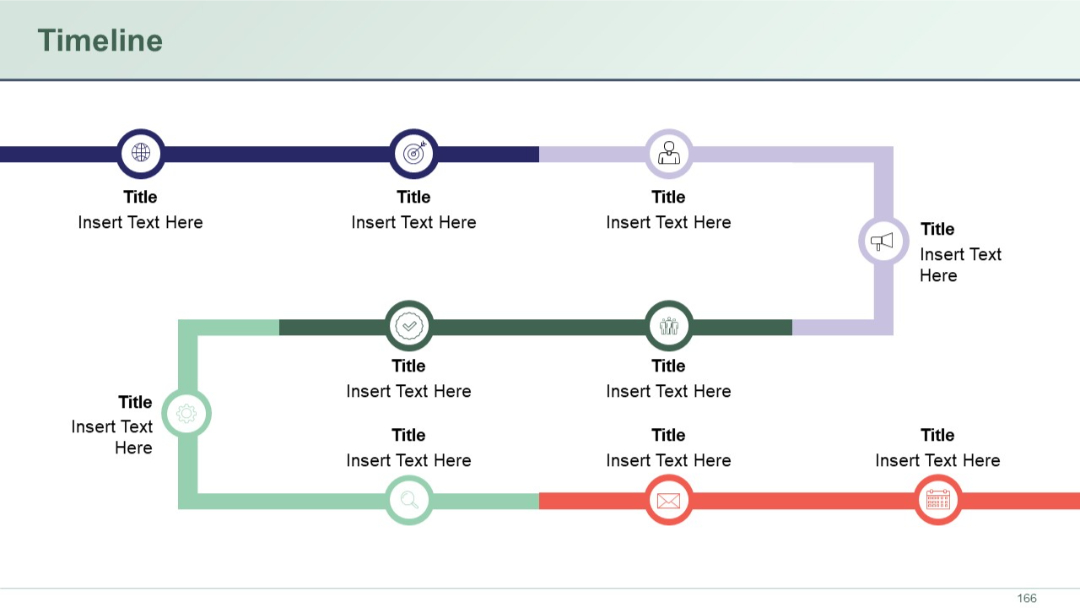
Two-tier timeline with icons and circular nodes, connected by straight colored lines. Top tier (blue-purple), bottom tier (green-red).
PRO
4 blocks on top, 4 below; visually consistent with previous slides; blue and white theme; icons and text-balanced.

PRO
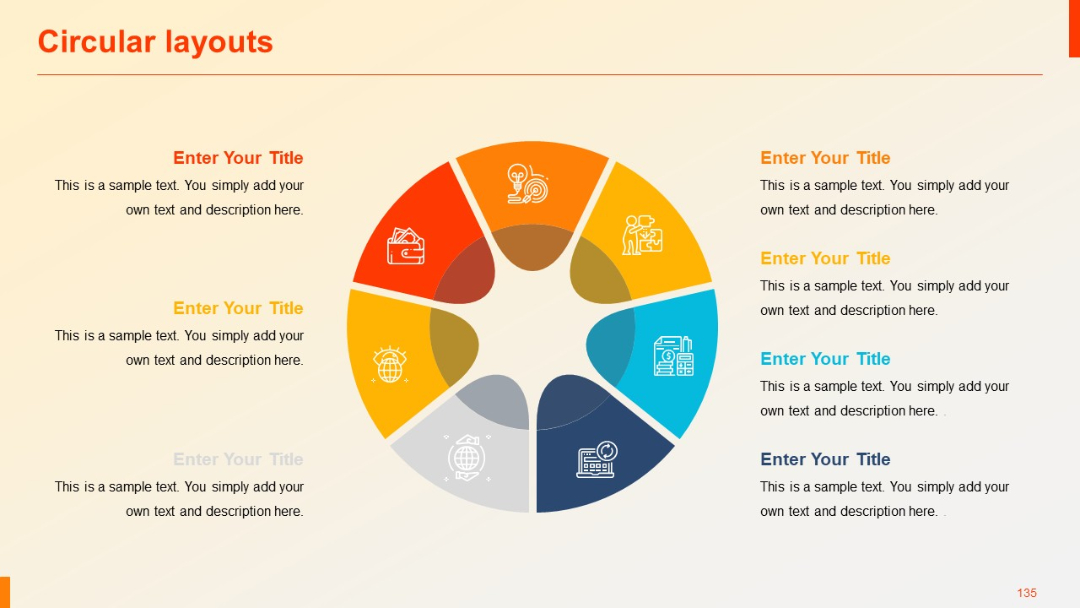
Eight-part pie-style radial diagram with segment-specific icons and mirrored text placement on both sides.
PRO
Slide is divided into three vertical sections, each with a heading and bulleted list. Some use of alternating header colors for separation.

PRO
White background with evenly spaced purple outline icons, all magnifying glass or research-related graphics arranged in a clean 4x6 grid.
PRO
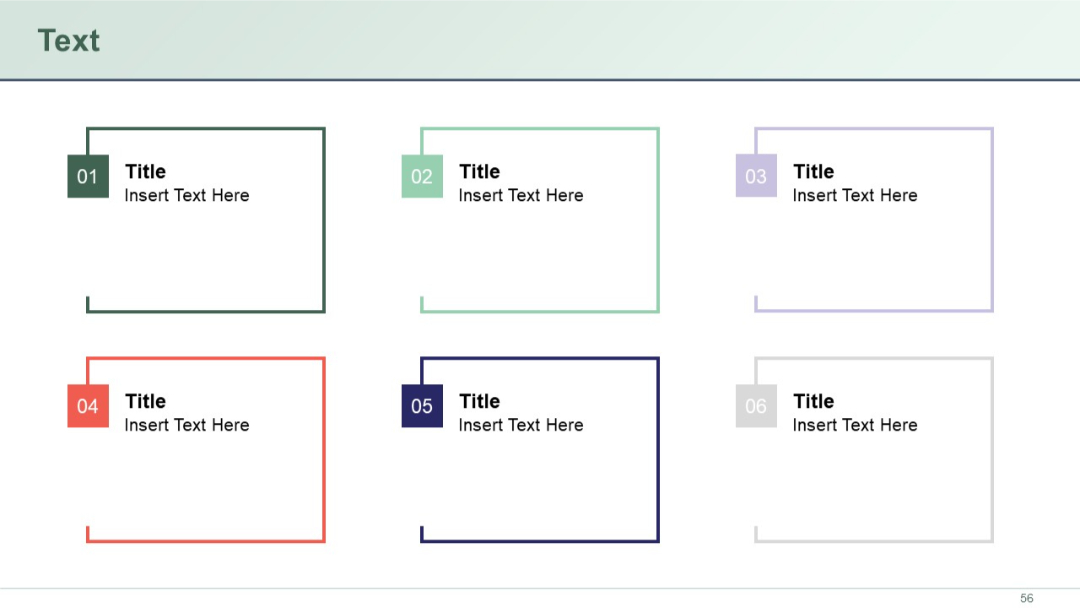
Grid layout of six square boxes with numbered tabs at the top-left of each. Each box contains a bolded title and placeholder description.
PRO
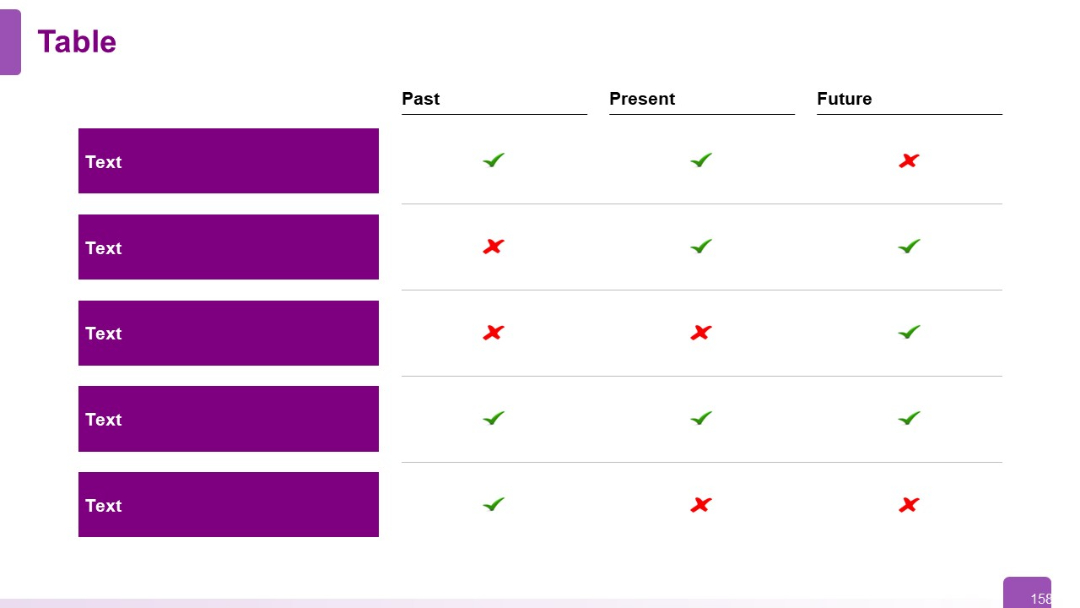
Past-Present-Future layout across three columns; rows represent different topics. Visual check/cross marks indicate status over time.
PRO
Minimalist section divider slide with a large number "01" in blue and the section title in bold black below it. Diagonal striped design elements on the top right add a subtle visual accent.

PRO
Two-column layout: left side has title and text in three stacked segments; right has illustration of checklist and pen.

PRO
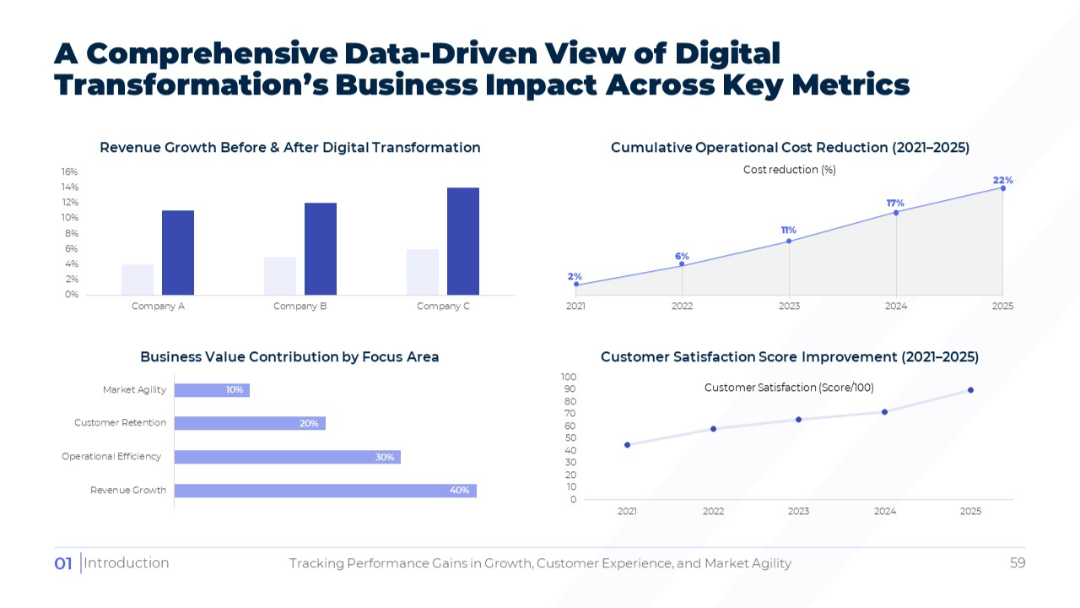
Four charts (bar, area, horizontal bar, and line) measuring revenue growth, cost reduction, value contribution, and customer satisfaction over time.
PRO
A four-quadrant pie chart numbered 01–04 with color-coded sections and matching editable text around the circle.

PRO
Stair-step style layout with four L-shaped segments in ascending order from left to right, each labeled with title and editable text.

PRO
Four vertical step-like bars in red with ascending heights, overlaid with percentage labels. Icon and text box to the right.

PRO
Light background with centered title, circular expert portraits, and brief bios underneath.

PRO
Horizontal clustered bar chart showing side-by-side comparison of three series per category. Each series in different colors.

PRO
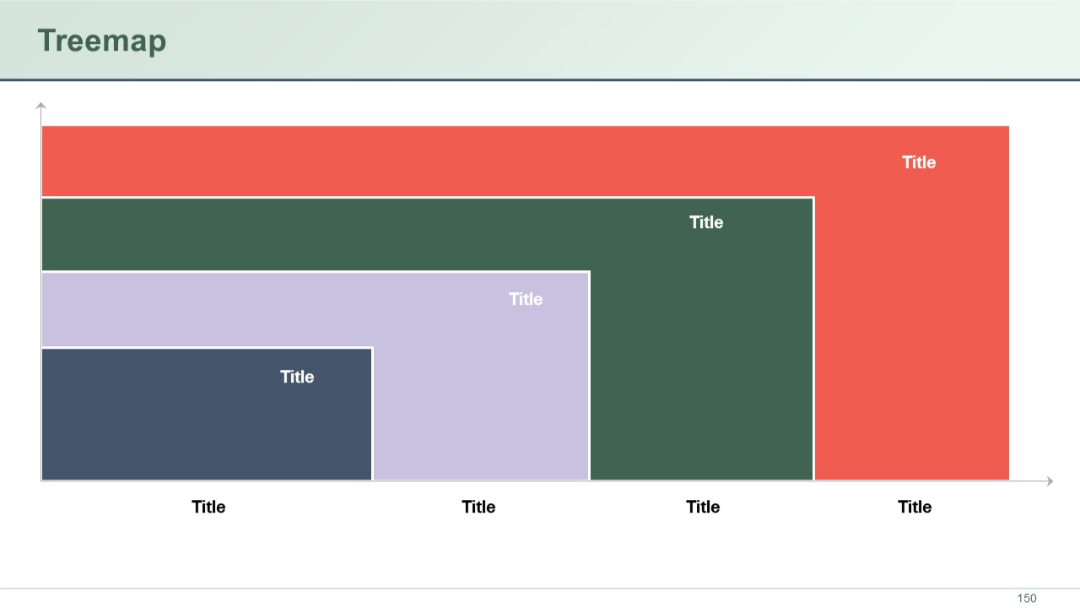
A treemap chart made of nested rectangles with different colors and sizes. Each block has a placeholder title and represents hierarchical data visually.
PRO
Vertical bar chart; categories on X-axis; bullet text on right; series comparison.


