PRO
Dark navy background with a central white line ending in a circle; bold section title at bottom left with logo.

PRO
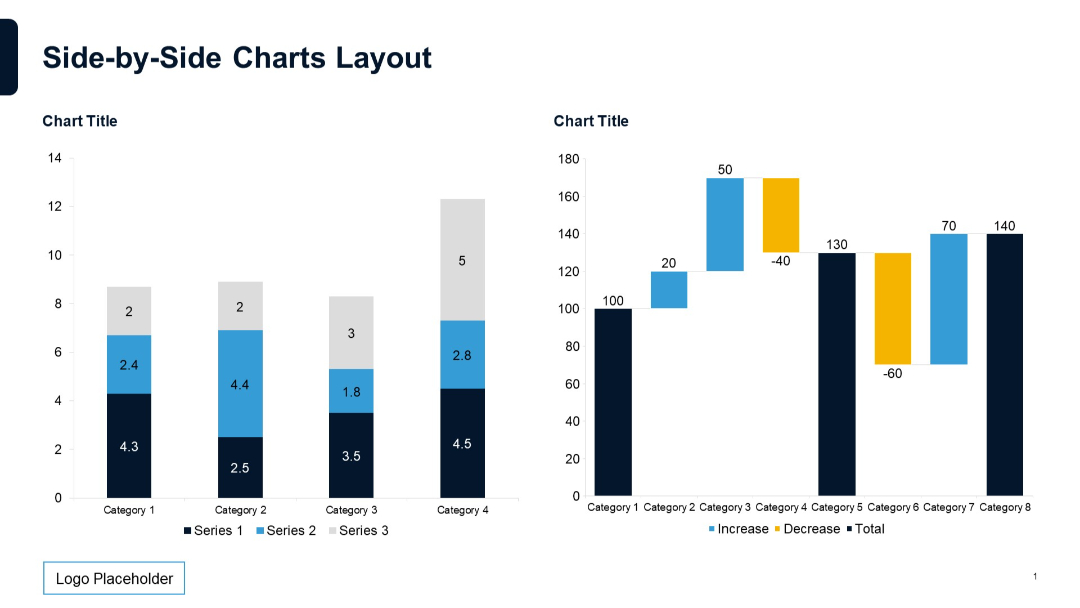
Stacked bar chart on left, waterfall chart on right. Clean division of chart types with equal spacing.
PRO
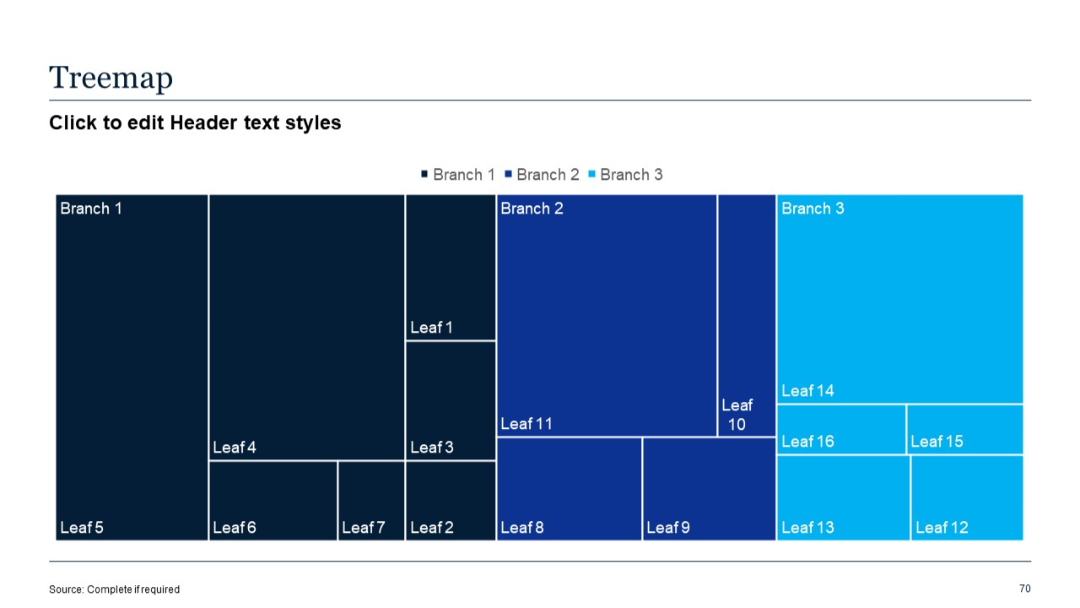
Treemap visualization with nested rectangles representing hierarchical data across three branches.
PRO
Left side features a large calendar icon; right side displays a standard 7-column (Sun–Sat) by 6-row grid calendar with placeholder text "XX".

PRO
Vertical timeline layout with five entries on the left side; each step has a numbered circle connected by a gradient line and includes a title.
PRO
White background with a dark purple header bar and large centered text box bordered with rounded edges; quote icons on upper-left and lower-right of the quote box.
PRO
Bold horizontal bars in red-orange connected to circular icons. List of five items in a stacked vertical layout.
PRO
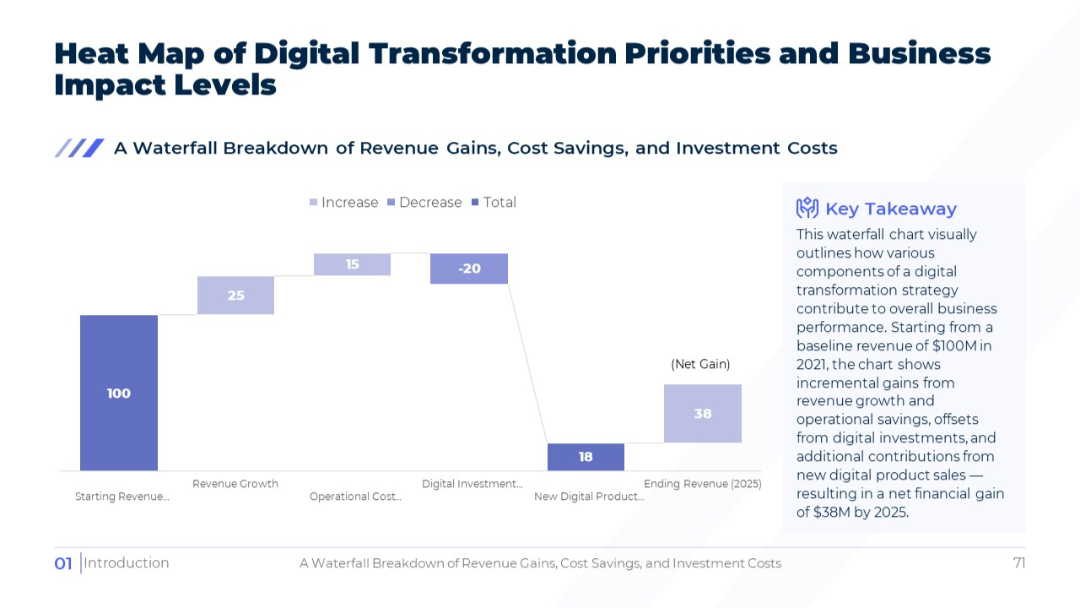
A structured waterfall chart with labeled bars showing financial changes. Right-aligned textbox for key takeaway.
PRO
A vibrant semi-circle segmented into 7 parts, each with icons and placeholder texts. Segments span purple to grey.
PRO
Icons arranged in rows depicting clocks, calendars, stopwatches, timers, and watches, all using simple, outline-based design.
PRO
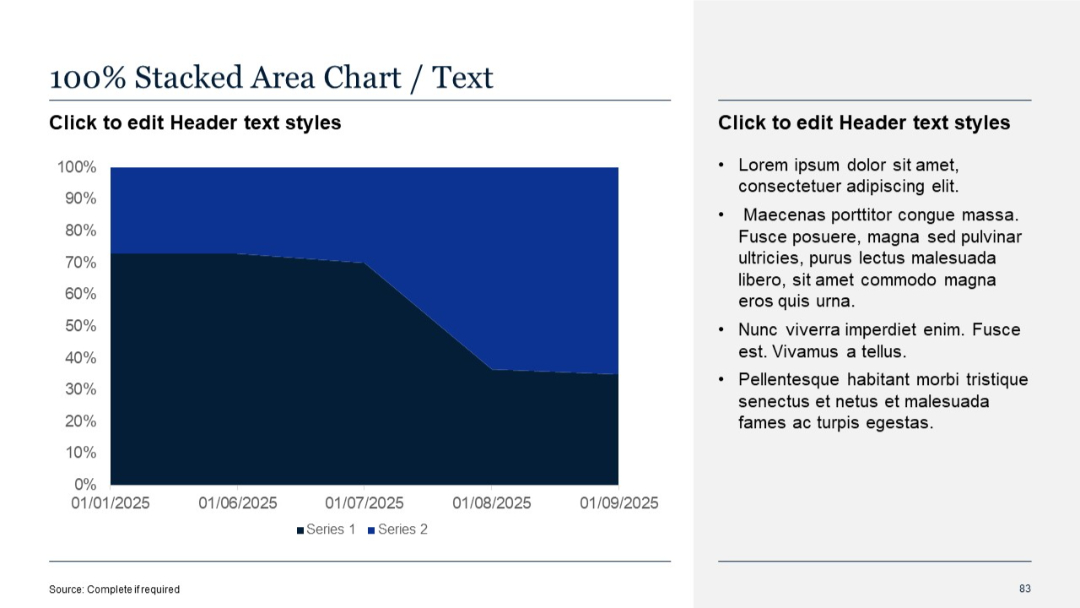
Same two-column structure with 100% stacked area chart on the left and placeholder text on the right
PRO
Split-screen layout with text points on left, large "2x" stat on right; modern, clean design with white and blue backgrounds.

PRO
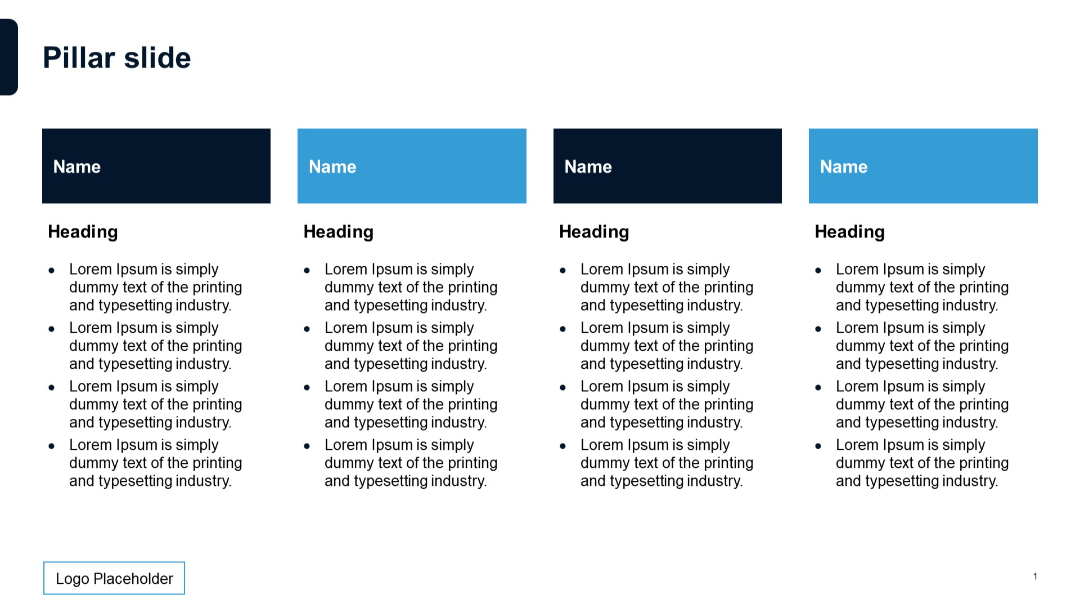
Four evenly spaced blocks with titles, headings, and detailed bullet points; alternating dark blue and light blue headers.
PRO
A structured array of time-related icons including clocks, calendars, timers, and watches, all styled in purple outlines.

PRO
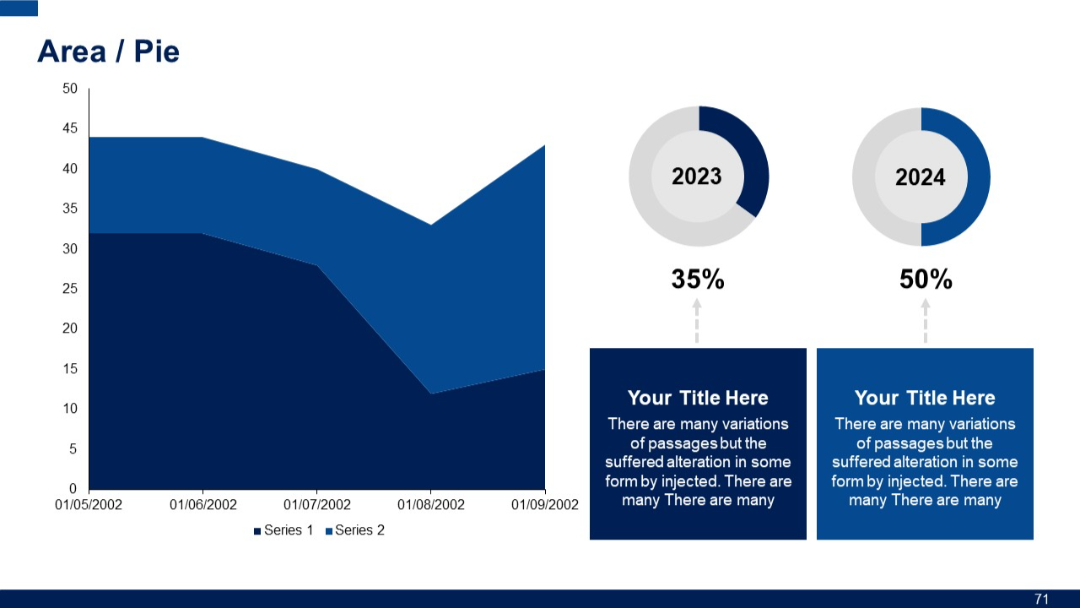
Split layout with an area chart on the left and two donut pie charts on the right. Includes captions below the charts with placeholder text.
PRO
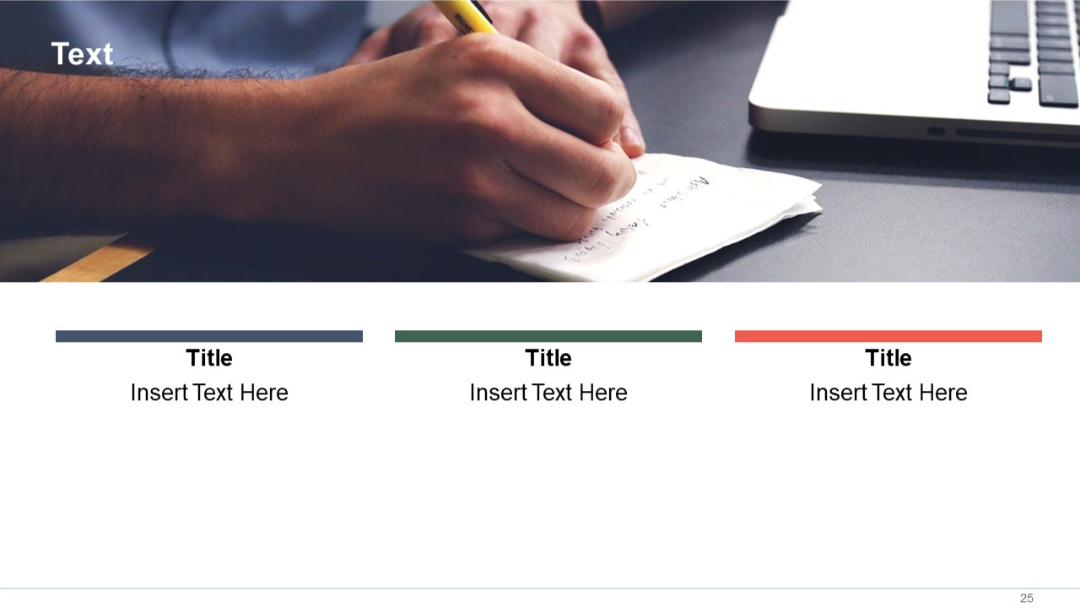
Background image with three content boxes below, each featuring a colored title bar and placeholder for text.
PRO
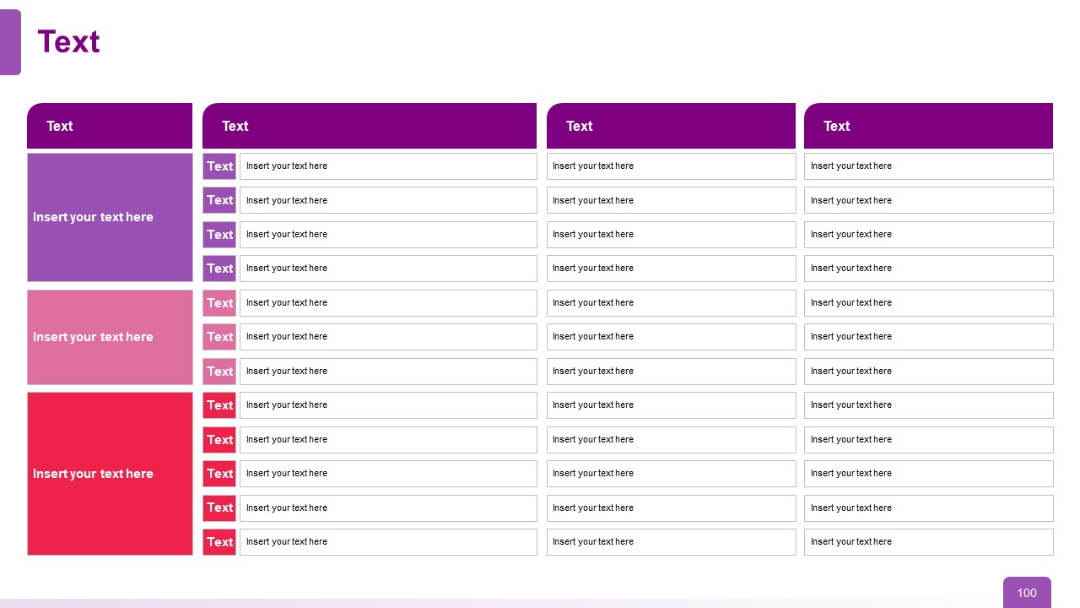
Four-column data matrix with rows under each header; consistent color schemes and organized row structures with placeholders.
PRO
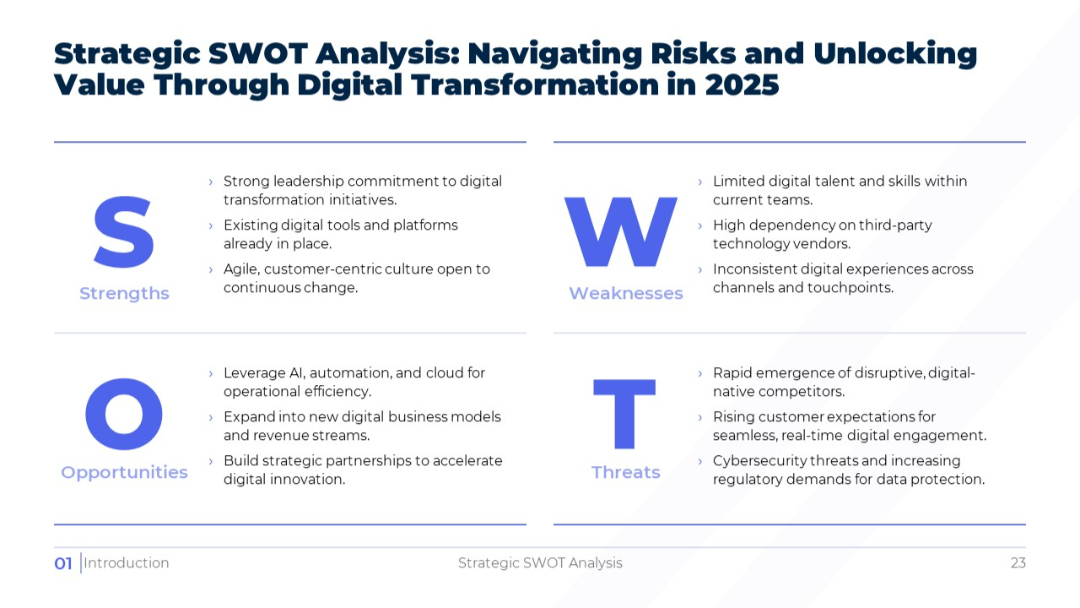
Clean, light-themed 2x2 SWOT matrix layout with large S-W-O-T letters and text under each quadrant.
PRO
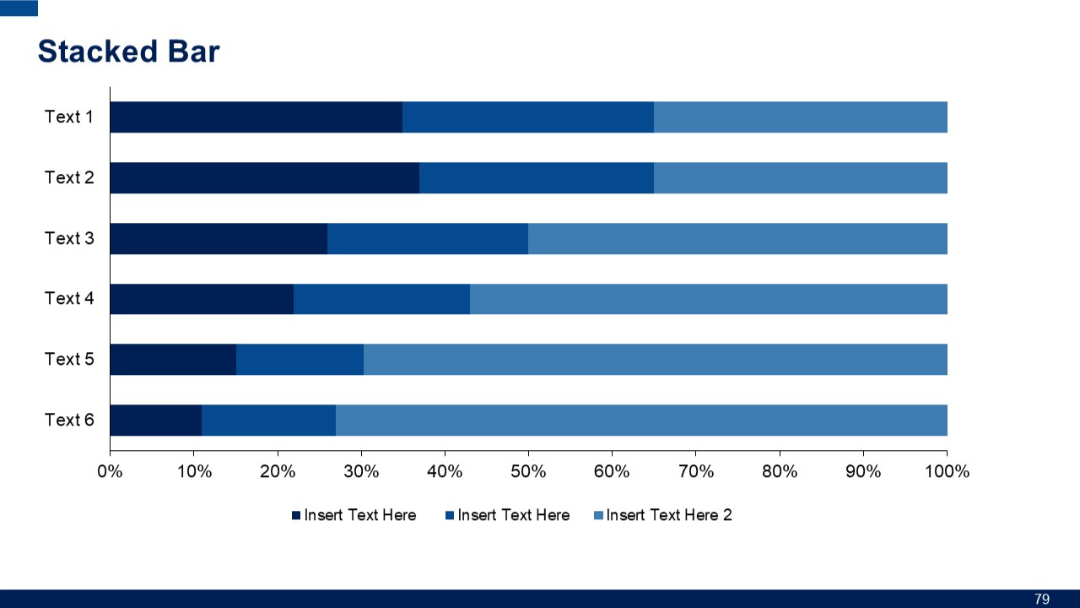
Stacked horizontal bar chart with six entries. Each bar is segmented into three colors representing different text inputs.
PRO
Two-column layout with numbered circular purple icons from 1 to 10; central column lists date and title; breaks (Lunch, Coffee) marked by horizontal lines.
PRO
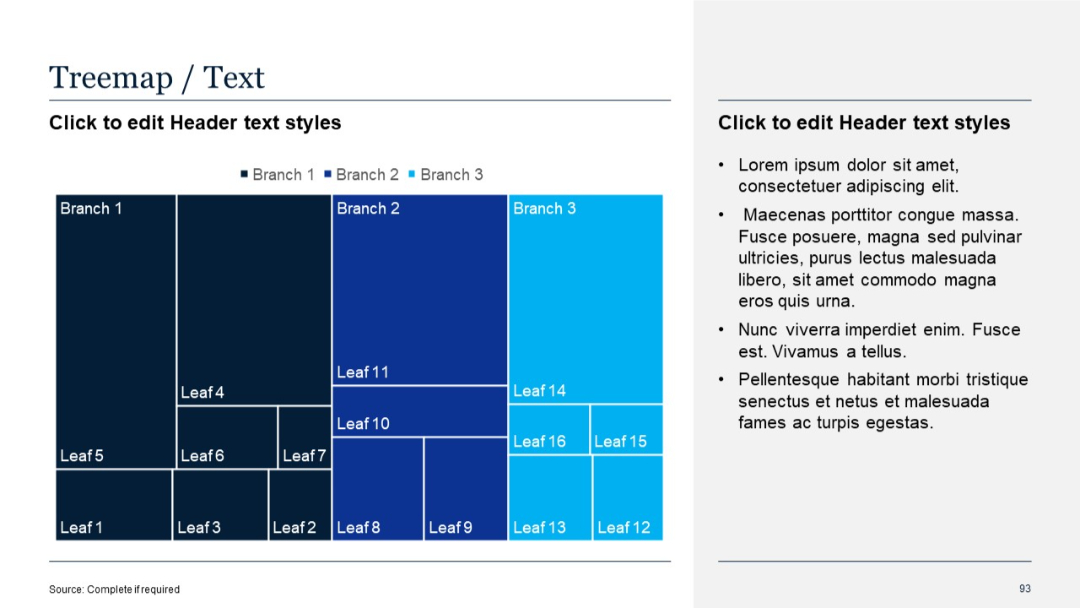
Treemap chart with nested rectangles on left; text section on the right.
PRO
Three-column layout, each with "Title" and "Slide No" columns. Structured as an extended version of Slide 21, fitting more rows for dense indexing.
PRO
Section divider slide with dark blue background and curved line pattern. Large text shows section number and title.

PRO
Left-aligned vertical list with icons and horizontal lines, paired with clipboard and pen illustration on the right.
PRO
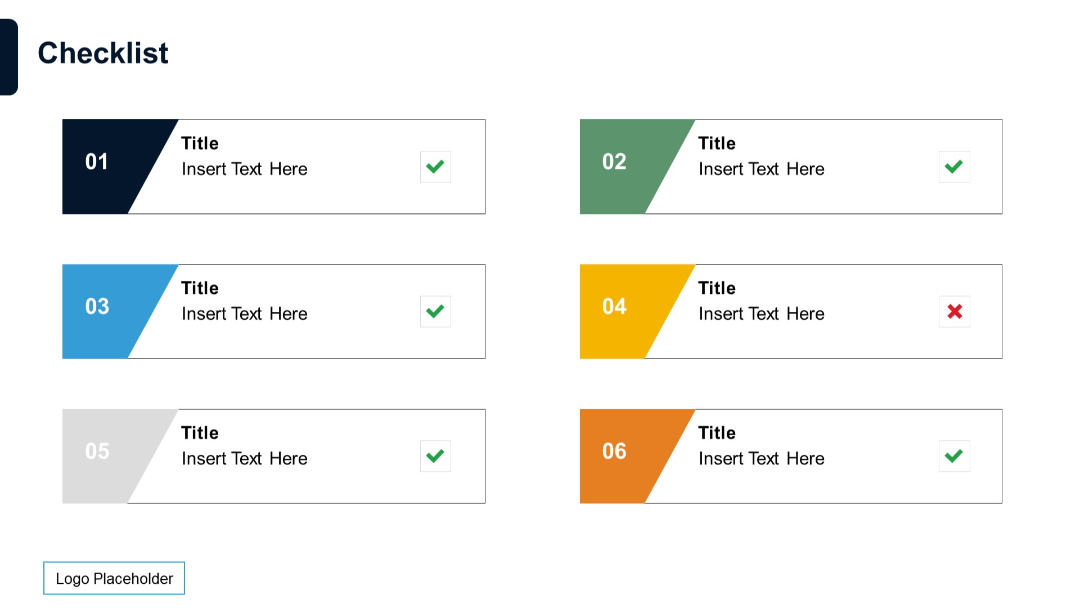
Six rectangular checklist items split into two columns. Each item has a colored number badge, placeholder text, and a checkmark or cross icon for completion status.
PRO
Clean vertical list with three horizontally stacked rows; each item features a number (01–03) and text aligned beside it in a minimalist style.
PRO
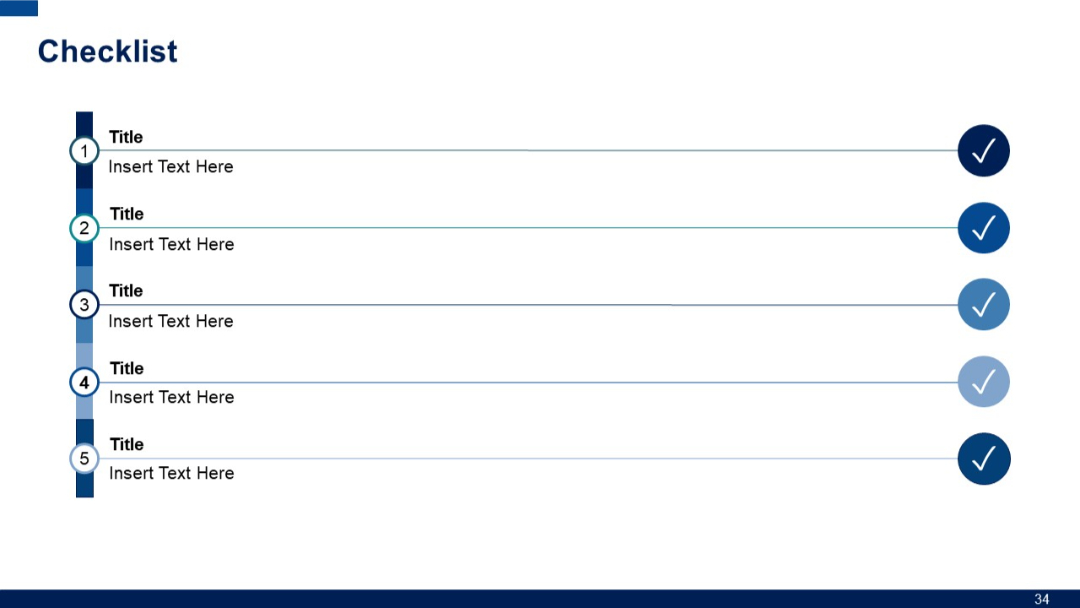
Vertical list of five items with numbered icons and checkmarks; blue gradient sidebar with circular labels; structured linear layout.
PRO
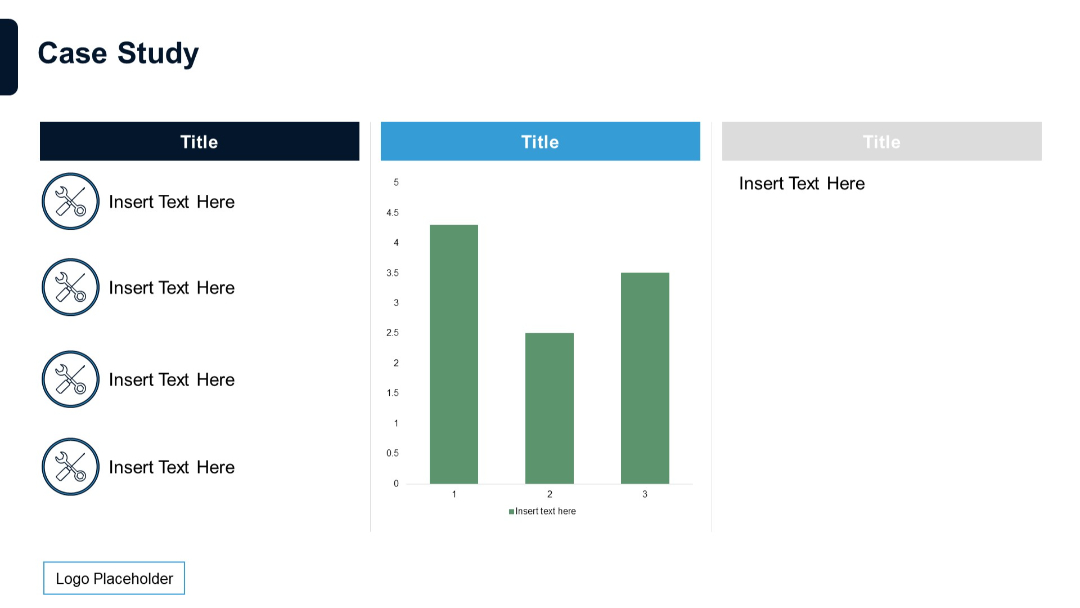
Split layout with three columns: icon-based bullet list, central bar chart, and a faded section with placeholder text.
PRO
Horizontal line with 5 equidistant points. Text boxes appear above and below line with alternating filled/unfilled circular markers.
PRO
Vertical list with arrow icons beside text entries and a title bar at the top. Bold orange and cyan accents on beige background.