PRO
Circular network of nine icons around a central monitor icon. Visual complexity increases. Right panel still contains bullet list format.
PRO
World map on right side with bullet point text placeholders on the left. Clean white background.
PRO
Three horizontal rectangular blocks in gradient shades of pink and purple, each with bold left-side labels, icons (screen, thumbs-up, bulb), and bullet-point text on the right.
PRO
Agenda list in two-column format with agenda items numbered 01 to 10. Blue vertical line beside each number. Minimalist, structured layout.

PRO
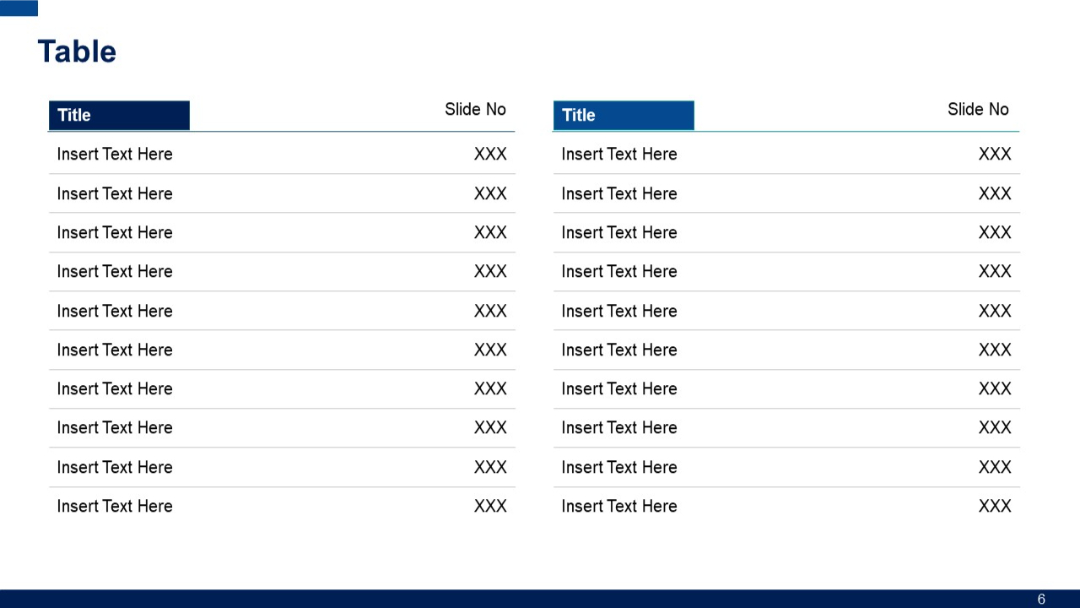
Two-column layout repeated on both left and right sides; each table has "Title" and "Slide No" headers with placeholder rows underneath.
PRO
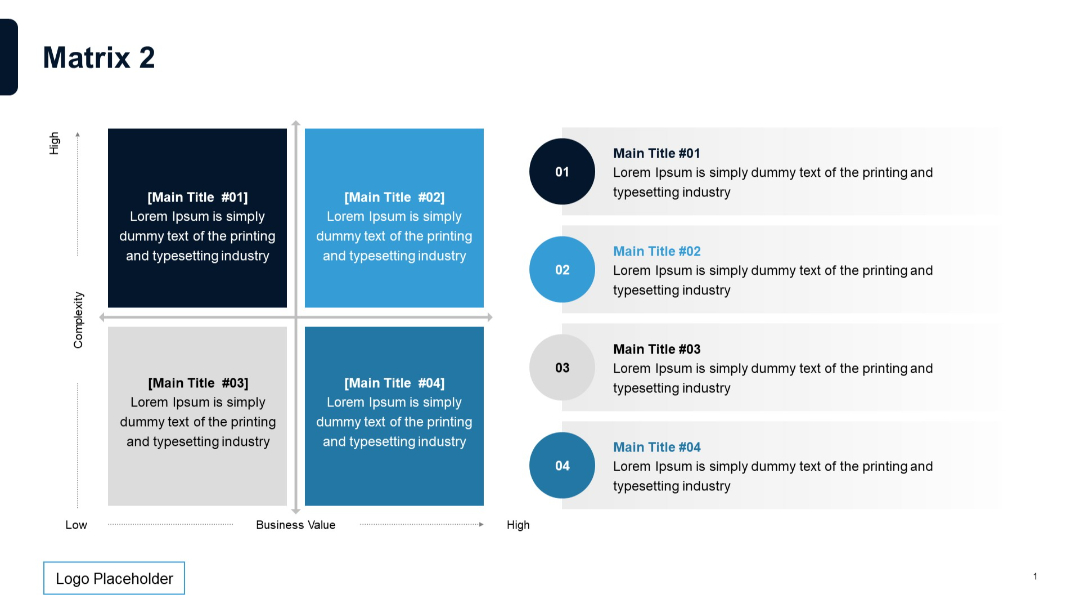
2x2 matrix on left with matching numbered descriptions on the right; enhanced visualization with vertical alignment for clarity.
PRO
Minimalist two-column layout with symmetrical content areas. Each column includes a bold subtitle and placeholder text.
PRO
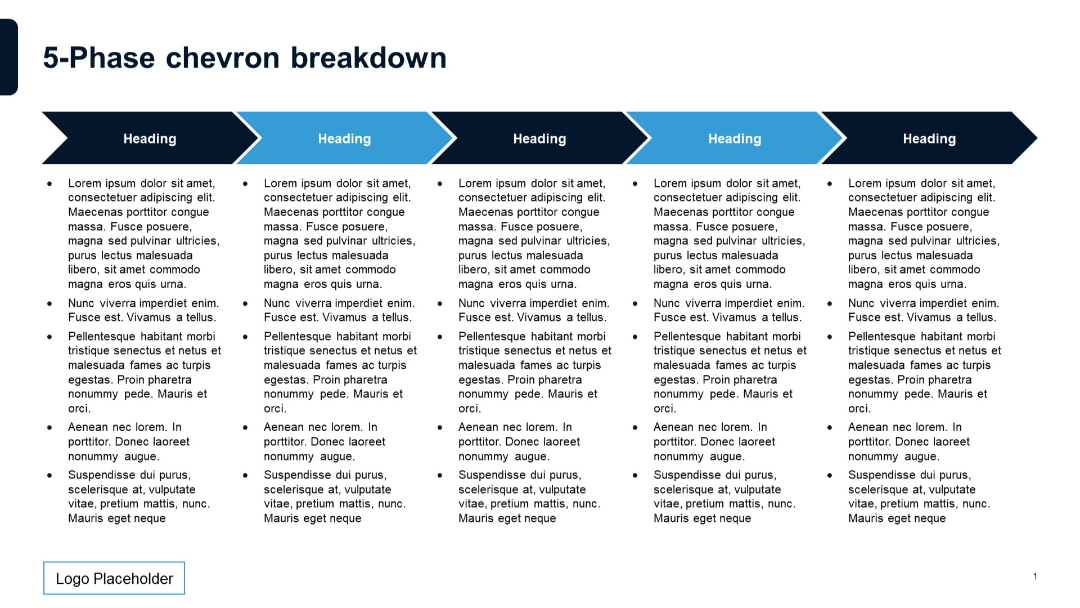
Five horizontally connected chevrons with alternating blue shades. Each phase has a heading and aligned bullet list below. Spans across the slide, using all available horizontal space.
PRO
Four cogwheel-shaped graphics in a row, each containing a central header and supporting text below. Uniform in layout.

PRO
Dark-themed slide with a center-aligned bold “Thank you!” message with branding marks.

PRO
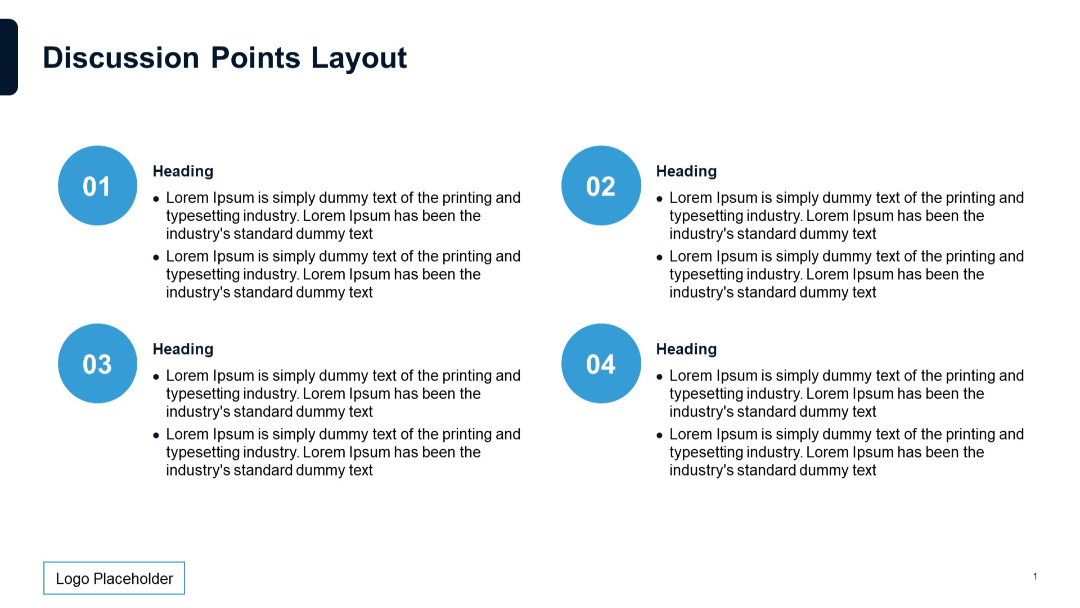
Four circular numbered icons (01–04) paired with text blocks arranged in a 2x2 grid. Balanced whitespace and consistent bullet layout.
PRO
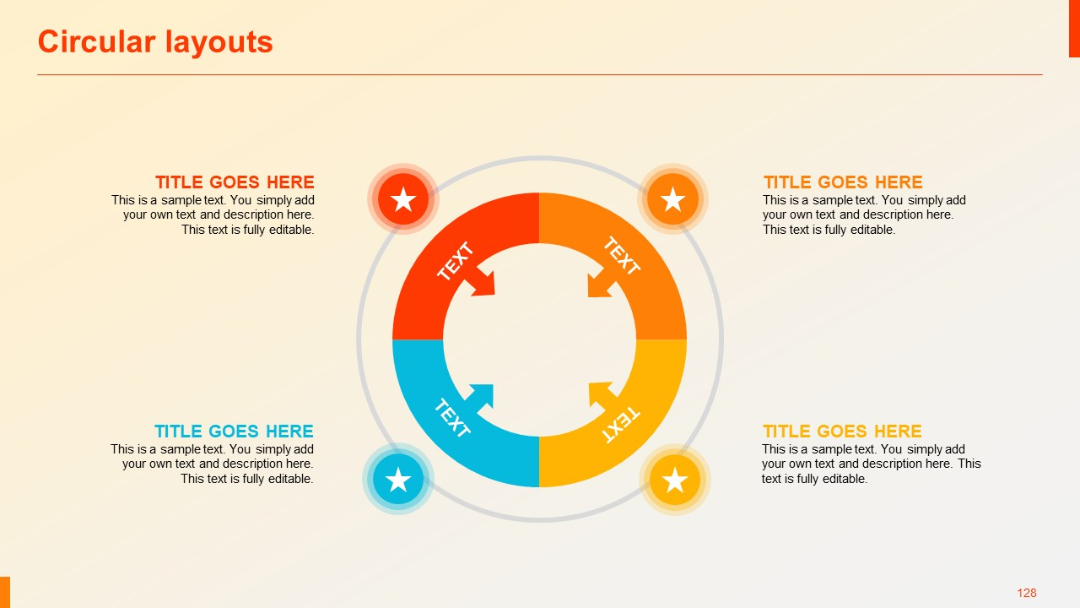
A four-color circular flow diagram with arrows forming a loop; stars in circles placed externally with headers.
PRO
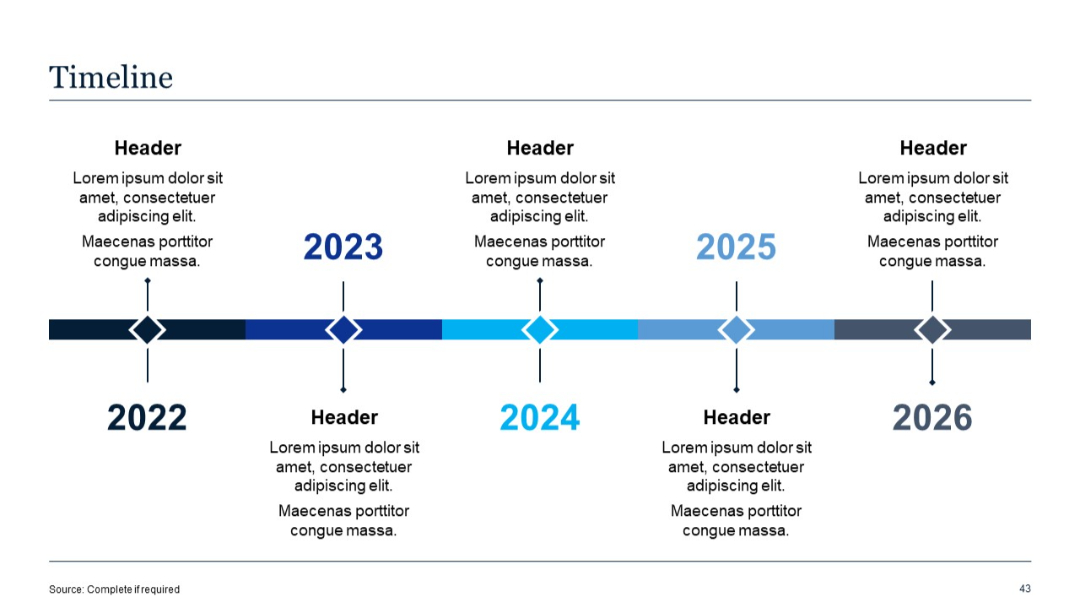
Horizontal timeline spanning 2022–2026, with alternating text boxes above and below a segmented line. Each year marked by a diamond shape.
PRO
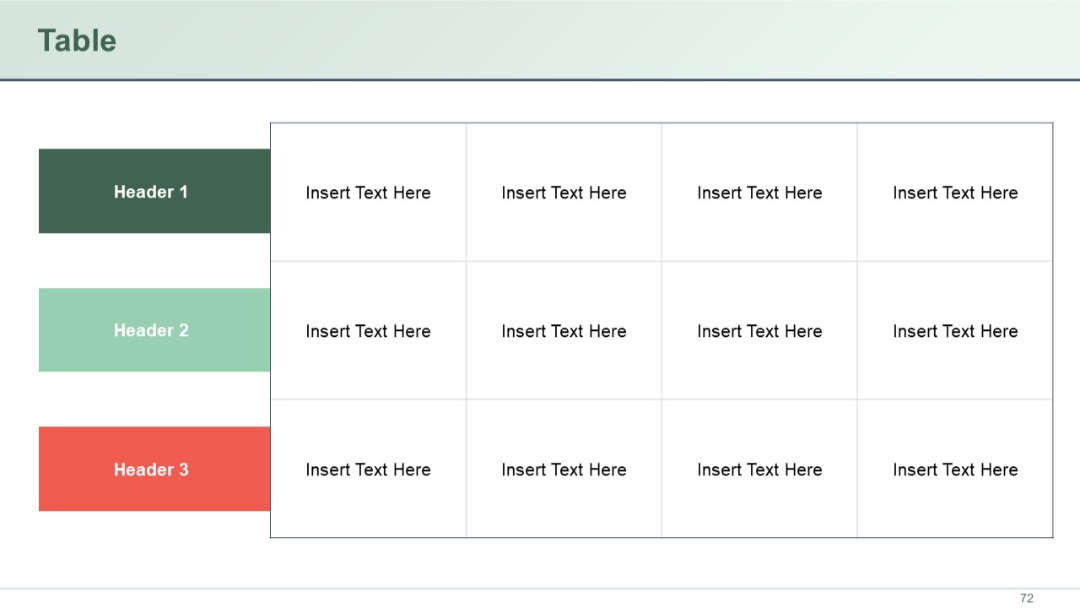
A color-coded 4-column table with three left-side row headers in dark green, light green, and red. Right cells are empty with “Insert Text Here.”
PRO
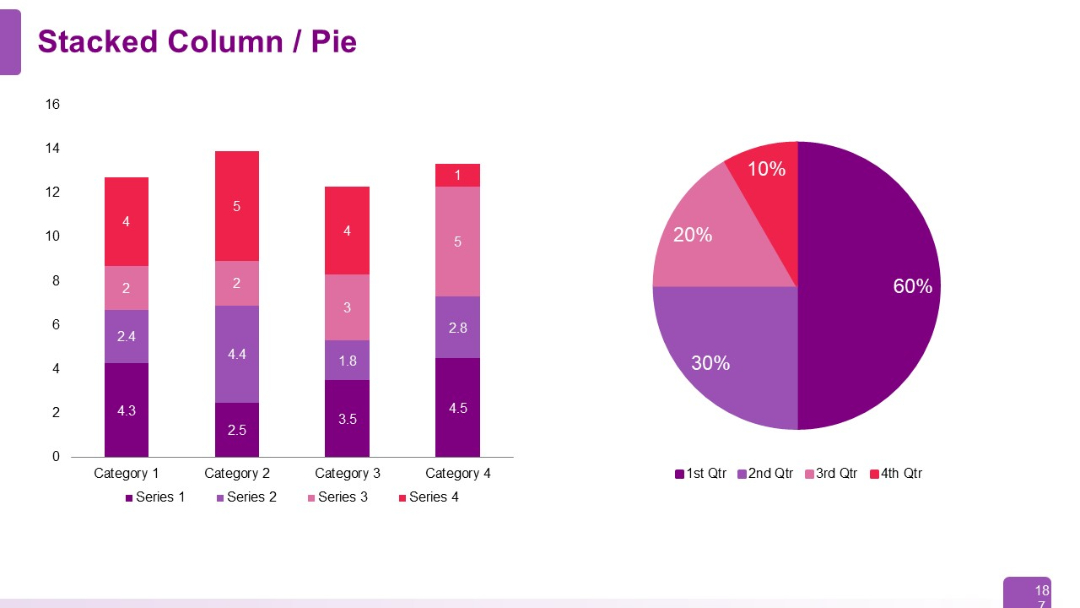
Split slide with stacked column chart on the left and a color-coded pie chart on the right. Charts are labeled with values and legend.
PRO
Time-based agenda in a linear, left-aligned format with colored circles and play-style directional markers.

PRO
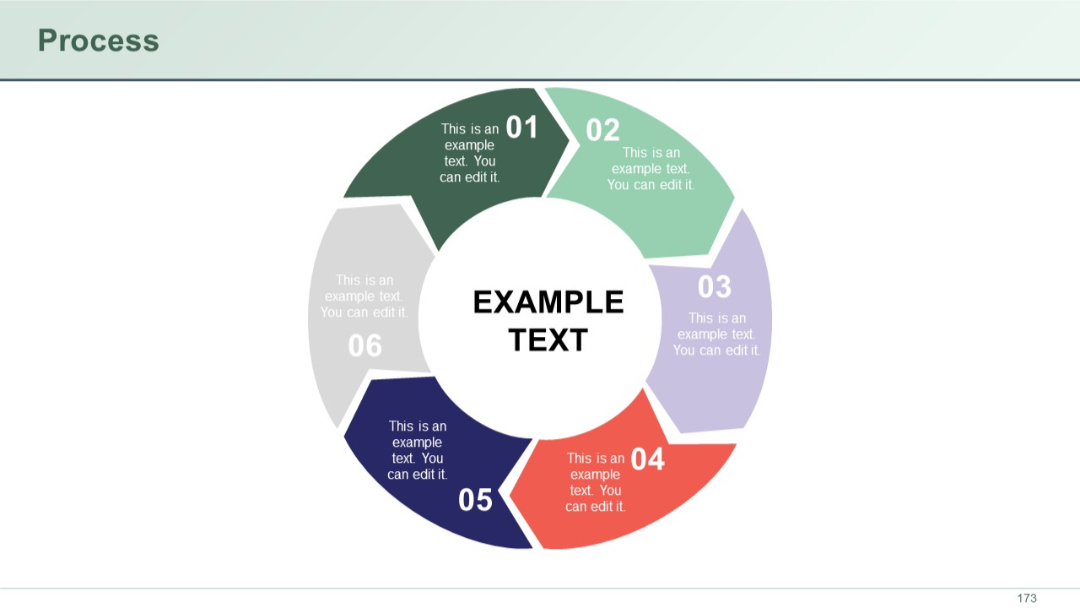
Circular radial diagram with six arrow-shaped segments surrounding a central circle labeled "Example Text."
PRO
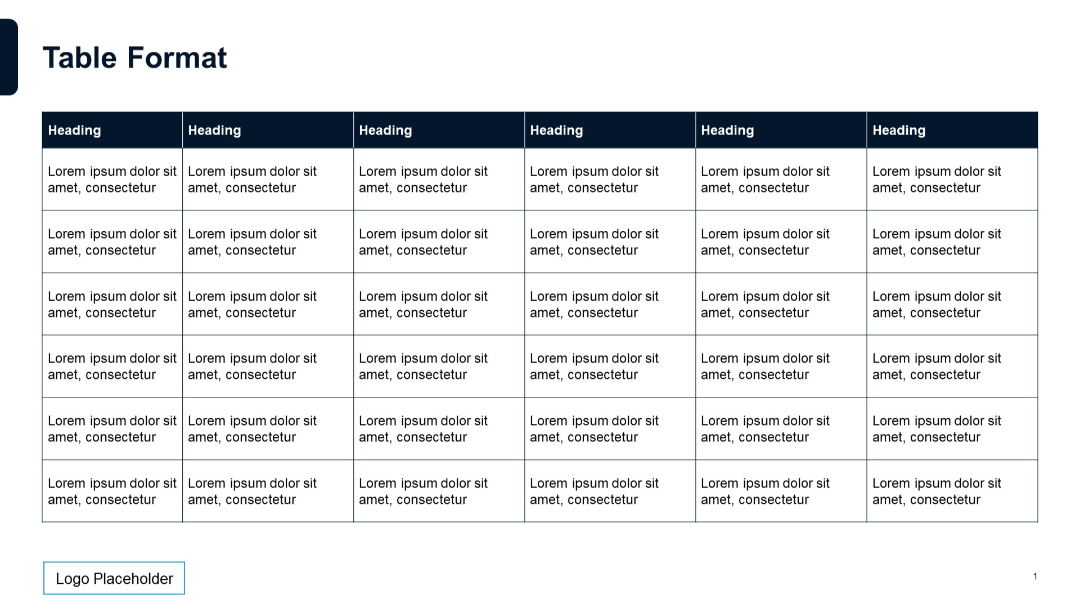
Full-width table with uniform layout and dark header. All rows have equal styling and multiple columns for displaying data.
PRO
Simple 2-row, 5-column table with uniform width columns, bold dark blue headers, and plain white cells with placeholder text.
PRO
Four diamond-shaped connected blocks numbered 01–04, alternating between left and right side, each with title and placeholder text areas.
PRO
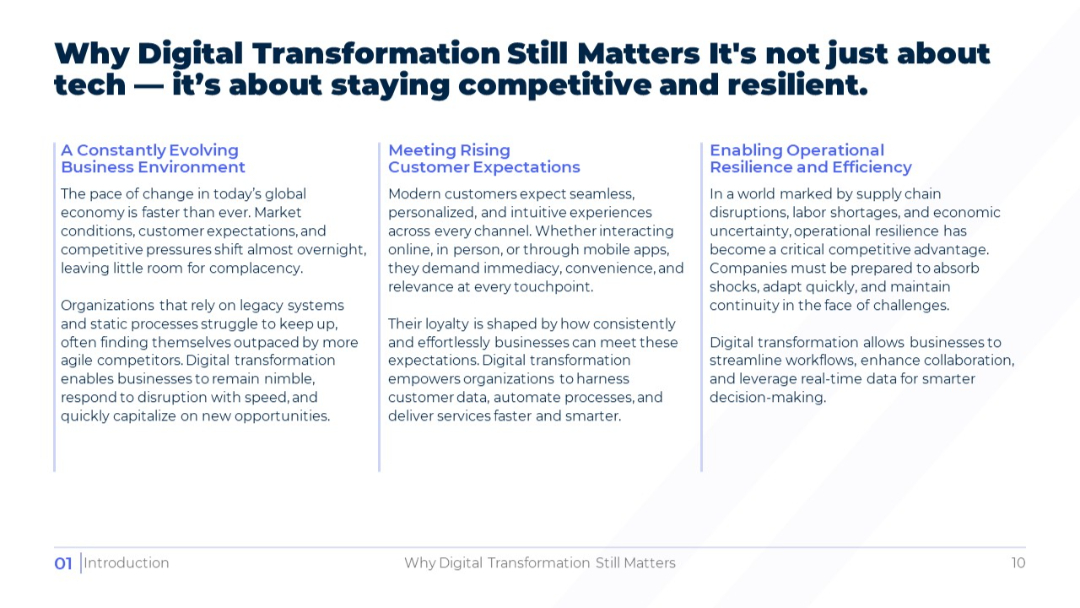
Three-column layout with detailed paragraphs under three headings: business environment, customer expectations, and operational efficiency. Narrow columns with evenly spaced blocks of text.
PRO
Dark background with large stylized quotation marks and centered bold text quote.

PRO
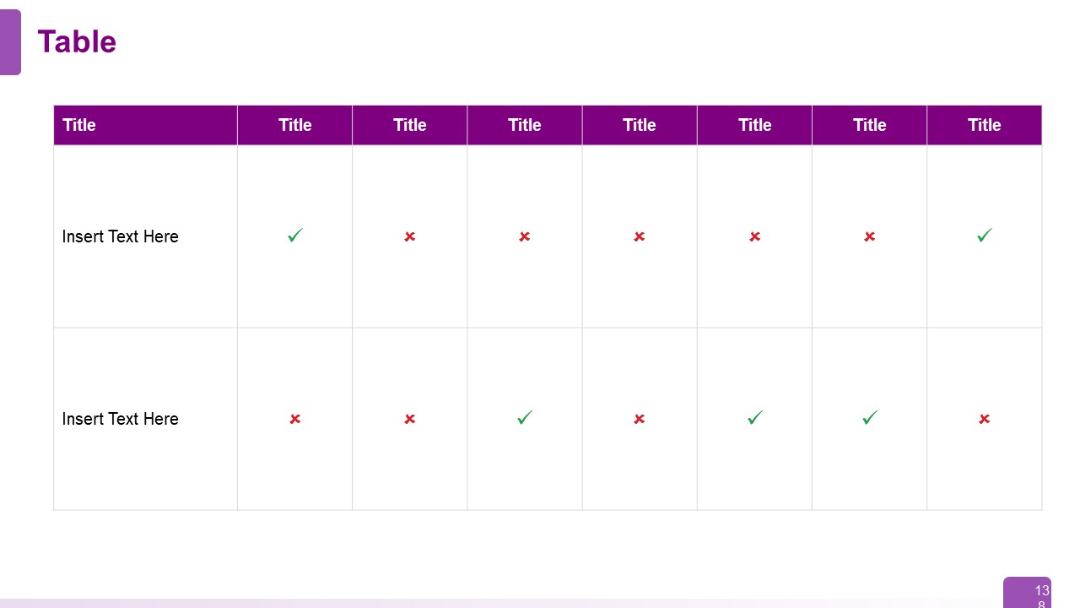
Horizontal table with checkmarks (green) and crosses (red) as indicators across columns. Designed for feature comparison or capability matrix.
PRO
6-row, 5-column table with consistent layout from Slides 22–23, allowing deeper comparative data input.
PRO
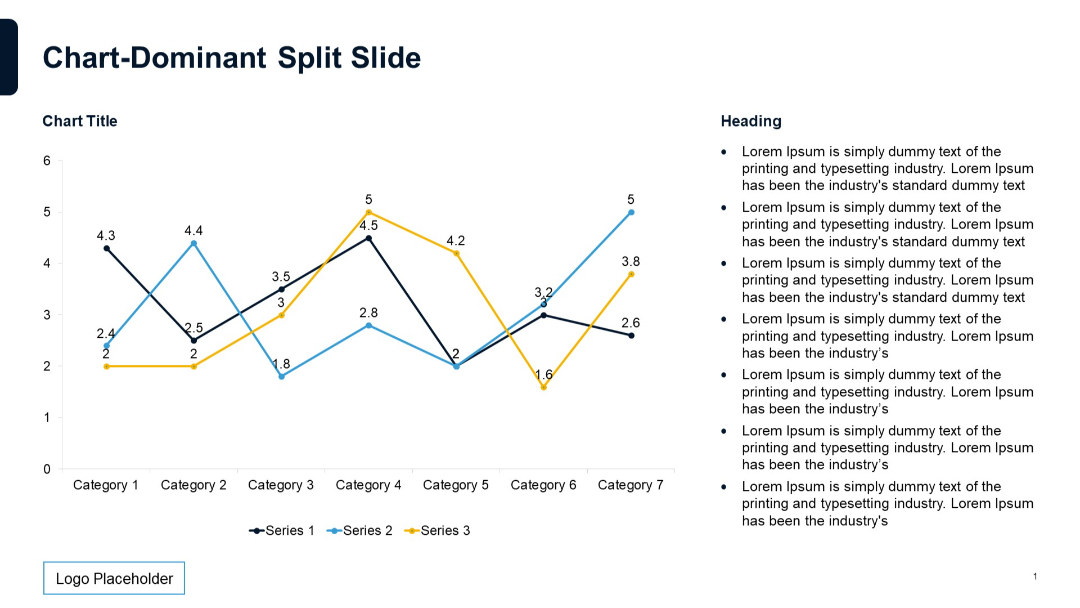
Split slide with a line chart on the left and bulleted text on the right; three series plotted across categories, clean and balanced layout.
PRO
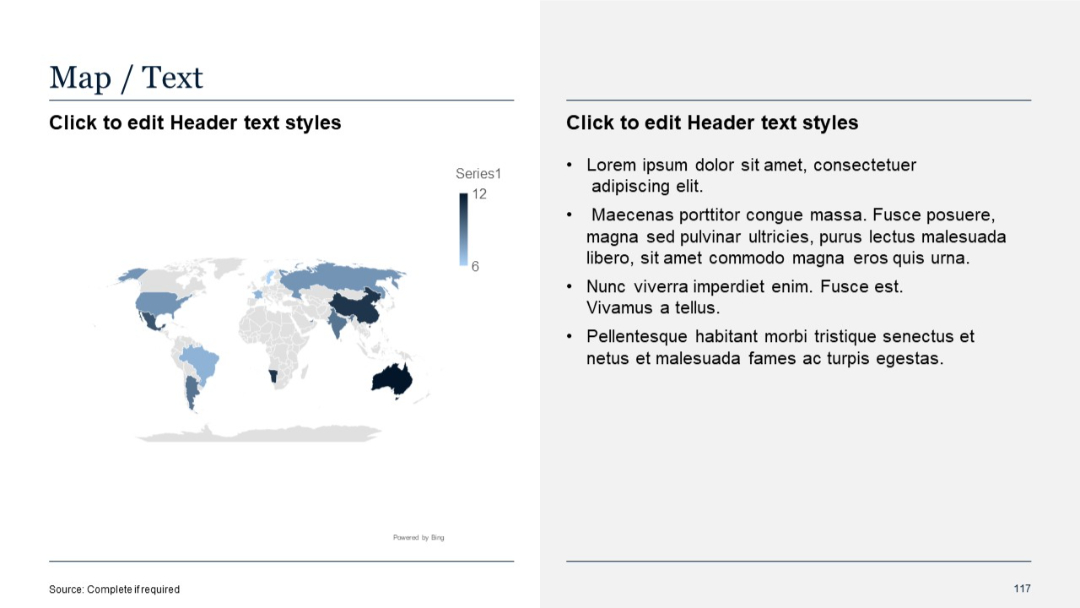
Map visual (choropleth style) on left with color gradient; right side contains placeholder bullet text.
PRO
Three-column layout; dark background with bold text stats; evenly spaced with central alignment; modern infographic styling.

PRO
Two-row, two-column layout with left-aligned colored side tabs (numbered and titled) and adjacent text boxes. Stylized rectangular segments.
PRO
Four-layered pyramid layout, each section labeled “25%” with aligned text to the right. Clean, minimal design with flat colors.

PRO
Pie-chart style circle split into 4 equal quadrants labeled 01–04, with corresponding text boxes around it.