PRO
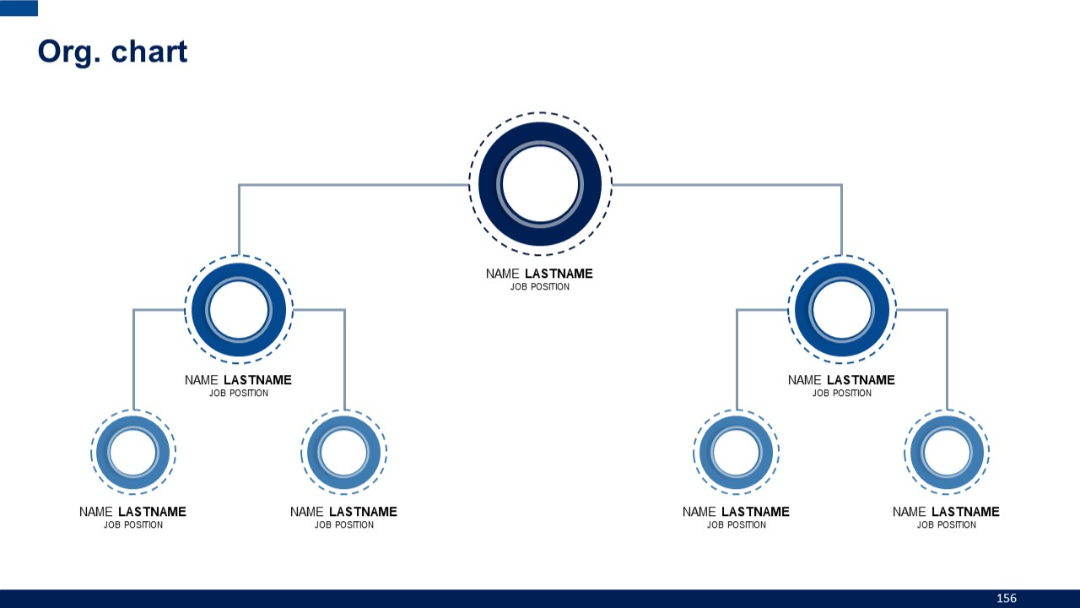
Hierarchical organization chart with dotted-line circular icons connected by straight lines. Top-down layout.
PRO
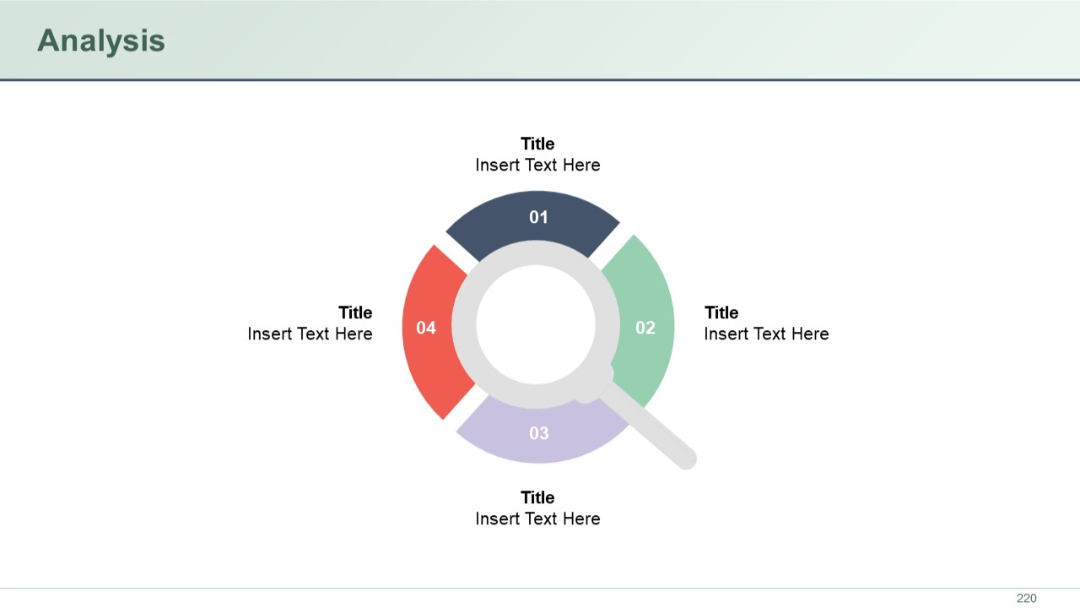
Circular segmented ring with a magnifying glass icon over it, divided into four colored quadrants labeled 01–04, each with a title and placeholder content.
PRO
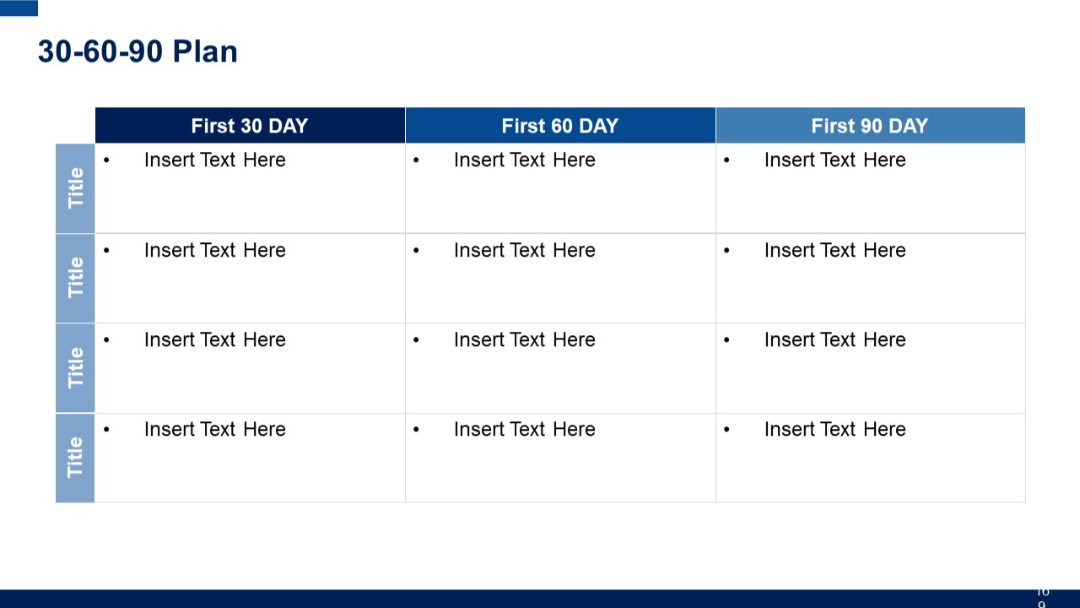
Grid layout with column headers (First 30/60/90 DAY) and row labels ("Title"), forming a matrix to list activities or goals by timeframe.
PRO
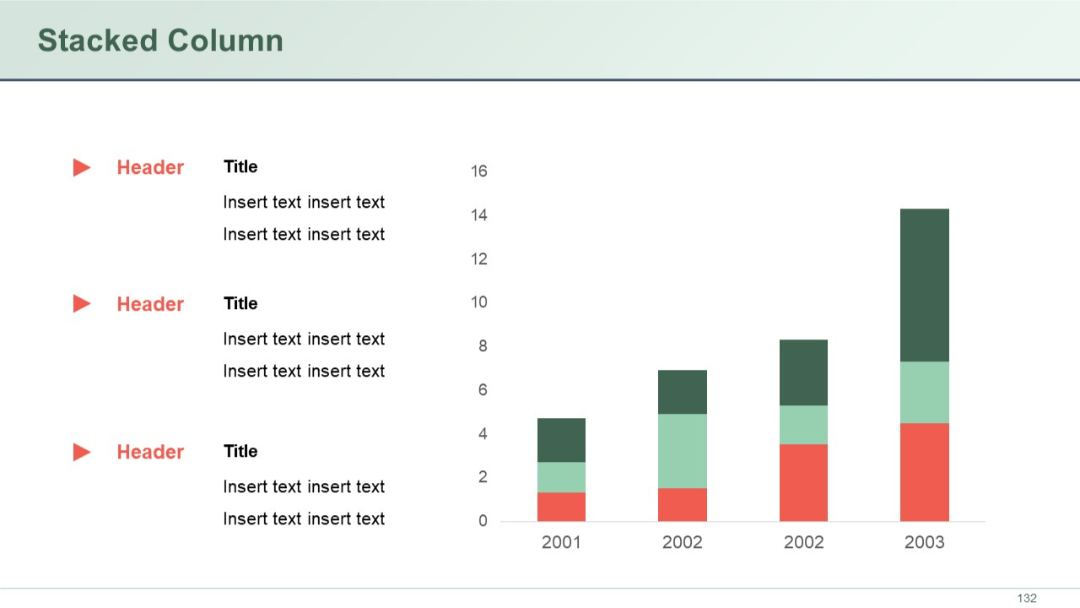
Left-aligned bullet text with red triangle icons, and a vertical stacked column chart on the right displaying yearly data in different color segments.
PRO
Split layout: left side with background image of people working, right side listing four sections numerically.

PRO
Vertical list with circular gear-like icons and numbering, aligned left. Each entry includes a title and subtitle.

PRO
Timeline-based table with “Past,” “Present,” and “Future” columns and left-hand labels in dark green. Icon indicators show status.

PRO
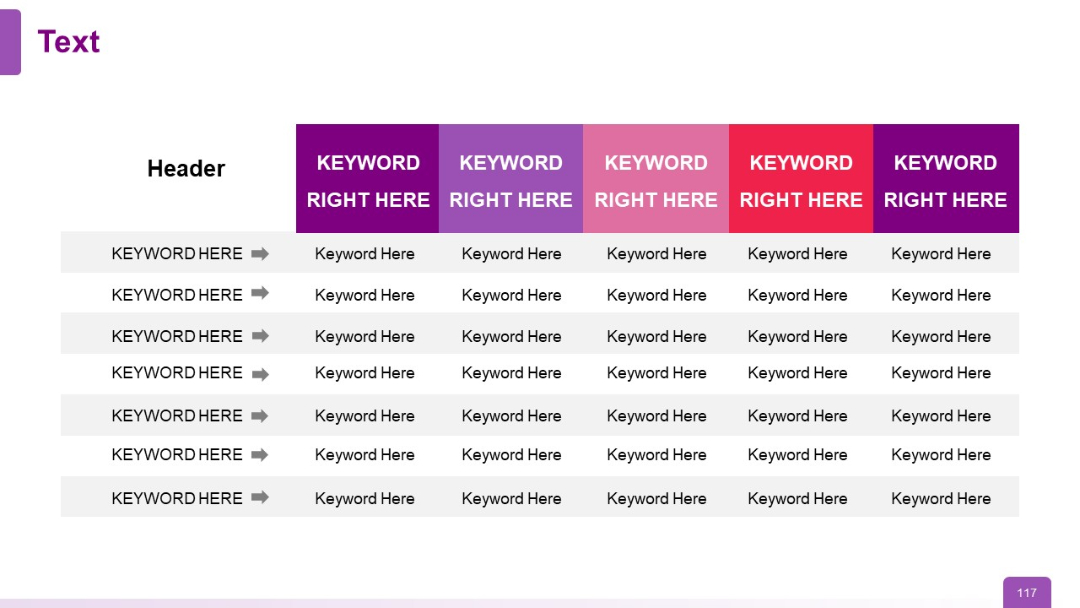
Wide table with color-coded columns and keyword rows with arrow indicators
PRO
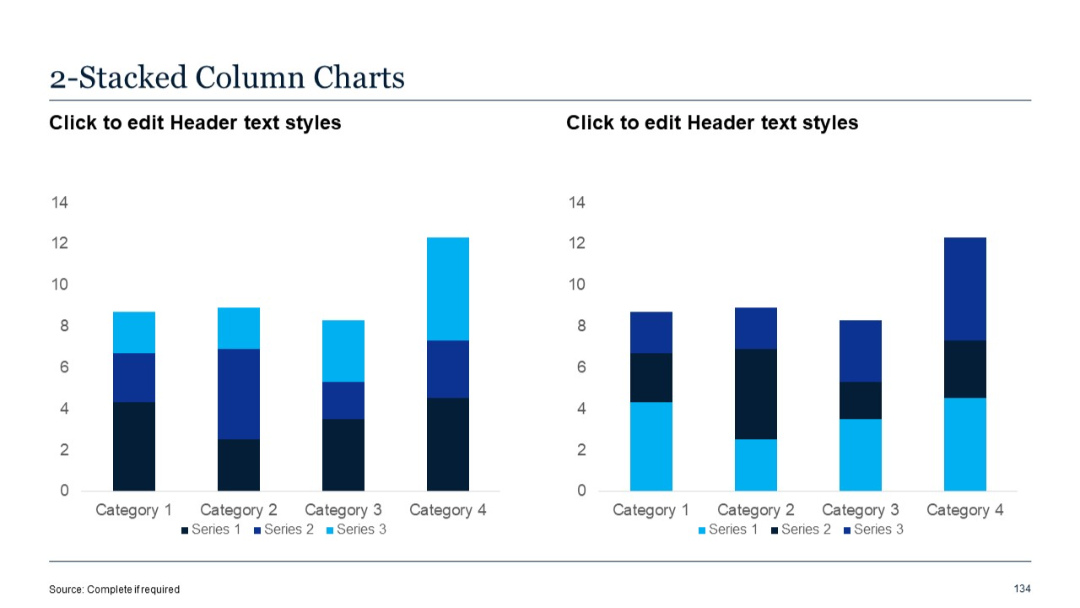
Two vertical stacked column charts side-by-side. Each column is divided into three series segments in different shades of blue.
PRO
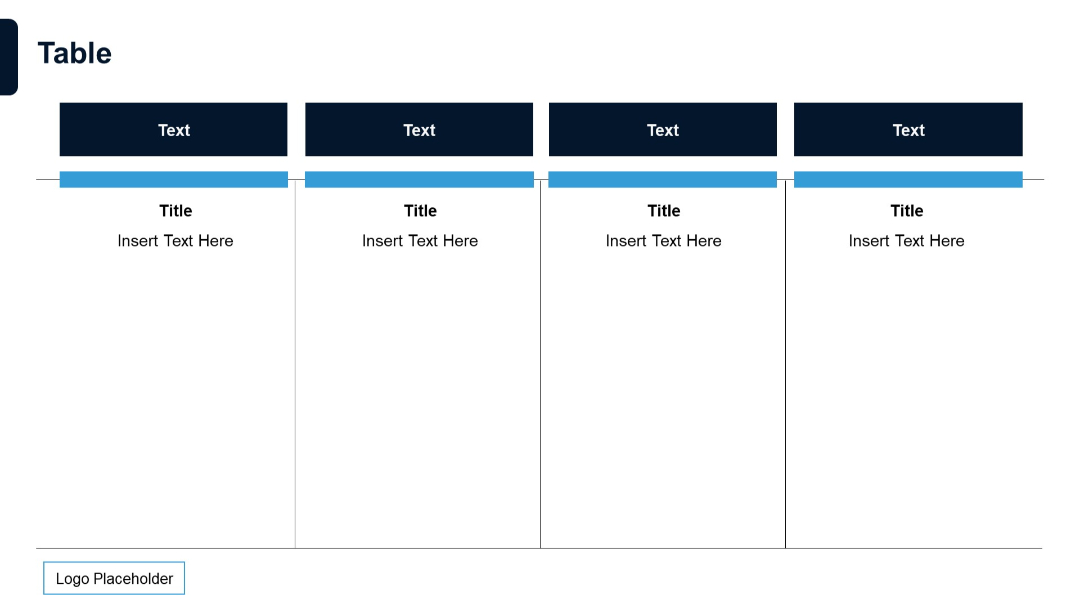
Four-column structure. Header blocks in dark blue with blue underline accents. Clean vertical division.
PRO
Horizontal arrow background with four circular icons overlayed, each representing a different step.
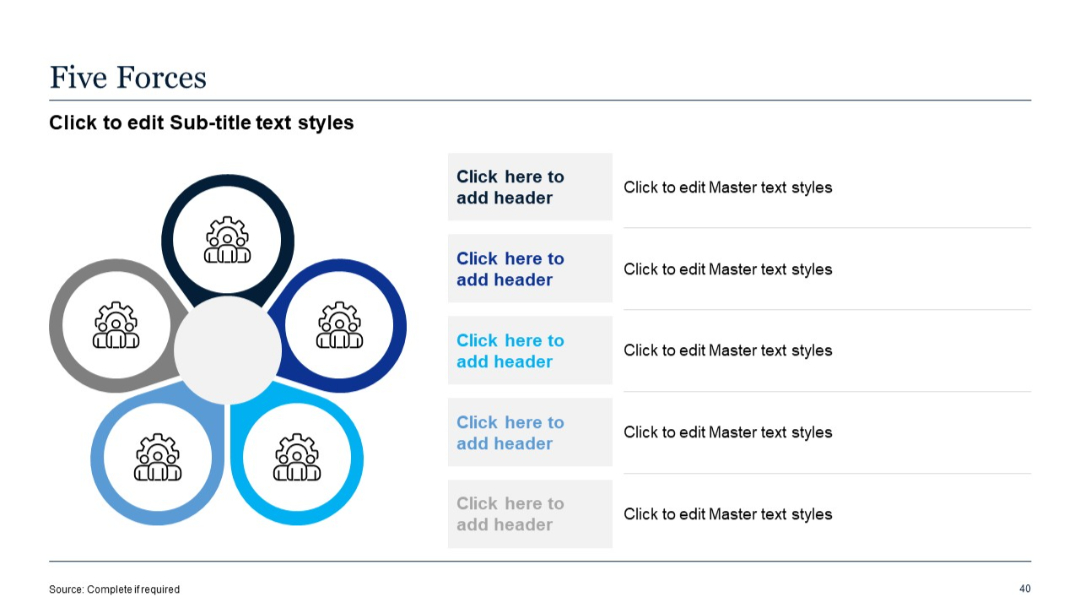
PRO
Diagram in flower/gear shape with five segments, each linking to editable headers and descriptions. Right side lists content aligned with each segment.
PRO
Full-screen background image with white text box overlay and large green dot icon.

PRO
Clean, white background; structured into 4 equal horizontal blocks with icons and bold headers; blue numbering; modern professional layout.

PRO
Matrix layout with icons on left and corresponding content in two adjacent boxes
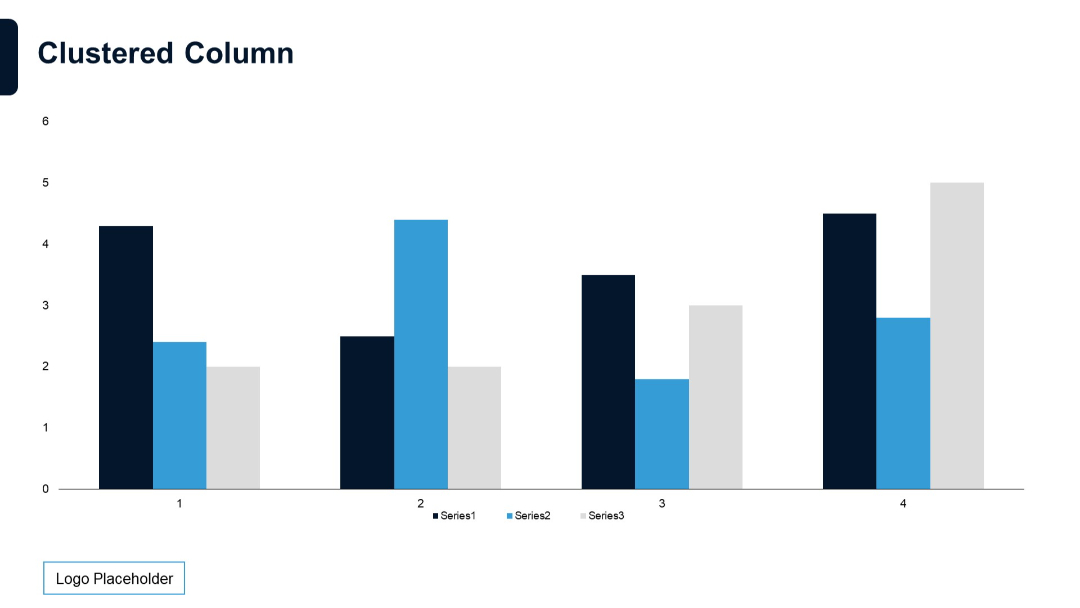
PRO
Basic clustered column layout with three series. No annotations or text except axis numbers and legend.
PRO
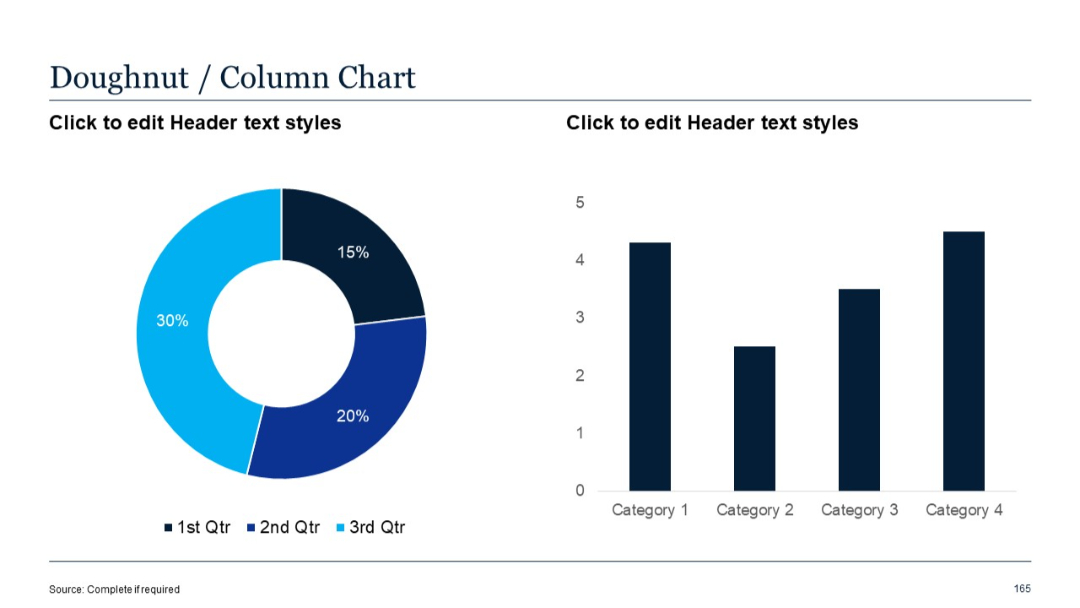
Doughnut chart on the left and vertical column chart on the right, each representing the same categories.
PRO
Same layout as previous slide but on a white background with light blue wave design. Includes editable title and subtitle placeholders and logo placeholder.

PRO
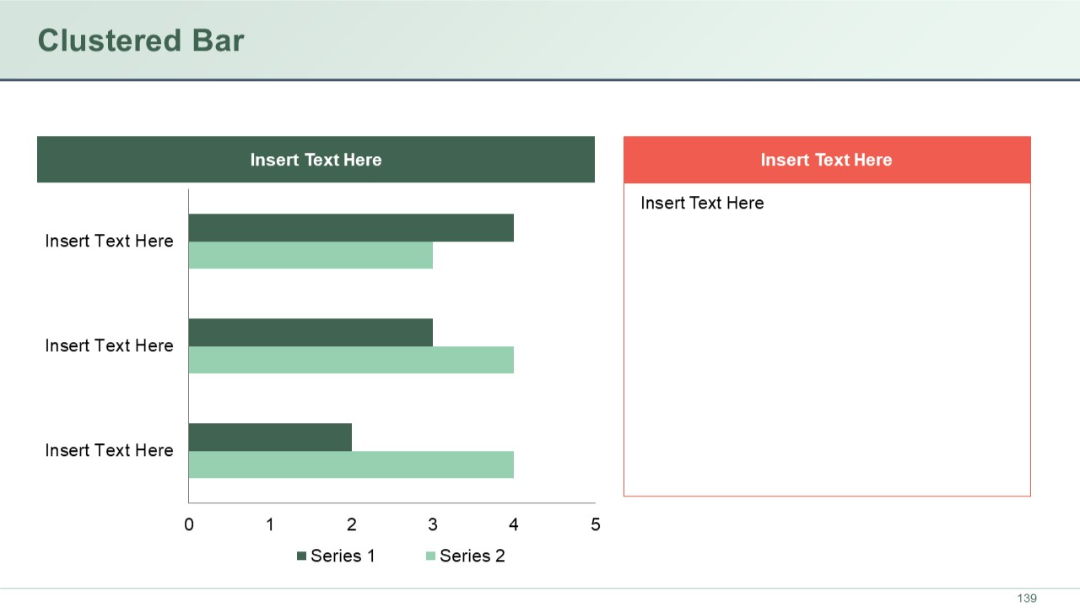
Horizontal clustered bar chart on the left; two large vertical content boxes on the right. Simplified layout with series differentiation by color.
PRO
One large quote section with a title bar above. Centered large quote box with stylized quotation marks and rounded edges.

PRO
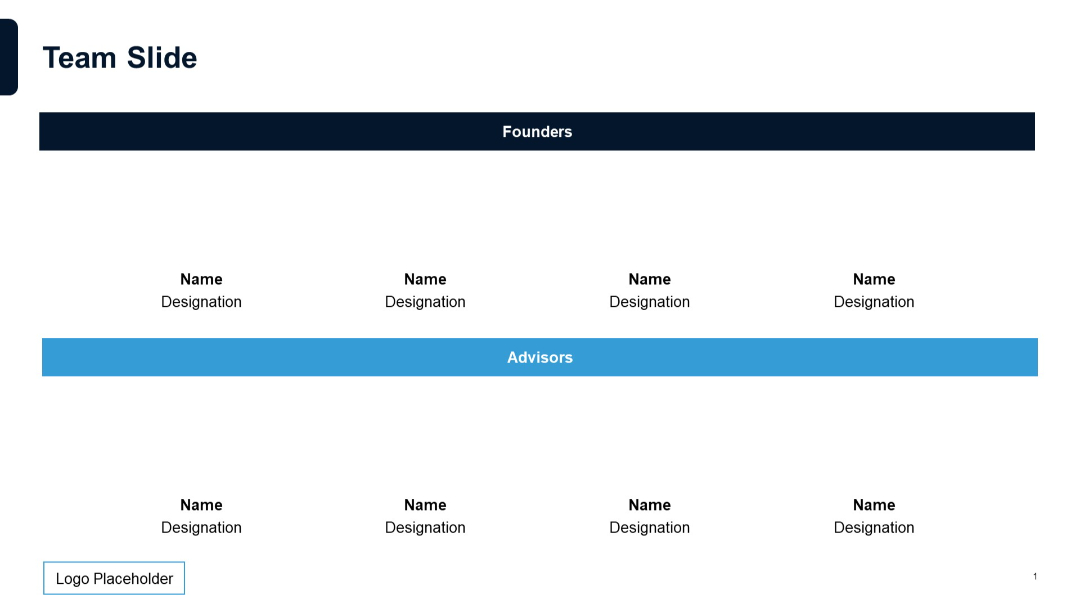
White background with two horizontal color bars separating “Founders” and “Advisors”; names and roles in grid layout.
PRO
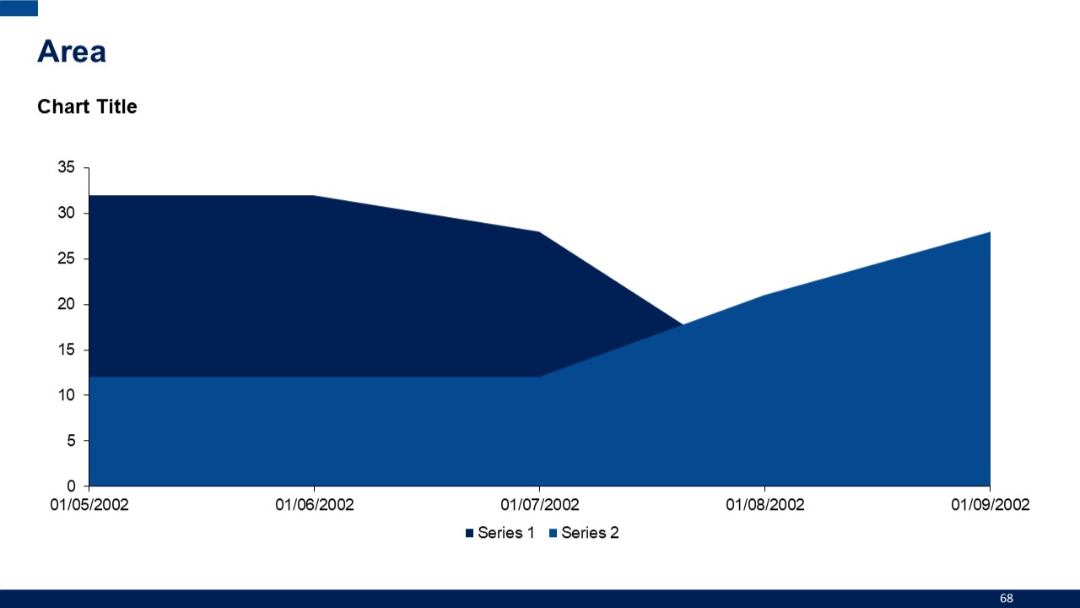
Area chart with two stacked segments (Series 1 and Series 2). Blue tones with a date-based x-axis and values on the y-axis.
PRO
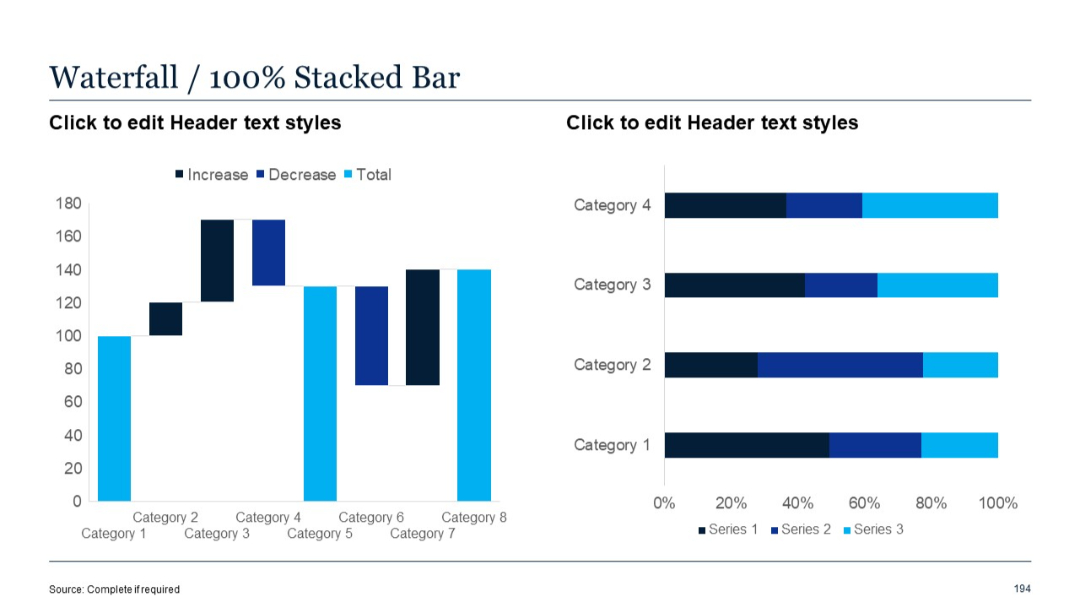
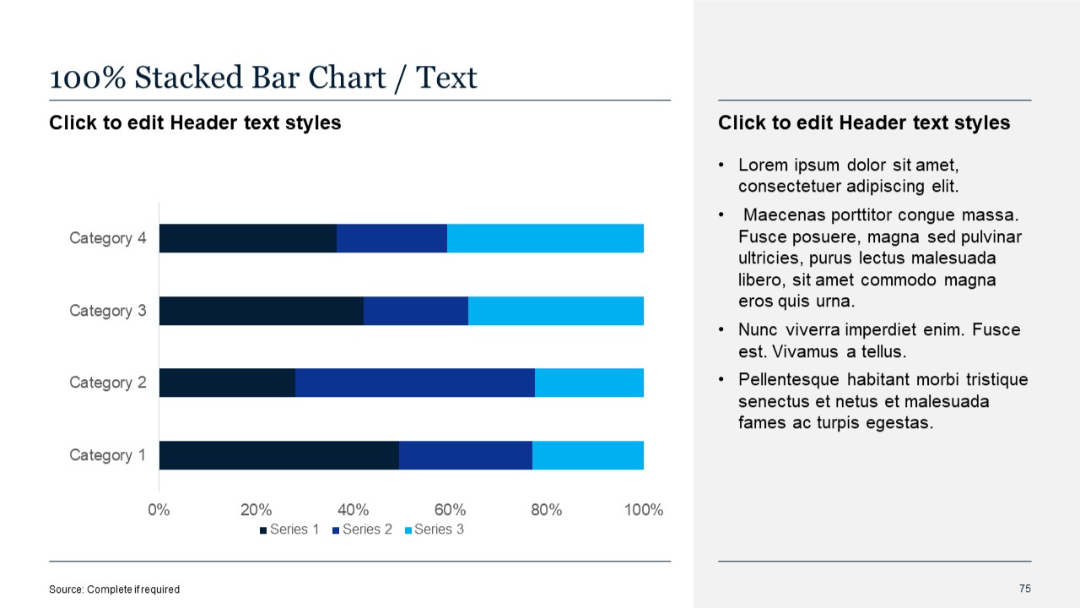
100% stacked horizontal bar chart with proportions clearly marked. Uses consistent color scheme across series.
PRO
A grid of six vertical column-style bar charts with placeholders for percentage values, titles, and descriptions.
PRO
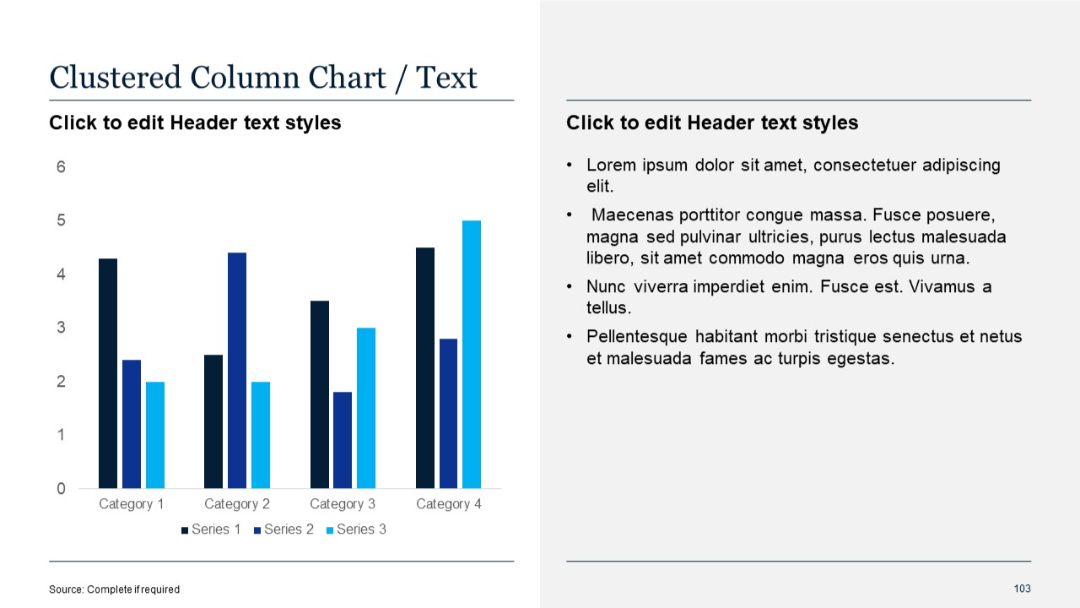
Left side features a clustered column chart; right side contains standard bullet text layout.
PRO
Dark background version of the same profile; portrait in circular frame with text on right.

PRO
5x5 matrix with both row and column headers. Each cell includes bullet point placeholders. Vertical row headers are on the left, with purple accents.

PRO
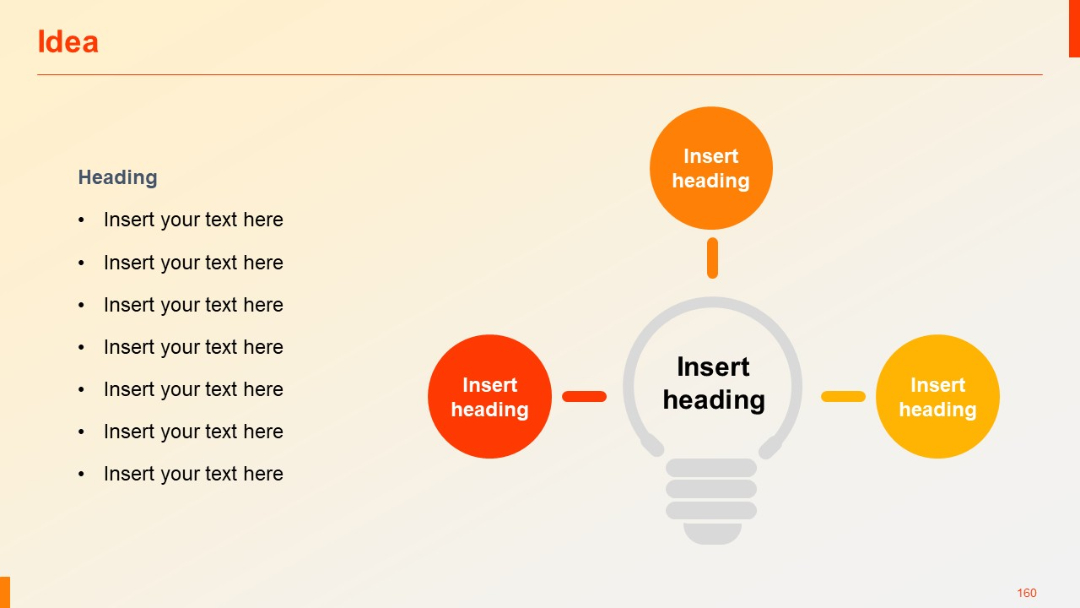
Lightbulb centerpiece with four surrounding circular icons connected by arrows; bullet list on the left.
PRO
Horizontal timeline with alternating colored rectangular titles above and below a central line.
PRO
Left side: waterfall; Right side: 100% stacked bar chart with uniform length, showing proportions.