PRO
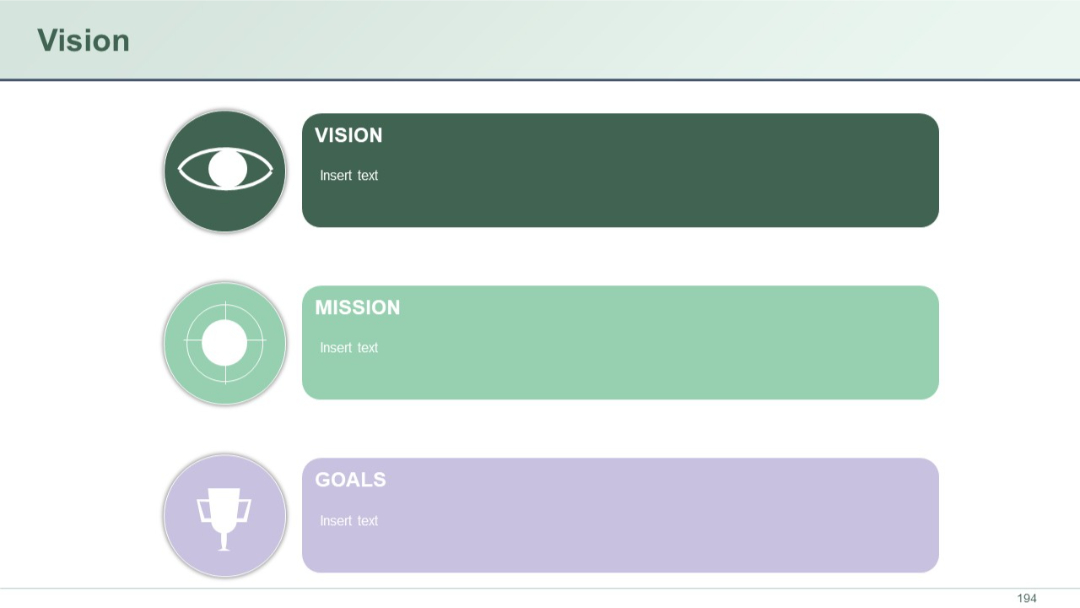
Three stacked segments labeled Vision, Mission, and Goals with icons on the left and text blocks on the right. Pastel colors create soft contrast.
PRO
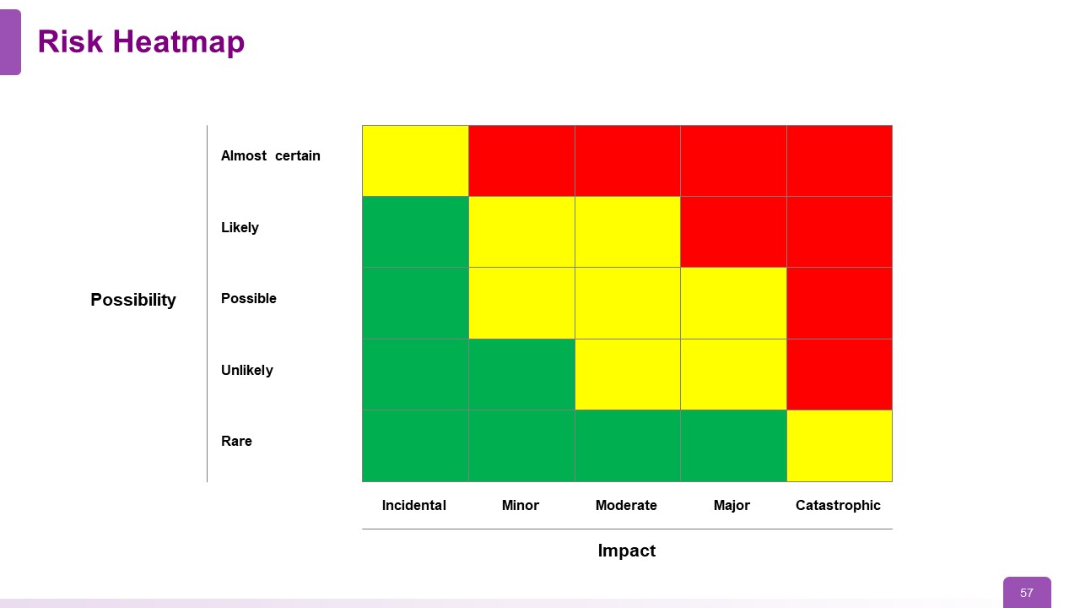
5x5 risk matrix heatmap with axes labeled "Impact" (horizontal) and "Possibility" (vertical). Color-coded: green (low), yellow (medium), red (high).
PRO
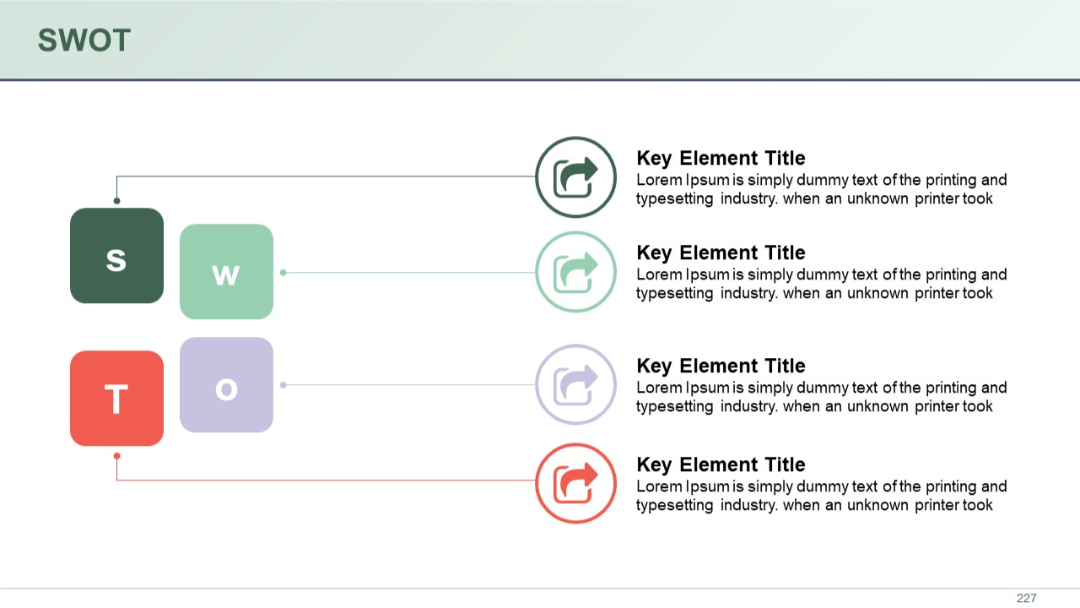
Classic 2x2 SWOT layout with "S", "W", "O", and "T" blocks in color, each with a key element and description beside it.
PRO
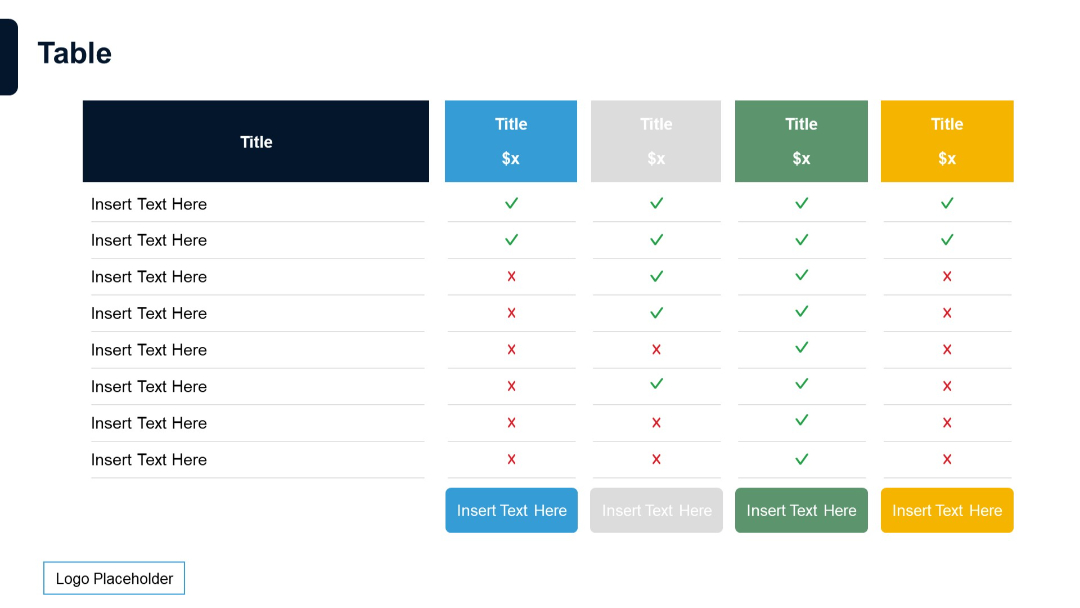
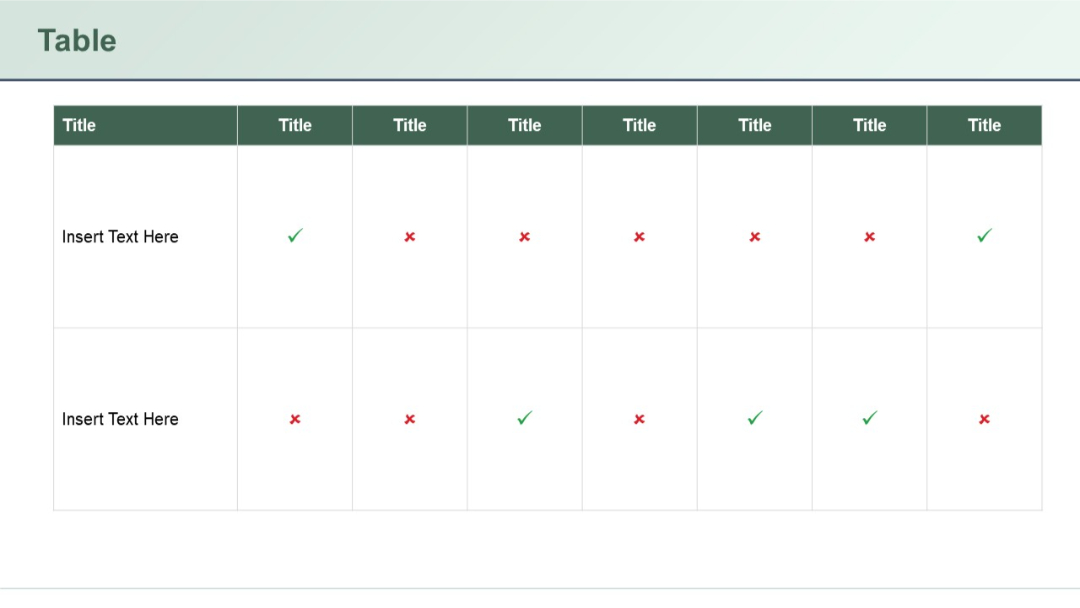
Extended feature comparison table with five pricing tiers, each in distinct color, with status icons and insert text prompts.
PRO
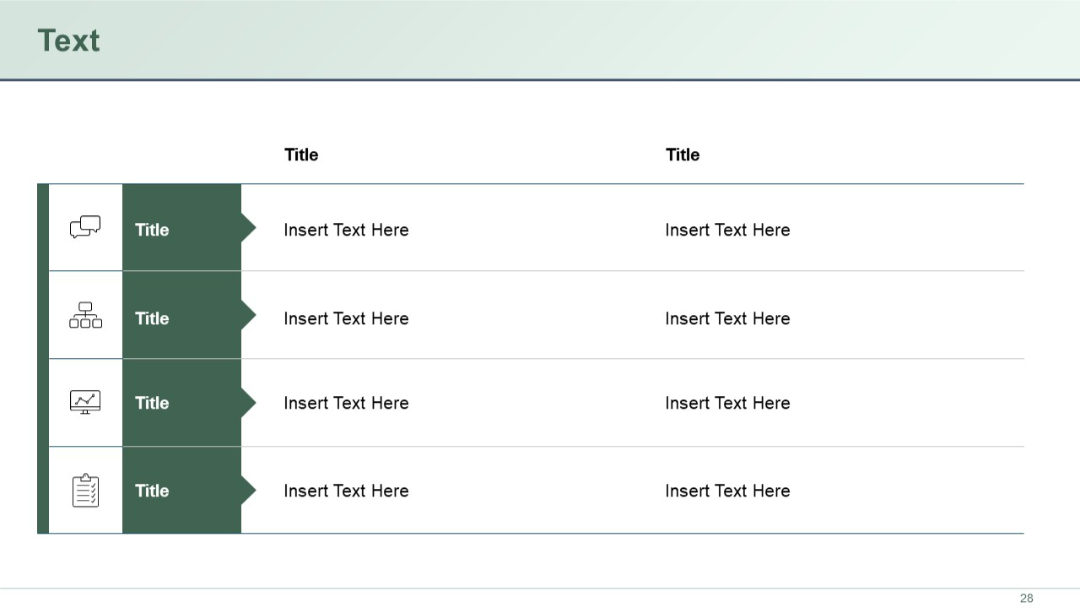
Two-column table with four rows. Each row features a left icon + title in dark green with corresponding text on the right in white space.
PRO
Donut-shaped circular diagram with six curved arrow-like segments and star icons, text positioned outside the circle.

PRO
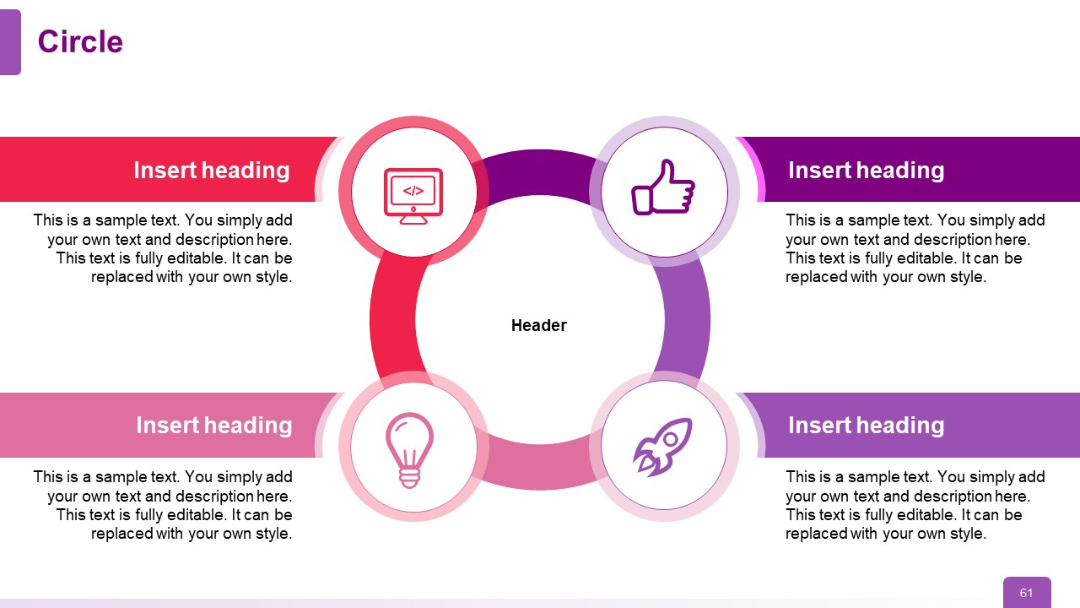
Four-segment circular infographic with icons inside circle nodes, connected to rectangular text boxes on each quadrant. Color-coded in red to purple.
PRO
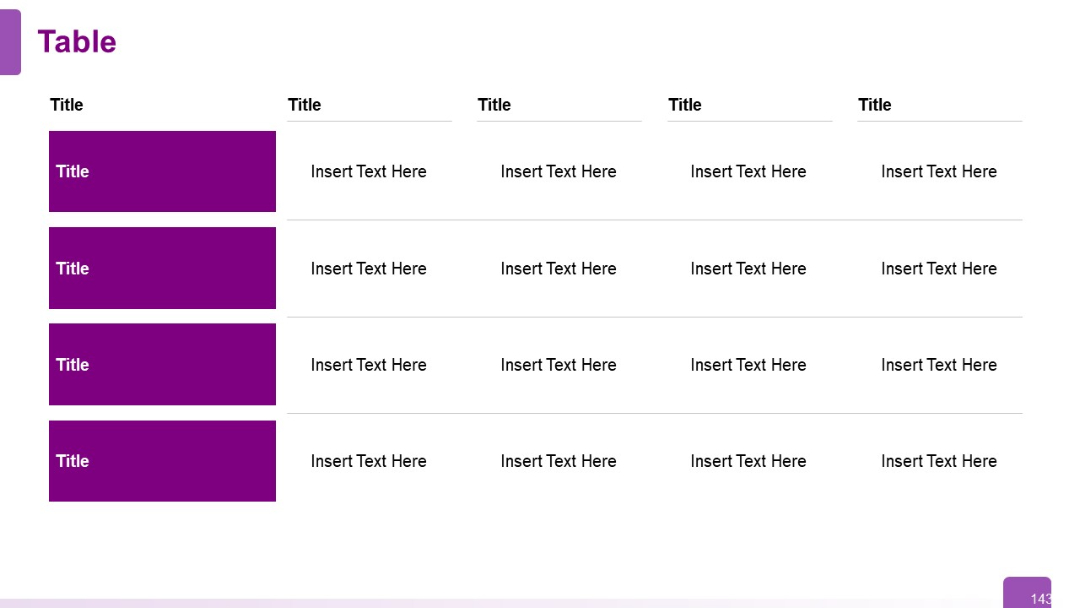
Four-row, five-column table. First column contains bold purple boxes as row headers; remaining cells are placeholders. Uniform structure.
PRO
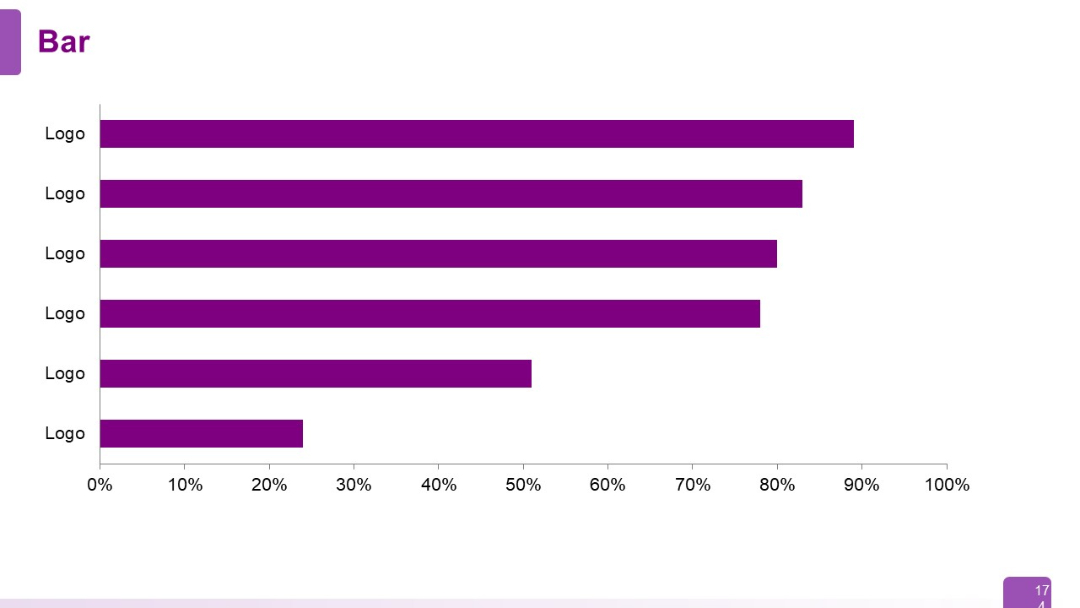
A simple horizontal bar chart with six uniformly styled bars labeled "Logo" on the Y-axis and percentage scale on the X-axis. No numerical data shown on bars.
PRO
5-column, 2-row table. Large dark left header with two data rows and ample space. Text aligned with consistent spacing.
PRO
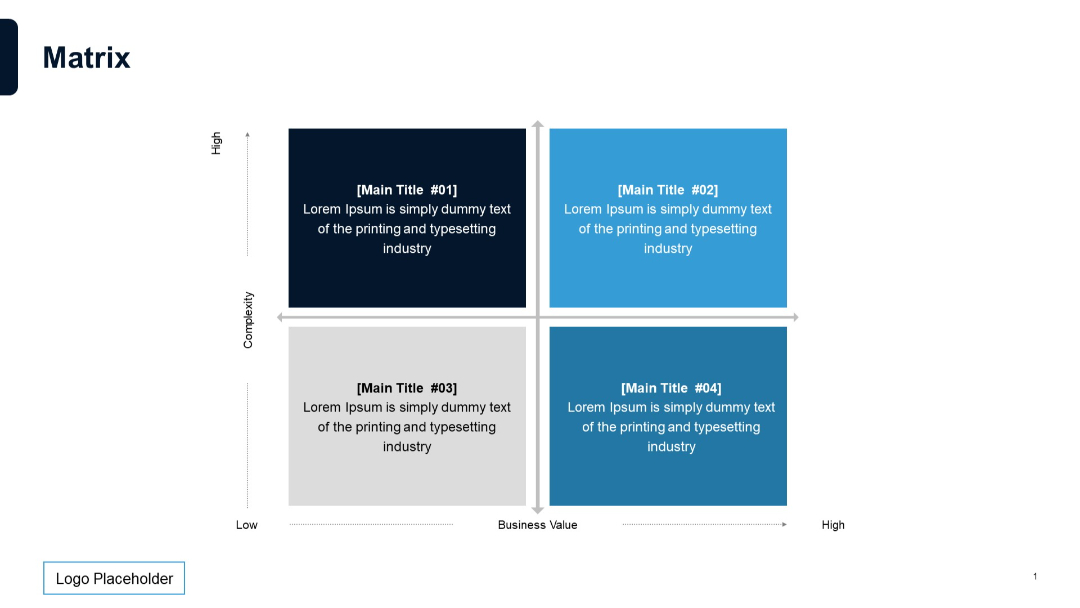
2x2 matrix layout with axis labels (Complexity vs. Business Value), quadrant blocks color-coded, each with title and description inside.
PRO
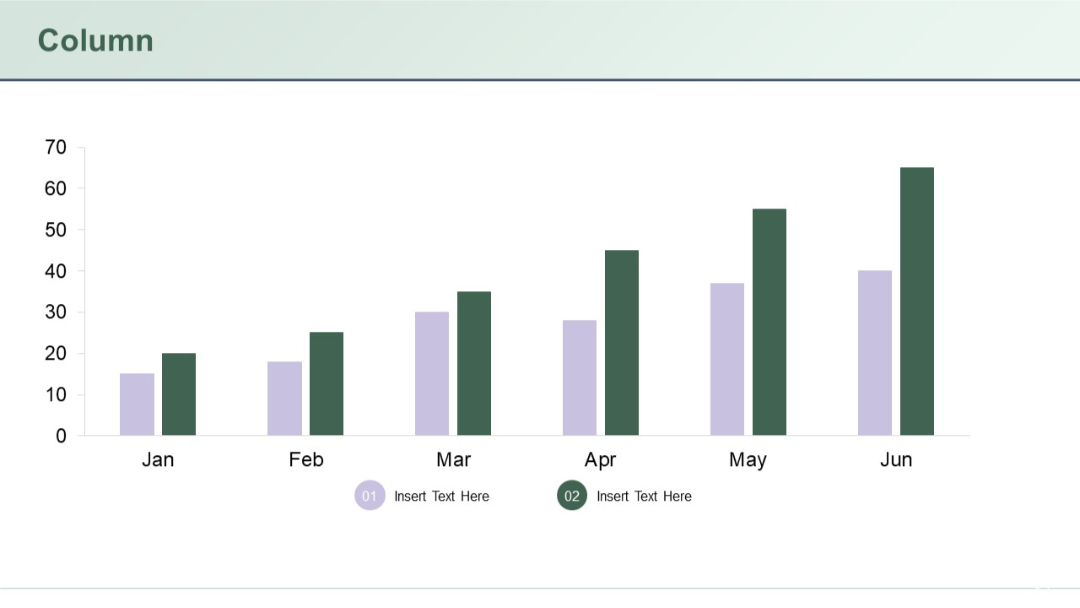
Dual bar column chart with data for six months (Jan–Jun) using two color-coded series. Minimalist layout with legends and captions below.
PRO
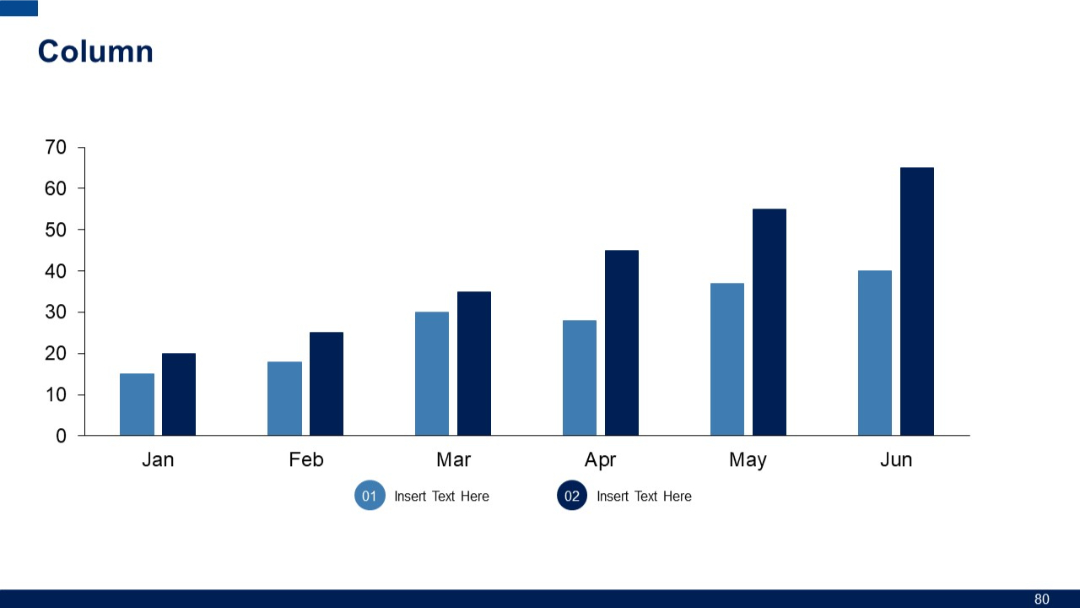
Vertical column chart showing data from January to June. Two data series are represented using varying shades of blue.
PRO
100% stacked vertical columns emphasizing proportional data breakdown. Labels marked by percentage on the x-axis.
PRO
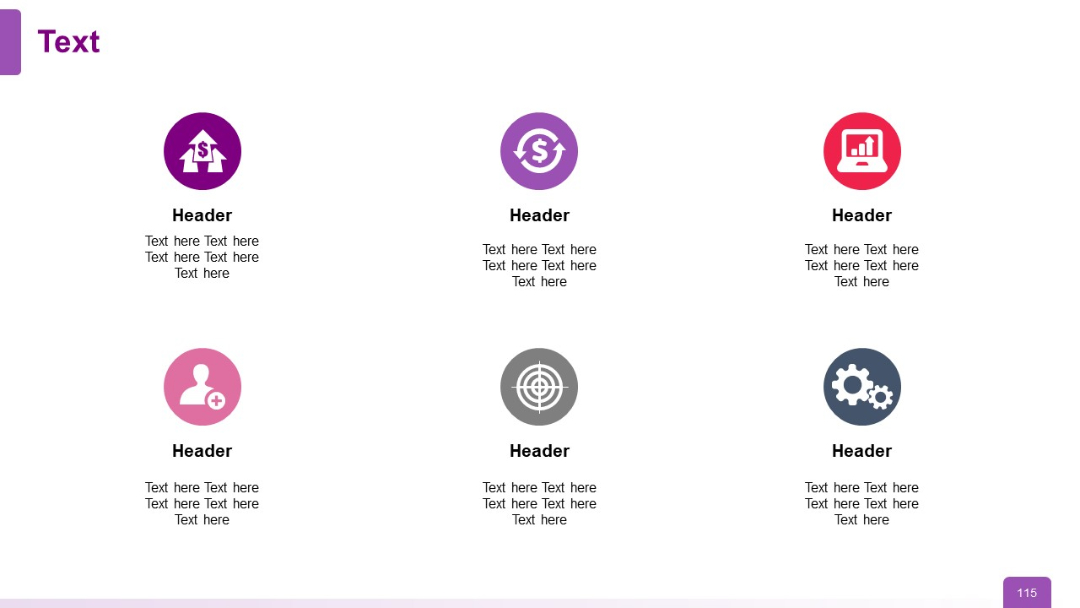
3x2 grid layout featuring circular icons above headers and descriptive text
PRO
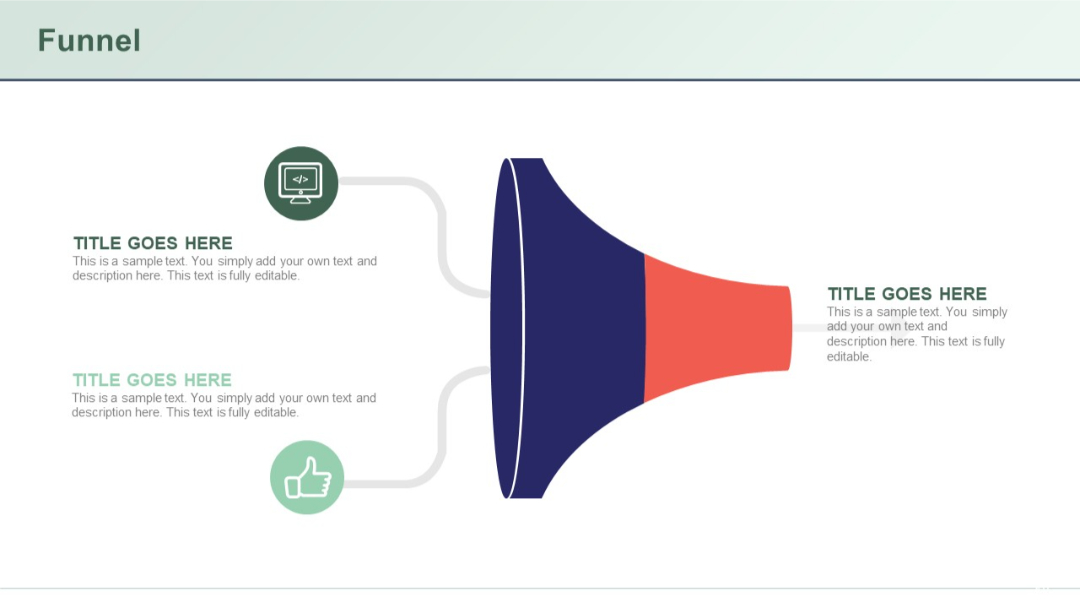
Horizontal funnel diagram with left-to-right flow, incorporating three icons and matching text labels on either side.
PRO
Four equal rectangular sections with headings for Strength, Weakness, Opportunity, and Threat.

PRO
Simplified horizontal timeline with year ranges, key phrases, and supporting text; visually streamlined compared to Slide 19.

PRO
8-row comparison table split into two segments, each with columns “Title” and “Slide No.” Header titles are highlighted in green and teal respectively.
PRO
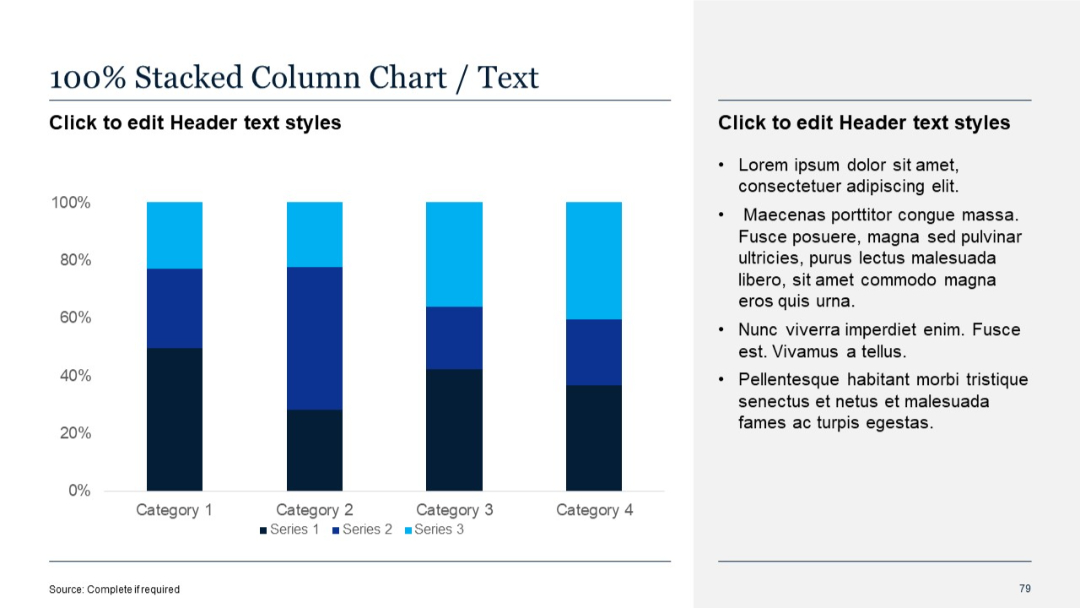
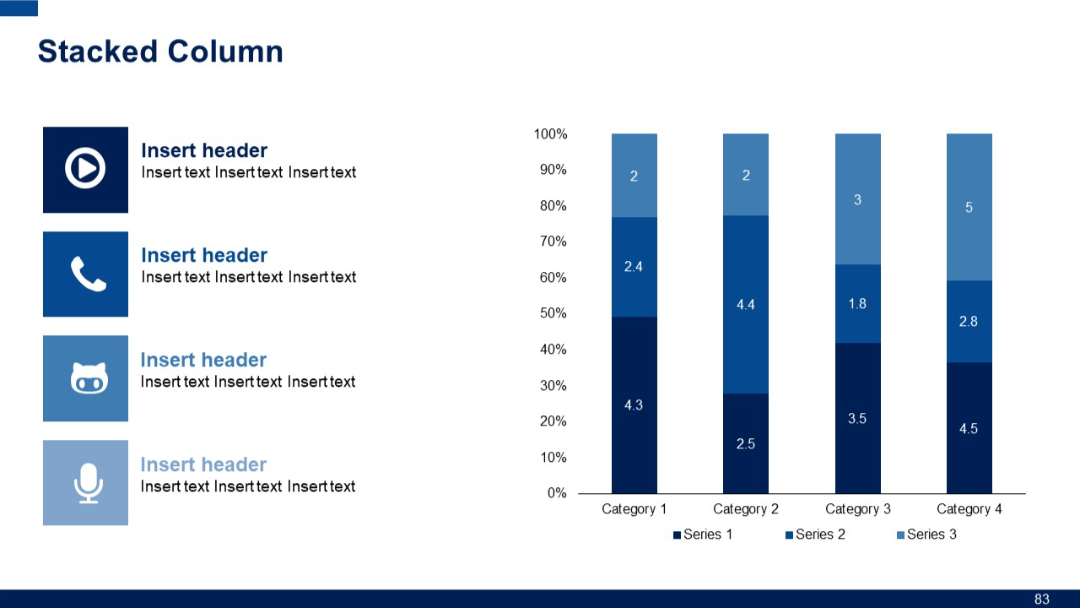
Left side features four icons with headers and subtext. Right side displays a 100% stacked column chart with value labels for three series across four categories.
PRO
Horizontal matrix-style table with 2 rows and 6 columns; top row has blue headers, first column on left is shaded vertically for row titles.

PRO
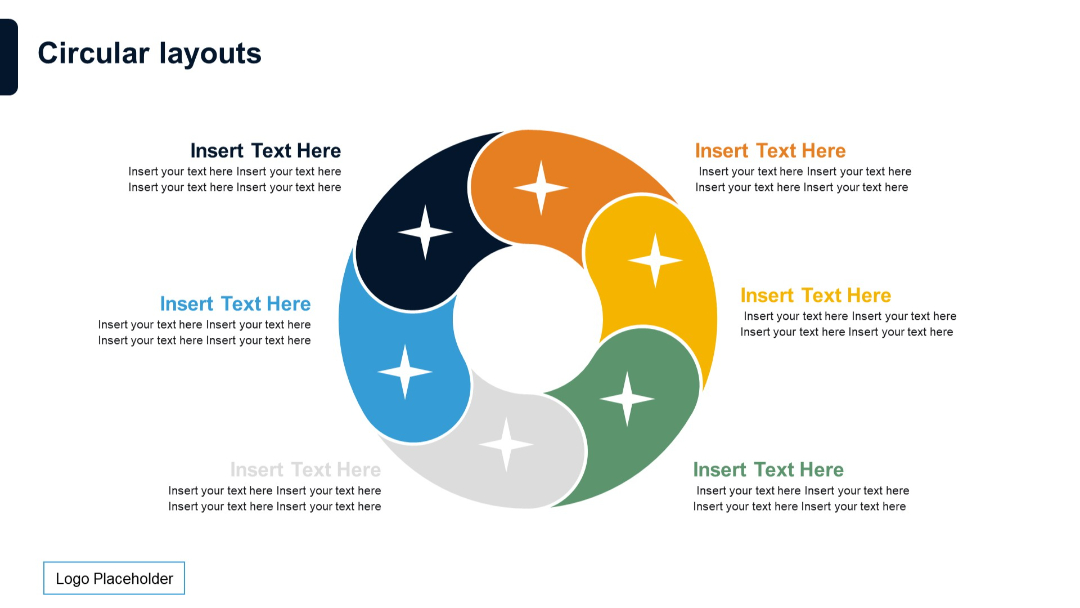
A circular, petal-style layout with six segments and surrounding editable text boxes. Each segment is color-coded and includes a visual marker.
PRO
Circular loop diagram with four inward arrows in a segmented ring, surrounded by four circular icons and corresponding text boxes. Balanced layout.

PRO
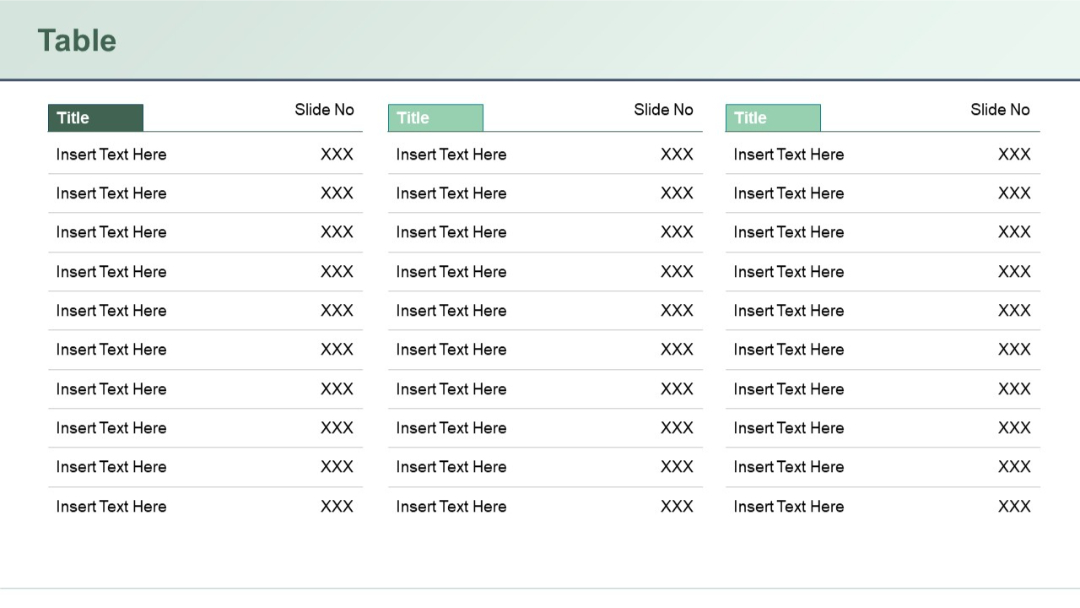
Three-column table layout repeated in three vertical sections. Each column has a "Title" header and rows with placeholder text entries labeled “Insert Text Here.”
PRO
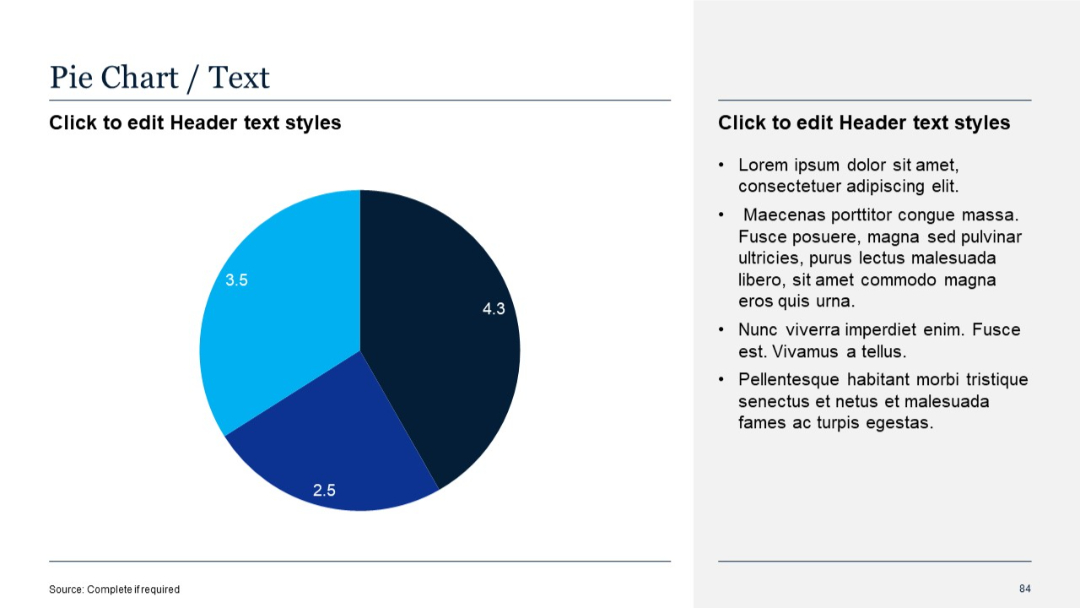
Left-aligned pie chart with numeric labels; text section on the right
PRO
Five vertically hanging arrow elements shaped like banners with cog icons, each numbered and color-coded, aligned horizontally with space for corresponding text.
PRO
Grid layout of four quote boxes, each with opening quotation marks and placeholders for content. Rounded boxes and soft purple accents suggest approachability.

PRO
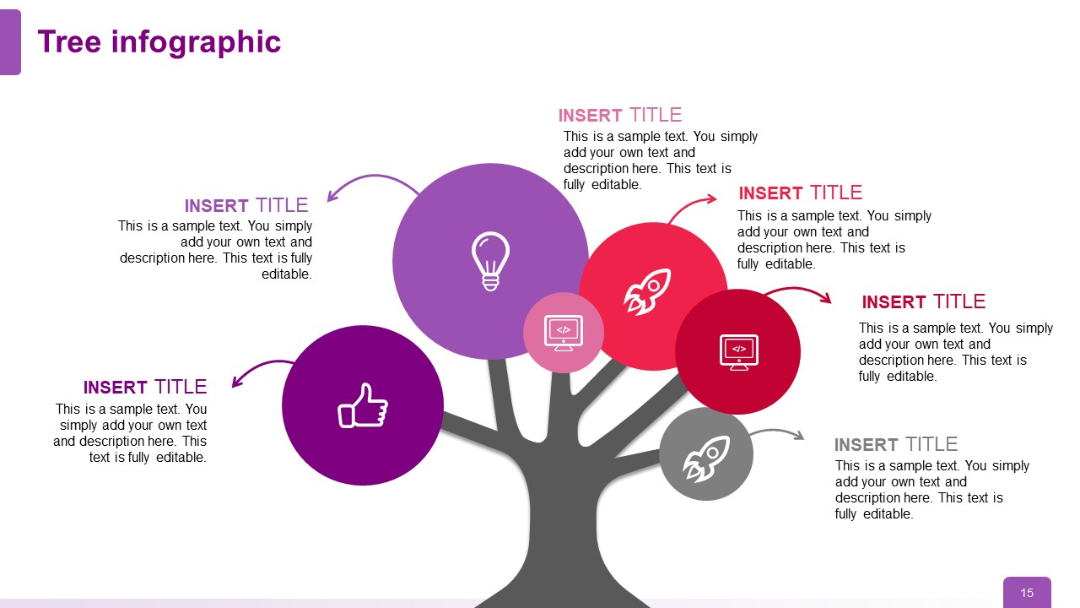
Six icons arranged symmetrically on the tree (lightbulb, rocket, thumbs up, computer, computer, rocket); vibrant and varied color scheme adds contrast.
PRO
Speech bubble icons aligned vertically with alternating large text and smaller subtitles. Red header title bar on top.
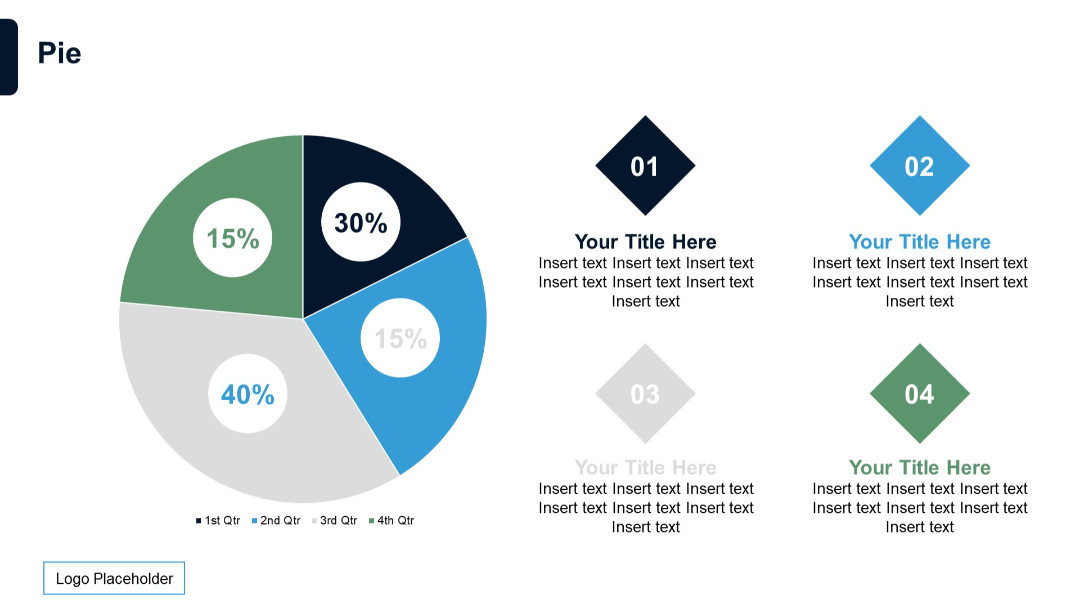
PRO
A circular pie chart divided into four segments (15%, 30%, 40%, 15%) with color-coded quarters. On the right, four numbered diamond shapes with text placeholders.