PRO
Agenda slide with grid layout (3x3). Each block labeled numerically (01 to 09) with bold “Agenda” title and placeholder text below.
PRO
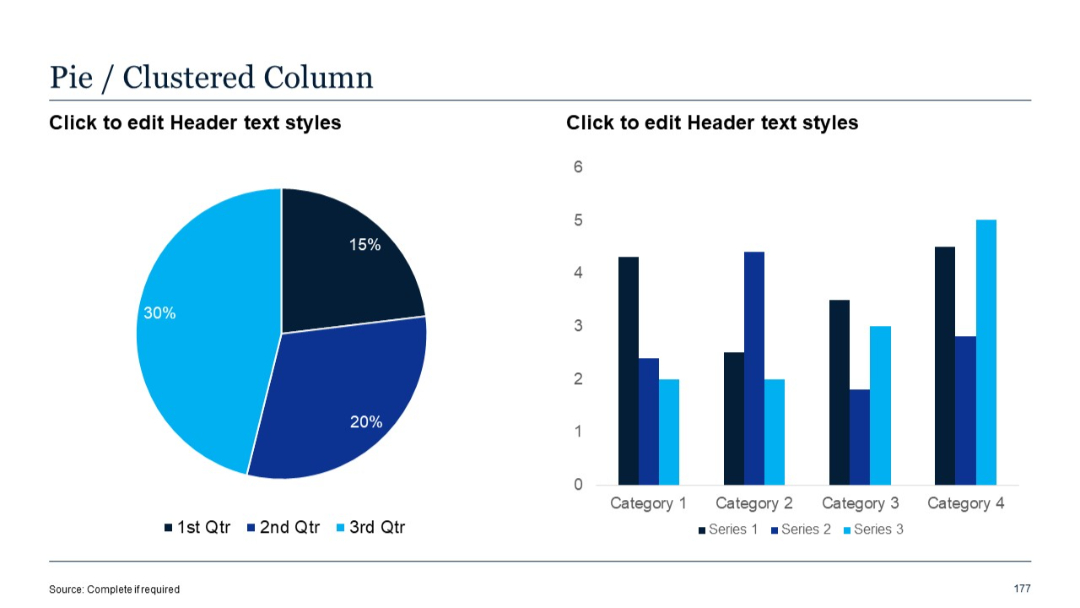
Pie chart on the left with a clustered vertical bar chart on the right with three series per category.
PRO
Four circular icons in a closed loop around a central white space; each icon has corresponding header and text blocks on the outer side.

PRO
Two-column comparison layout with large “VS” circle in the center; headers and text on both sides.
PRO
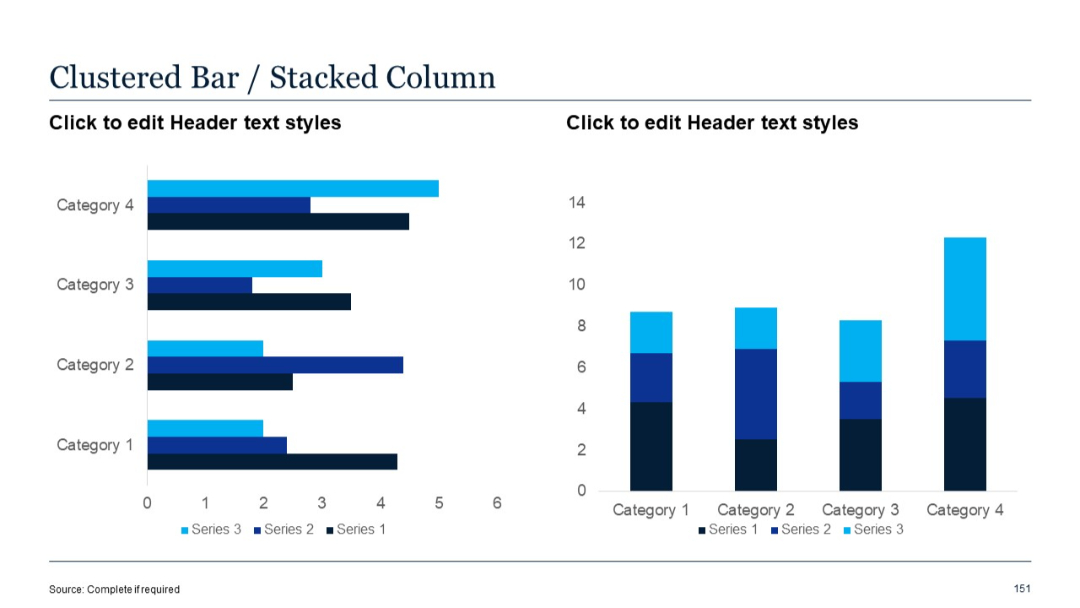
Two charts: horizontal clustered bar on left, vertical stacked column on right. Categories are labeled and use 3 series in varying shades of blue.
PRO
Four-quadrant layout with title headers and images representing different business areas. Icons and short descriptions accompany each section.

PRO
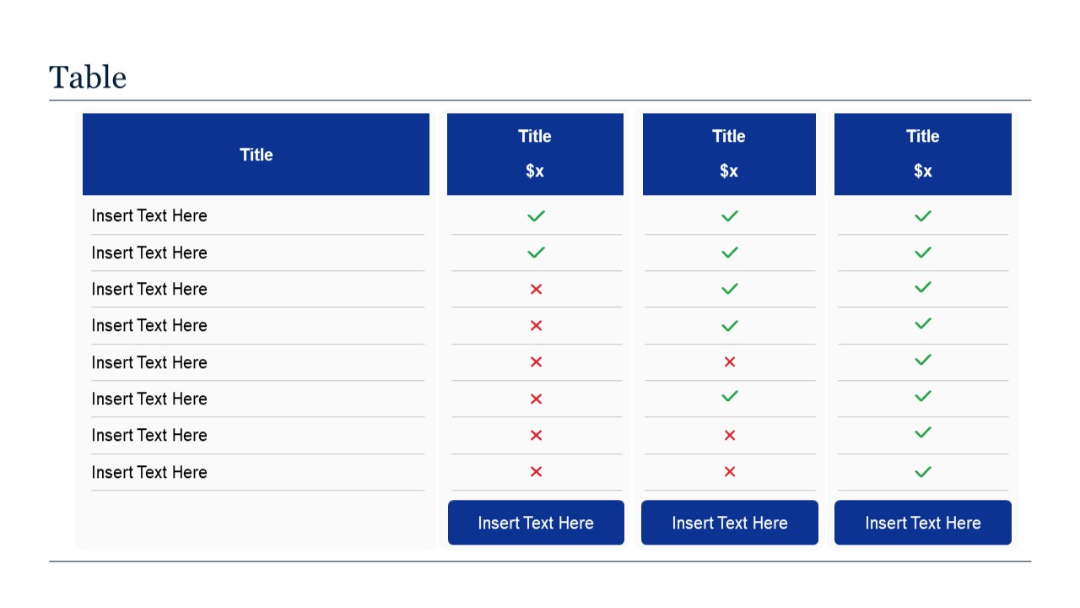
A 4-column vertical comparison table with one left-aligned features column and three offering columns using checkmarks/crosses for each feature.
PRO
Grid layout of 5 rows of minimalist line icons in purple; icons represent arrows, navigation directions, and basic UI actions like play, check, etc.
PRO
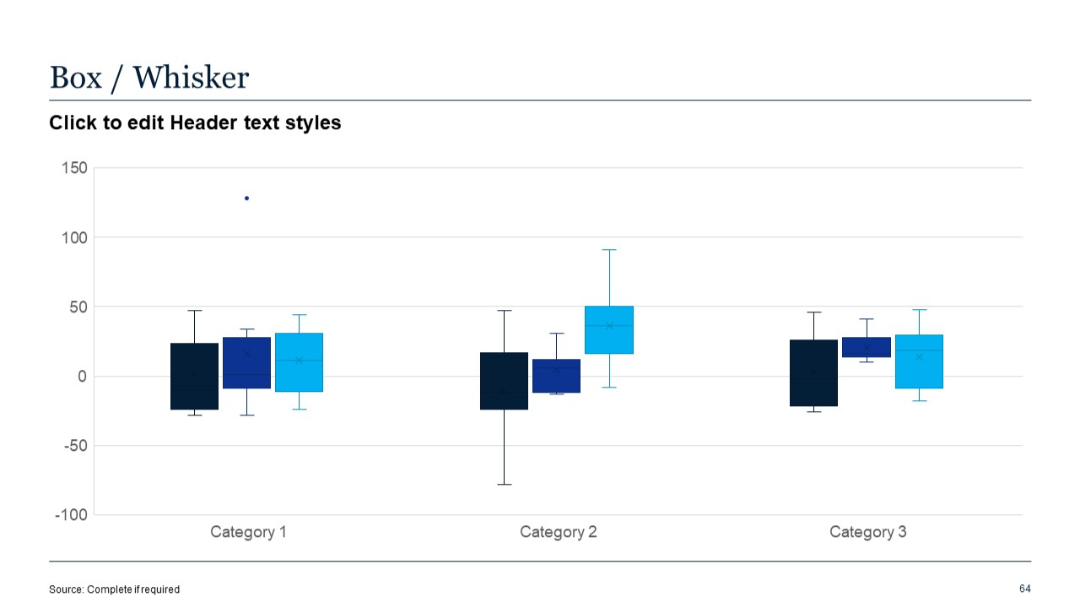
Box-and-whisker plot with three category groups and color-coded series; grid background.
PRO
Grid layout with 3 blocks on top, 3 on bottom; consistent iconography and modern font; clean division with blue numbers.

PRO
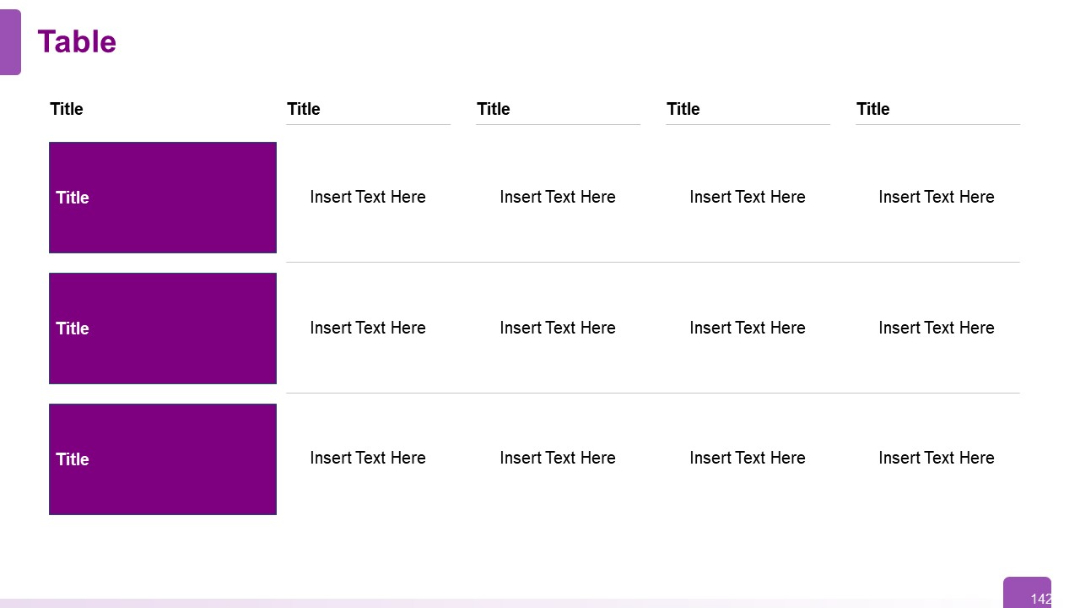
Three-row, five-column table with bold purple boxes in the first column. Gridlines and equal column widths create a clean visual hierarchy.
PRO
Horizontal bar chart with monthly data (January–December) on the left; right side contains placeholder for title and description.

PRO
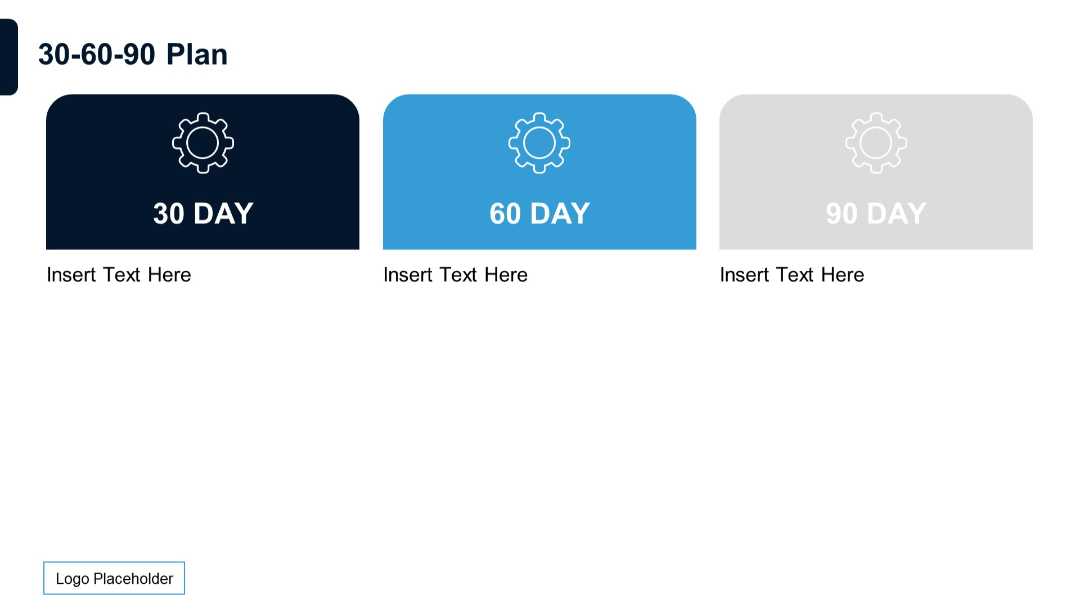
Three horizontally aligned rounded boxes labeled 30, 60, and 90 DAY, each with an icon and placeholder text below.
PRO
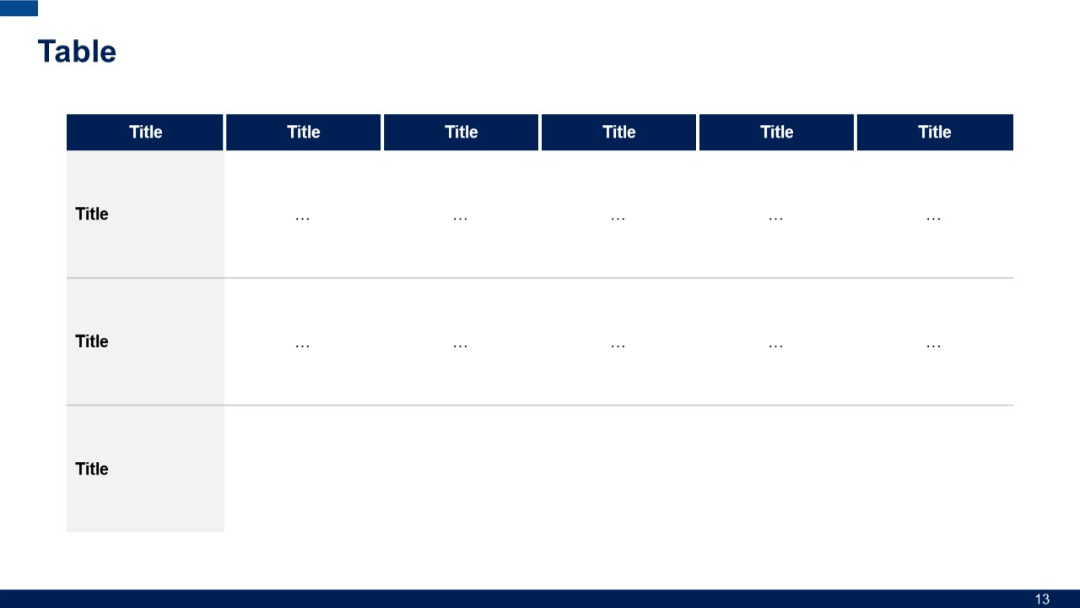
A horizontal table with a top header row in blue and two data rows. Leftmost column is wider for row titles. Grid lines separate sections and includes three rows for entries. Header is blue; cells have dotted placeholders.
PRO
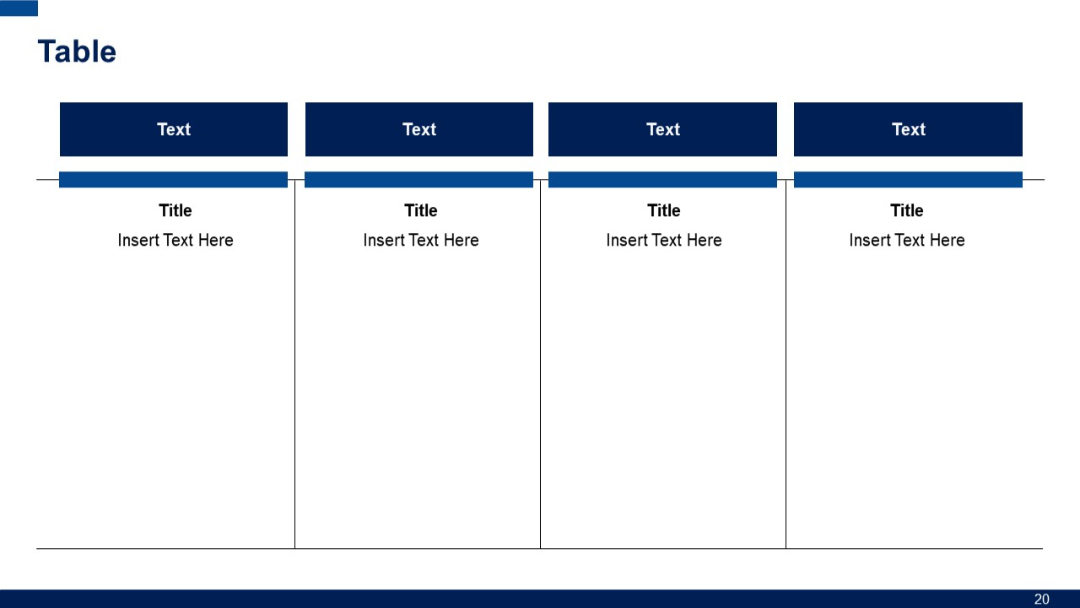
Four vertical sections with bold blue headers ("Text") and titled areas underneath. Clear segmentation with dividing lines between sections.
PRO
Vertical list with left-colored blocks (each with icons) and right-side bullets under a "Header" label. Flat two-column layout.

PRO
Three-column layout with vertical segmentation; each column includes a blue header and a title with text below. Visually separated into three blocks.
PRO
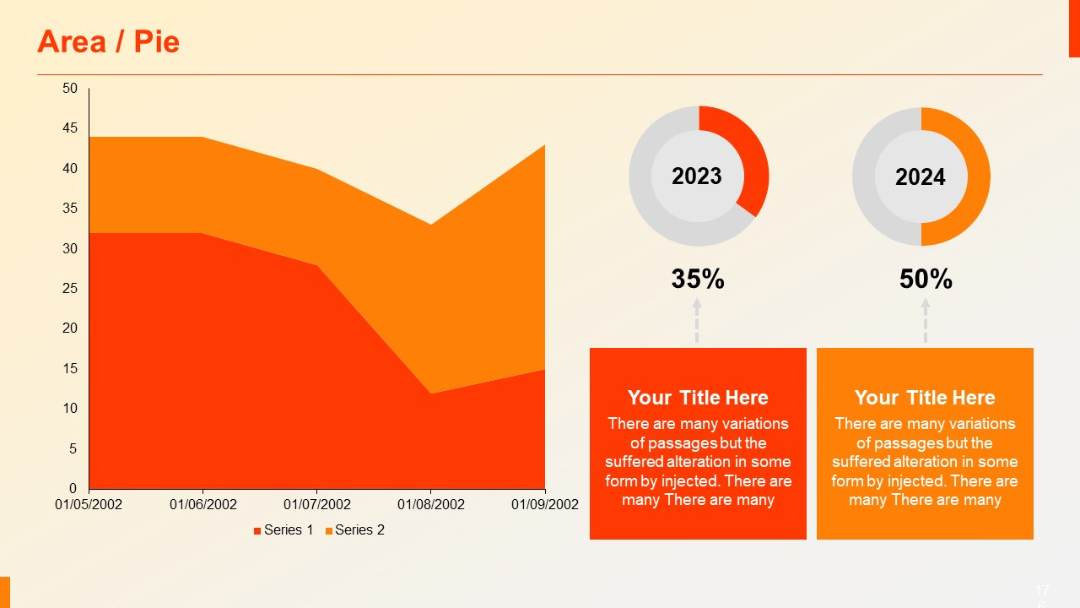
Combo slide: Left side shows an area chart, right side displays two donut pie charts with year and % (2023: 35%, 2024: 50%). Text boxes below each chart.
PRO
Similar to slide 41, with a fifth block added in the bottom-right corner; consistent visual structure and icons; bold blue numerals and dark text.

PRO
Grid of six outlined rectangular boxes with top-left numeric tabs and titles, arranged in two rows.
PRO
Basic area chart with two data series (Series 1 and Series 2) using red and orange fill. X-axis shows dates; Y-axis shows numeric values.

PRO
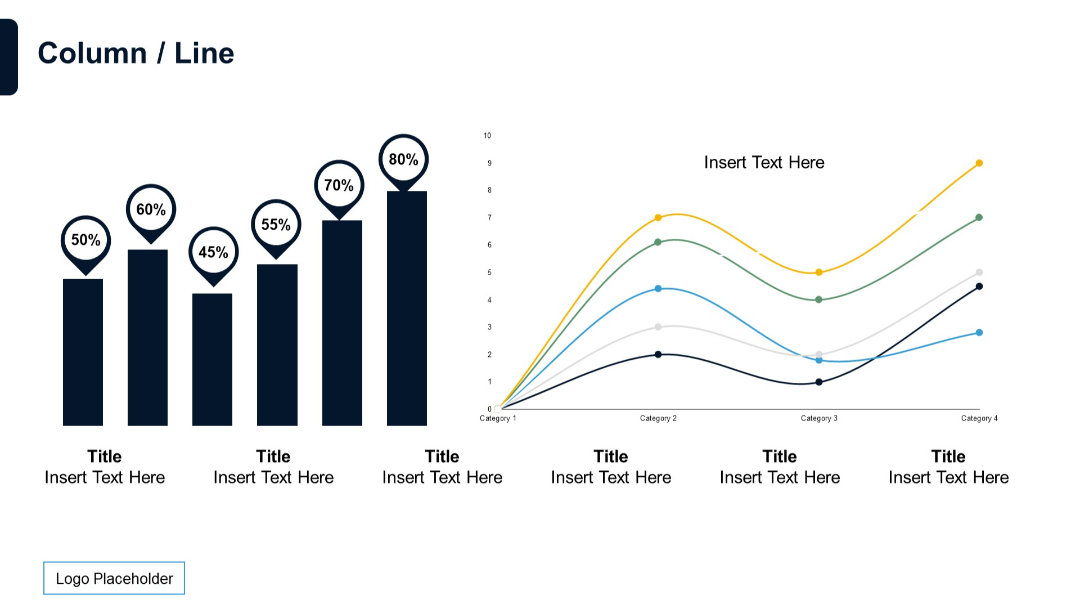
Combination of a column chart with value indicators and a multi-series line chart. Dual-panel layout.
PRO
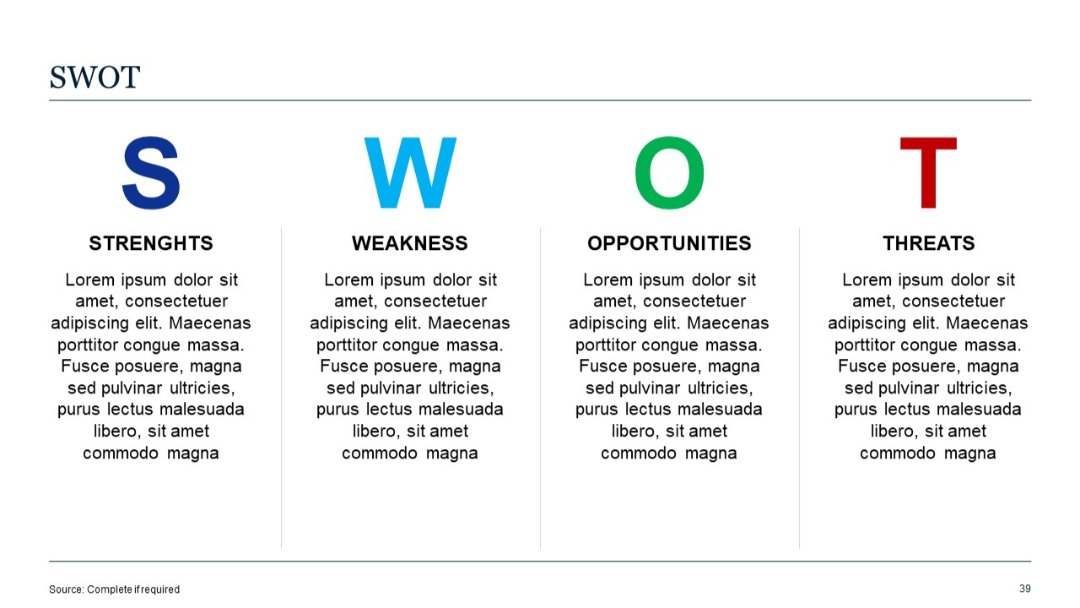
Four quadrants labeled Strengths, Weaknesses, Opportunities, and Threats, each with sample placeholder text. Large “SWOT” letters on top.
PRO
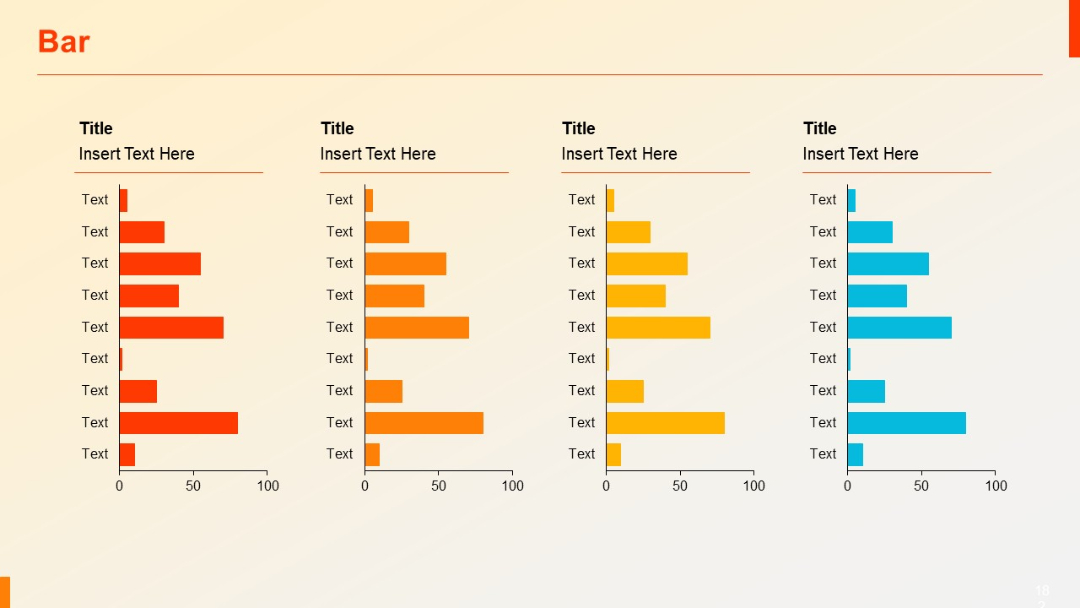
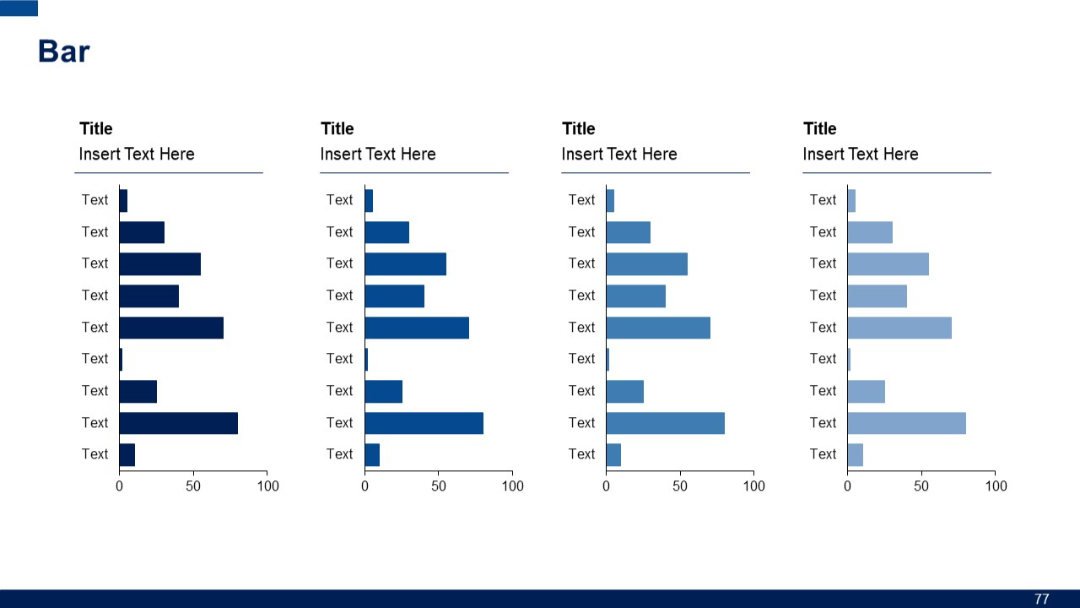
Four horizontal bar charts arranged in columns, each with a title above and x-axis ranging from 0–100, with varying shades of orange and blue.
PRO
World map centered with labeled placeholder texts. Left vertical sidebar for notes. Simple, grayscale layout.
PRO
Four grouped vertical bar charts with mirrored labels. Each group has its own title and placeholder text beside it.
PRO
Single large speech bubble with quotation marks and placeholder text.

PRO
Wide top funnel narrowing down to base with five icons and aligned text on both sides. Strong blue-themed vertical gradient.

PRO
Curved vertical timeline with circular nodes and lines connecting four titled segments. Gradient fill and bold colors are used.

PRO
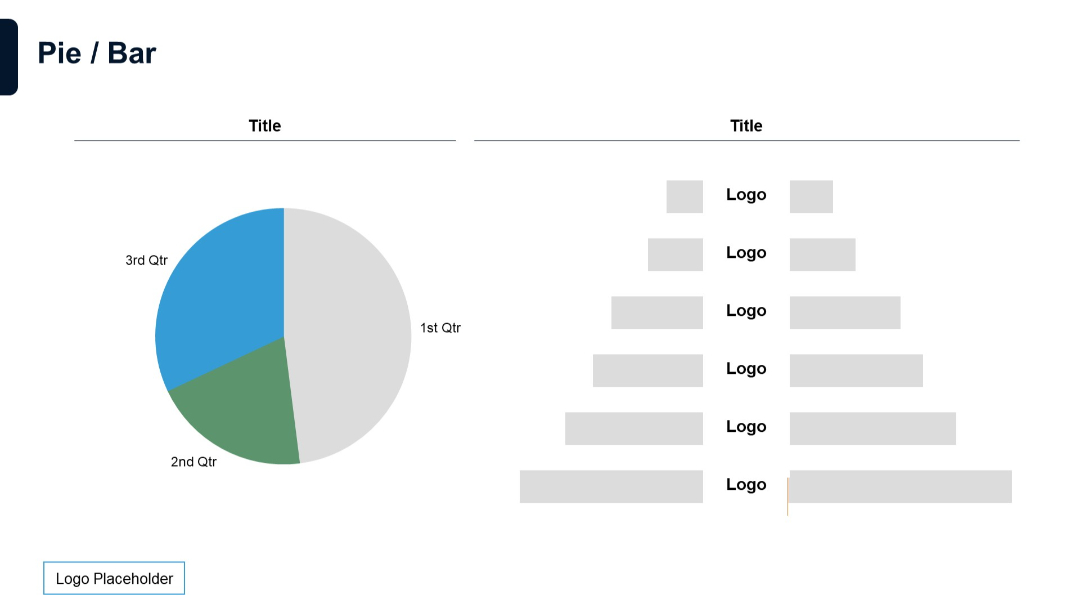
Left side shows a pie chart; right side includes labeled horizontal bars with placeholders.