PRO
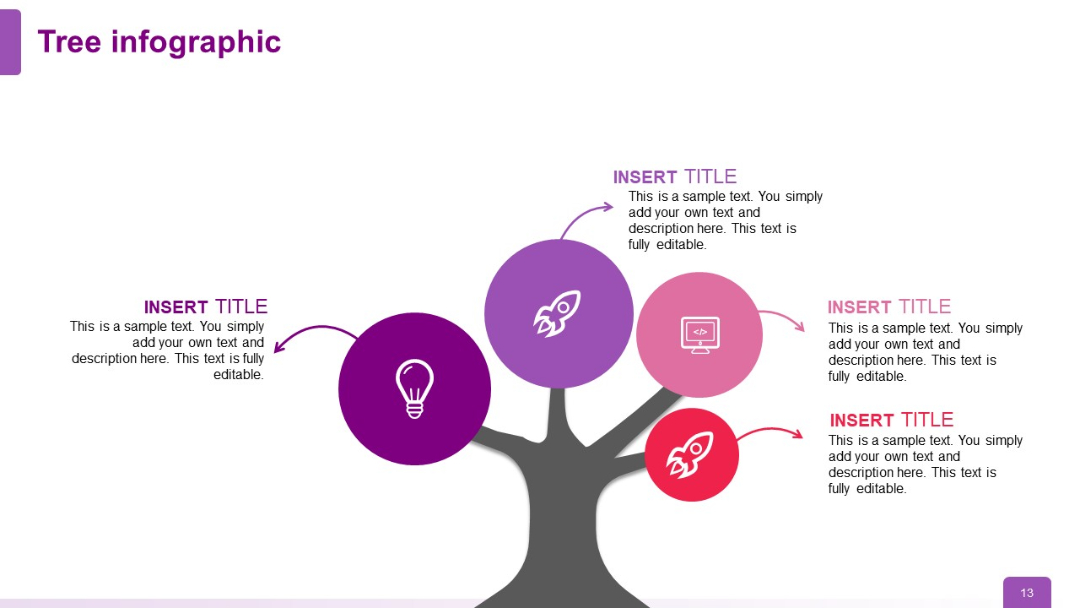
Enhanced version of the tree diagram with four icons (lightbulb, rocket, computer, rocket) branching out across various limbs of the tree structure.
PRO
Grid of minimalist directional and functional icons on white background; icons include arrows, checkmarks, refresh, and navigation symbols.
PRO
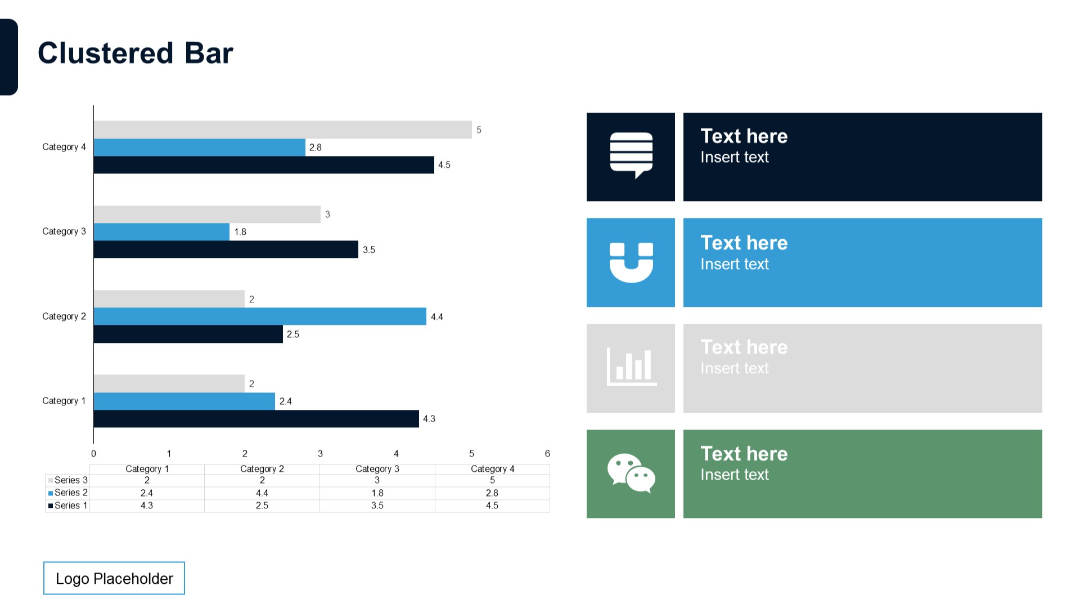
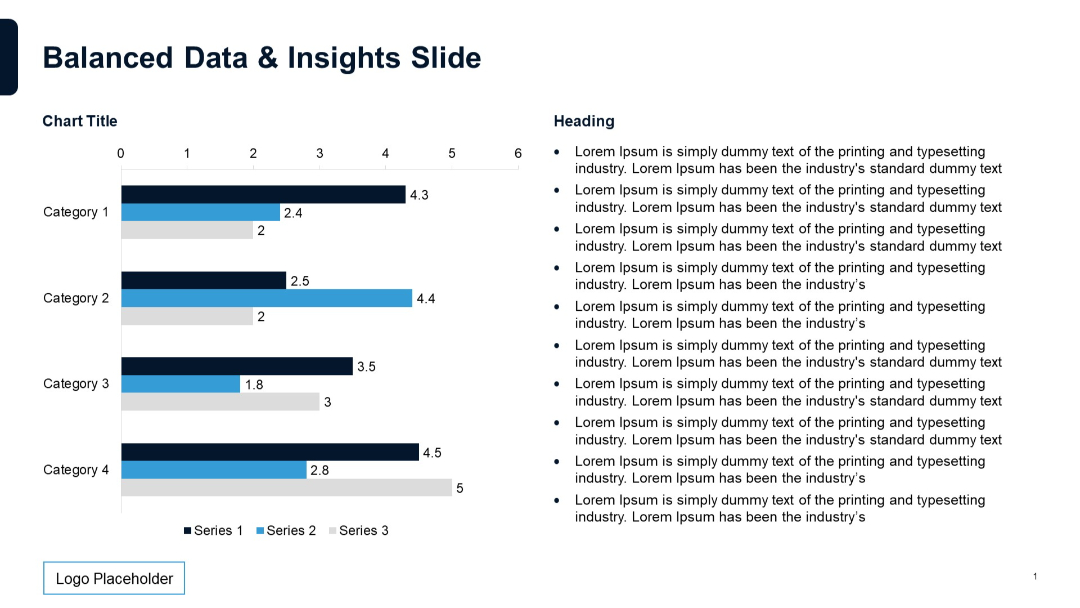
Clustered bar chart on the left comparing three data series across four categories. Right side features colored text boxes with icons and labels.
PRO
World map with highlighted countries; each region is linked to a specific transformation domain via icons and text callouts.

PRO
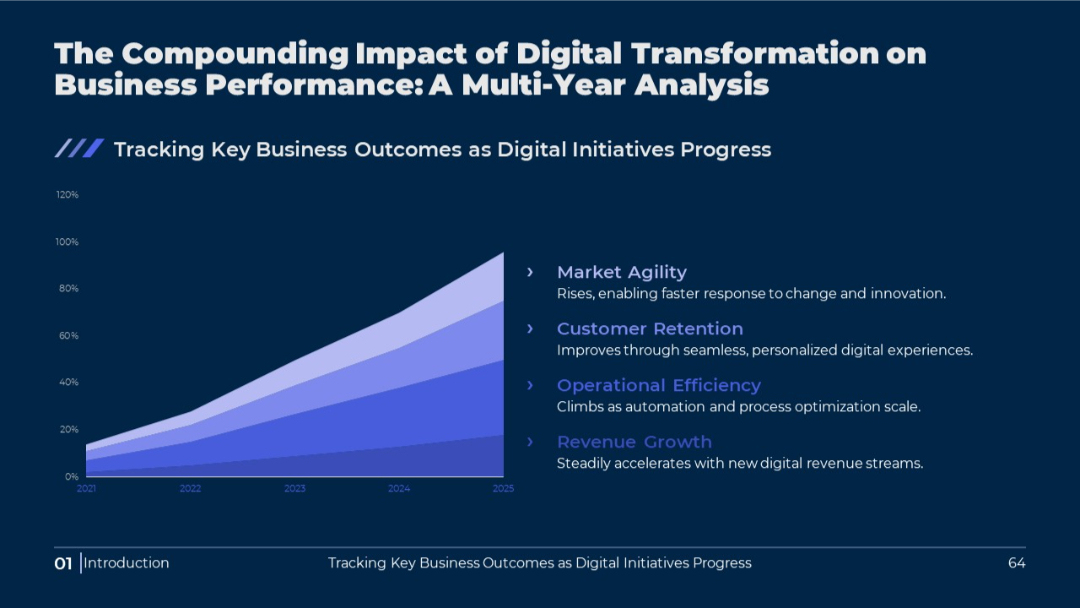
Dark background area chart with four stacked performance layers and labeled growth drivers. White and blue color theme for text and data layers.
PRO
Six-pointed star layout with matching headers and icons surrounding a central shape. Text sections aligned with each icon.
PRO
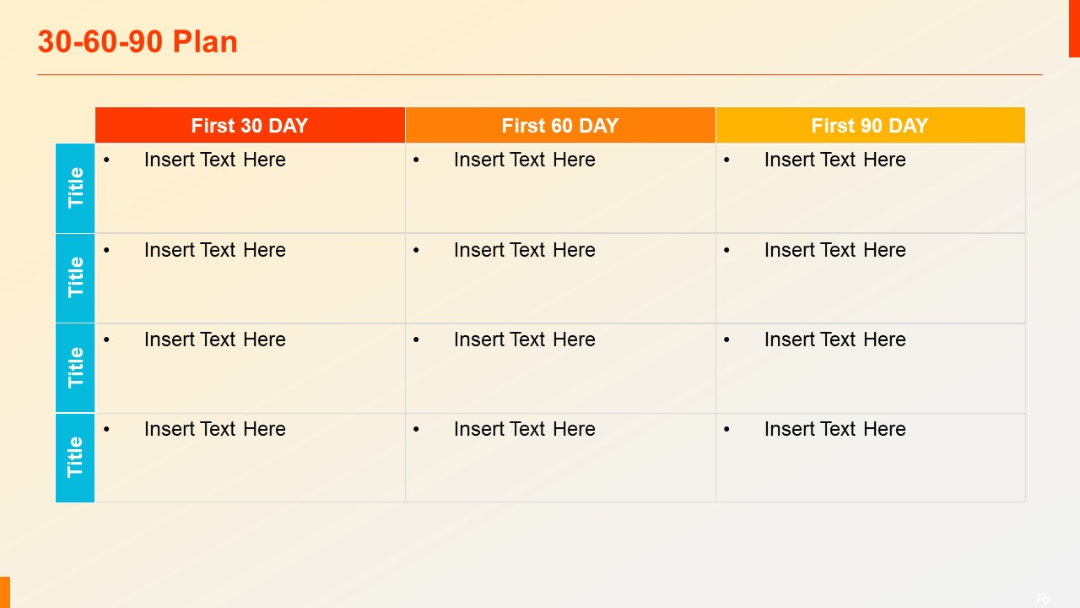
Grid table with rows for tasks and three columns for 30, 60, and 90-day activities.
PRO
Two-row table with four columns of placeholder text and bold blue title cells on the left. Minimalist grid structure.
PRO
Balanced 3x2 grid plus one bottom-right block; uses consistent icon set and blue highlight colors; numbered flow.

PRO
Mixed business, communication, and growth icons in red outline. Includes graphs, targets, emails, speech bubbles, and idea bulbs.

PRO
Simple line chart with three data series, point markers, and labeled data points; neutral white background and light grid.

PRO
Large “Q” and “Answer” text with plug-to-lightbulb metaphor line design. Subtitle and bullet list below. White background with blue icons.
PRO
Four rectangular content blocks with numbered sidebars (01–04) in two rows, alternating colors.
PRO
Horizontal bar chart similar to Slide 31; consistent styling; placeholder bullets on the right.
PRO
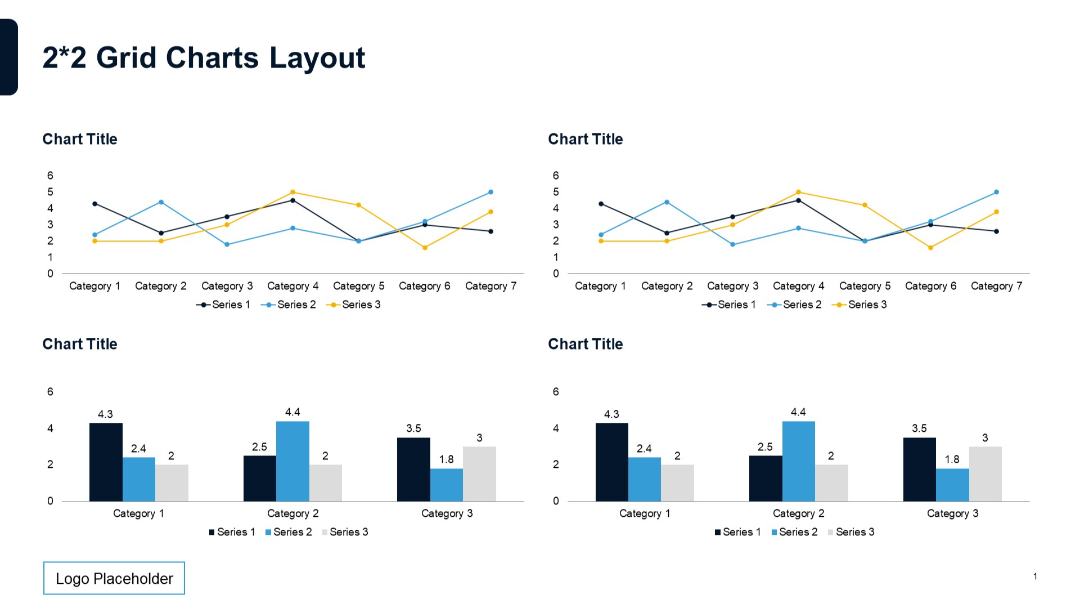
2x2 grid of charts, with top charts as line graphs and bottom as bar charts. Equal spacing, titles above each. Standard 3-series format.
PRO
Symmetrical layout with two side boxes connected to a central circle. All elements contain placeholder text.
PRO
A five-node interconnected circular network using diverse icons (rocket, thumbs up, code); bullet list on the right.

PRO
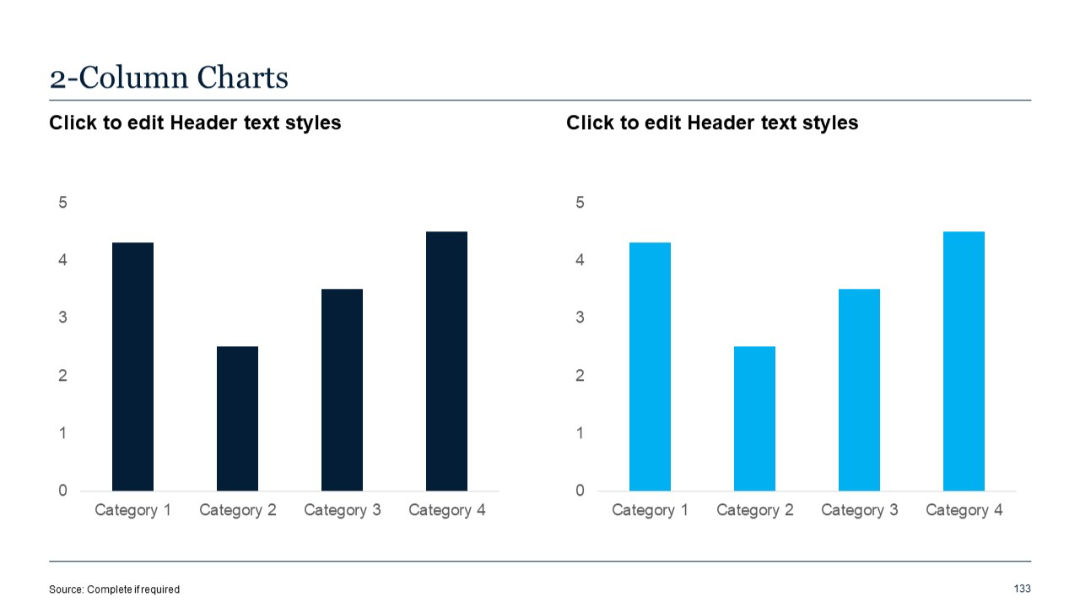
Two vertical column charts side-by-side. Left chart uses dark blue; right chart uses cyan blue. Each bar represents one value per category.
PRO
A semi-circle with 6 evenly spaced segments containing icons and text placeholders. Gradient color scheme transitioning from purple to grey.

PRO
Title slide with a modern diagonal design split between a white bottom half and a deep blue top half; includes a placeholder for the title.

PRO
Full-width line chart showing three lines over 8 quarters (Q1 2020 to Q4 2021). Minimalist style with labels and title.

PRO
Four interlocking circles arranged in a square pattern, each labeled 01–04. Titles and descriptions surround the layout on each side.
PRO
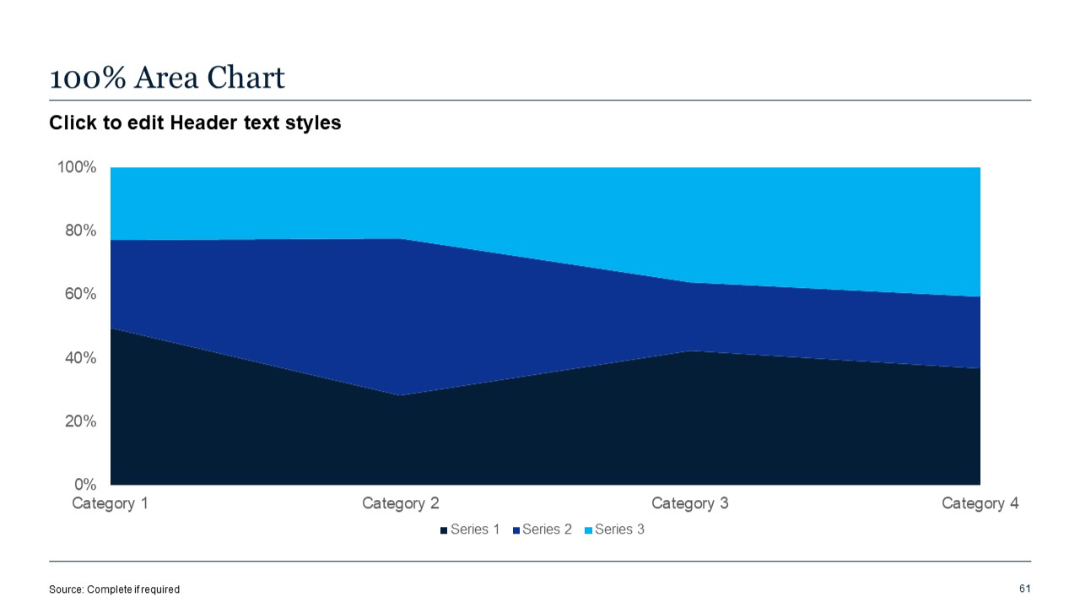
Horizontal area chart with three stacked color bands; clean layout with axis labels and legend.
PRO
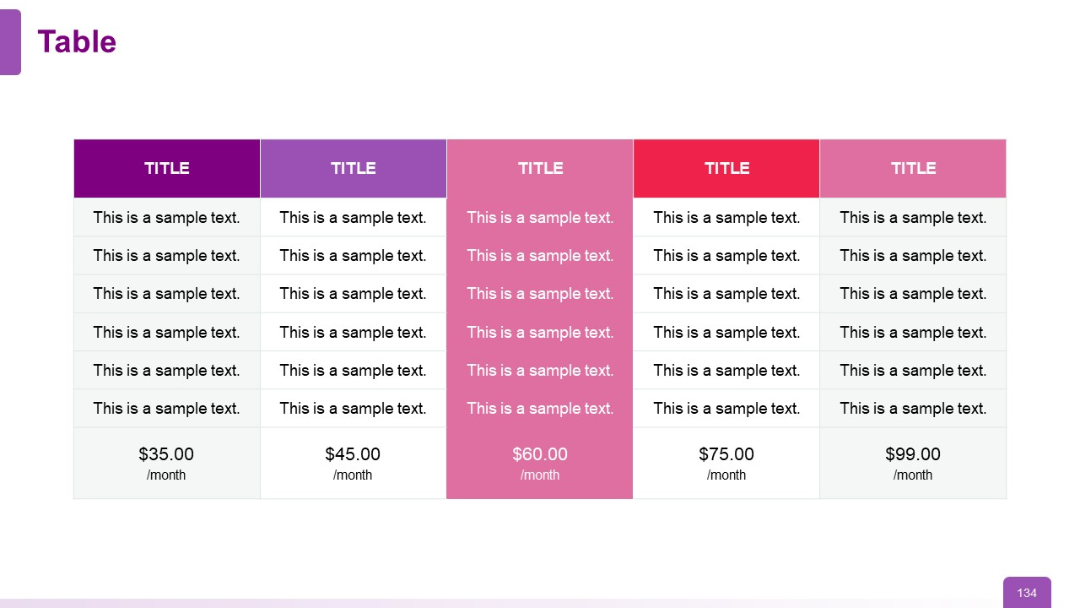
Multi-column pricing table with each column in a different color (purple, pink, red, etc.). Pricing prominently displayed at the bottom of each column.
PRO
Dark full-screen slide with central horizontal line ending in a circle, modern visual indicator.

PRO
A classic waterfall chart with columns labeled from Category 1 to 8, indicating increases, decreases, and totals through color-coded bars.

PRO
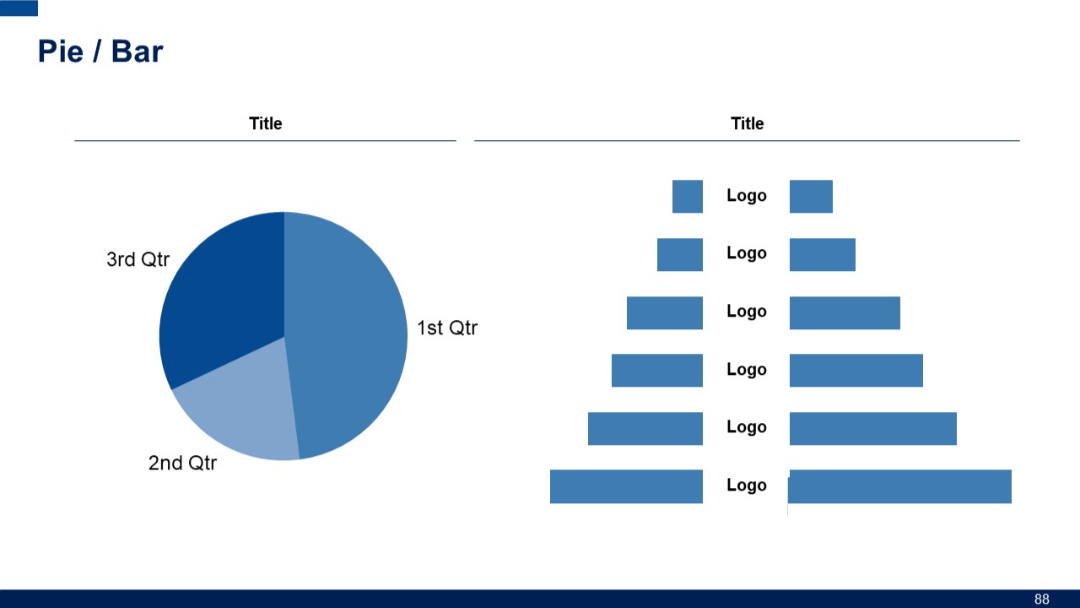
Left: Pie chart with three segments labeled by quarter. Right: Pyramid-like bar chart showing bars with logos, decreasing in width as they go up.
PRO
A ring of eight small circular nodes with red star icons, surrounding a central “HEADING” label. Text blocks are on both left and right sides.

PRO
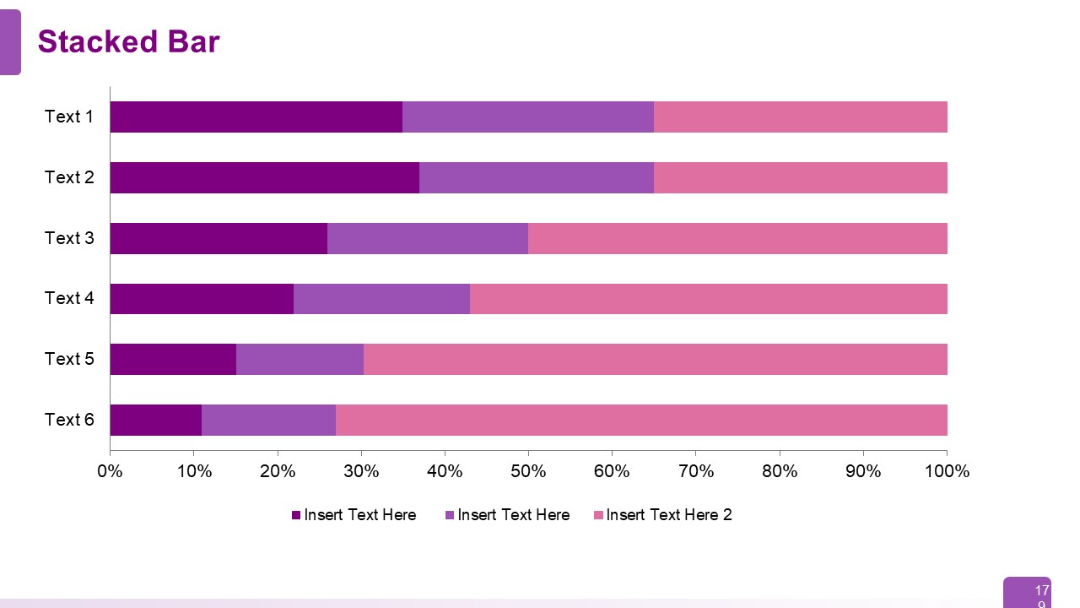
Full-width horizontal stacked bar chart with six rows (Text 1–6). Each row contains three colored segments labeled with placeholder text.
PRO
One-column layout with large bold headline and subheading followed by three paragraphs of body text. Text-heavy slide with a focus on storytelling. Consistent dark blue and black typography on white background.