PRO
A further expanded version of the previous table layout. Now includes four rows and four columns.
PRO
Five colorful circular icons arranged in a pentagon shape; each with heading and text. Balanced and symmetrical layout.
PRO
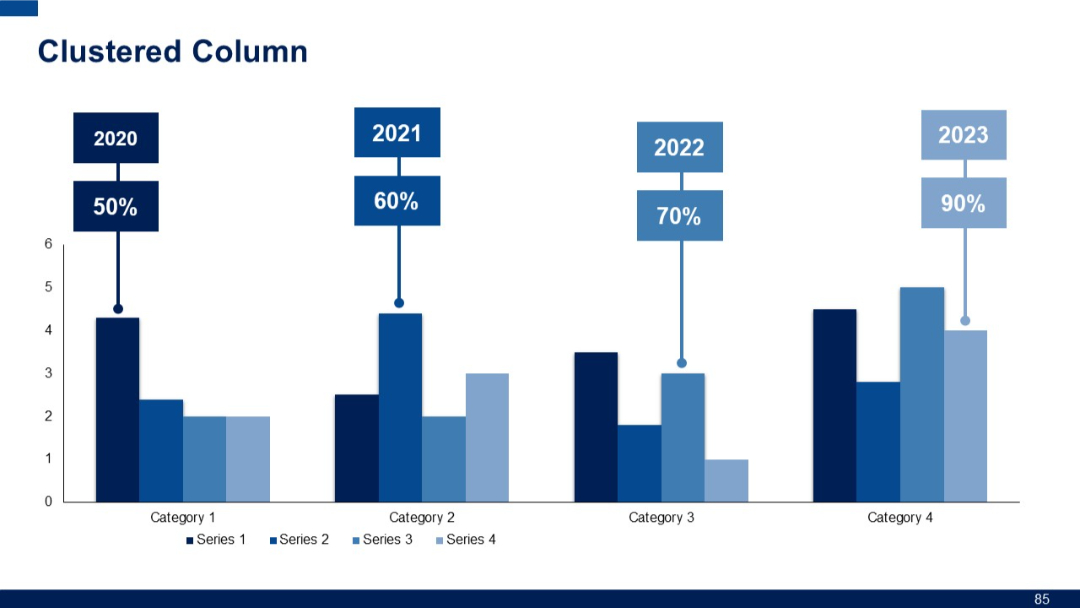
Clustered column chart with bold year and percentage labels above data points. Color-coded series including a fourth series.
PRO
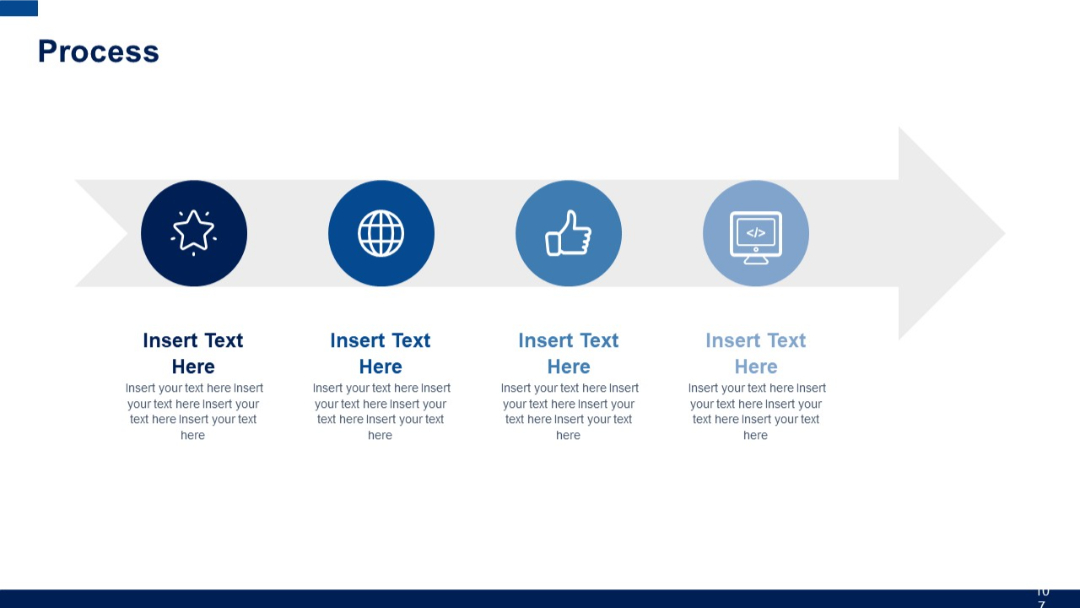
Horizontal arrow with four circular icons, each followed by a bold title and multiline placeholder text beneath.
PRO
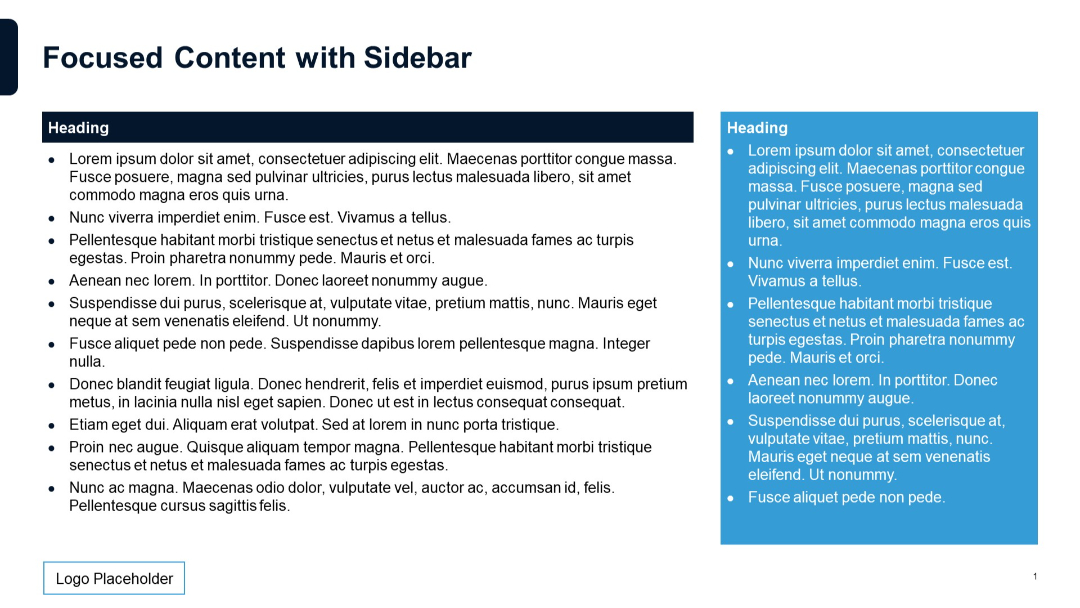
Same layout as previous but sidebar is more visually prominent with a bold blue background.
PRO
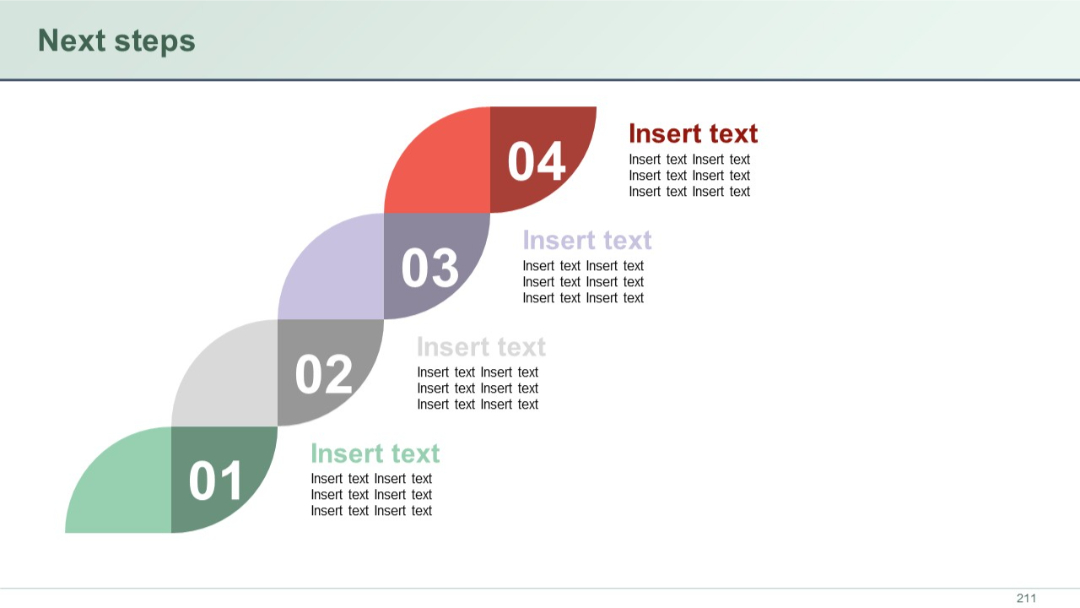
Four overlapping rounded arrow blocks in a diagonal step layout, each numbered and colored differently (green, gray, purple, red), with placeholder text beside them.
PRO
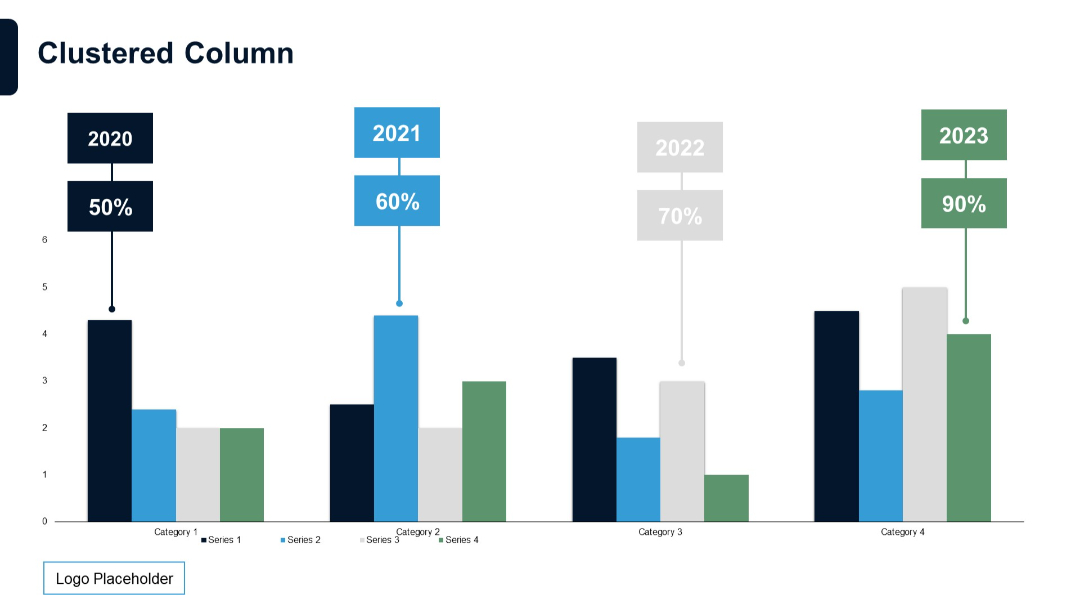
Clustered column chart across four categories with callout boxes above each column indicating year and corresponding percentage.
PRO
Two-column checklist layout with purple headers and check icons for each point; equal spacing and mirrored columns.
PRO
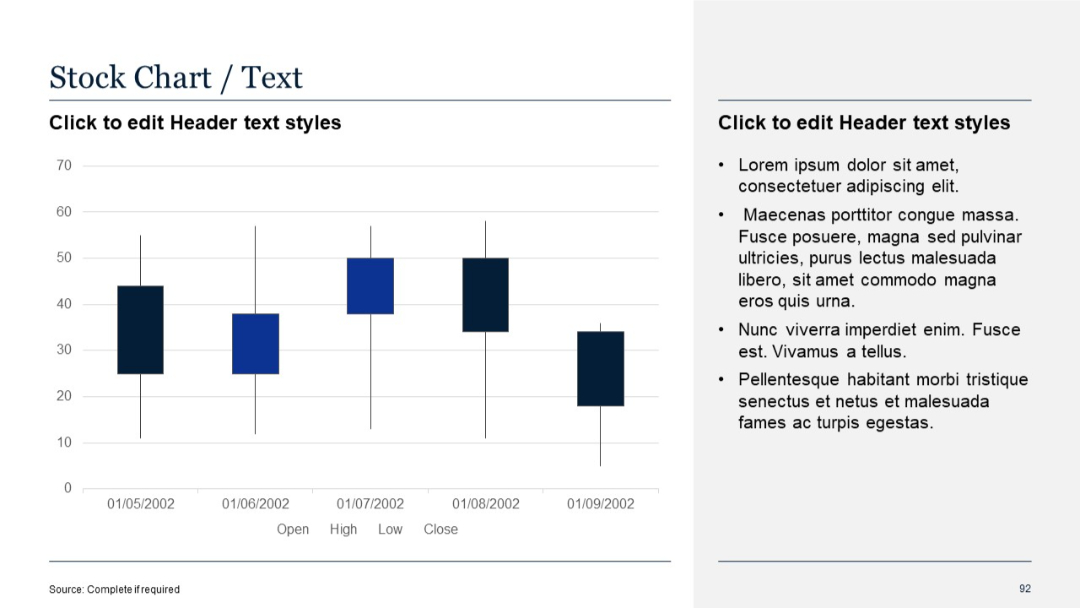
Candlestick-style stock chart on left; right side contains bulleted placeholder text.
PRO
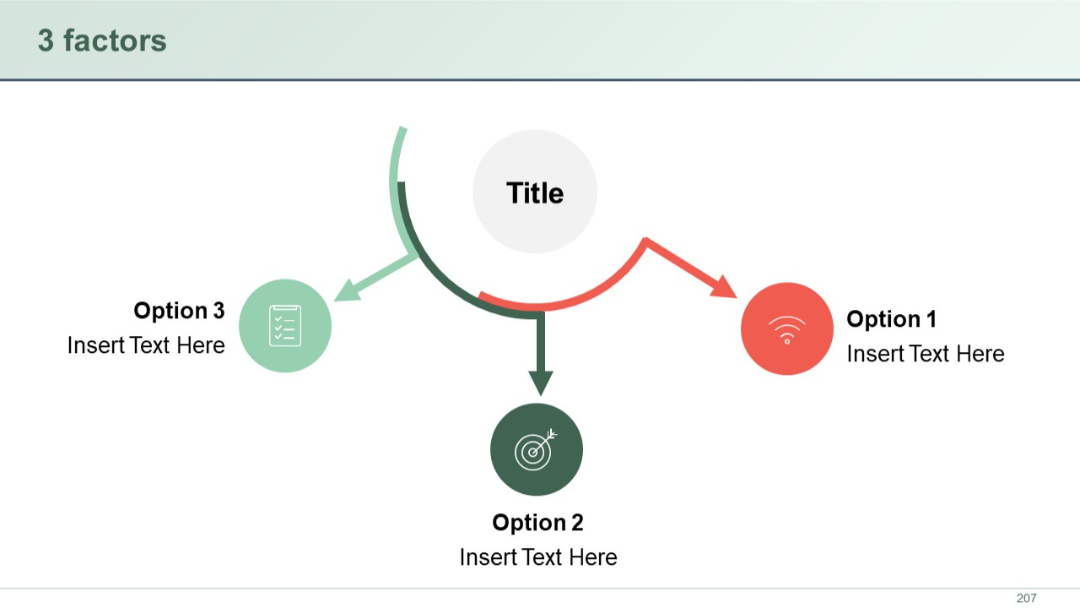
Three circular icons in a triangular arrangement with arrows pointing toward a central circle. Each factor is labeled as an option.
PRO
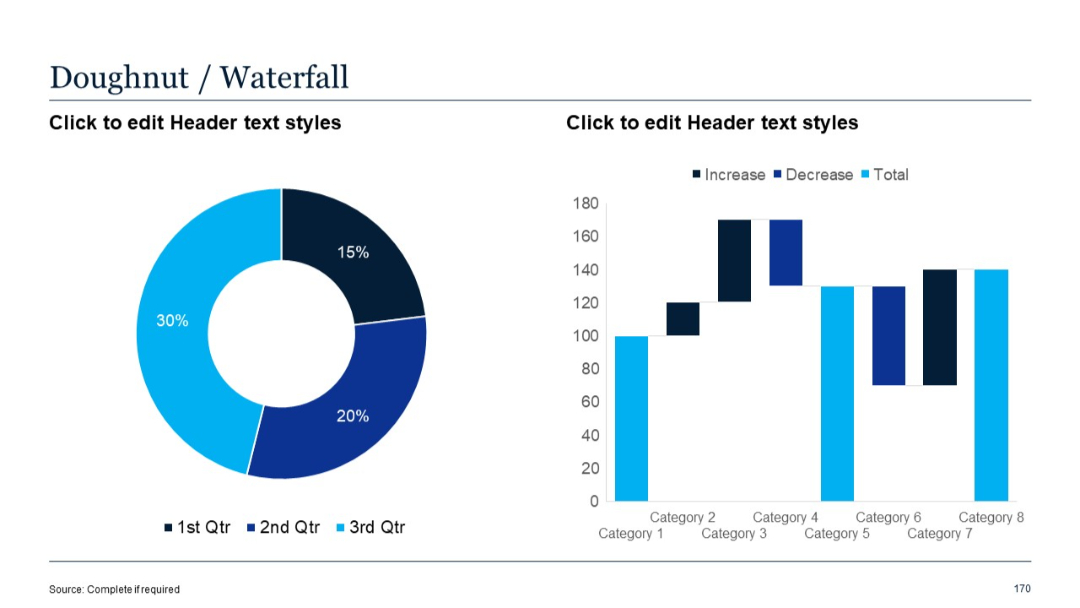
Doughnut chart paired with a waterfall chart showing increases, decreases, and totals over eight categories.
PRO
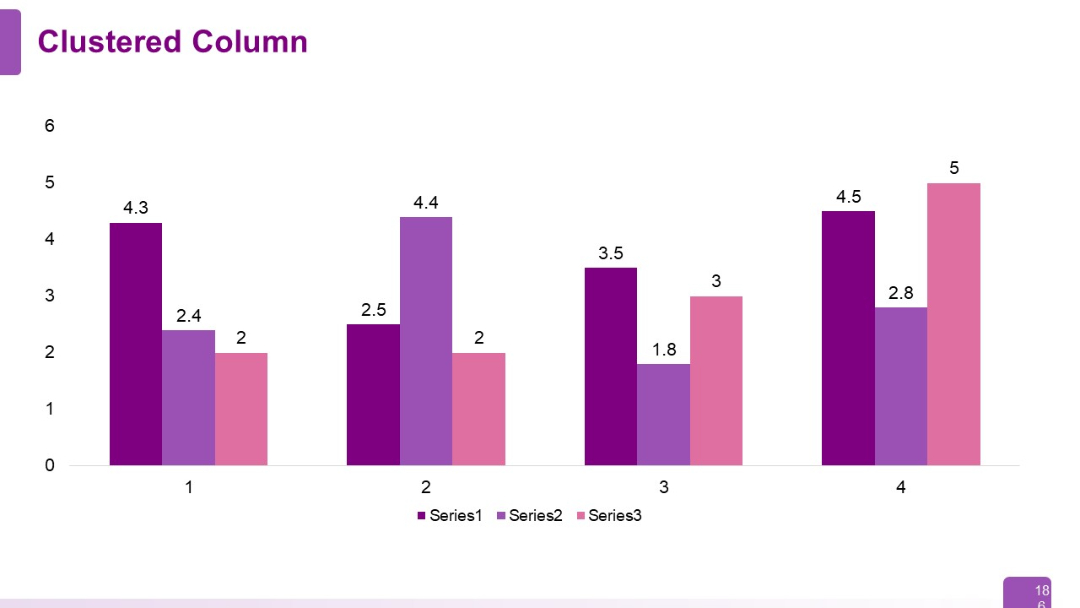
Clean clustered column chart with four sets of three bars. Numeric labels above each bar.
PRO
Smartphone graphic on left with five horizontal text boxes connected by lines.
PRO
Circular infographic with 4 segments arranged around a central hub. Each segment has an icon and placeholder text, with a clean white background.

PRO
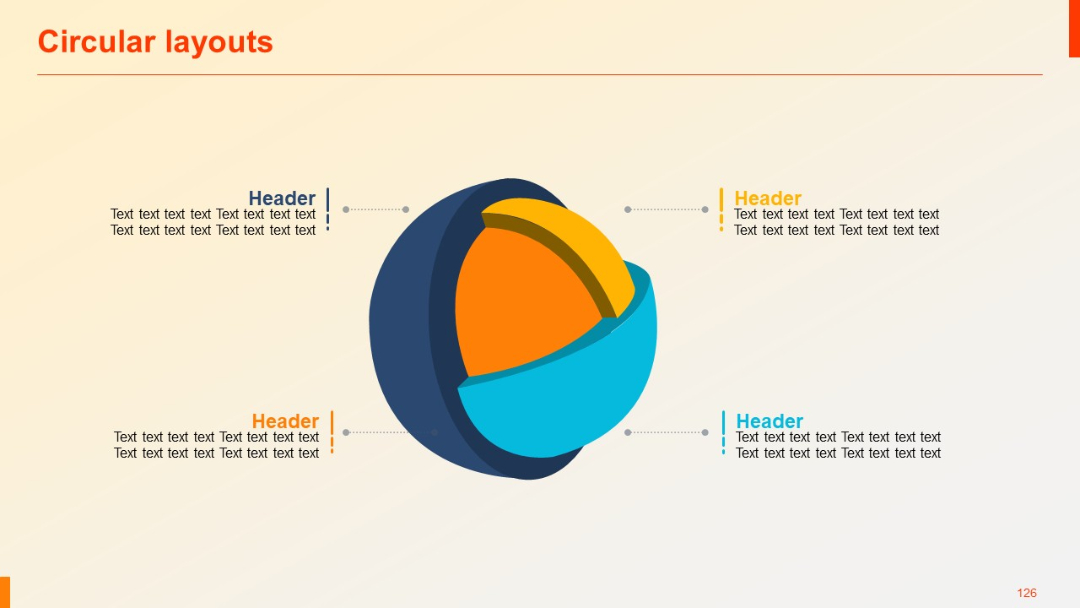
A 3D circular exploded sphere split into four colored segments with dotted lines pointing to headers on both sides.
PRO
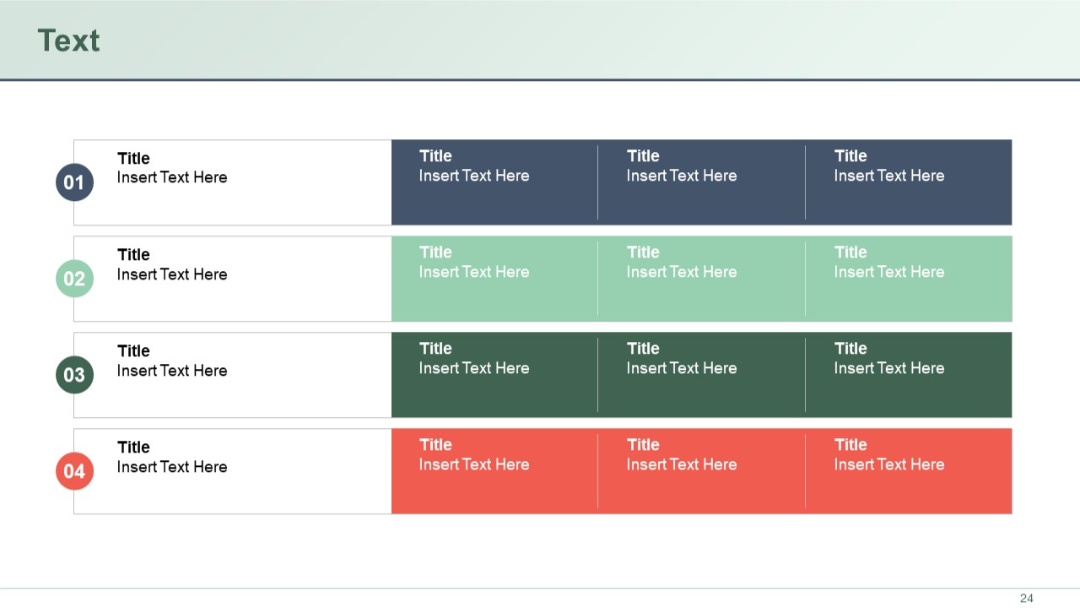
Four horizontal rows each with colored circular step numbers on the left and three content boxes in varying shades across.
PRO
Horizontally oriented funnel graphic with icons and text boxes on the left feeding into a dark funnel that narrows to a blue endpoint on the right.

PRO
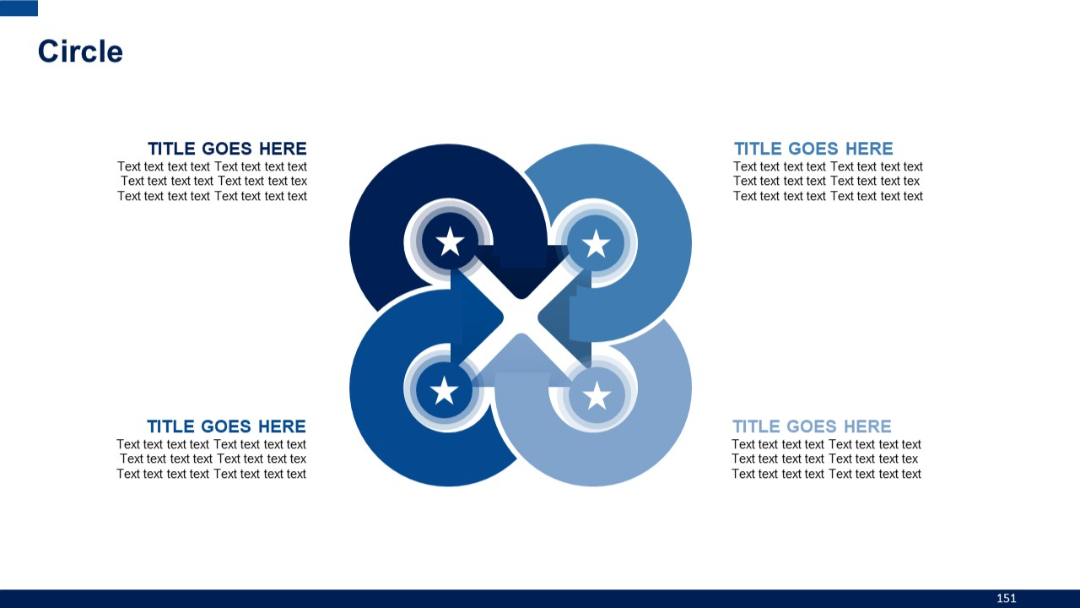
Four interconnected circular shapes forming an “X” in the center, each circle with a star icon and text box surrounding the graphic. Symmetrical layout.
PRO
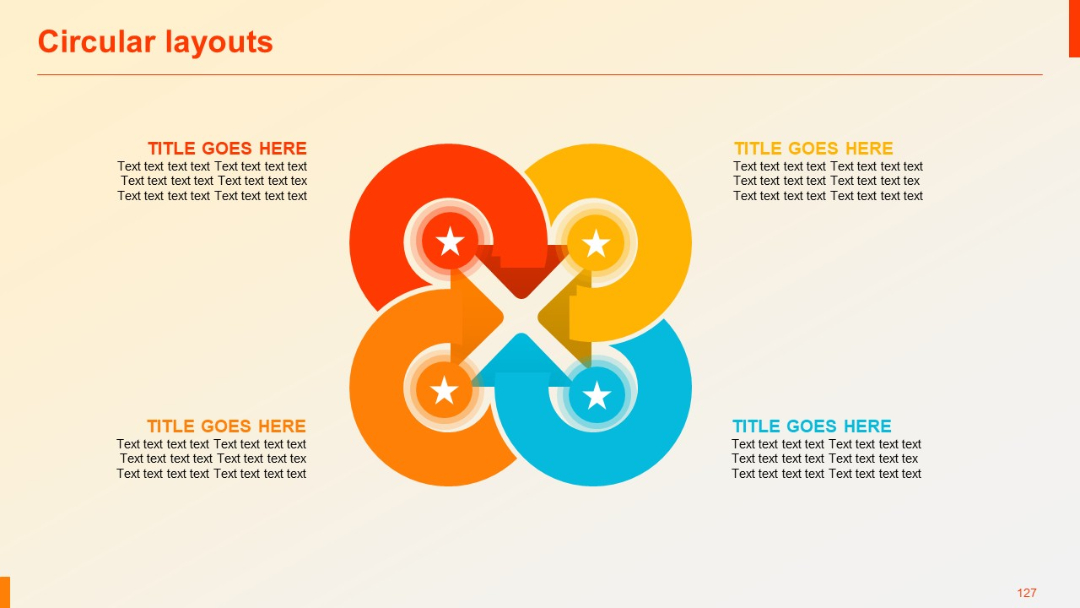
Four circular segments with stars at each point forming an X-shape; each quadrant paired with a header and text.
PRO
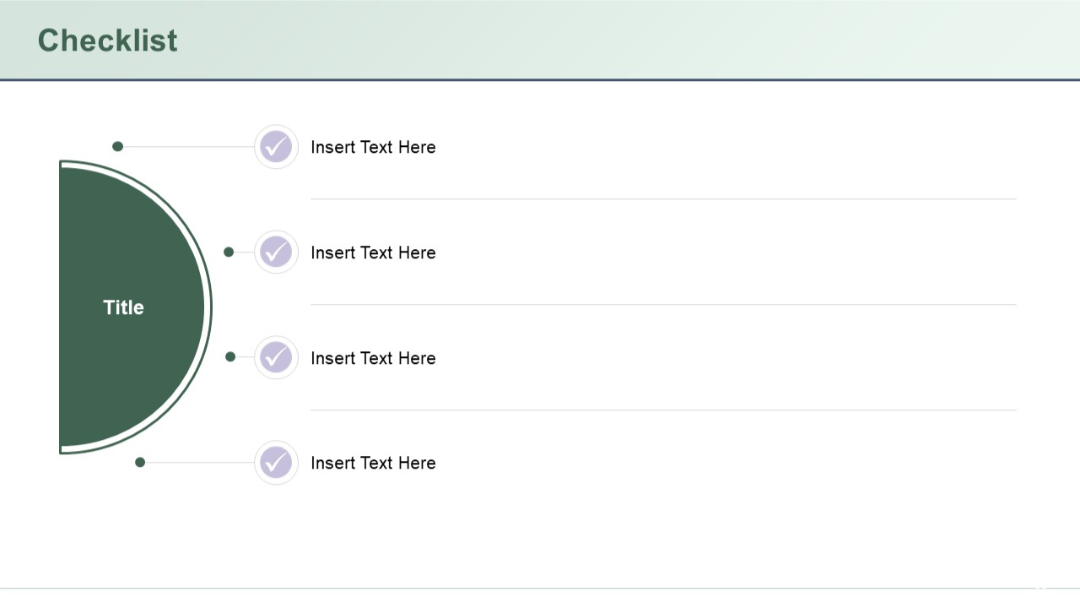
Left-aligned large semi-circle with "Title" text and four aligned horizontal checkmarks with text placeholders on the right.
PRO
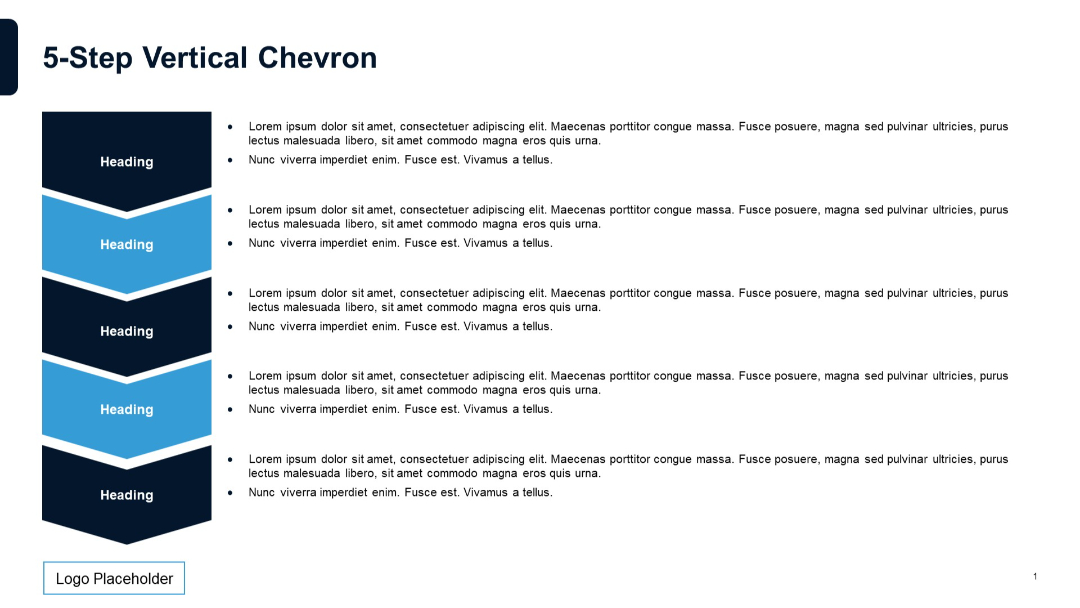
Five vertically arranged chevrons on the left with accompanying bulleted descriptions to the right of each. Design is simple and structured, with alternating chevron colors.
PRO
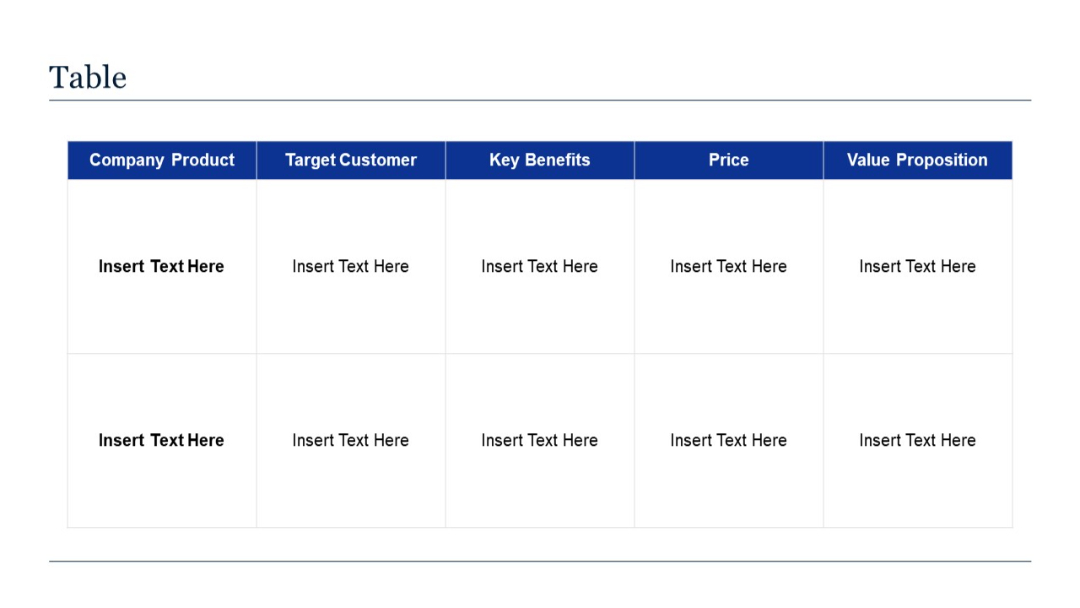
Five-column comparison table with headings like "Company Product", "Target Customer", "Key Benefits", "Price", and "Value Proposition".
PRO
Magnifying glass icon on the left; large content box on the right with a green top header labeled "Title" and placeholder text beneath.
PRO
Minimalist design with a large section title and a thin red divider line across a light gradient background.

PRO
Grid of six horizontally aligned diamond-shaped icons with circular numbering, each linked to a rectangular title-text block.
PRO
Minimalist timeline with four circular markers (01–04), each connected to a horizontal line and text box.
PRO
Two-row, two-column grid with horizontal color-coded bars and circular icons to the left of each header.
PRO
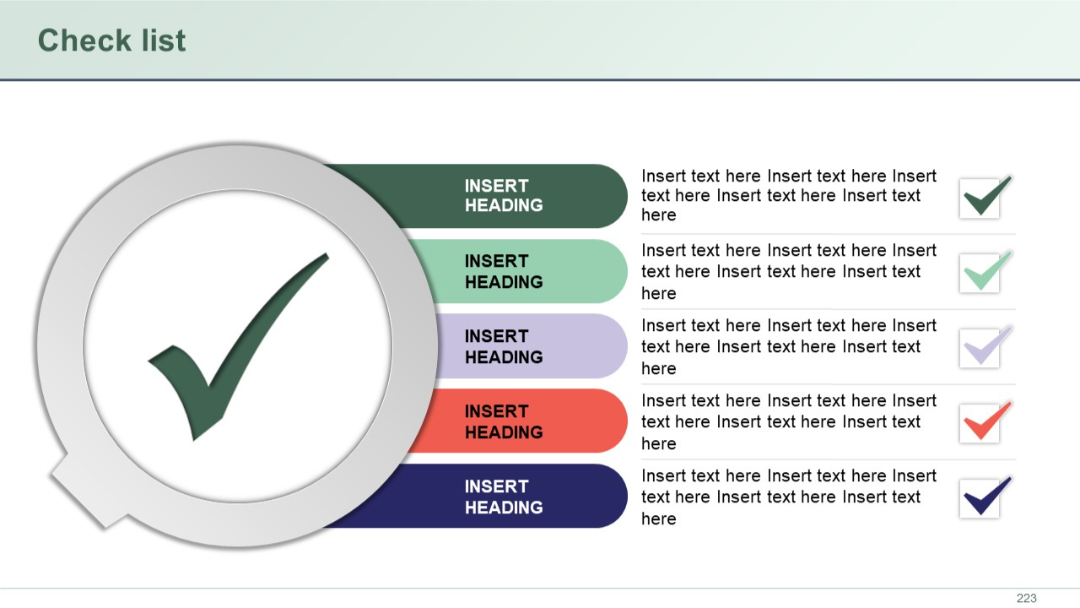
Large checkmark icon on left with vertical rows of colored rounded rectangles and checkmarks on the right. Multicolor styling.
PRO
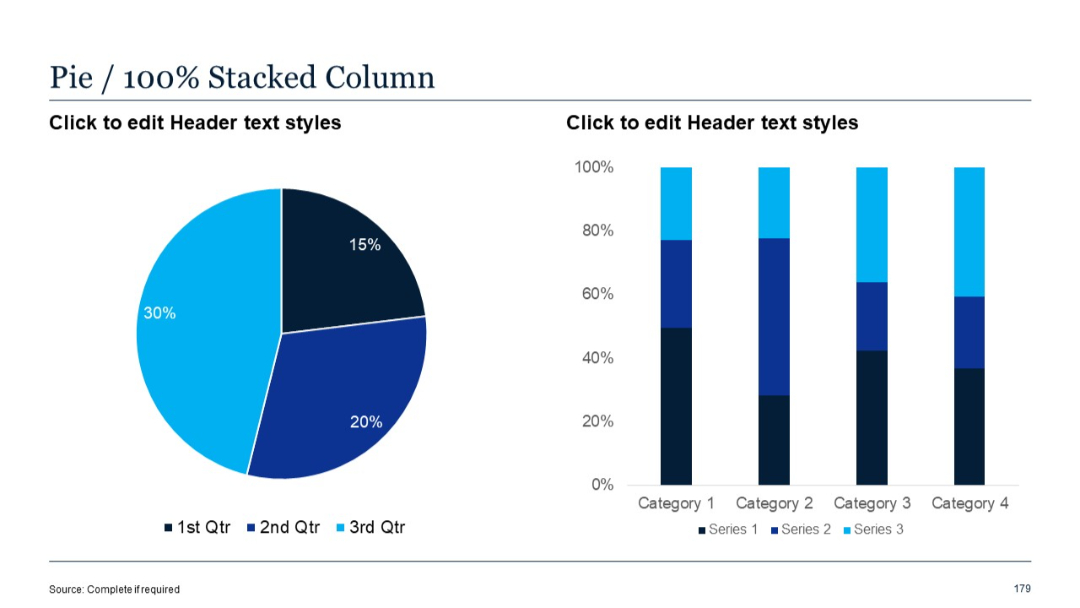
Pie chart on the left and 100% stacked vertical bar chart on the right.
PRO
Linear process with icons connected by a red line. Each step is represented with a unique icon above colored title boxes with editable text.