PRO
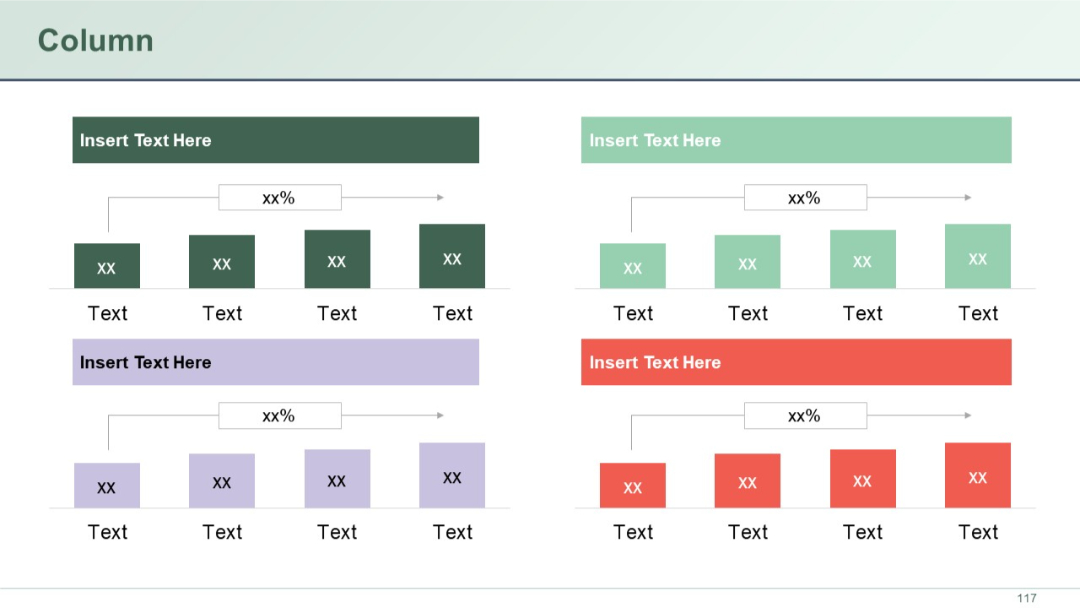
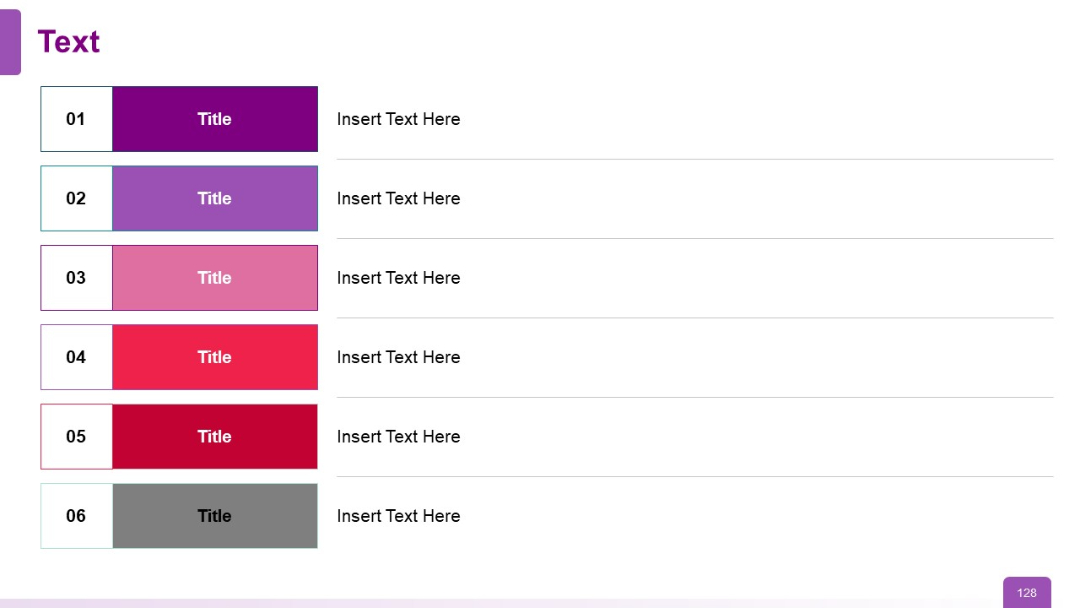
Four-column layout with colored headers (dark purple, lavender, pink, red), white background, and a red title bar.
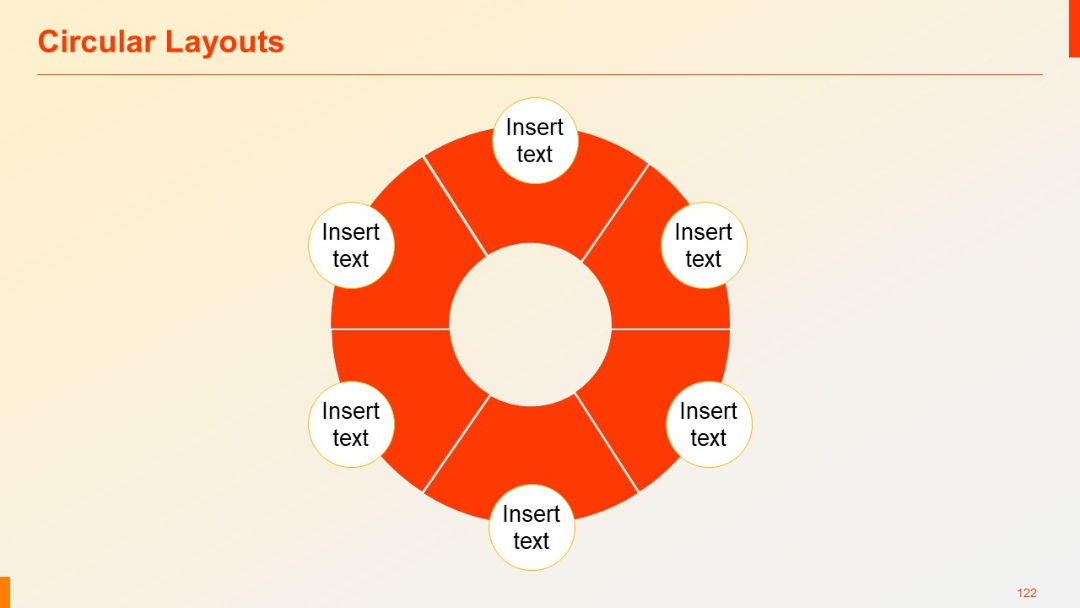
PRO
A professional slide with six segments and six corresponding white circular text boxes evenly spaced around the ring.
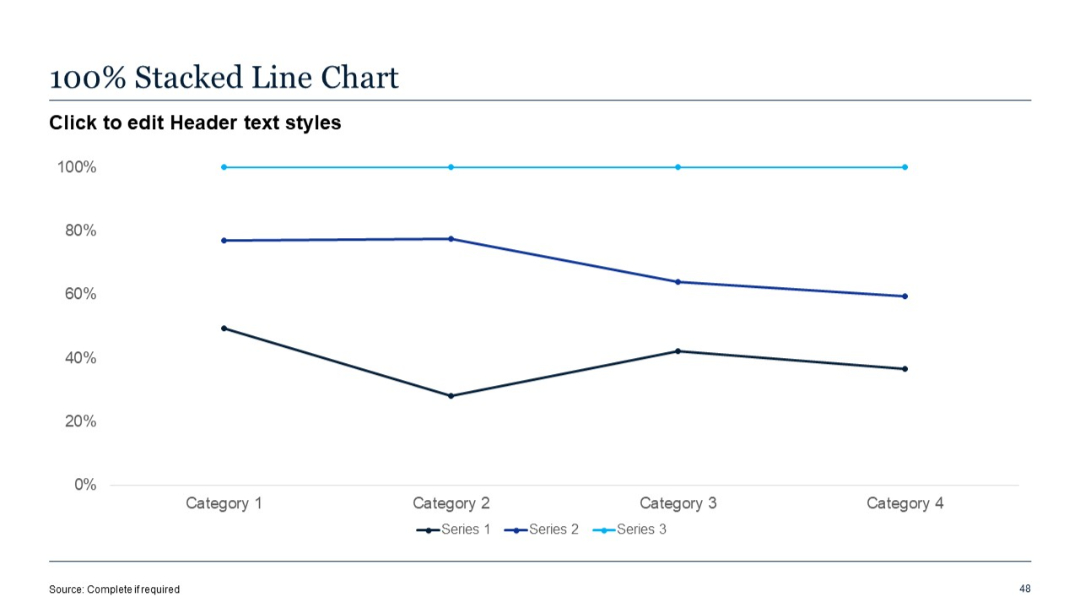
PRO
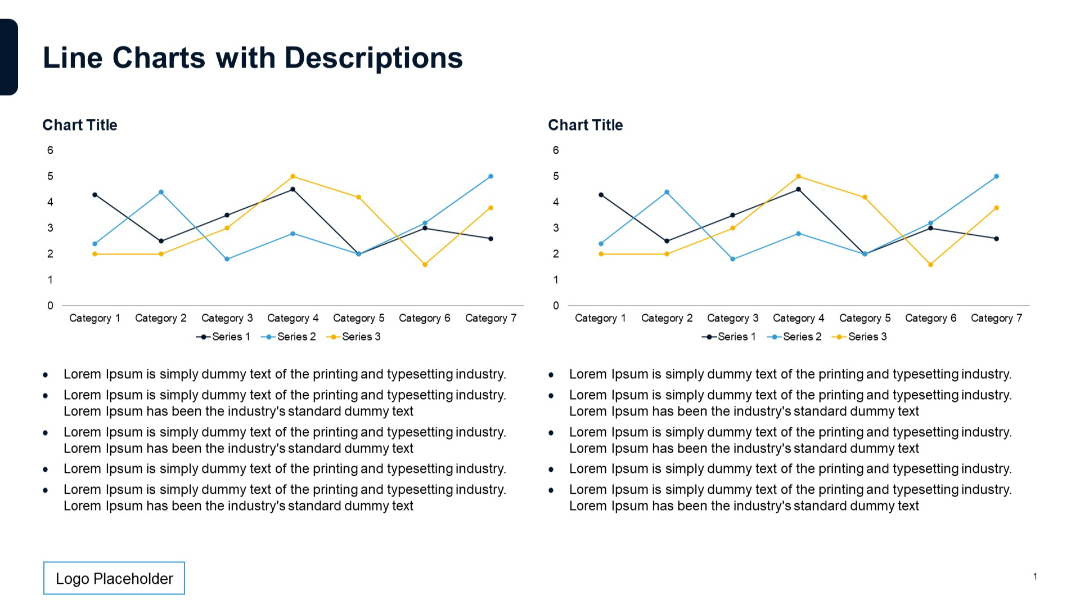
Line chart showing relative percentages of three data series across four categories. Y-axis in percentages.
PRO
Two-column layout with icon and text block on the left and text area on the right.
PRO
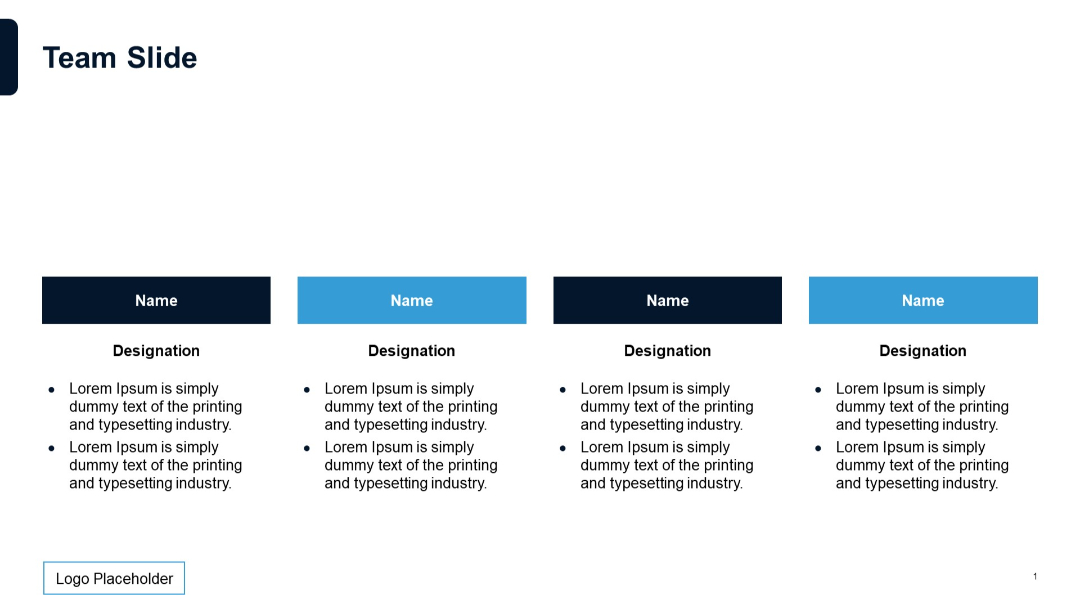
Four-column layout with rectangular blocks showing names, designations, and short descriptive bullet points; alternating color blocks (dark/light).
PRO
Five circular icons with headings and descriptive text underneath; arranged in a semi-elliptical formation with ample spacing.

PRO
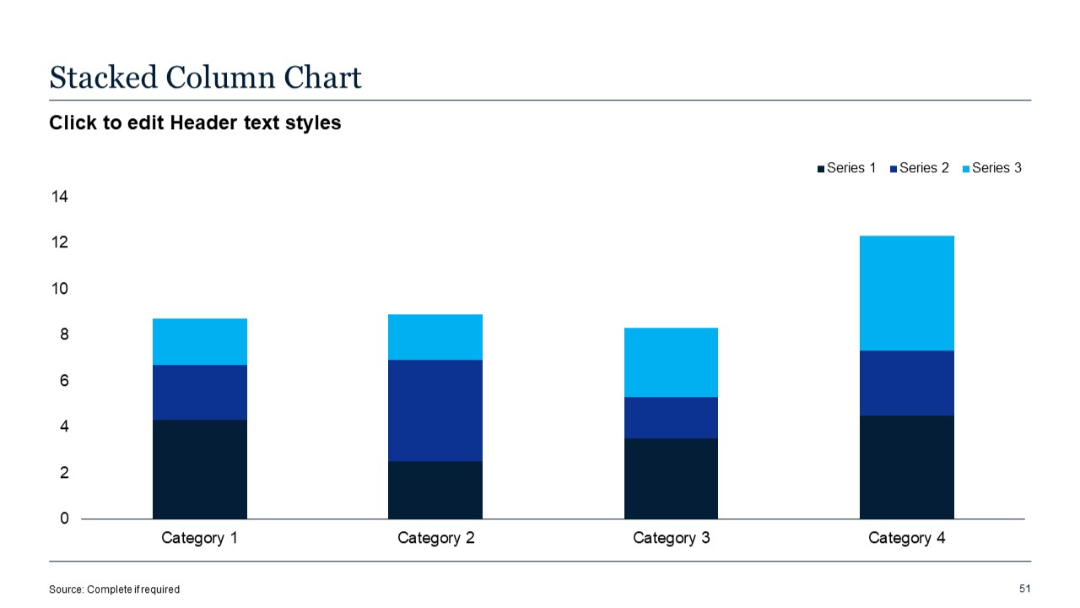
Standard vertical stacked column chart; 3 data series per category; simple grid layout on white background.
PRO
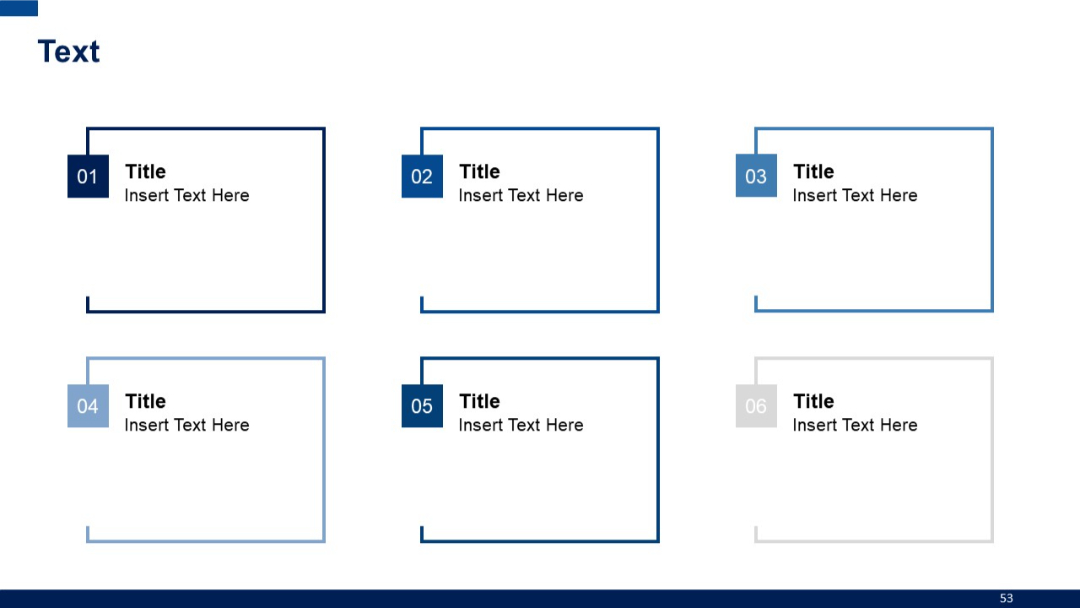
Six framed text boxes with colored corners labeled 01–06, arranged in a grid. Each box includes a bold title and description text.
PRO
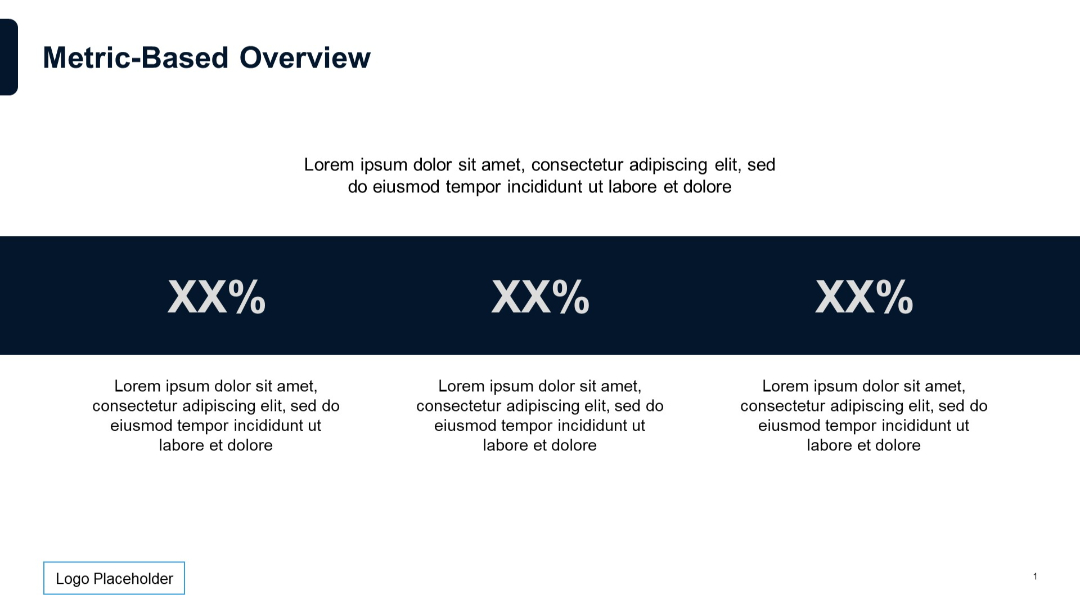
Three equally spaced percentage values in bold with supporting text above and below.
PRO
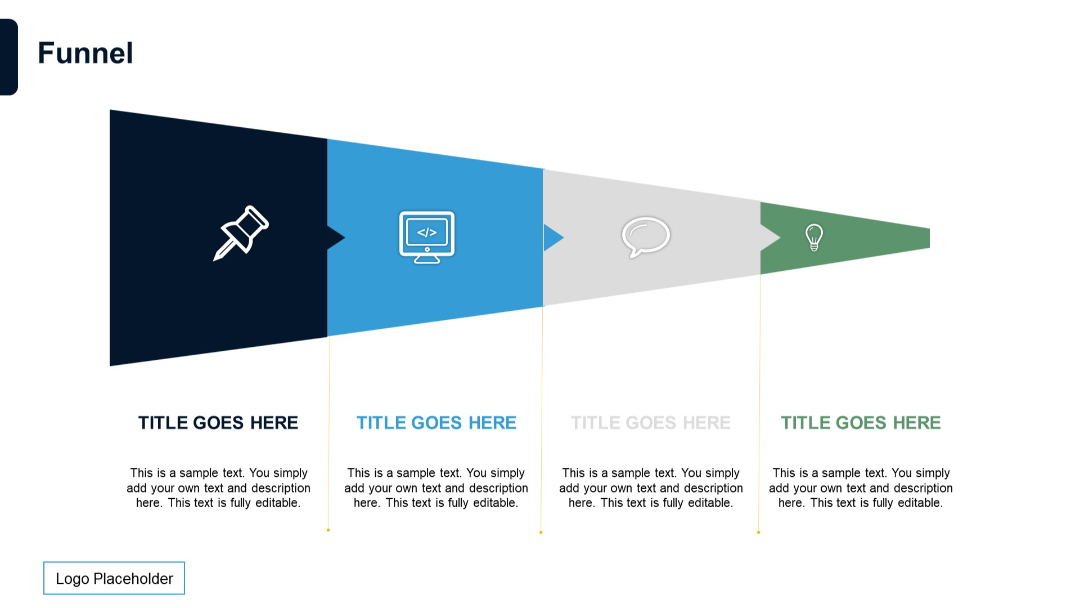
Horizontally aligned, multi-stage funnel with chevron arrows for each step. Color-coded stages with icons and explanatory text beneath.
PRO
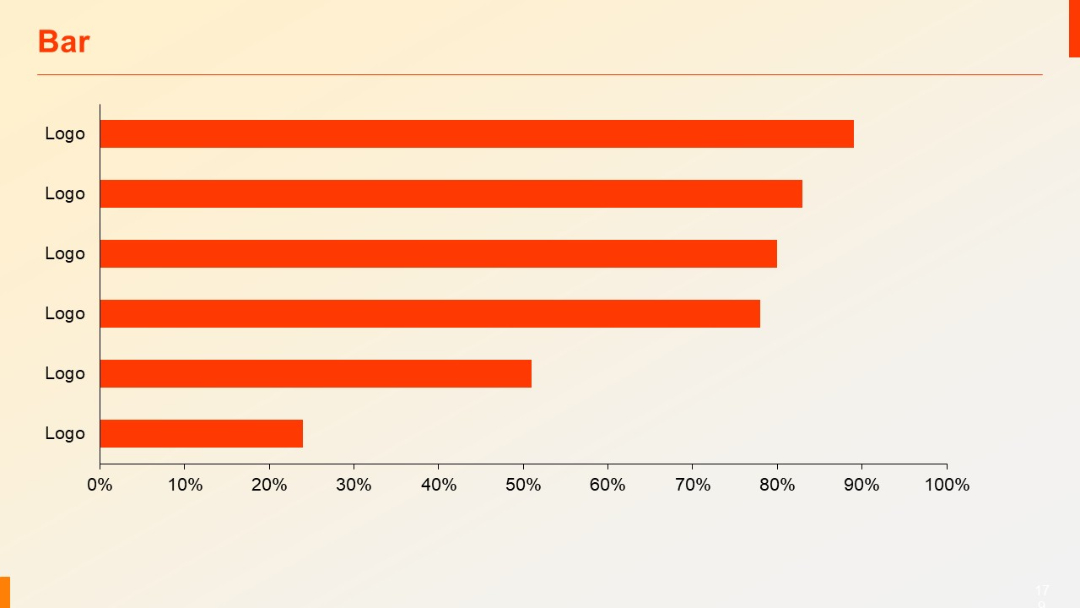
Horizontal bar chart with identical “Logo” labels on the Y-axis. Bars are in orange, aligned from highest to lowest.
PRO
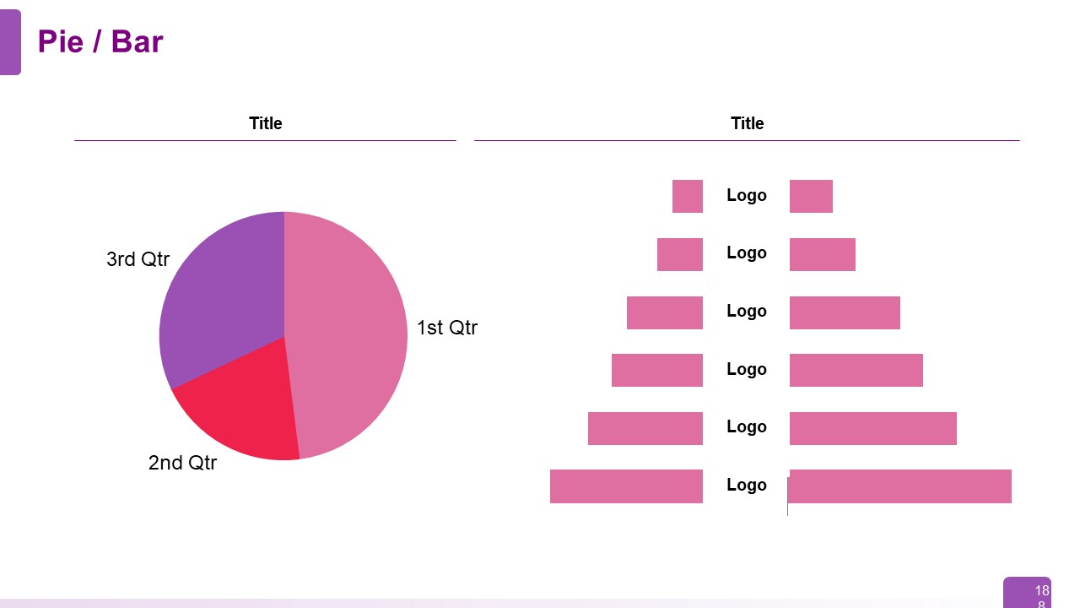
Left: pie chart showing 1st–3rd quarter segments. Right: horizontal bar chart with logos and labeled bars stacked vertically.
PRO
A matrix of six small horizontal bar clusters with icons, percentages, and labels. Color-coded by row.
PRO
Three-column layout with icons; white background, bold headings in dark blue; subtitle accent with slashes.

PRO
Similar to previous, but with three shaded title cells on the left, each corresponding to a row with four horizontally aligned content cells on the right.
PRO
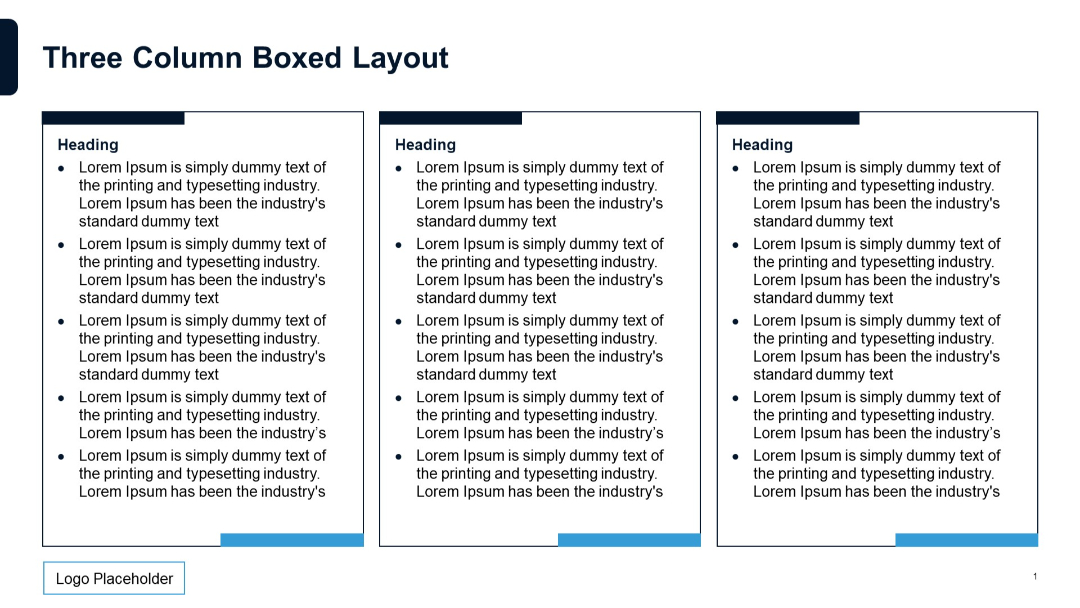
Three vertical rectangular boxes with bullet point text under headings. Blue accents and minimal lines. Structured, clean format.
PRO
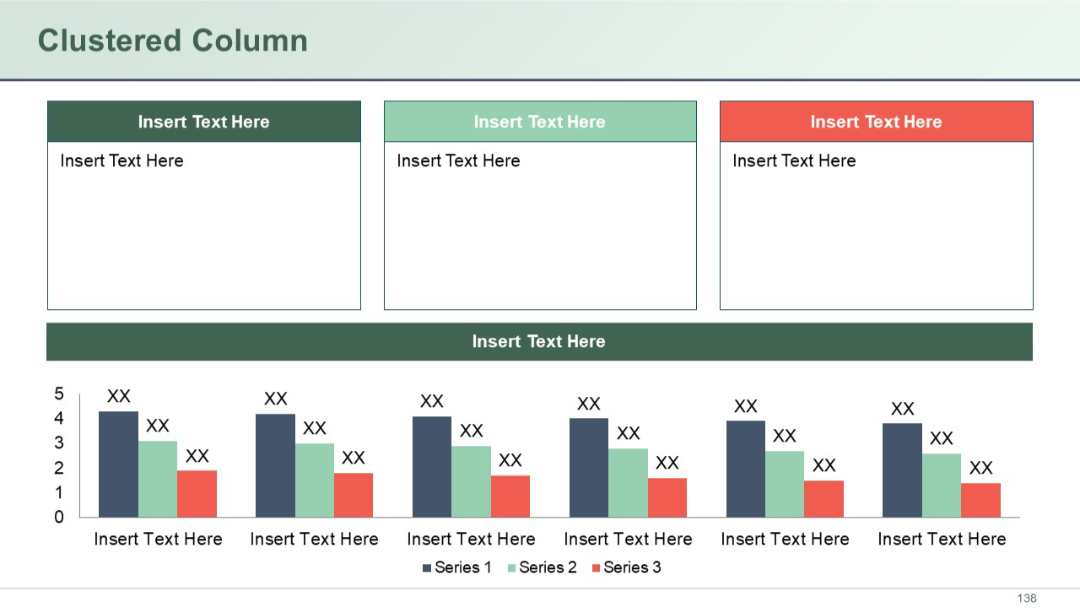
Three large colored boxes on top with text areas, followed by a full-width header, and a clustered column chart beneath.
PRO
Dual line charts at the top with two sets of legend and axis labels. Bottom has bullet points in two columns for descriptive text.
PRO
2x3 grid layout of round photo placeholders for team members with space below for titles. Minimalistic and symmetrical layout.
PRO
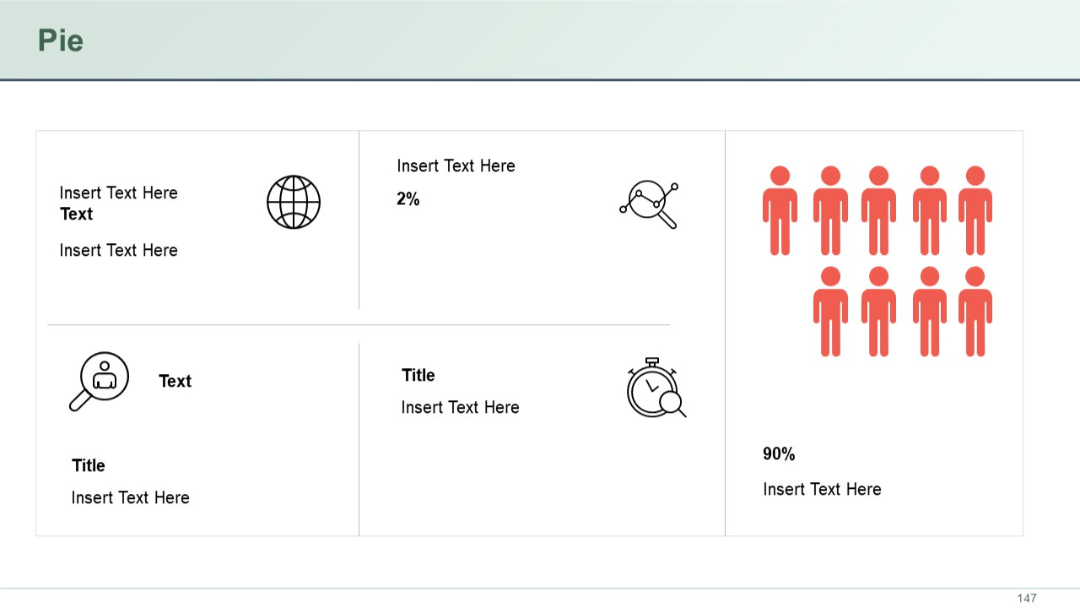
A segmented grid layout with iconography and sparse text. One section uses person icons and a large "90%" marker to highlight a dominant value.
PRO
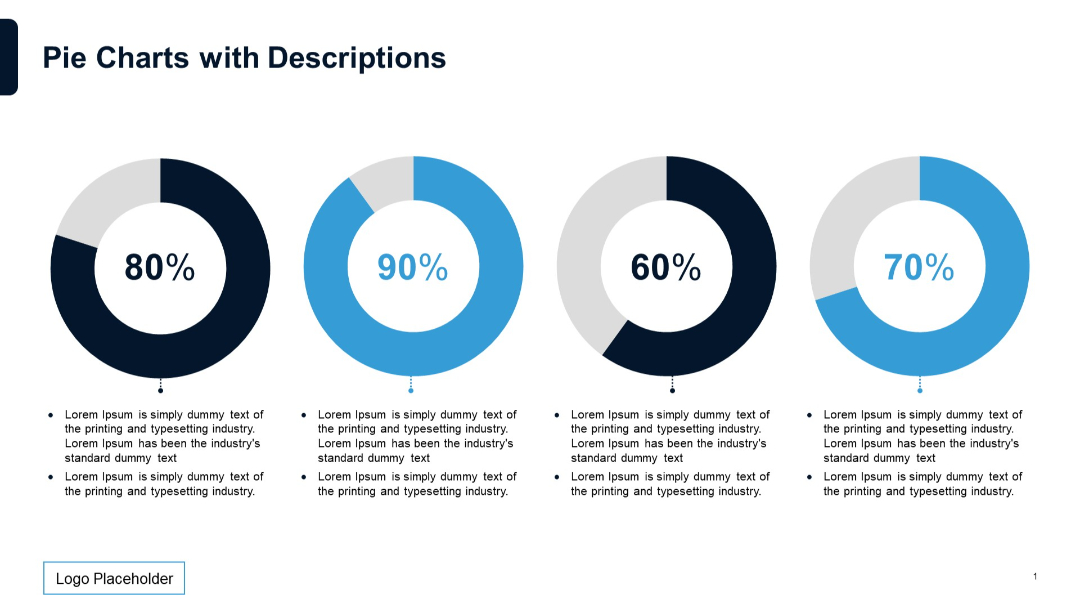
Features four doughnut-style pie charts in a row. Below each is a bullet-point text box explaining the percentage shown in the chart.
PRO
Grid layout with six outlined square boxes, each with a number tab and text inside.
PRO
Line chart on the left and horizontal bar chart on the right, both using the same categorical data. Equal spacing and balanced format.

PRO
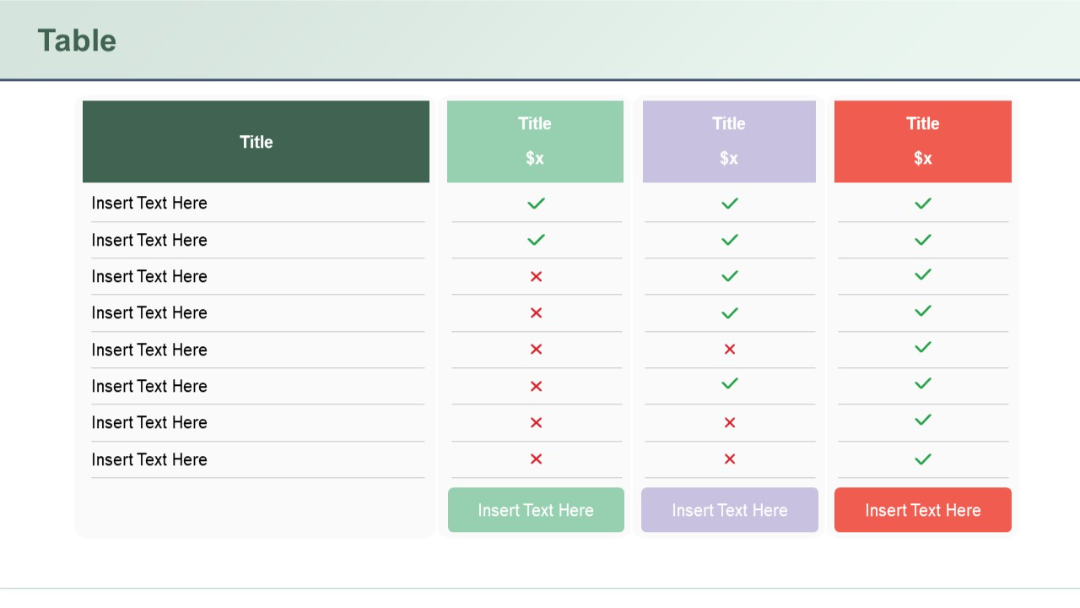
Feature comparison table with columns color-coded in green, purple, and red. Includes price markers and check/cross icons.
PRO
A full-width stacked area chart over quarterly periods from Q1 2019 to Q4 2021, showing five data segments distinguished by color.

PRO
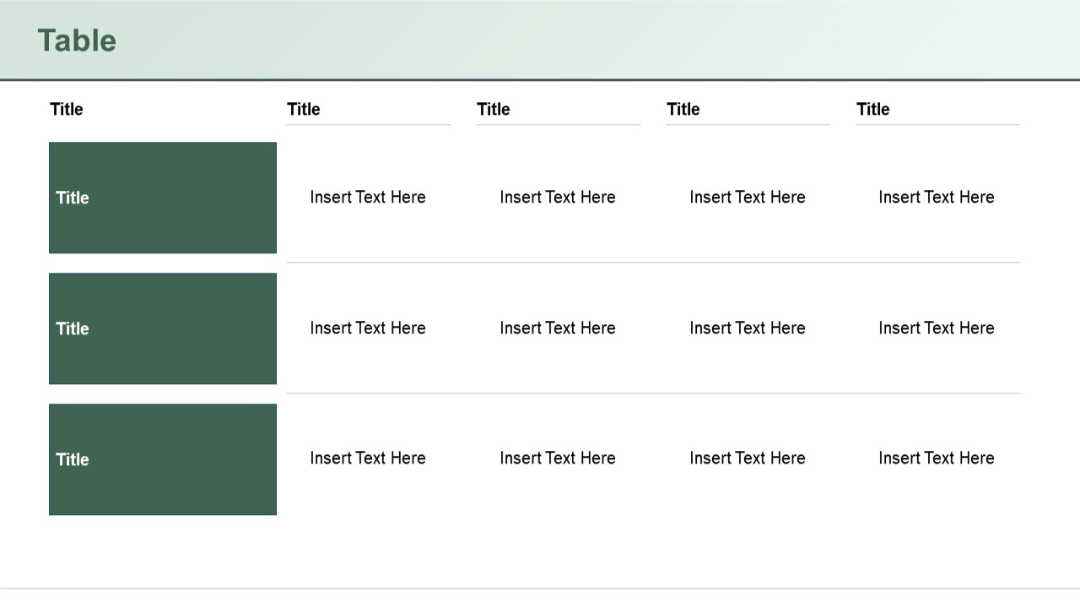
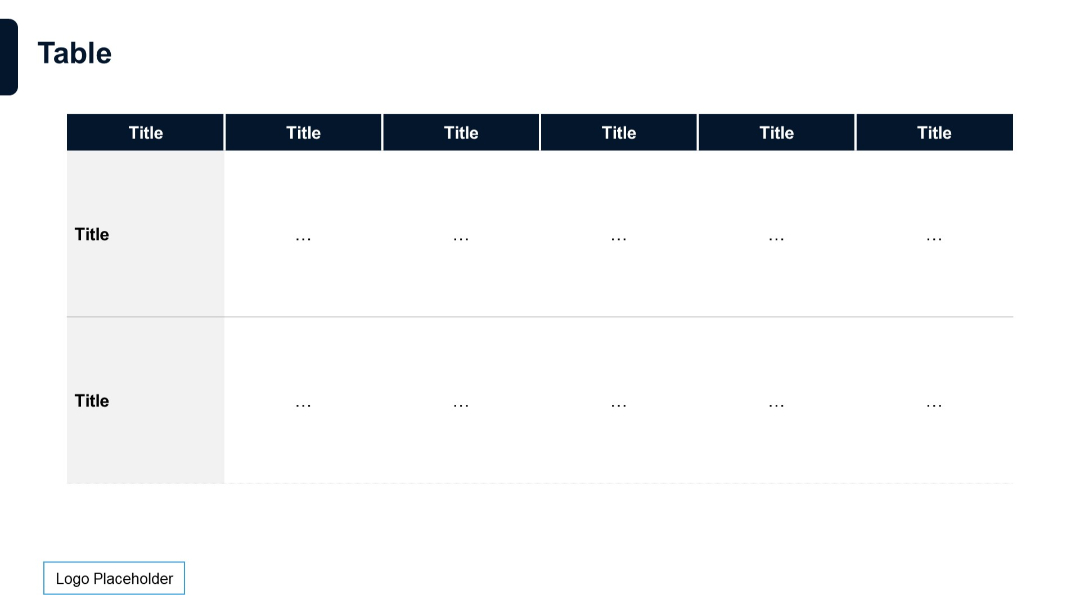
Matrix-style table with five column headers and two rows. Top and left headers are dark blue, body uses ellipses as placeholders.
PRO
Vertical timeline with six steps, each colored differently with step number, title, and description space.
PRO
Split layout: stacked column chart on the left and a pie chart on the right; both use bright colors.

PRO
Grid layout with alternating color-coded checkboxes, titles, and success/failure indicators.
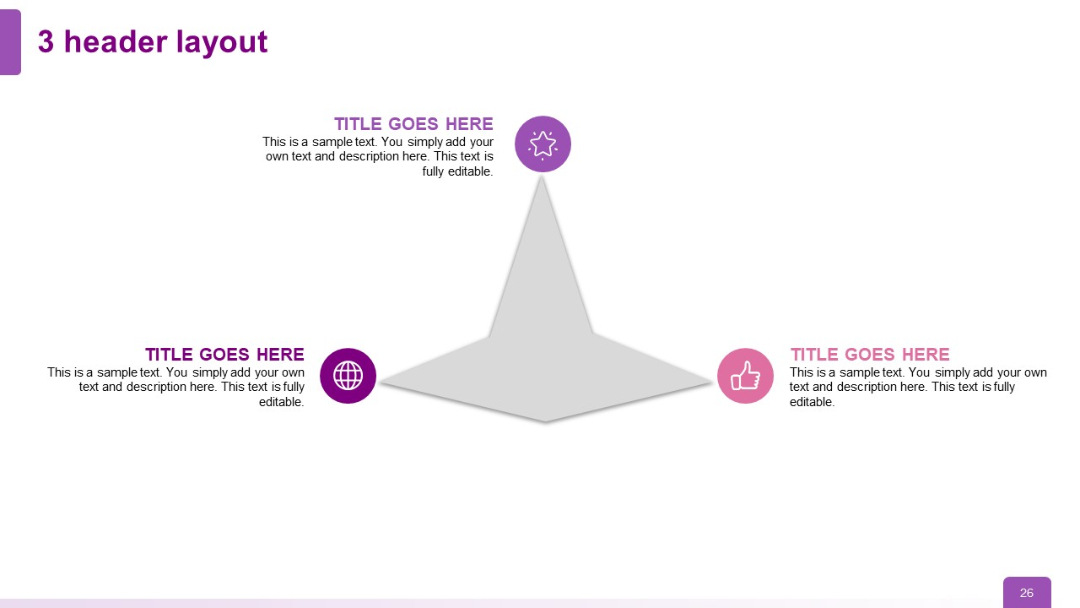
PRO
Triangular layout with three text blocks and icons. One icon at top, two at bottom corners, forming a triangular structure around a central shape.