PRO
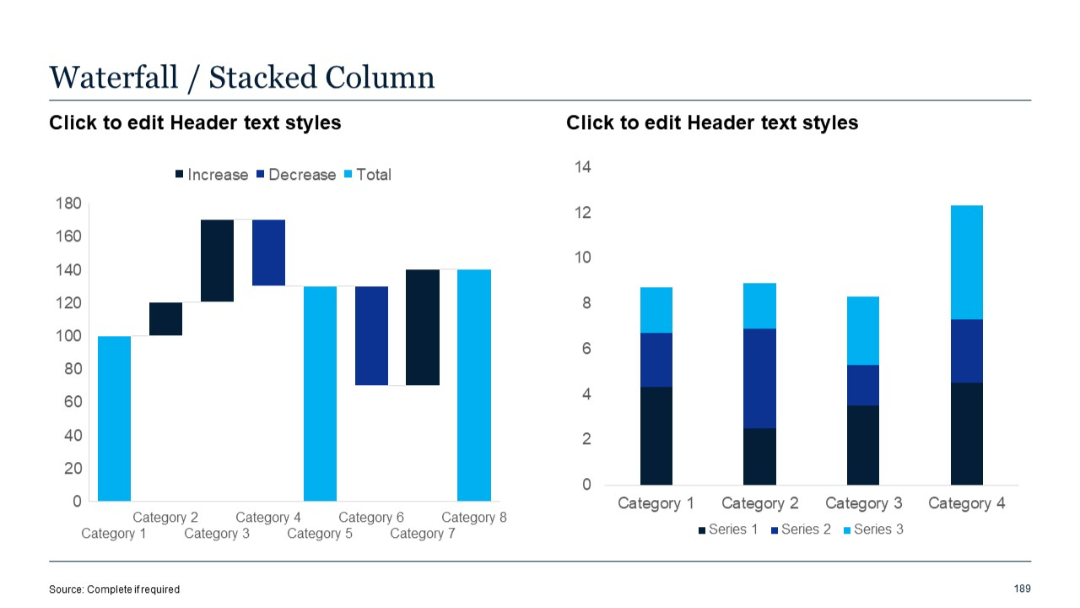
Waterfall chart on left, stacked column chart on right with three stacked series per category.
PRO
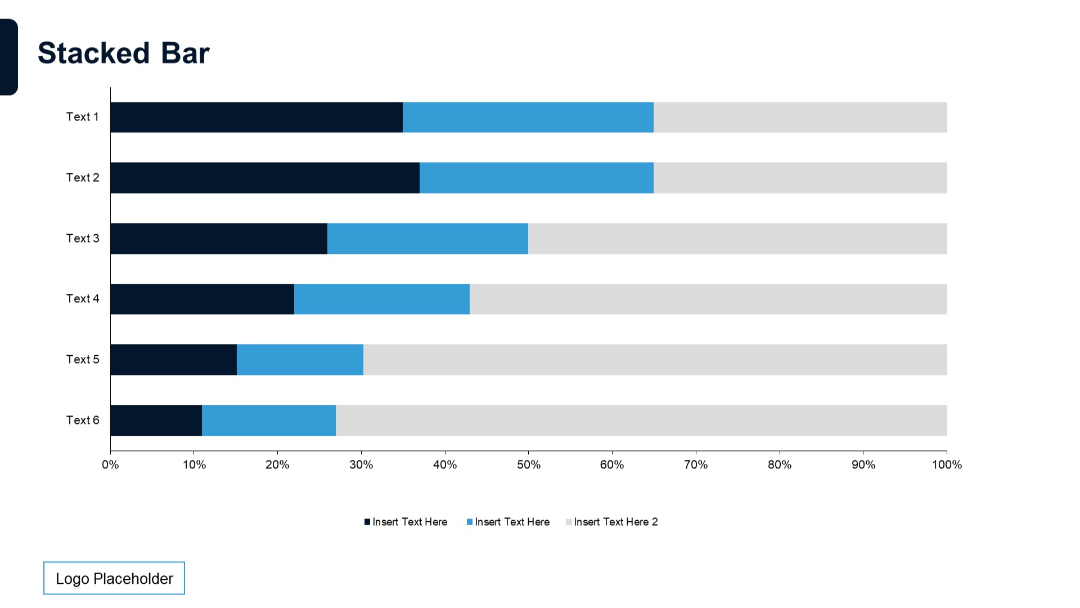
Horizontal stacked bar chart with six entries. Each entry contains three segments (dark blue, blue, and gray) labeled below.
PRO
Similar to previous, 5-column matrix with three rows. Blue headers, grey cells, ellipses as data placeholders. Structured layout.

PRO
Four rows with colored diamond shapes (green, mint, lavender, red) on the left and placeholder text on the right.
PRO
Dark background slide with a vertical, icon-guided flow showing three stages: Strategy, Execution, Optimization.

PRO
Horizontal table layout with two main rows. Each row has one large shaded cell (left) and four textual columns (right) aligned horizontally with placeholder text.
PRO
Two side-by-side vertical tables; each with title and slide number; alternating columns for entries.
PRO
Table with 5 rows and 4 columns; left column fully shaded; uniform row spacing; white cells for content.
PRO
Clean, minimalist design with three white boxes, each labeled 30, 60, or 90 DAY, and an icon of a walking/running figure increasing in speed.
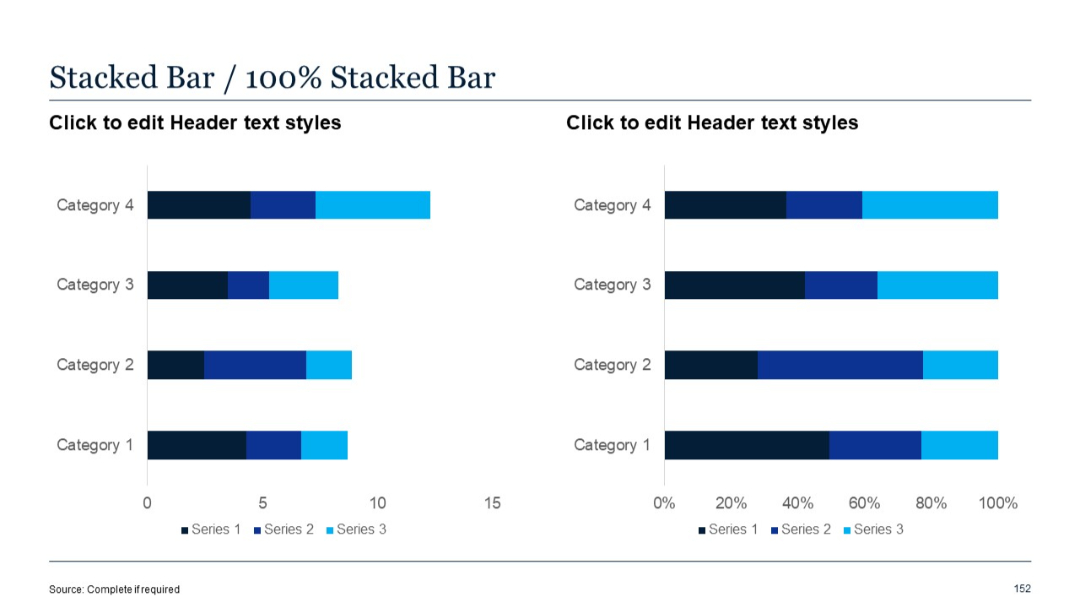
PRO
Side-by-side horizontal stacked bar charts: one in absolute values, the other in percentages. Uses three blue shades for series.
PRO
Light-themed, block-style layout with two rows of three stages each, highlighting an expanded process.

PRO
Very minimalistic; two text blocks placed side by side on a blank white background, each with a subtitle and placeholder.
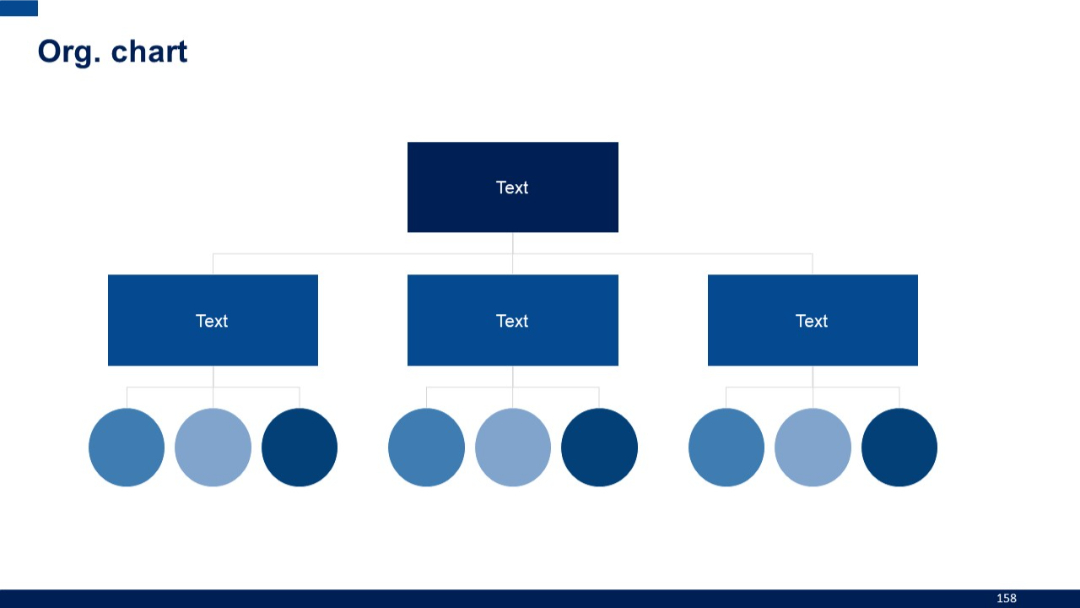
PRO
Rectangular top-level boxes with circular lower nodes arranged horizontally beneath each, creating a three-division structure.
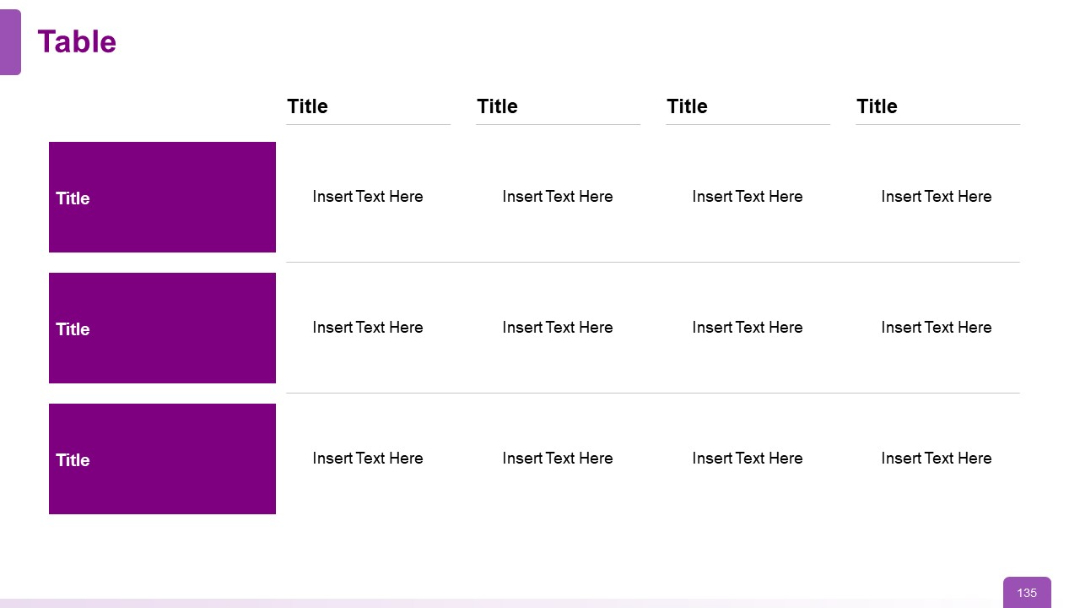
PRO
Horizontal table with left column in solid purple and rows labeled “Title.” Right columns include placeholder text under each heading. Clean grid structure.
PRO
Complex radial diagram with a dual-ring design—outer segments have icons and the inner ring has a gear-like center.

PRO
Tab-style vertical layout for SWOT categories with rounded headers and color indicators.
PRO
Grid layout with six square purple icons numbered 01–06, each followed by text. Three rows and two columns. Simple, modern design.
PRO
Two-column timeline layout with vertical dividers and red bullet points; each item includes a box with a placeholder title and text.
PRO
Three circular elements with percentage values, supported by heading text and horizontal connectors.
PRO
Vertical list of six items with numbered colored circles and a large calendar icon.
PRO
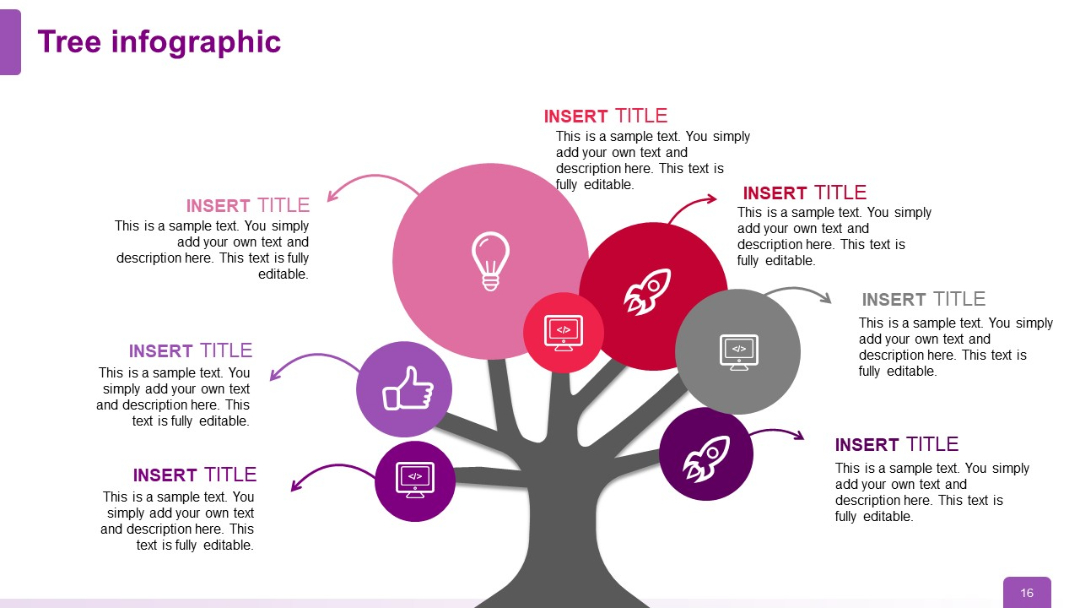
Tree structure now has seven nodes; icons include computers, rockets, lightbulb, thumbs up; layout becomes visually full and comprehensive.
PRO
Agenda layout using diamond-shaped icons with numbers, colors, and titles in two rows.
PRO
World map background with a large blue text box on the left containing sample text. Clean and modern design.
PRO
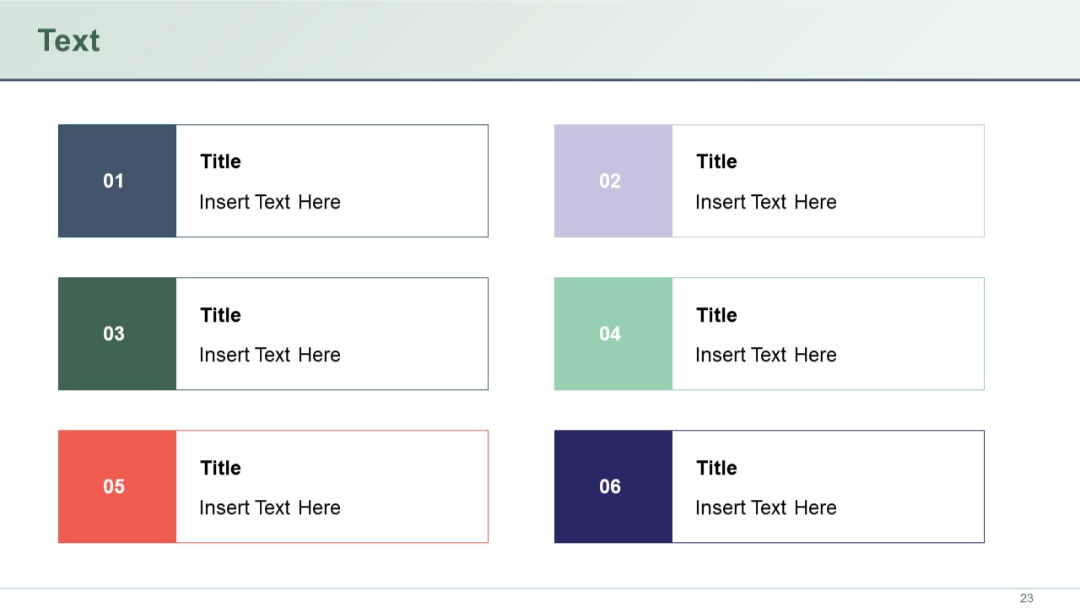
Three rows with two boxes each; every box has a colored number block, title, and placeholder text. Uses a variety of soft colors for segmentation.
PRO
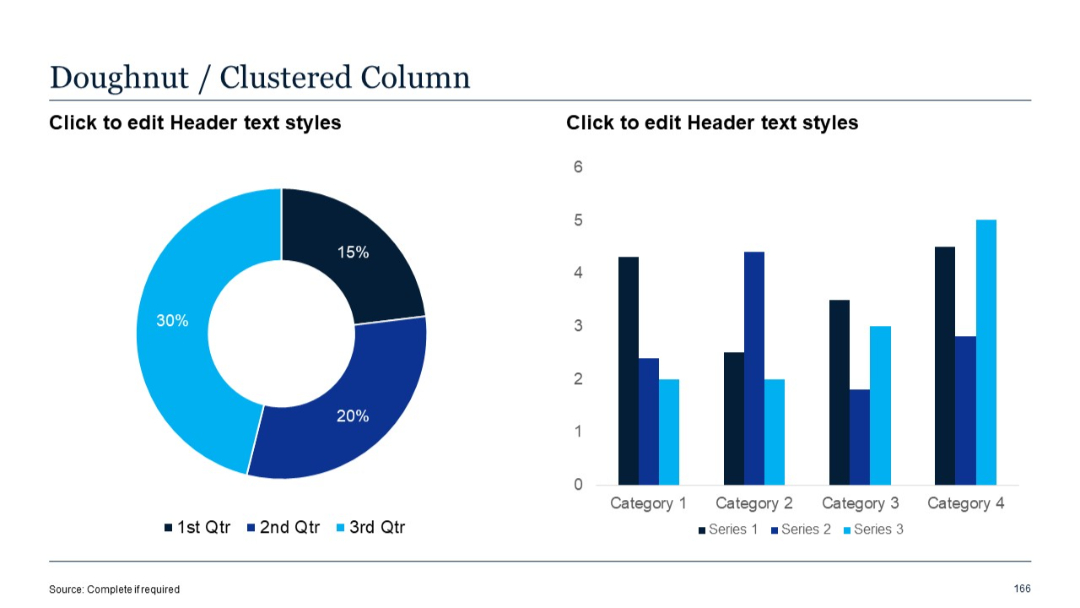
Doughnut chart alongside clustered column chart with grouped bars for three series per category.
PRO
Light-themed slide with a table showing five technology areas, their investment shares, and growth rates.

PRO
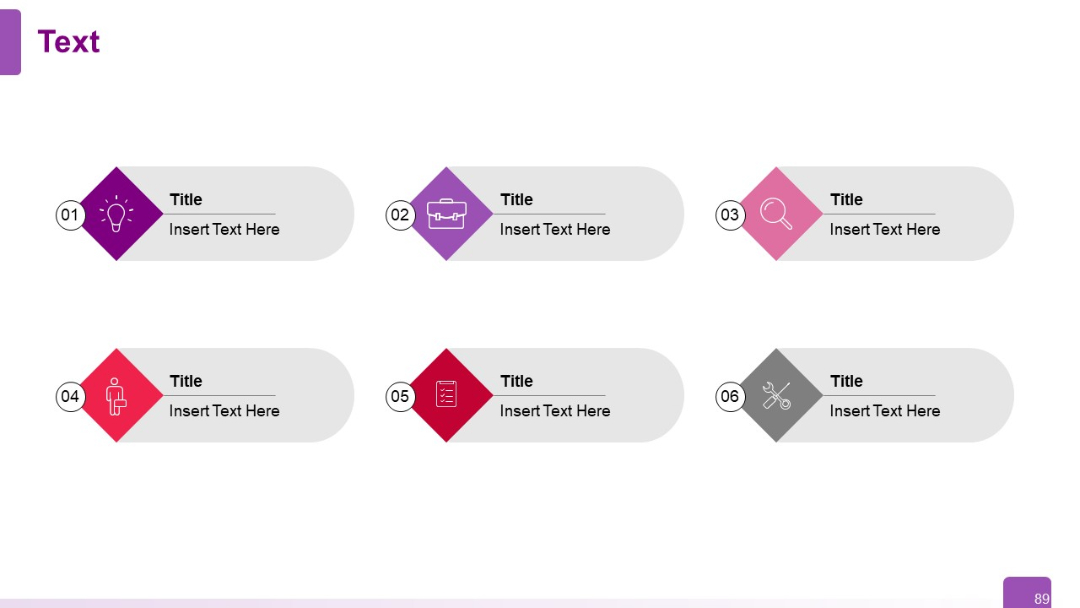
Grid layout of six infographic items, each with a diamond-shaped icon and title/text. Neatly spaced in two rows.
PRO
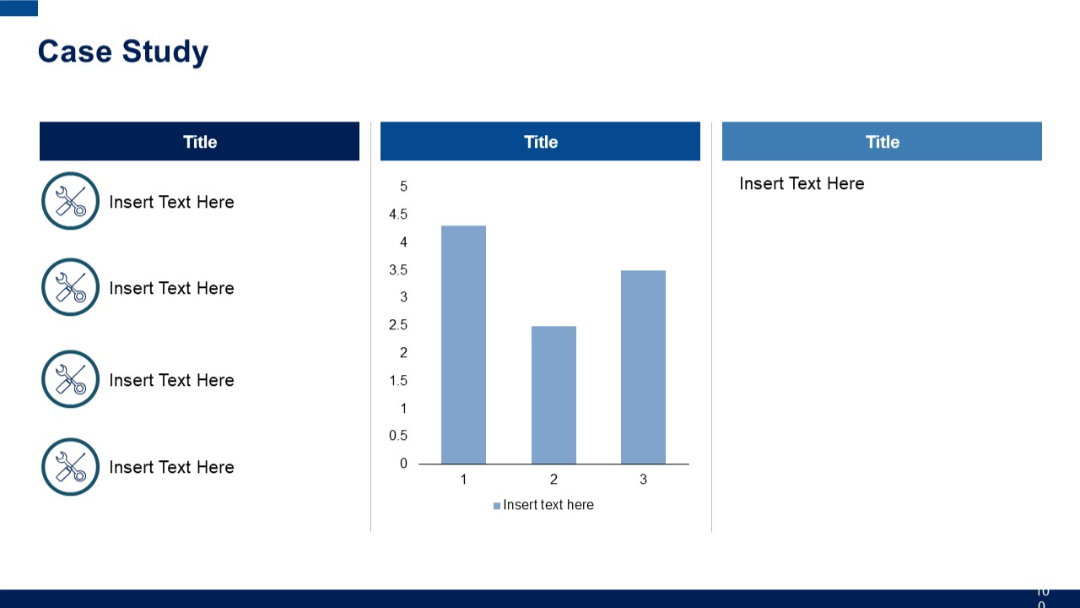
Three-column layout: left with vertical icon list, center with simple bar chart, right with large blue text box; aligned header sections.
PRO
Single large quote section with a headline block in red. Quotation area framed with icons and large text field.

PRO
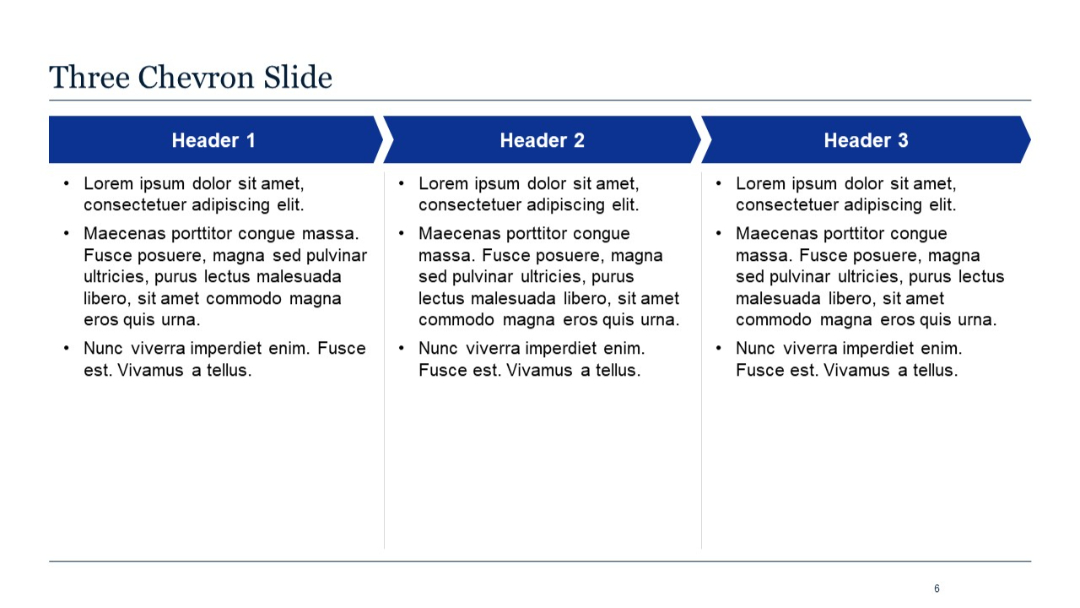
Horizontal chevron icons with text blocks below each; sectioned into 3 parts.