PRO
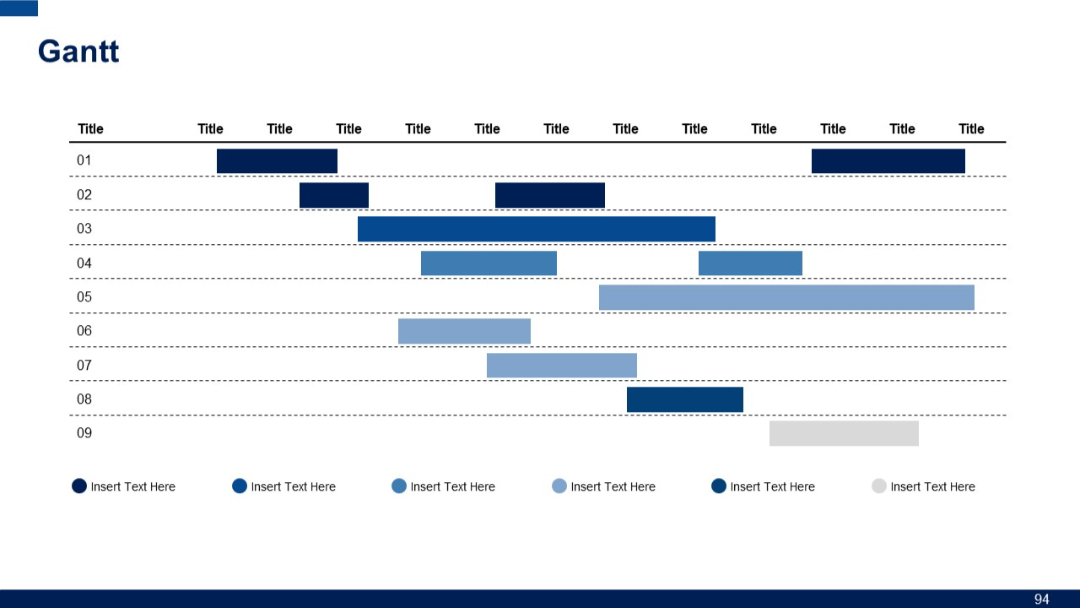
Grid-based Gantt chart with nine rows and multiple color-coded horizontal bars representing various activities across several columns.
PRO
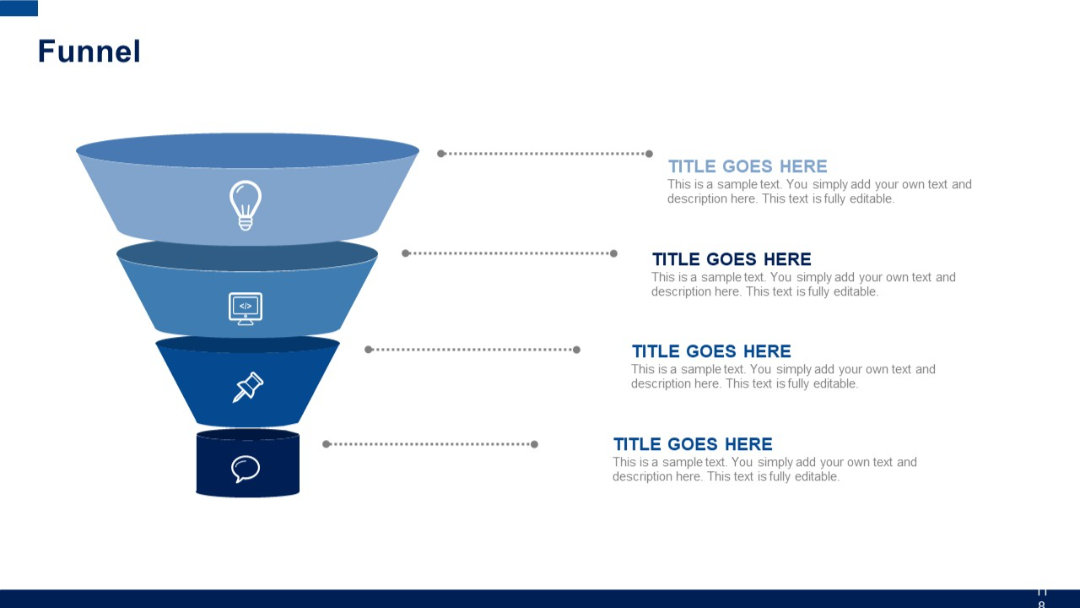
Vertical layered funnel diagram with four funnel levels, each with an icon and aligned descriptive text to the right.
PRO
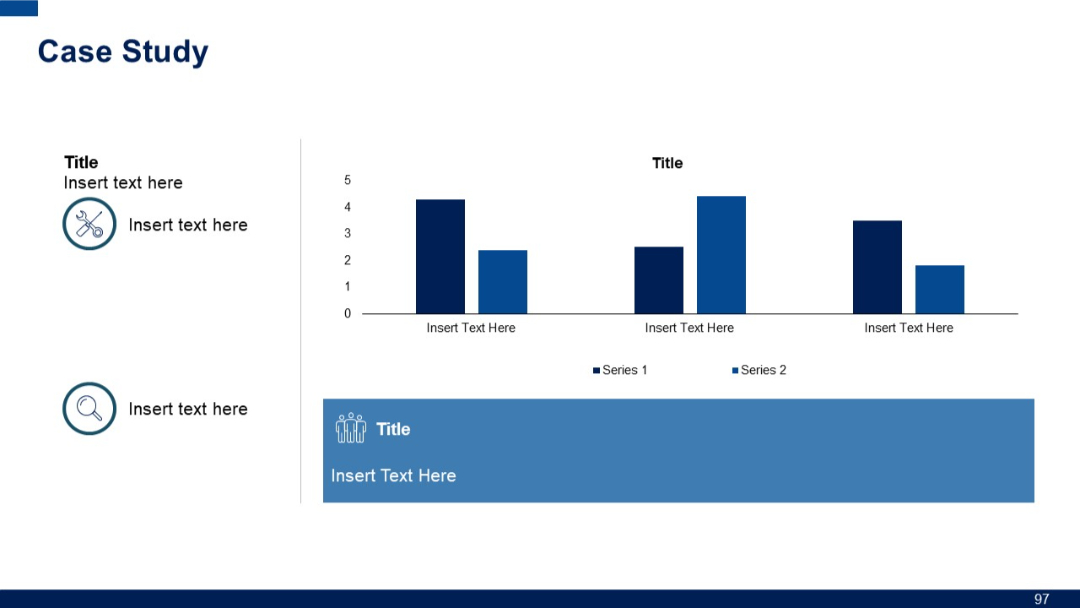
Left-aligned icons with titles and text, paired with a simple bar chart and a wide blue banner at bottom containing an icon and text placeholder.
PRO
Image-heavy slide with cityscape background; text box on the right with icon, headline, and paragraph.

PRO
Four-part ring layout with quadrant division and light center, using icons and bold colors.

PRO
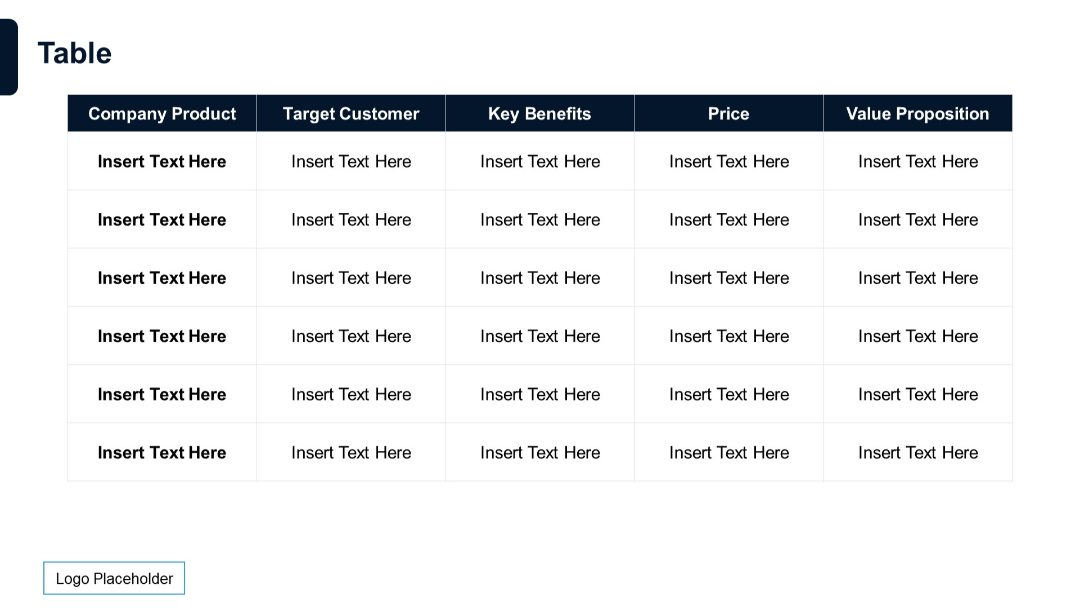
Six-row, five-column table with same format and styling; increased row entries for deeper analysis.
PRO
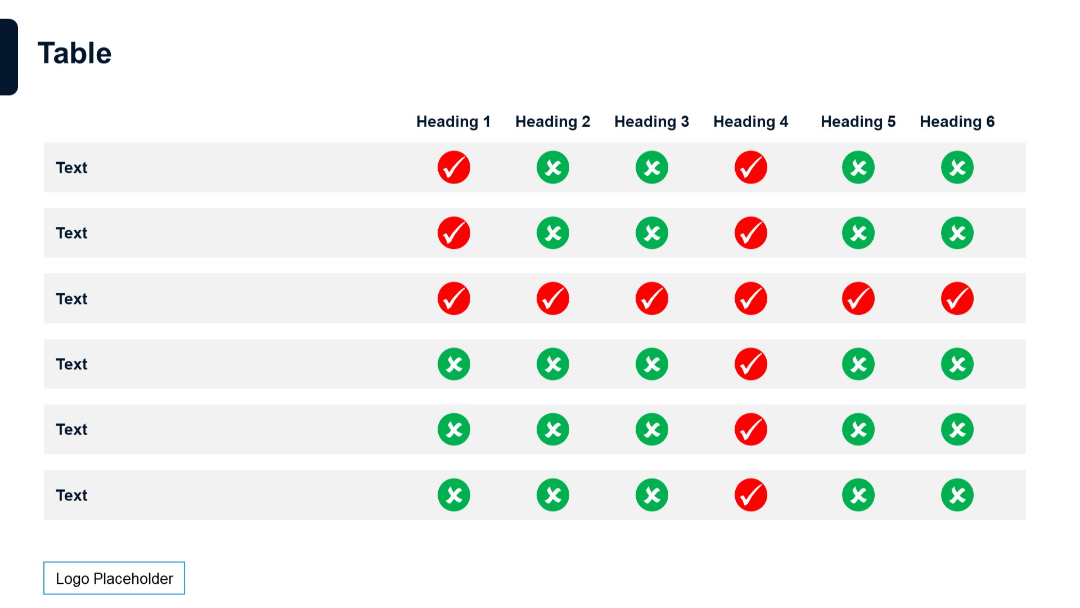
Multi-column checklist-style table with colored check/cross icons across rows and six headers. Grey alternating row fills for clarity.
PRO
White slide with large bold "Thank you!" text and accent slashes. Sparse layout.

PRO
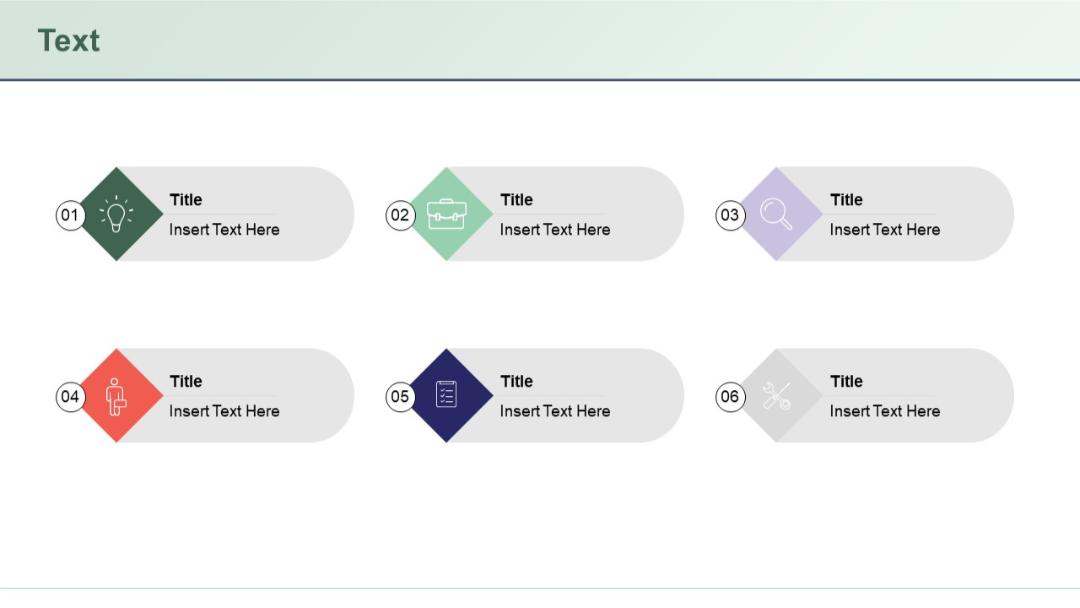
Grid layout of 6 labeled and numbered items using diamond-shaped icons. Each has a symbol (e.g., lightbulb, briefcase) and text title and description.
PRO
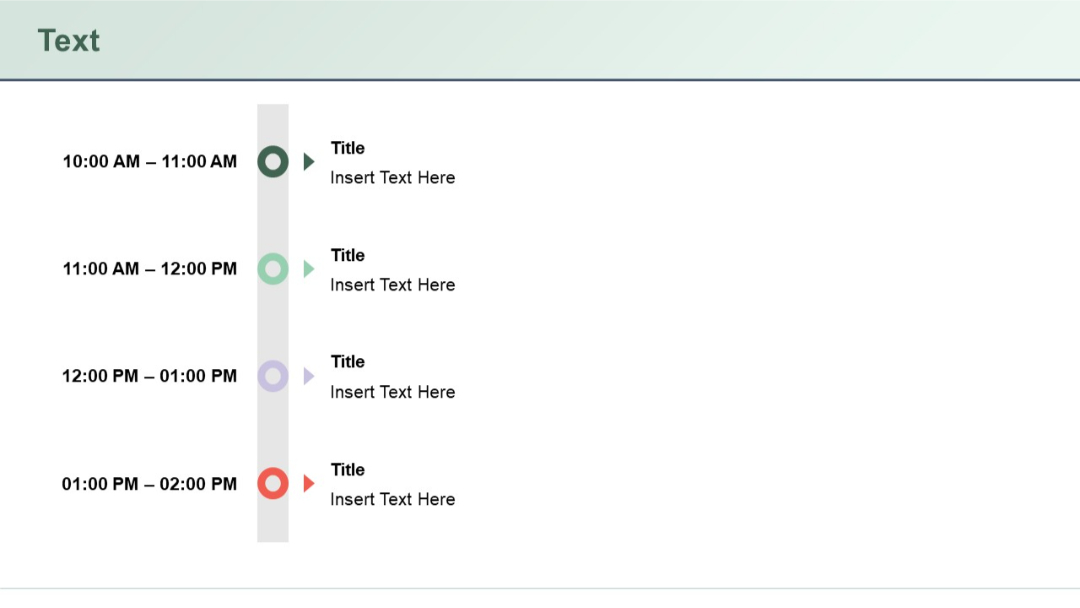
Vertical agenda with time slots on the left and icons (circles with triangle pointers) followed by title and description text.
PRO
Fan-shaped segments with icons and text, transitioning into an upward arrow at the end.
PRO
Semi-circular numbered visual on the left with four aligned title-text rows on the right.
PRO
Circular diagram with 7 connected segments and corresponding outer labels in circular text boxes. Consistent dark blue palette.

PRO
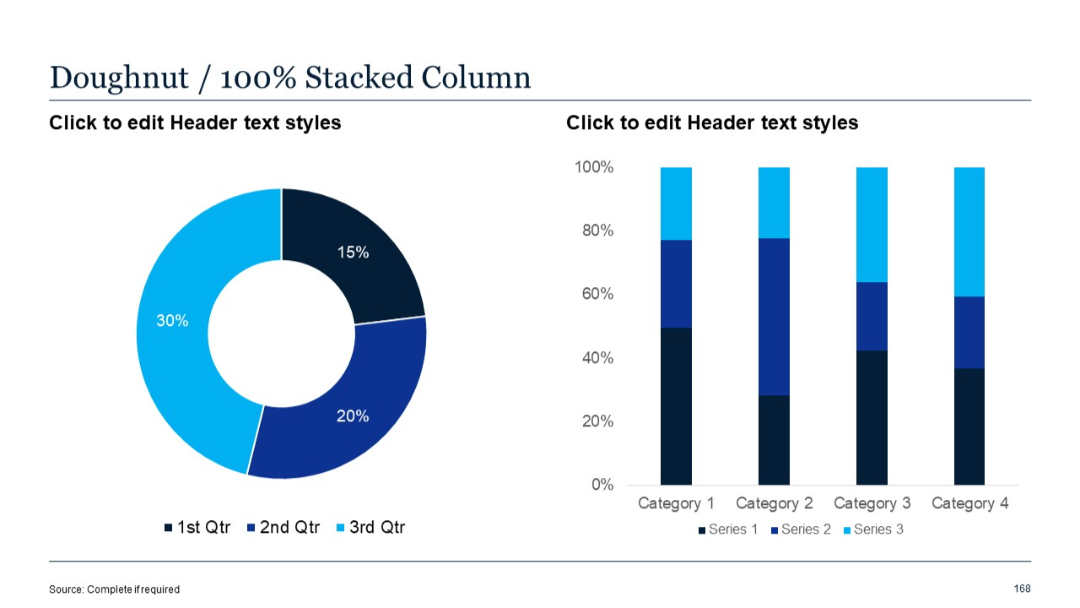
Doughnut chart and 100% stacked column chart showing relative series proportions across categories.
PRO
Matrix-style checklist table with check (✓) and cross (✗) symbols to indicate status or availability across eight columns and two rows.
PRO
Horizontal checklist with circular colored markers and an illustration of a clipboard with checkmarks.

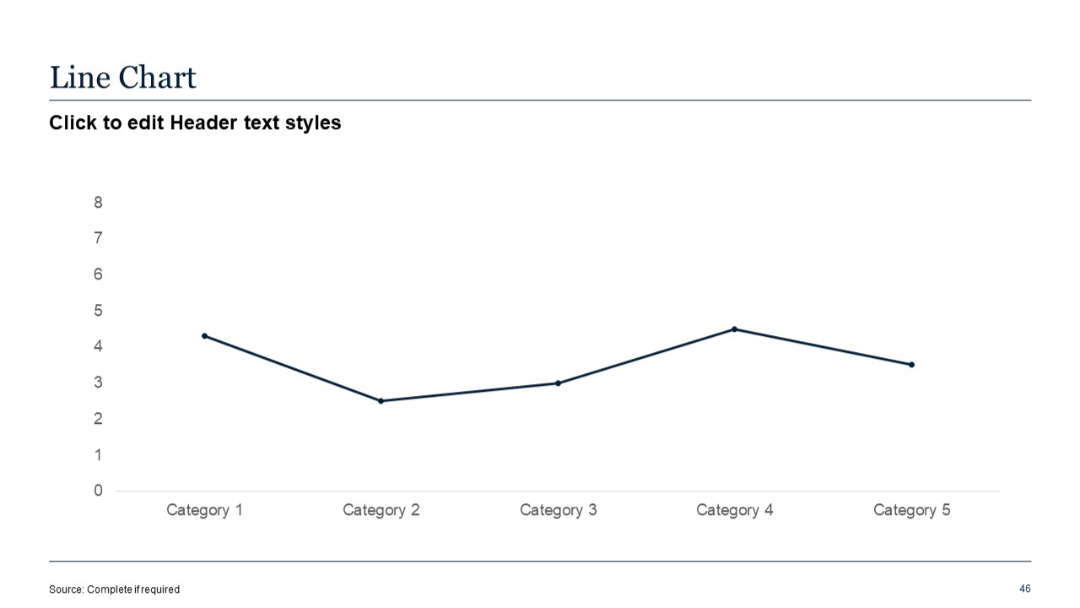
PRO
Simple line chart with one data series plotted across five categories. X-axis shows categories, Y-axis shows numerical values.
PRO
Three interlocked horizontal puzzle pieces in navy, green, and red, each with a central text box labeled "Title" and placeholder text beneath.
PRO
Dark blue background with wave pattern at bottom right; large slide number and subtitle in white text, aligned left.

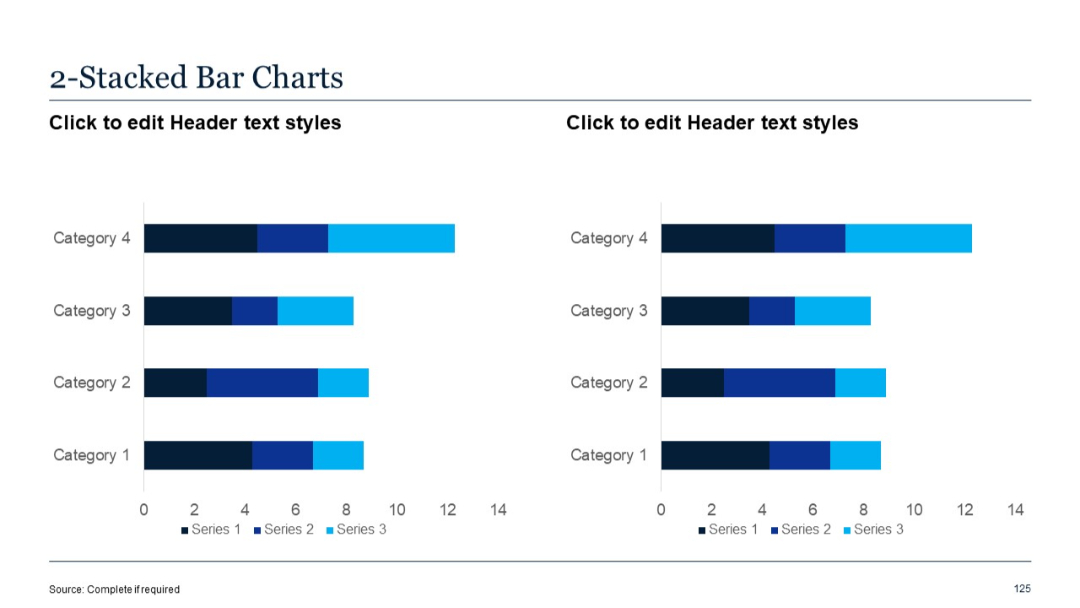
PRO
Two horizontal stacked bar charts placed side-by-side. Three color-coded series in each bar.
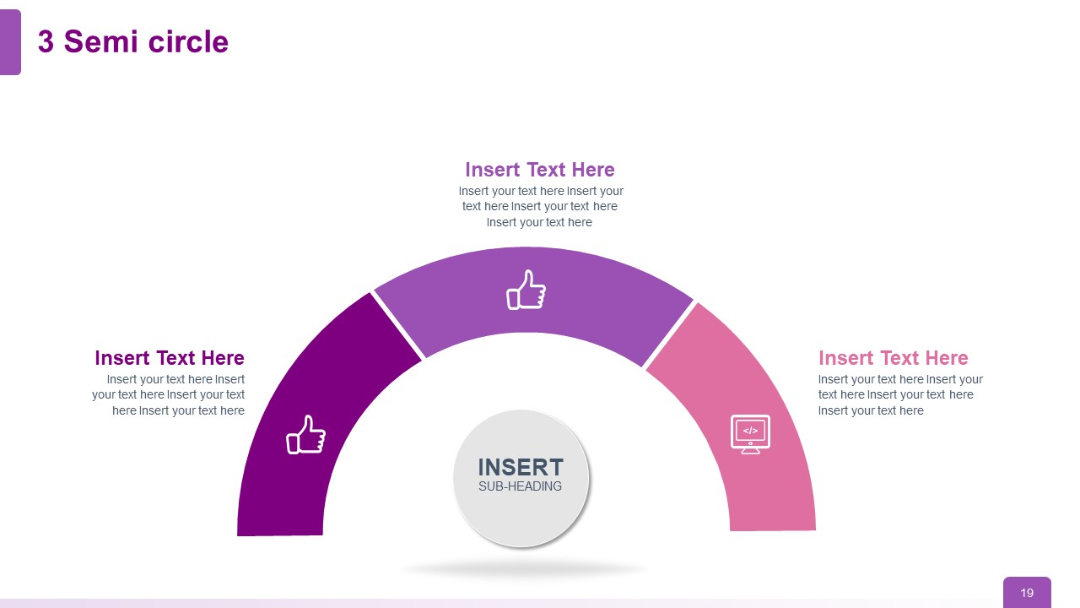
PRO
Three-section semi-circle diagram with center label; icons (thumbs up, computer) in each arc segment; clean design with gradient colors.
PRO
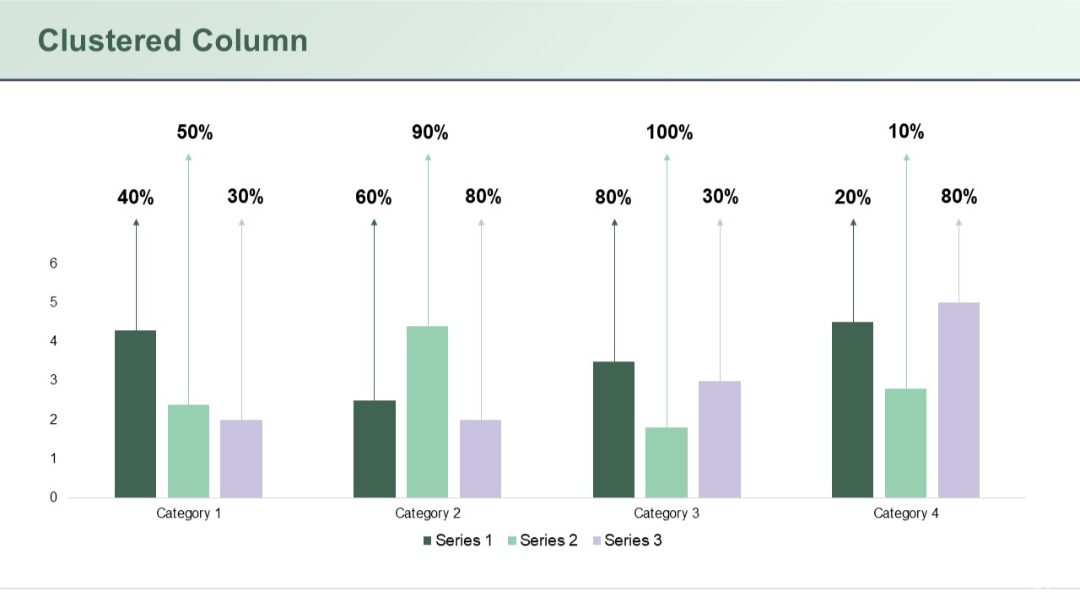
Simple clustered column chart layout with three vertical bars per category and percentage labels above each column. Light gradient background.
PRO
Left chart is a stacked vertical column, right chart is a line graph. Both use three consistent series colors in blue tones.

PRO
A minimal tree diagram with two circular nodes (icons: lightbulb, computer monitor) extending from two branches; clean white background with purple accents.

PRO
List of 5 items with gear-shaped icons numbered 01–05 on the left. Each item has a bolded title and description text.
PRO
Minimal layout with two icons and text blocks positioned left and right of a diamond-shaped central graphic. Clean, white background.
PRO
Minimalist layout with bulleted text and a thick red progress bar on top.
PRO
Two-part segmented circle infographic in the center, each half labeled 1 and 2 with adjacent text boxes.

PRO
Curved ascending timeline with four flag-style text boxes connected to numbered circular markers from 1 to 4 along a rising path.
PRO
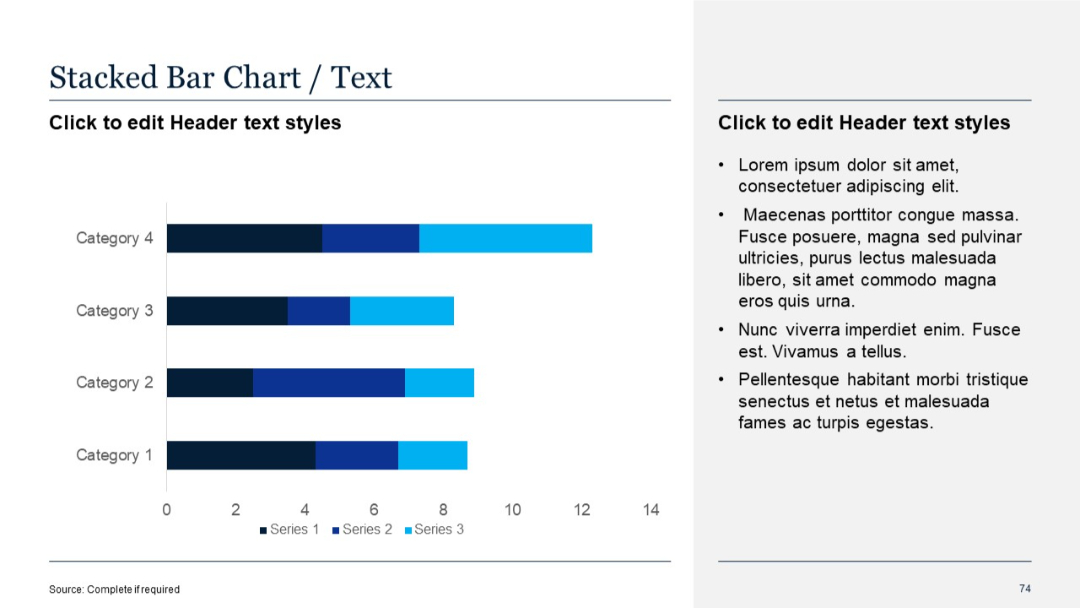
Horizontal stacked bar chart with three data series per category. Bullet points on the right. Varying shades indicate different data series.