PRO
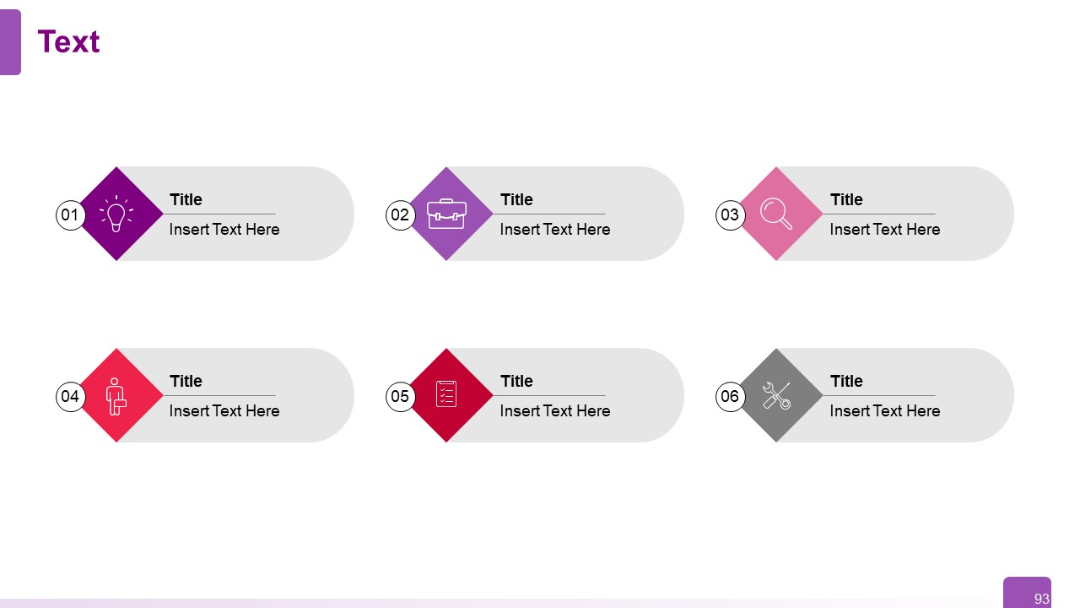
Split-screen layout with two data tables: Operational Metrics (left) and Customer & Revenue Metrics (right). Each table includes "Before" and "After" columns.
PRO
Two-column layout over a background image. Left side features grayscale architecture image with blue overlay. Right side includes two subtopics with short paragraphs in blue text. Balanced visual and textual design.

PRO
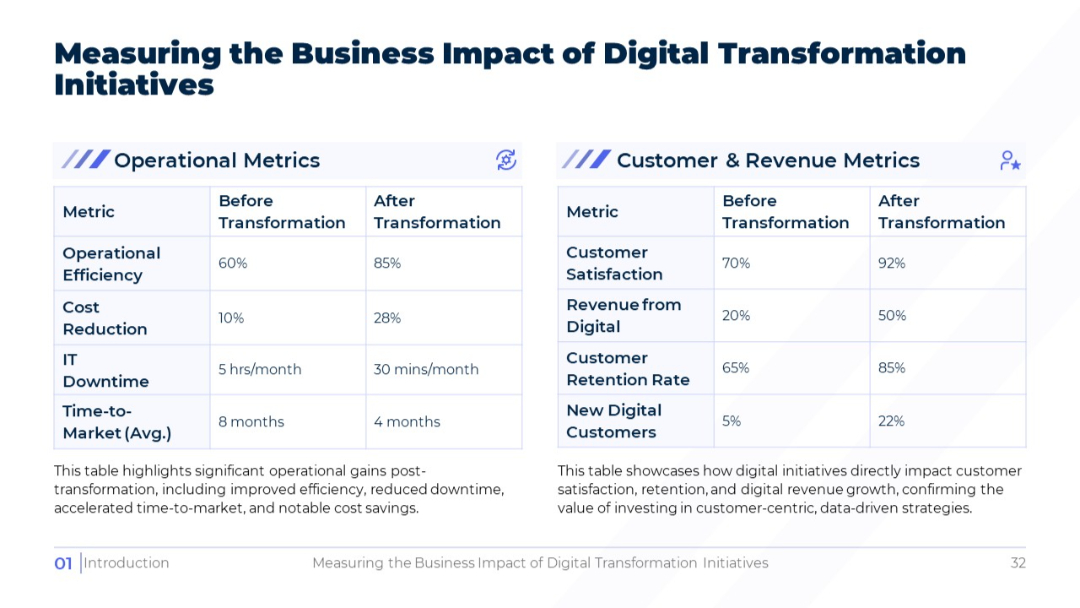
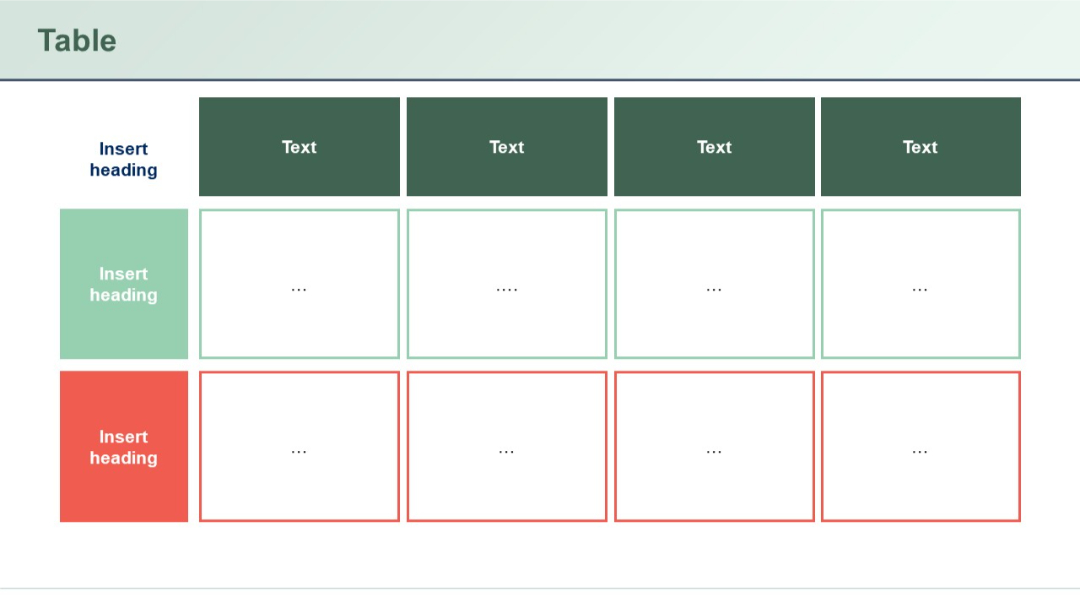
Multi-row, multi-column table with bullet points in each cell, dark blue headers and sidebars. Structured to hold detailed text under each heading.
PRO
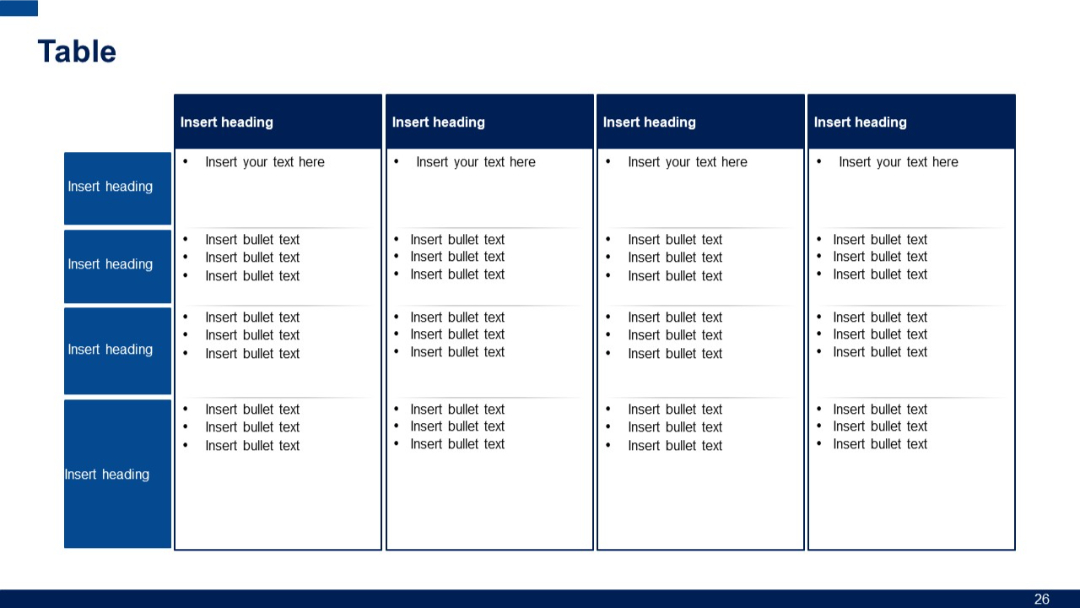
Horizontal bar chart with rows and columns; light purple bars across a grid representing tasks over time. Dark green headers, minimal labeling.
PRO
Four evenly spaced columns with bullet lists; simple structure, clean background.
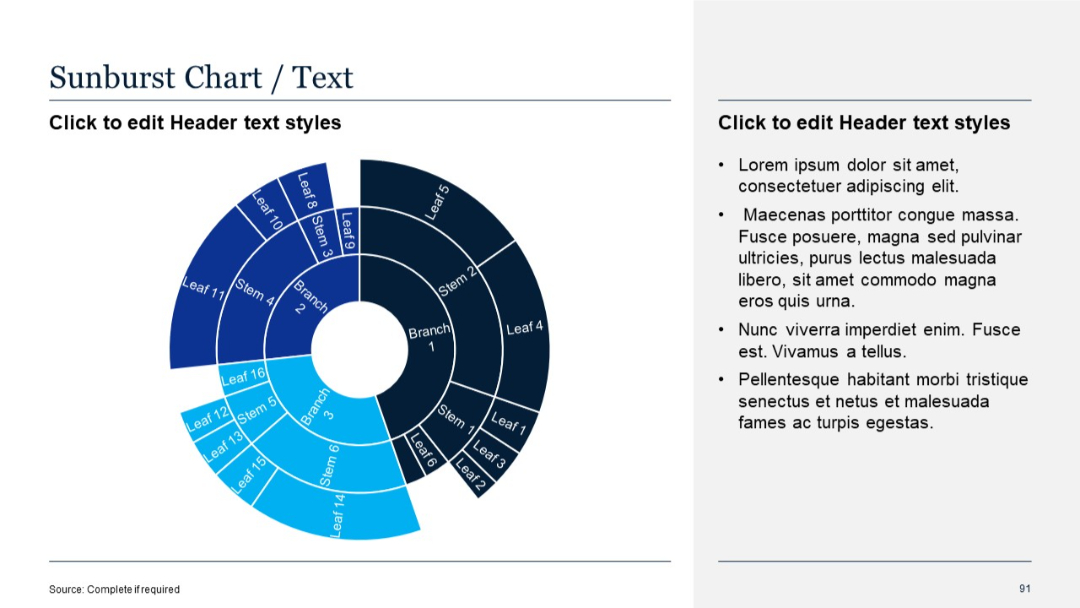
PRO
Left side features a multi-layered sunburst chart with branches, stems, and leaves. Right side has bullet text list.
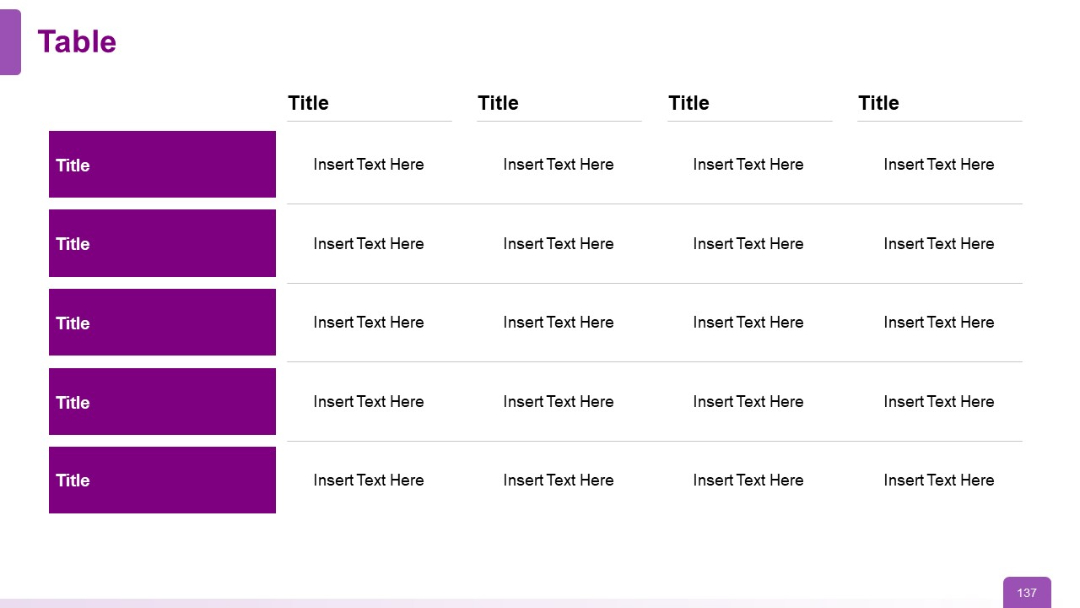
PRO
Extended table with five rows, maintaining the format of purple title columns and placeholder text across the grid. Balanced and symmetrical layout.
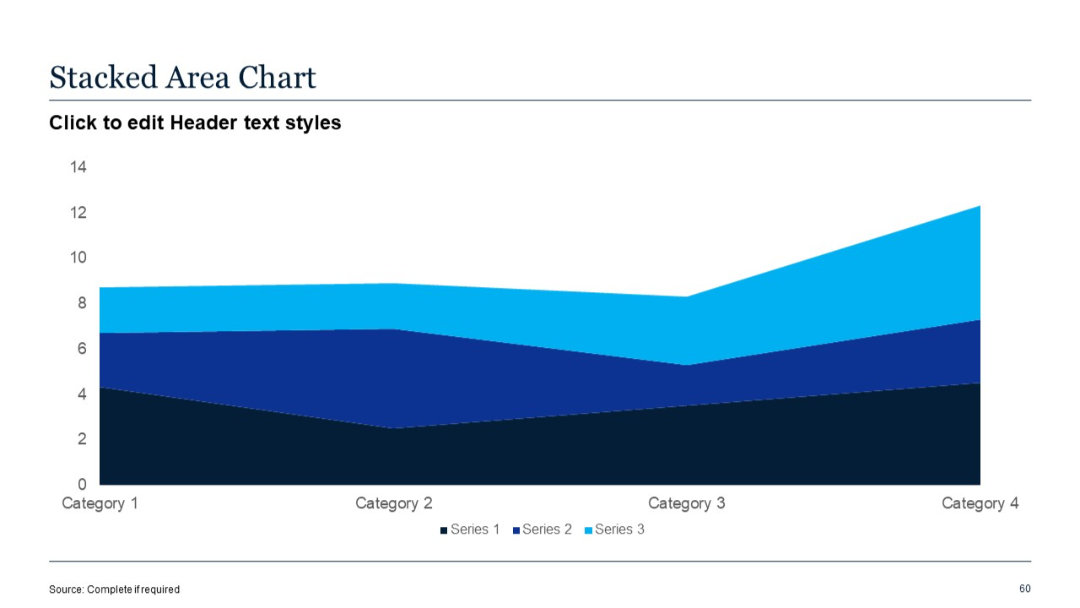
PRO
Filled stacked area chart; three data series; values build upon each other across four categories.
PRO
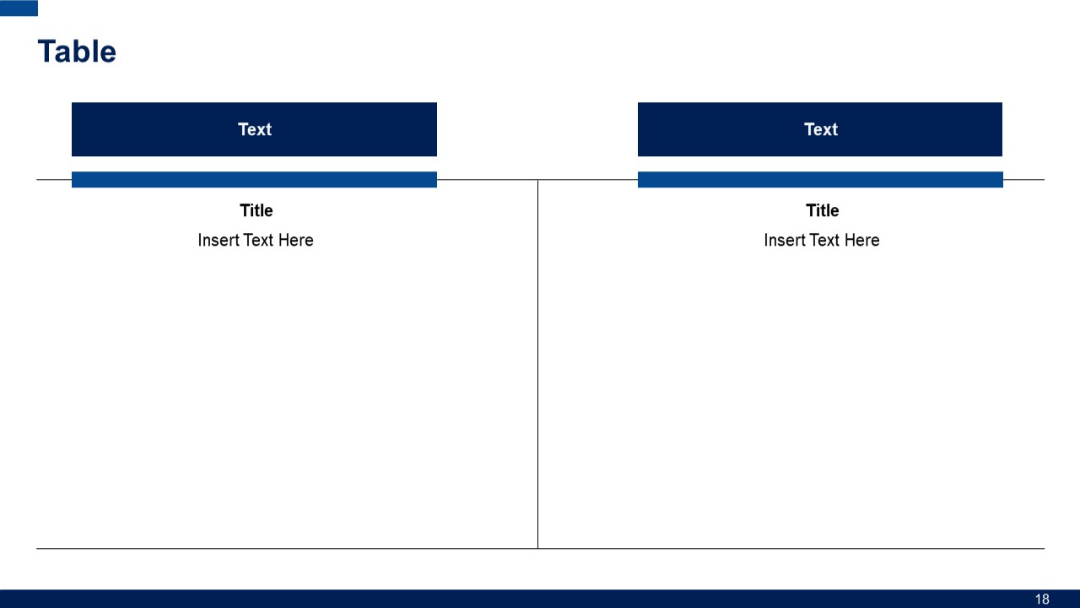
Two vertical content panels with a top and mid header section, separated by lines. Blue headers titled "Text", followed by titled body sections.
PRO
Color-coded comparison table with one column for row headers and four columns for attributes. Check/cross indicators and call-to-action boxes at bottom.

PRO
Dark blue background with a structured two-column table listing digital challenges and corresponding solutions. Icons represent each solution, and a footer includes a performance improvement summary.

PRO
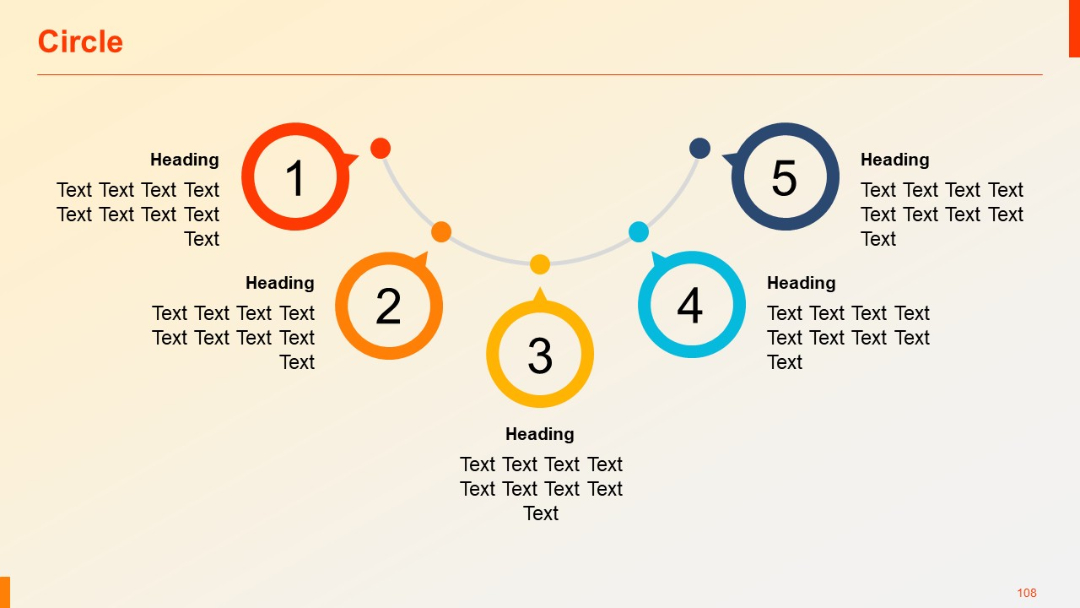
Five-step circular process with arrows linking numbered icons in an upward curve; corresponding headings and text per item.
PRO
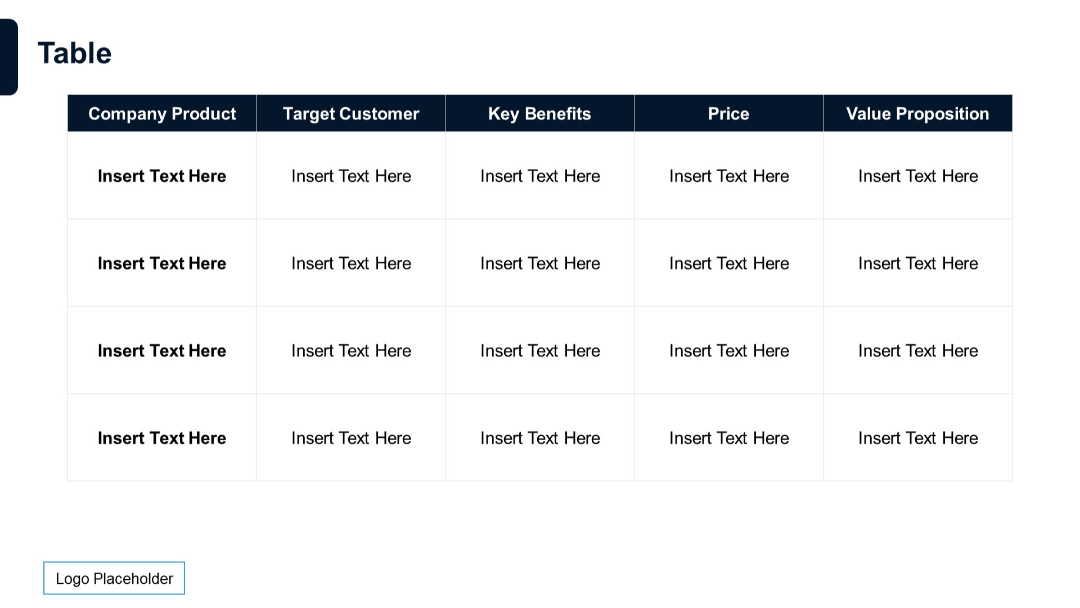
Four-row, five-column table layout identical to previous slide but extended vertically with more entries.
PRO
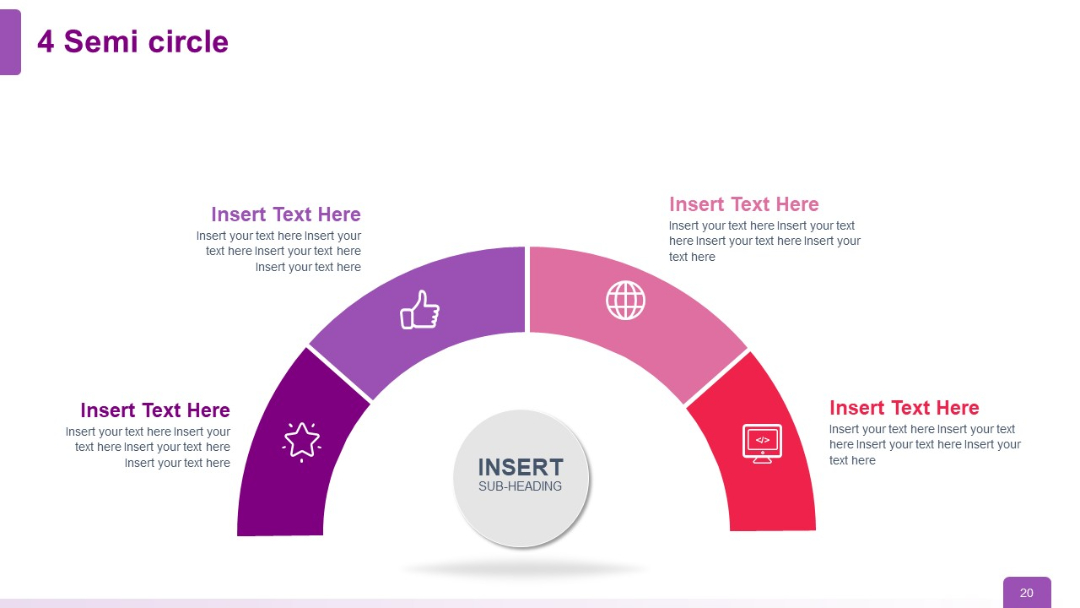
Four-segment semi-circle chart with a central sub-heading and evenly distributed arc segments; icons: star, thumbs up, globe, computer.
PRO
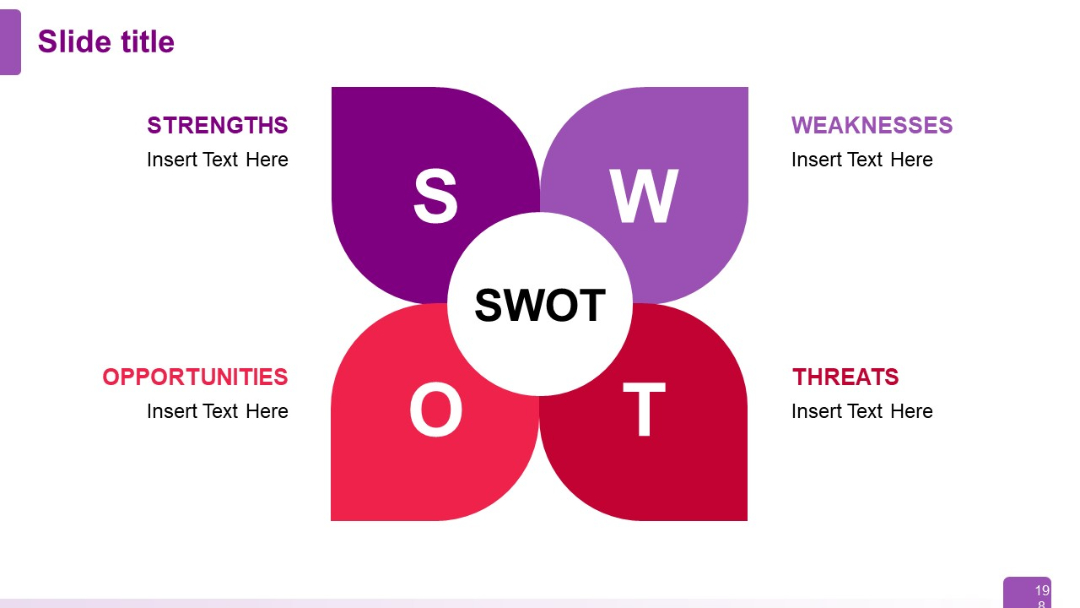
Petal-style SWOT layout with S, W, O, T in symmetrical floral design; white center circle.
PRO
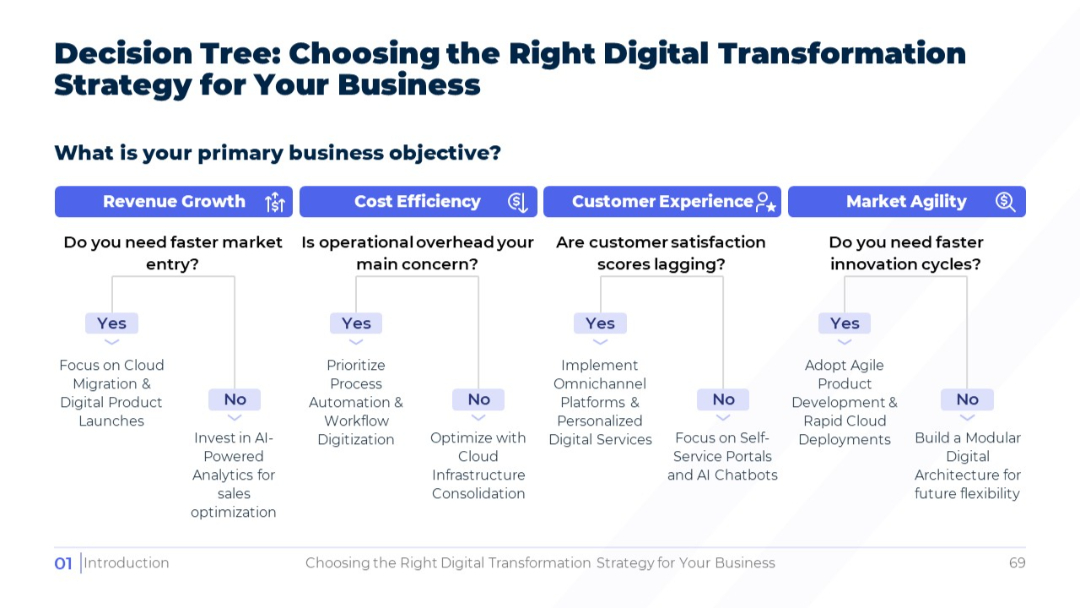
Decision tree layout with four color-coded branches representing business objectives. Each branch leads to yes/no paths and corresponding recommendations.
PRO
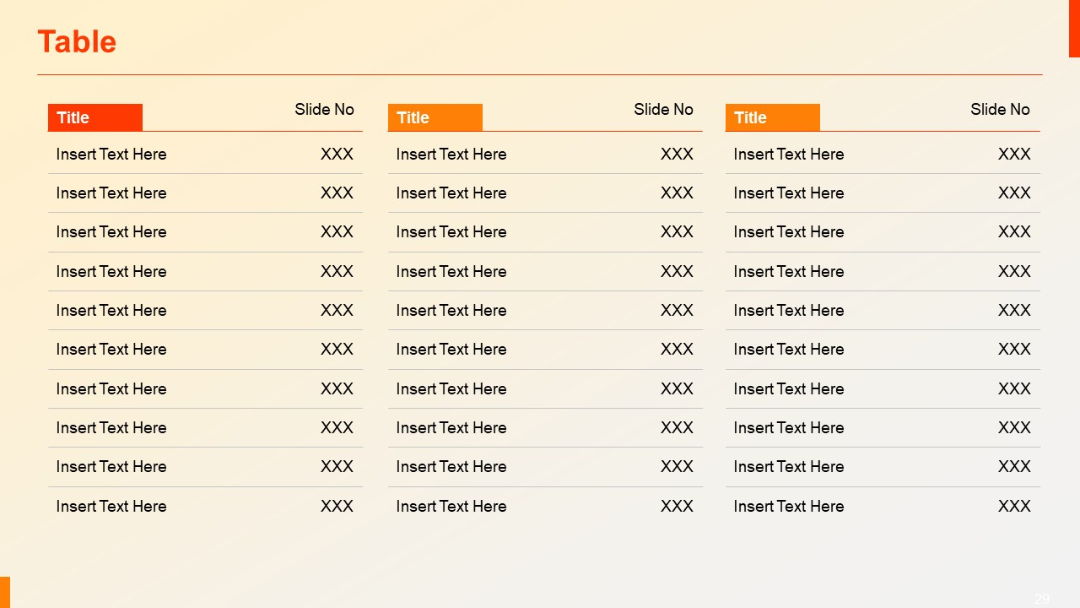
Extended table with three comparison blocks across the slide; each includes a title and multiple content rows with slide numbers for reference.
PRO
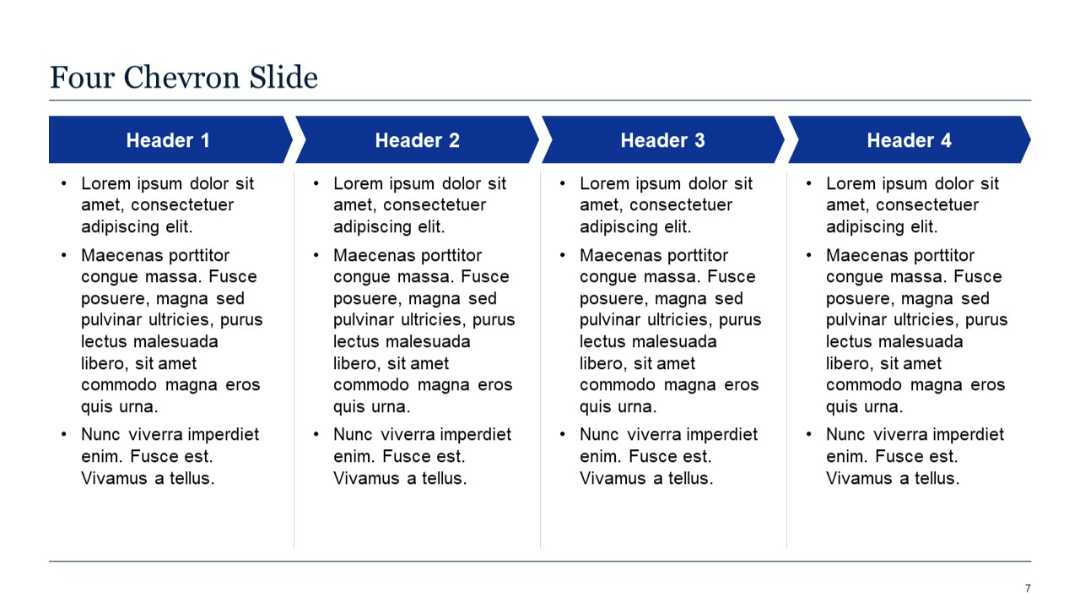
Four horizontal chevrons with associated text sections underneath.
PRO
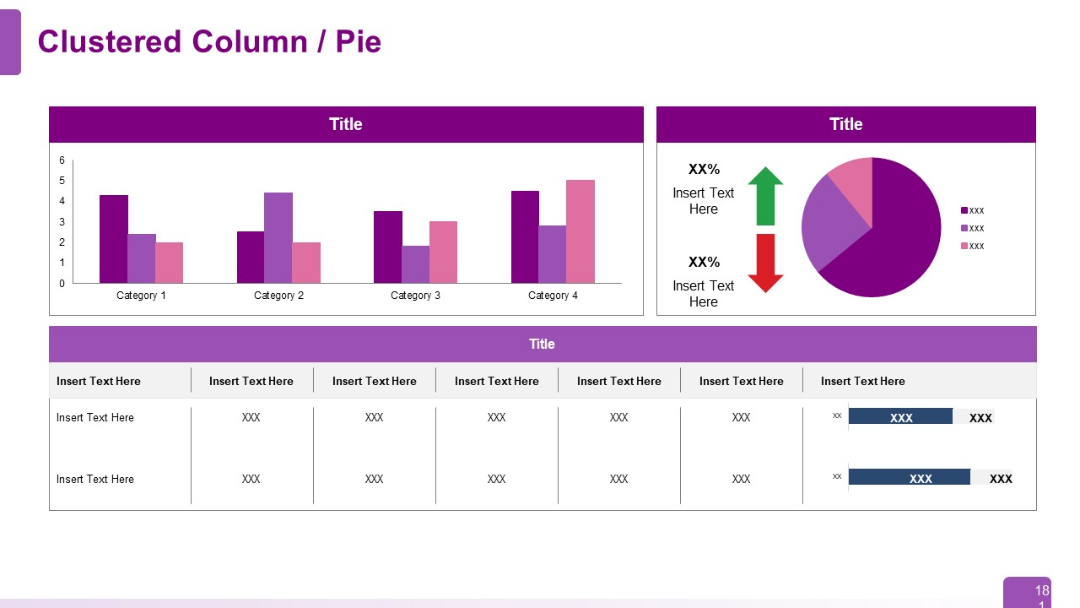
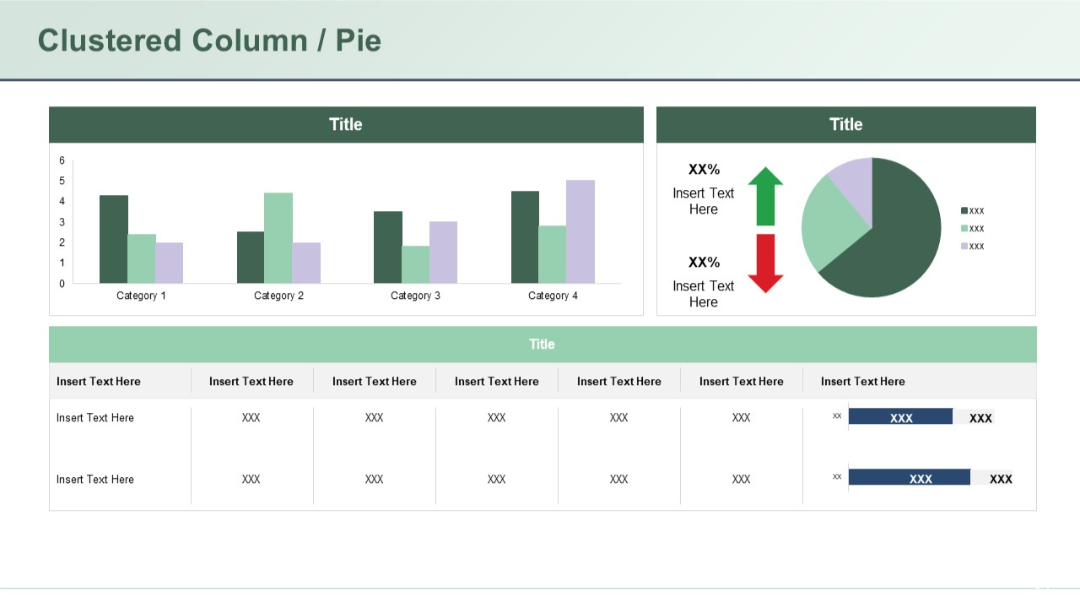
Split layout with top section showing a clustered column chart (4 categories) on the left and a pie chart with icons and text placeholders on right. Bottom section is a data table with shaded cells.
PRO
Center-aligned dark blue quote box with quotation marks, placeholder text, and empty white space.

PRO
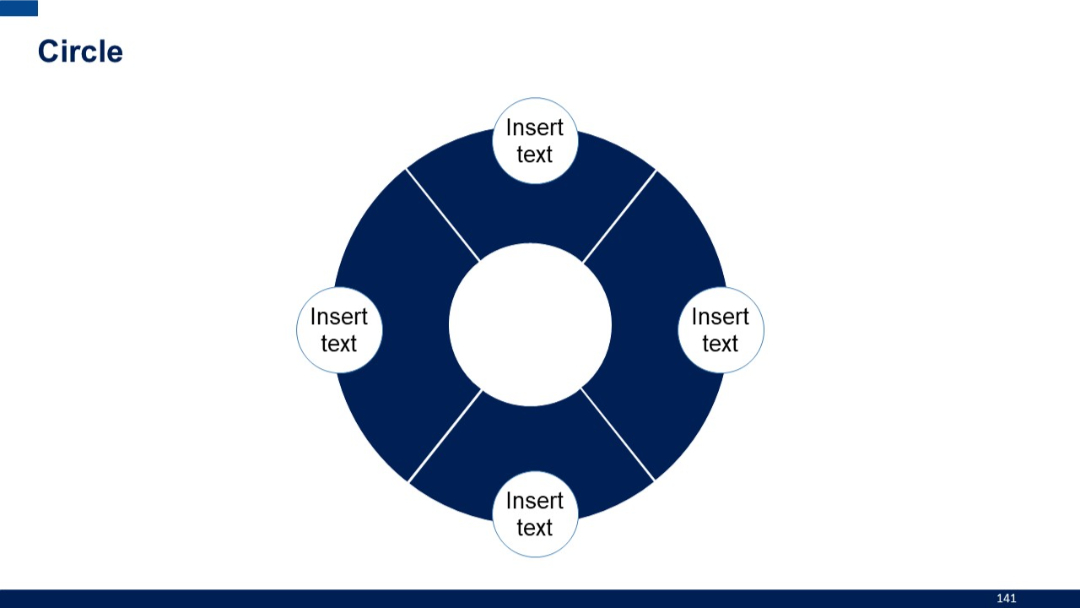
Simple circular diagram divided into 4 equal quadrants with labels placed on small circular nodes outside each quadrant. Dark blue background circle with white nodes.
PRO
Vertical list with 5 horizontal green rounded boxes, each preceded by a circle on the left, aligned along a central timeline line.
PRO
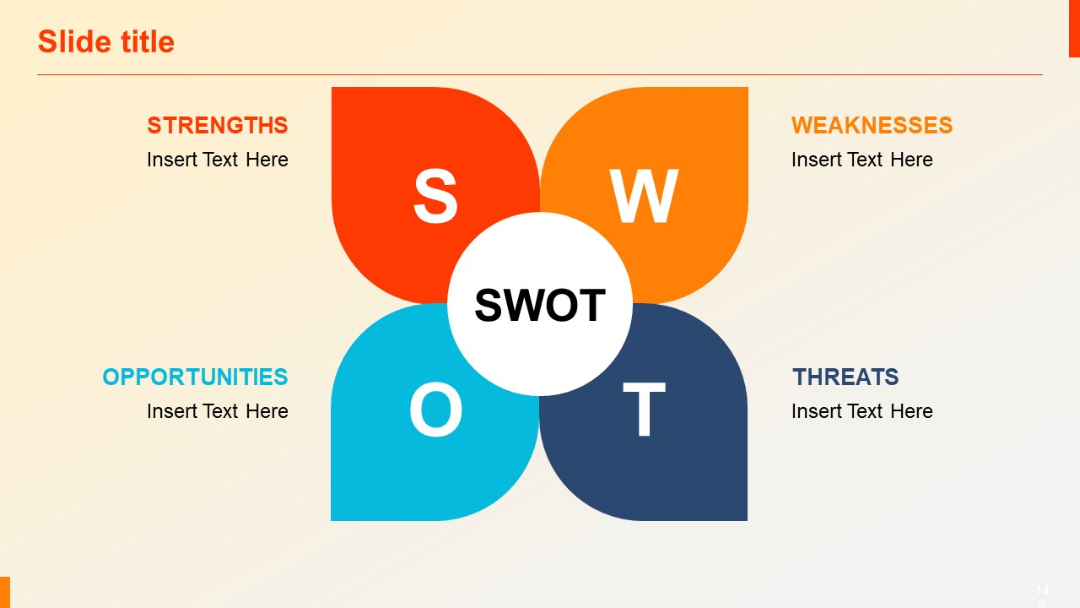
Petal-shaped quadrant layout with each SWOT letter in a rounded segment; central “SWOT” circle.
PRO
Three-color-coded rows (green, red, white) and a matrix-style 3x4 grid. Boxes contain ellipses or placeholders.
PRO
Symmetrical dual-column timeline with vertical lines and circular nodes connecting horizontally placed text.
PRO
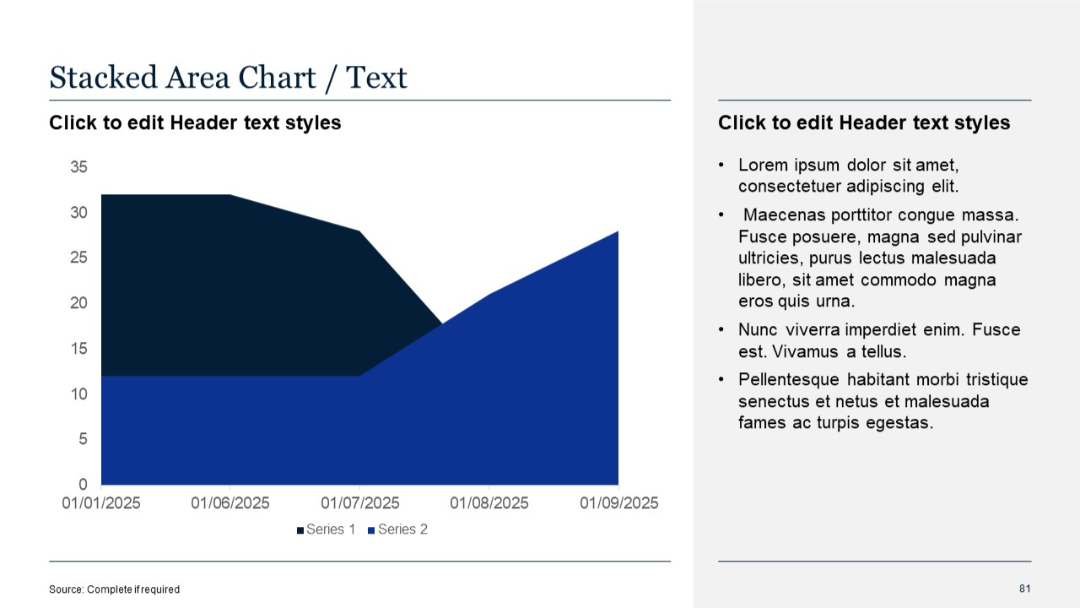
Two-column layout with a stacked area chart on the left and bulleted text on the right
PRO
Two clustered horizontal bar charts, each grouping three series per category with different colors.

PRO
Top section shows a clustered column chart and pie chart side-by-side. Bottom section includes a structured table with placeholder text.
PRO
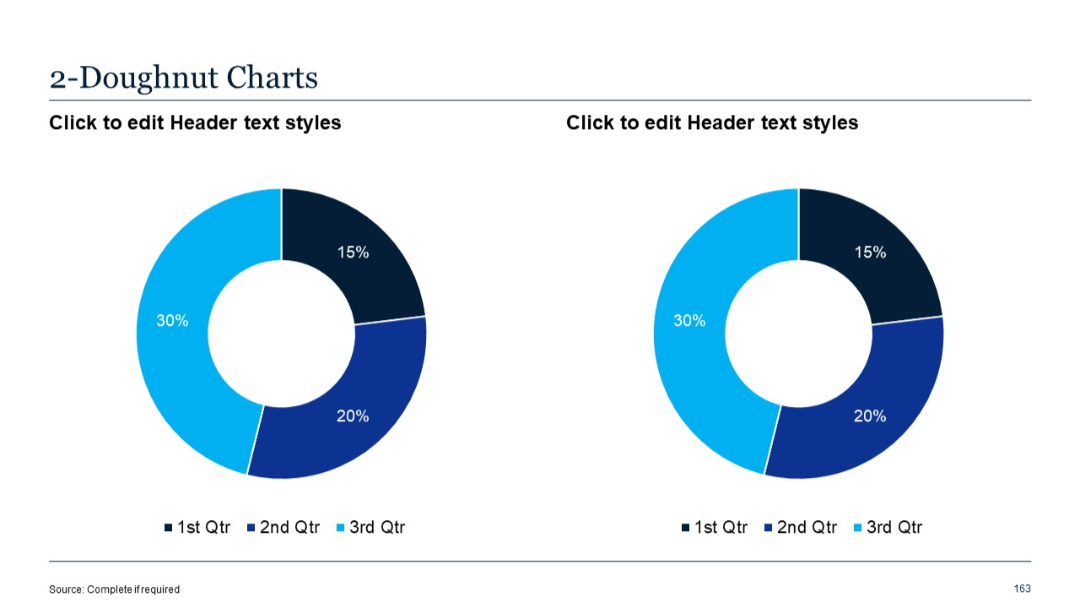
Two doughnut charts placed side by side, each divided into three labeled and color-coded segments.
PRO
Grid-based layout with six rounded diamond and rectangle shapes in two rows; each has an icon, number, and placeholder text.