PRO
Horizontal timeline with 5 milestones (2018–2022). Each milestone has an icon and space for headings and text. Color-coded per year.

PRO
Dark background slide with bold section title and supporting bullet points. Clean layout with structured spacing.

PRO
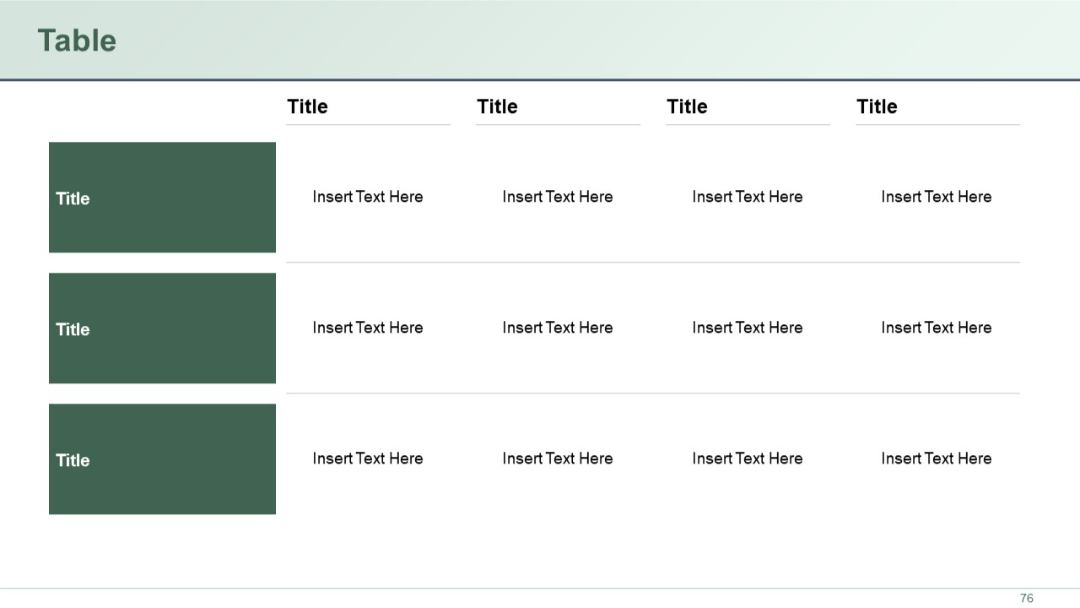
A wide 5-column by 3-row table with large dark green blocks in the first column acting as row headers. Text fields are placeholders.
PRO
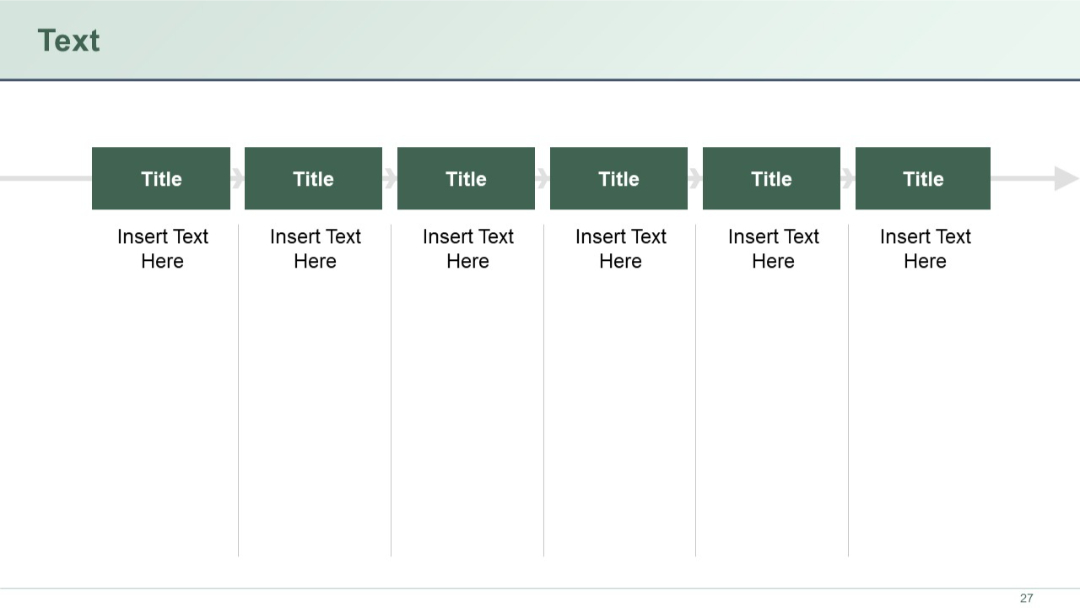
Linear process flow using six vertical columns with arrows pointing right. Each block contains title and placeholder text.
PRO
Section divider slide with large text "02 Graphic Slides" on a dark blue gradient background with wave graphics.

PRO
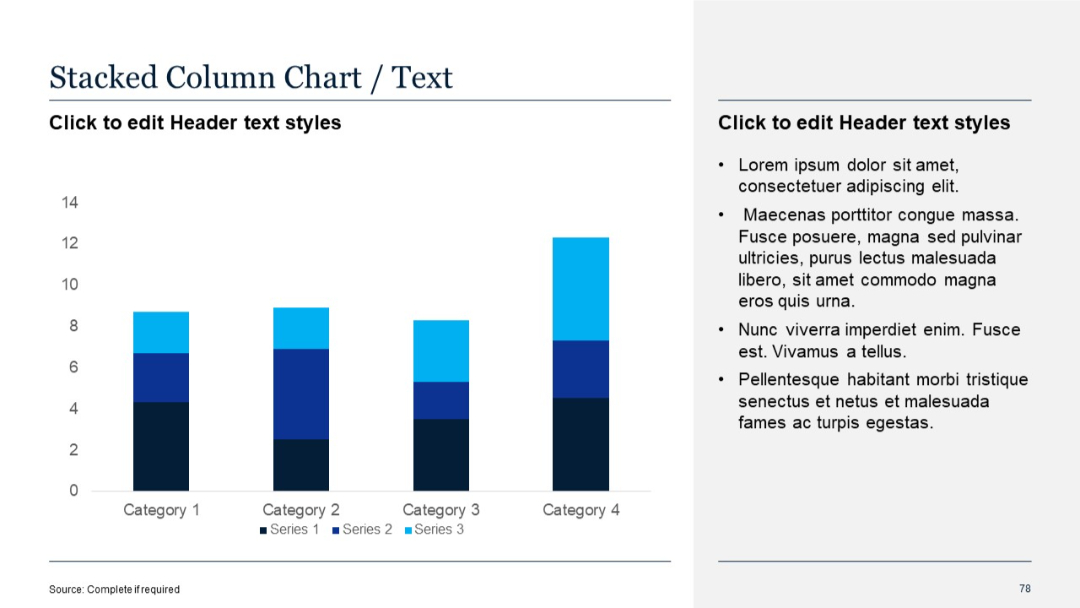
Vertical stacked column chart showing cumulative values for three series across four categories. Distinct color coding for each series.
PRO
Horizontal clustered bar chart overlaid with a line graph; dual axis layout.

PRO
Vertical timeline with gear/checkmark icons on the left and corresponding bullet text items aligned to the right.

PRO
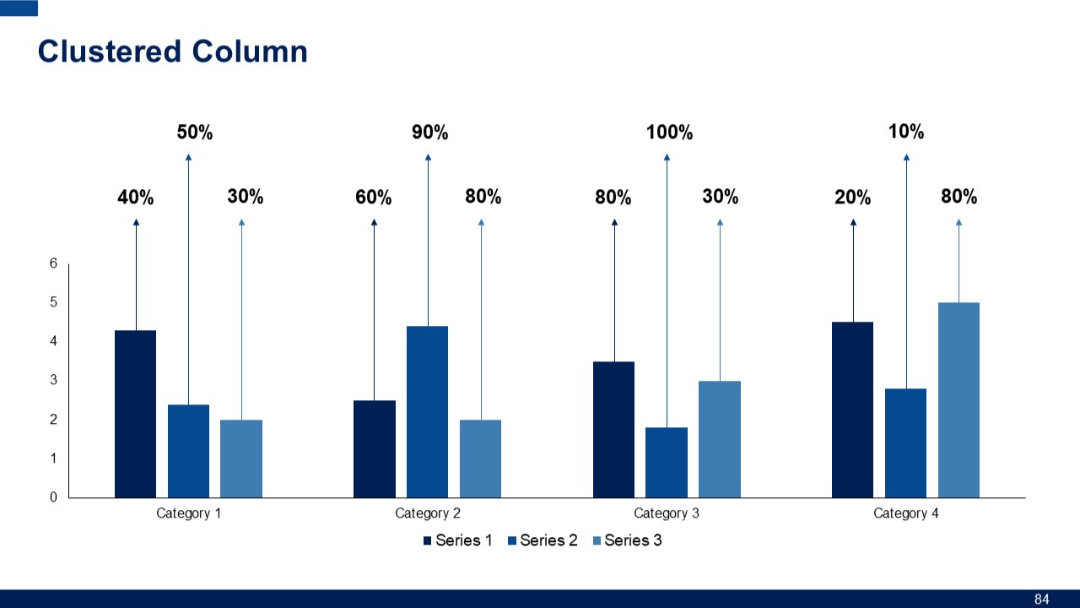
Clustered column chart showing performance of three series across four categories, with percentage values labeled above each bar.
PRO
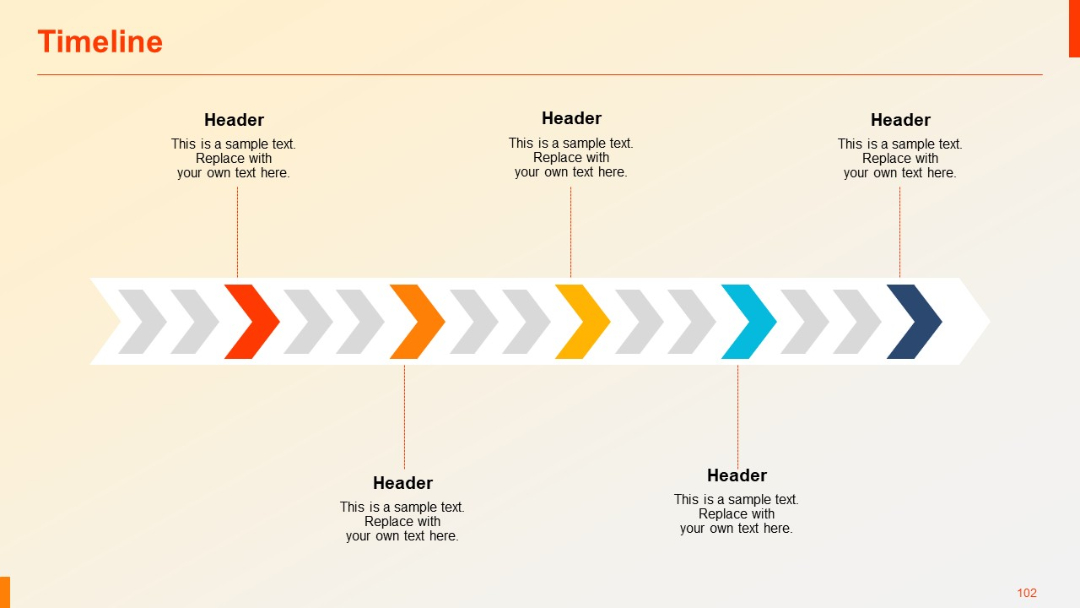
Horizontal arrow-based timeline with four key points marked with colored arrows and vertical text callouts; clean with a modern gradient.
PRO
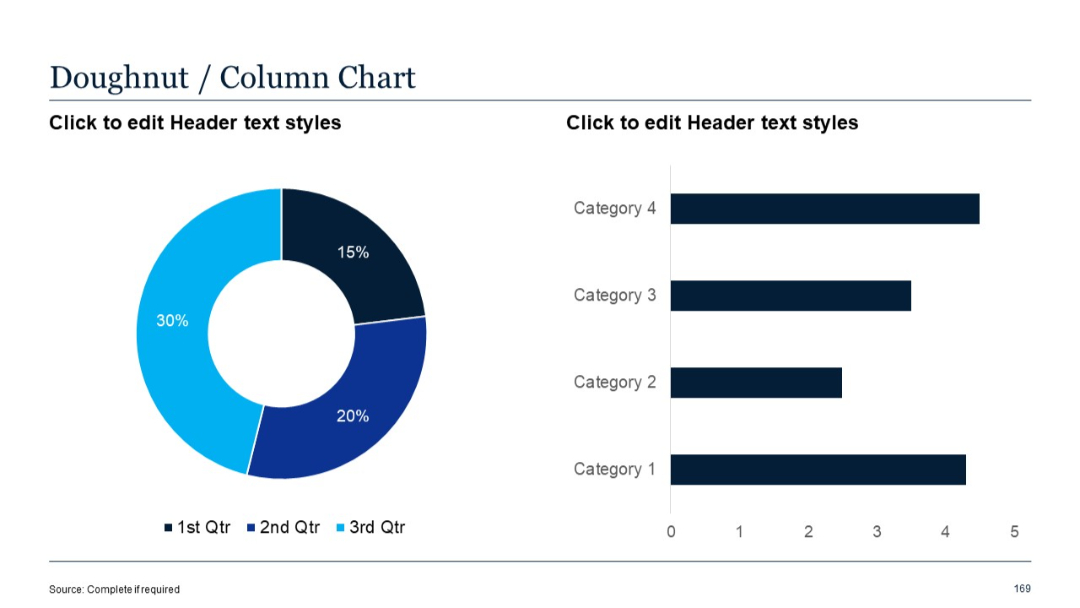
Doughnut chart with corresponding horizontal bar chart (column format) for four categories.
PRO
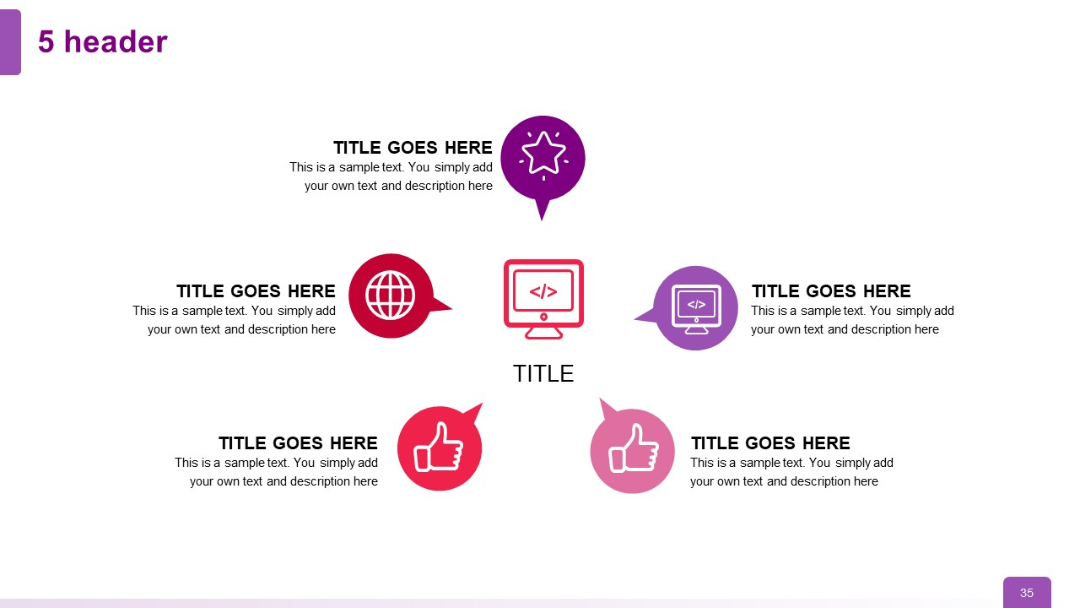
Pentagonal layout around a central icon, with five surrounding icons and corresponding text blocks, maintaining circular balance.
PRO
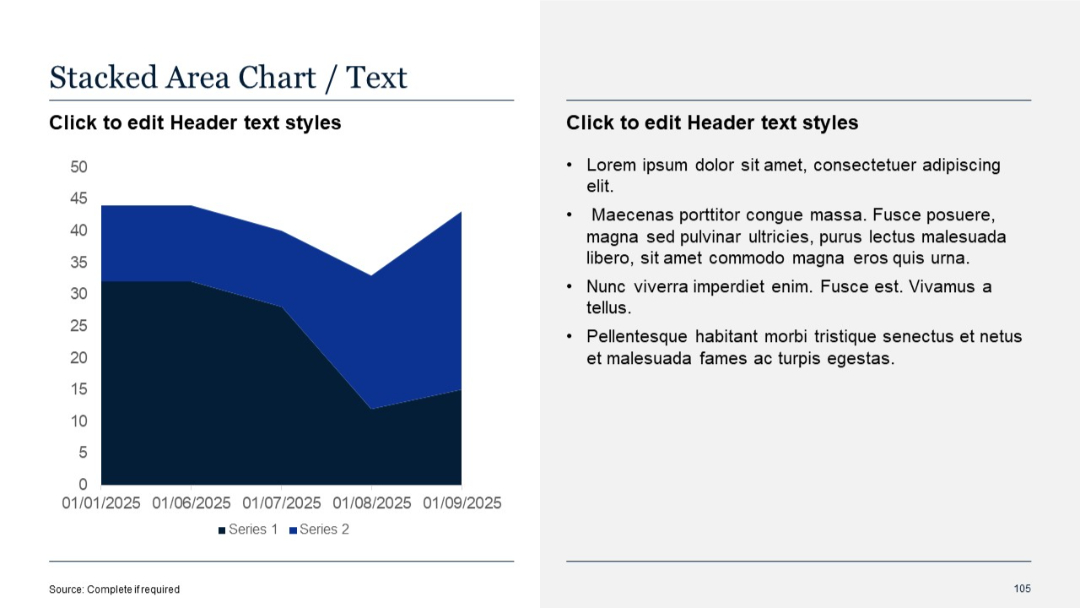
Similar layout with a stacked area chart (larger scale); right panel includes bullet point text.
PRO
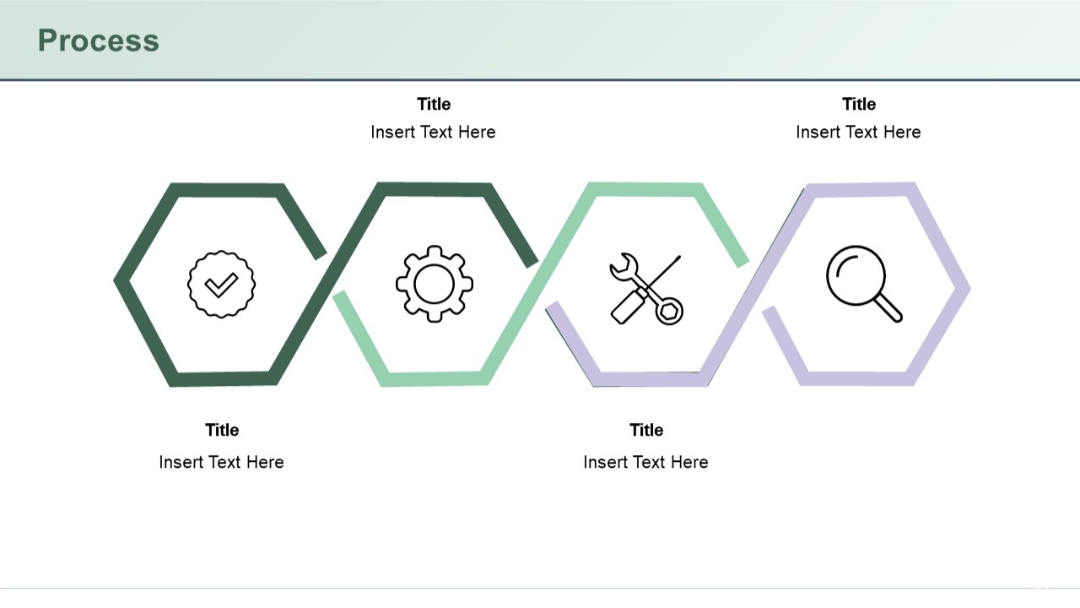
Hexagonal outline icons connected in a horizontal layout with text placeholders above and below each icon.
PRO
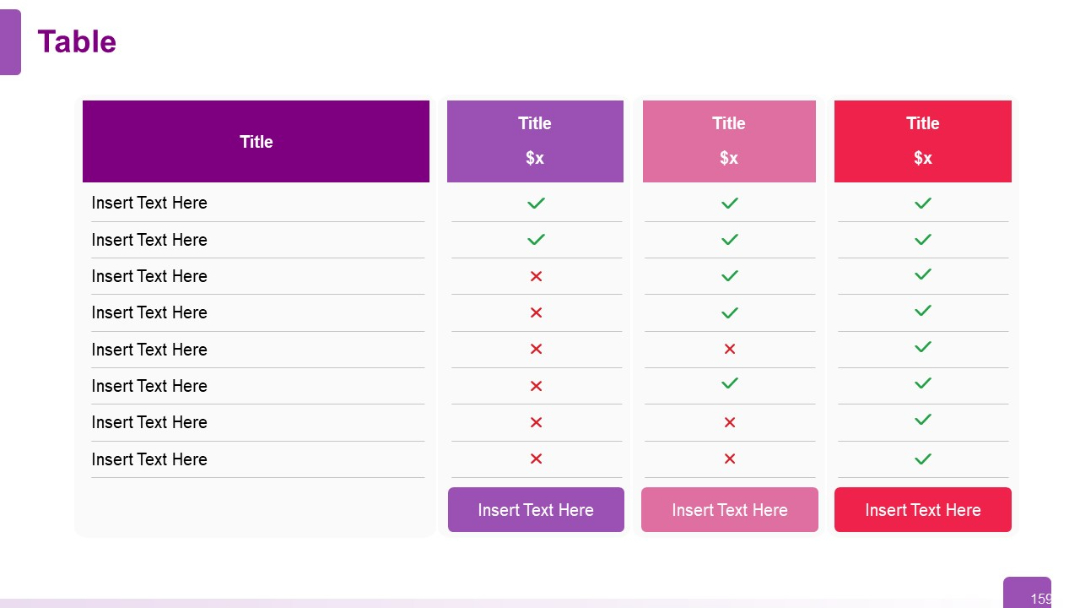
Comparison table with one descriptive column and three evaluation columns. Includes pricing headers and check/cross indicators for feature availability.
PRO
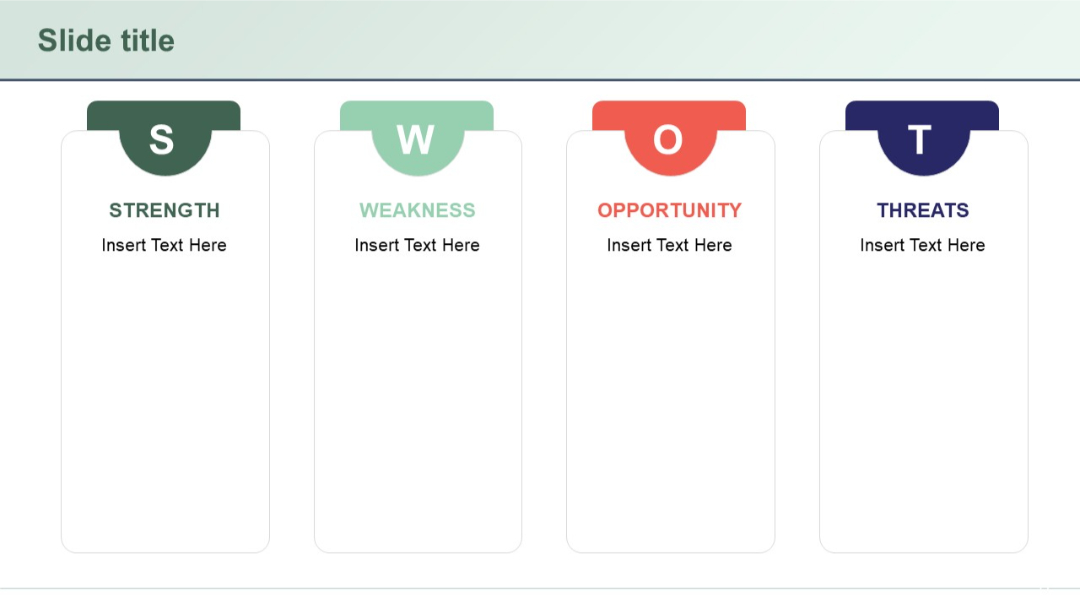
Modern layout with rounded-top cards and large letter icons (S, W, O, T) above each section. Clean and minimal.
PRO
Duplicate of slide 53, with nearly identical layout and content—map and three vertical columns for focus areas.

PRO
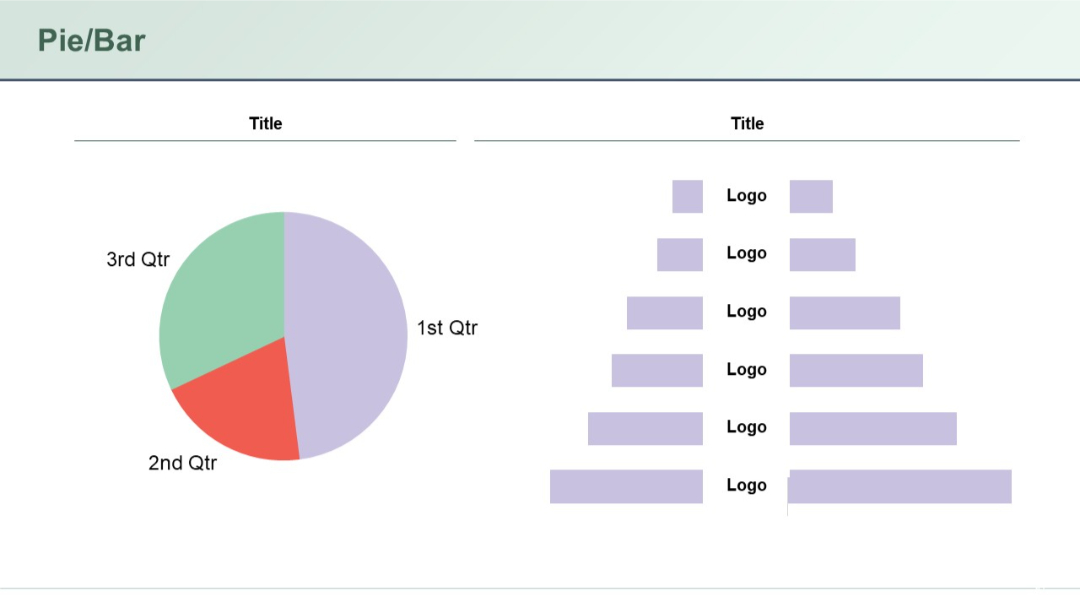
A combined visual slide with a pie chart on the left and pyramid-style stacked bar chart on the right.
PRO
Two-row, five-column table with dominant purple title blocks in the first column. Minimalist, structured layout with text placeholders.
PRO
Minimalist transition slide with large “03” in orange and text “Quantitative Slides” underneath, on a beige background with a horizontal line.

PRO
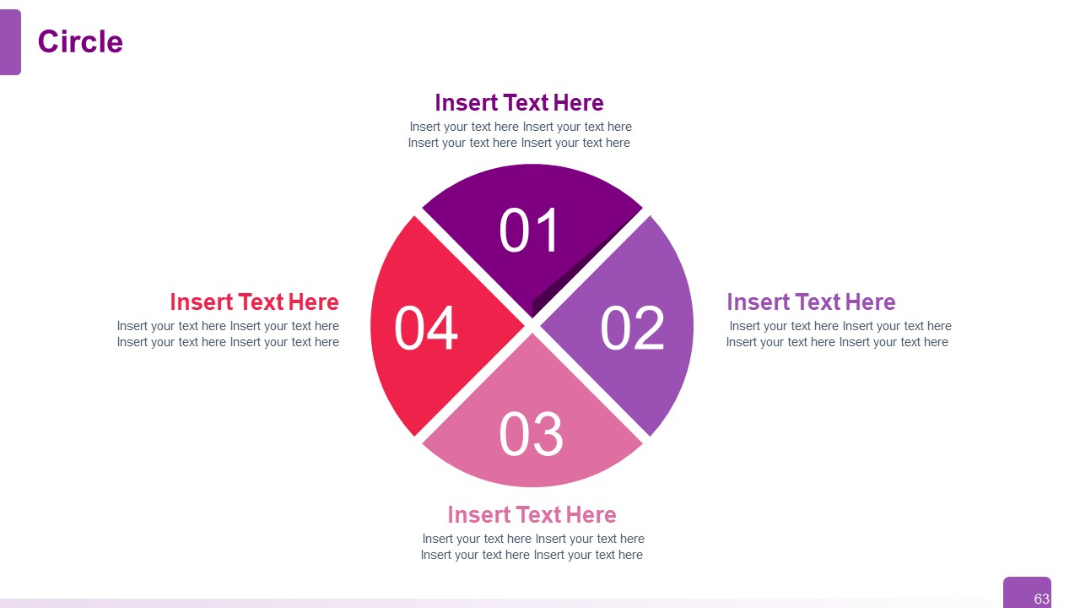
A 4-part pie chart segmented into quadrants with large numeric labels (01–04) and surrounding editable text areas.
PRO
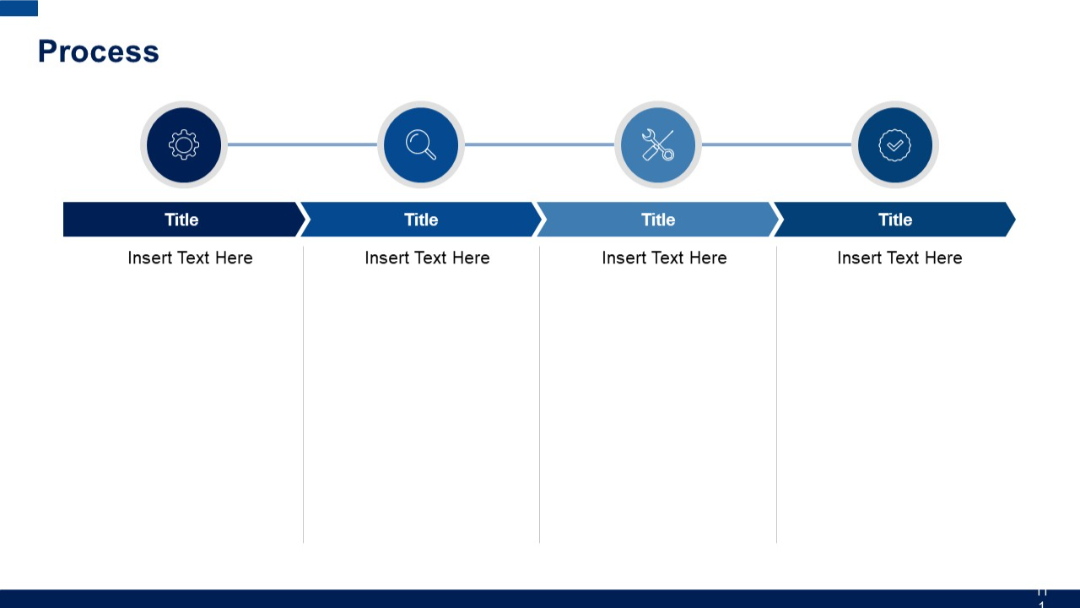
Horizontal step-based layout with four circular icons connected by a line at the top. Below each icon is a title box and placeholder text box.
PRO
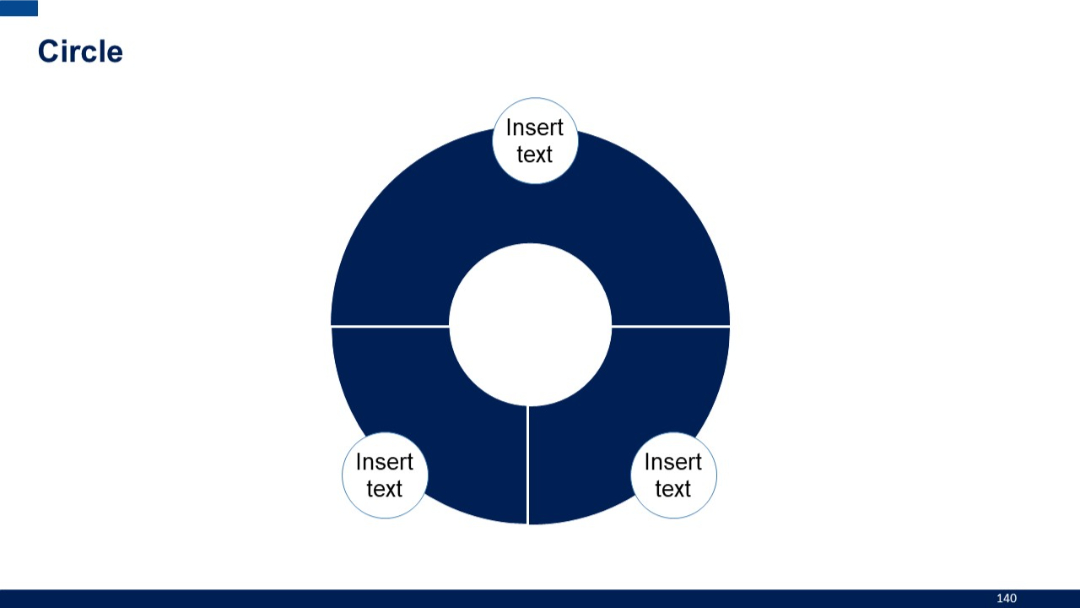
Four-part donut chart with one external circular label per quadrant, suggesting directional or thematic breakdowns.
PRO
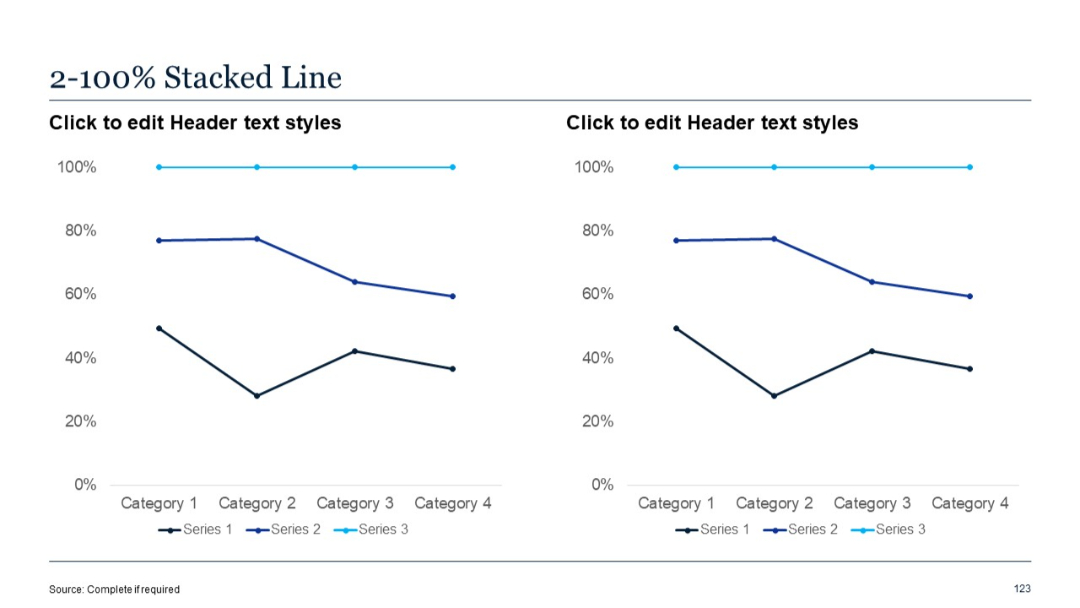
Two identical 100% stacked line charts, showing data proportions over categories.
PRO
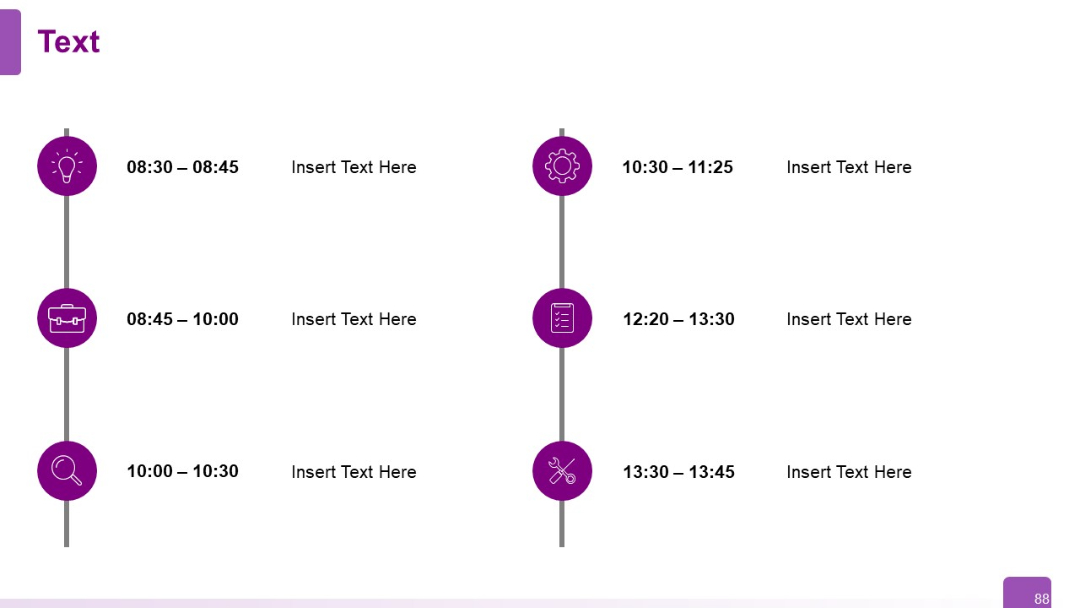
Vertical timeline on left with colored circular bullets and matching icons, aligned with text blocks indicating time slots and session titles.

PRO
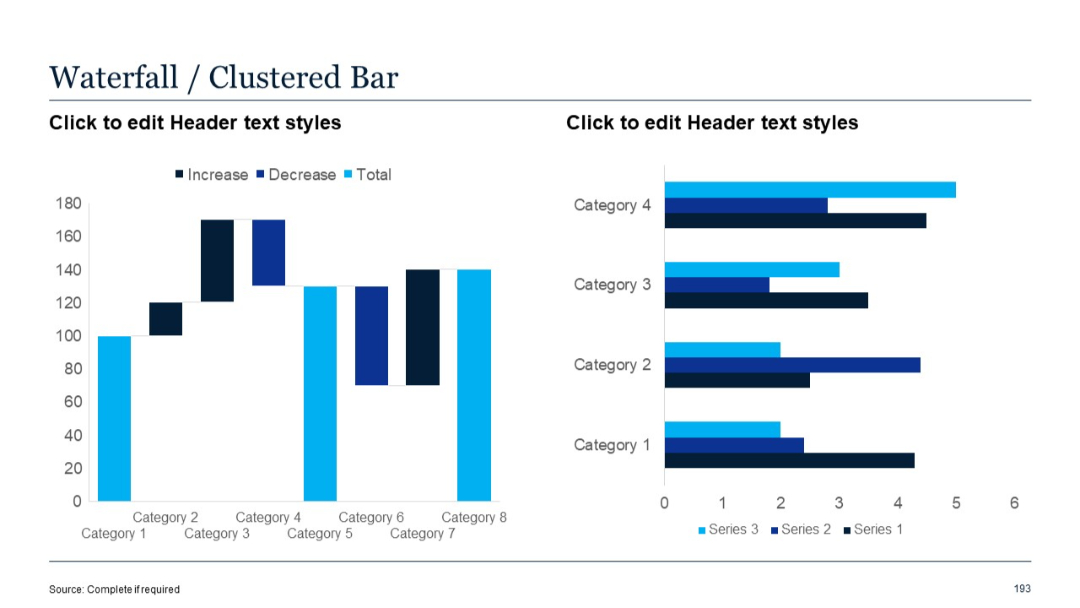
Left: waterfall chart; Right: clustered (side-by-side) bar chart for each category. Simple color-coded format.
PRO
Vertical timeline with large circular icons and matching symbols. Time slots on the left, event descriptions to the right.
PRO
Three horizontal puzzle-piece styled blocks forming rows, each with a short paragraph on both ends and a central icon. Colors alternate by row.

PRO
Four rectangular blocks with rounded edges layered over a large arrow background, progressing left to right.
PRO
Grid-based quote layout with four separate bordered boxes and open quotation marks.