PRO
Grid layout with rectangular orange vertical bars inside cells, arranged in three rows and eight columns, each column with a header title.

PRO
Vertical stacked bar chart segmented by digital maturity levels: Low, Emerging, Established, Leading. Clean white background, clear segmentation.

PRO
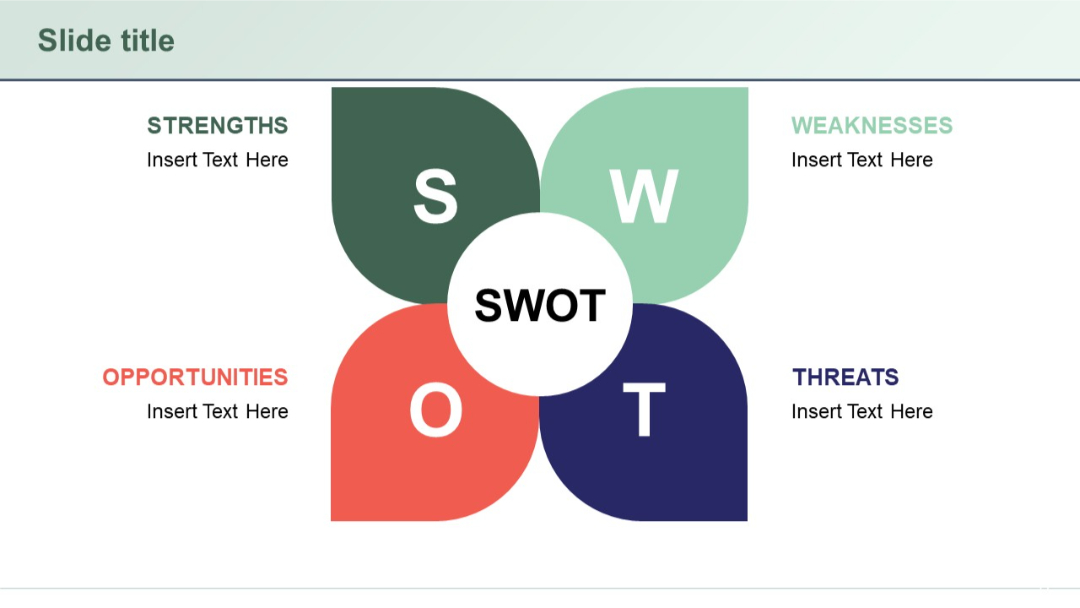
Petal-shaped SWOT layout surrounding a central circle. Each petal contains one SWOT element. Color-coded sections and symmetrical design.
PRO
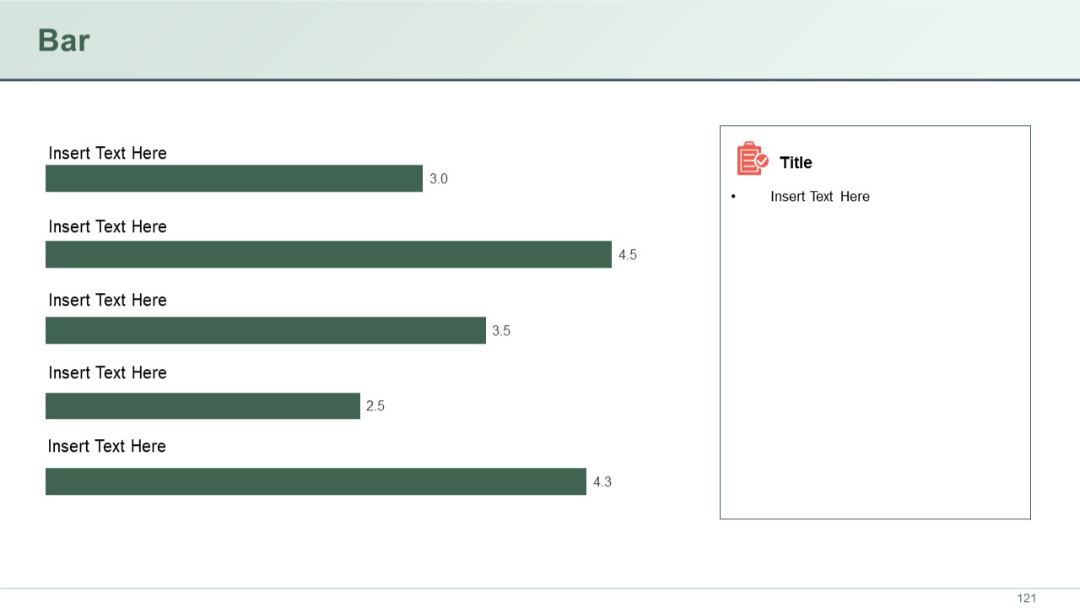
Grid layout with vertical bars inside a matrix, each bar labeled with a number; headers are labeled “Title.”

PRO
White background grid layout filled with outlined vector icons in multiple rows, clean and minimalist with black thin-line icons.
PRO
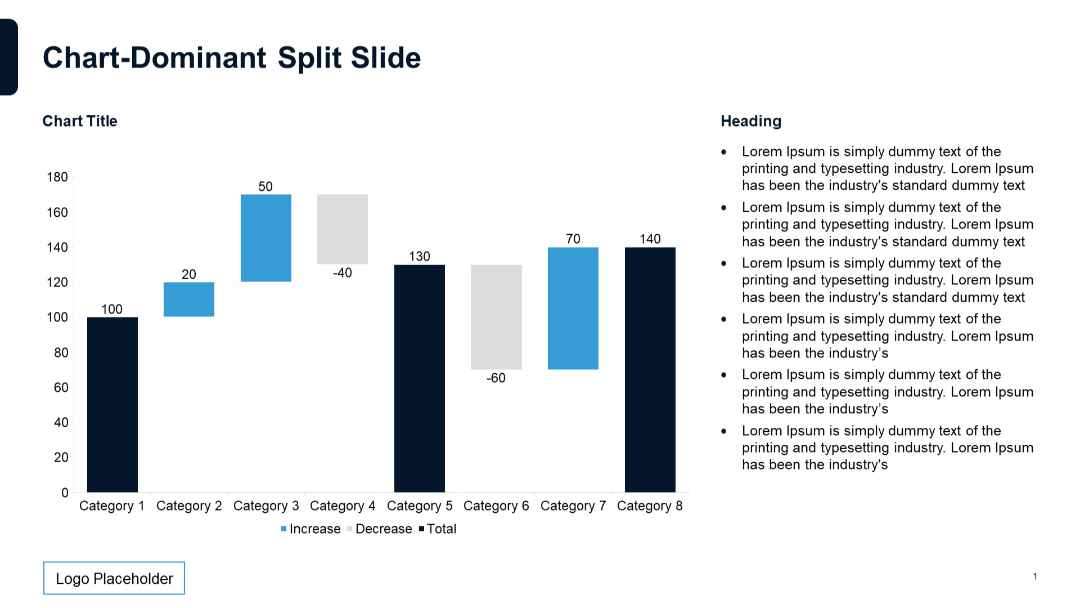
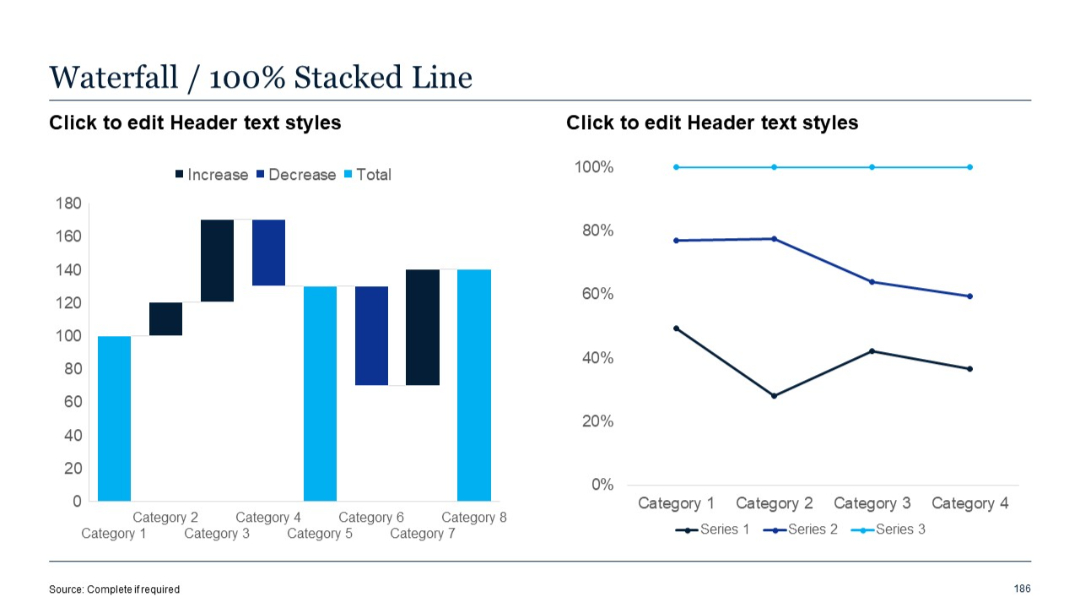
Waterfall chart with labels; bars colored by increase/decrease/total; text list to the right.
PRO
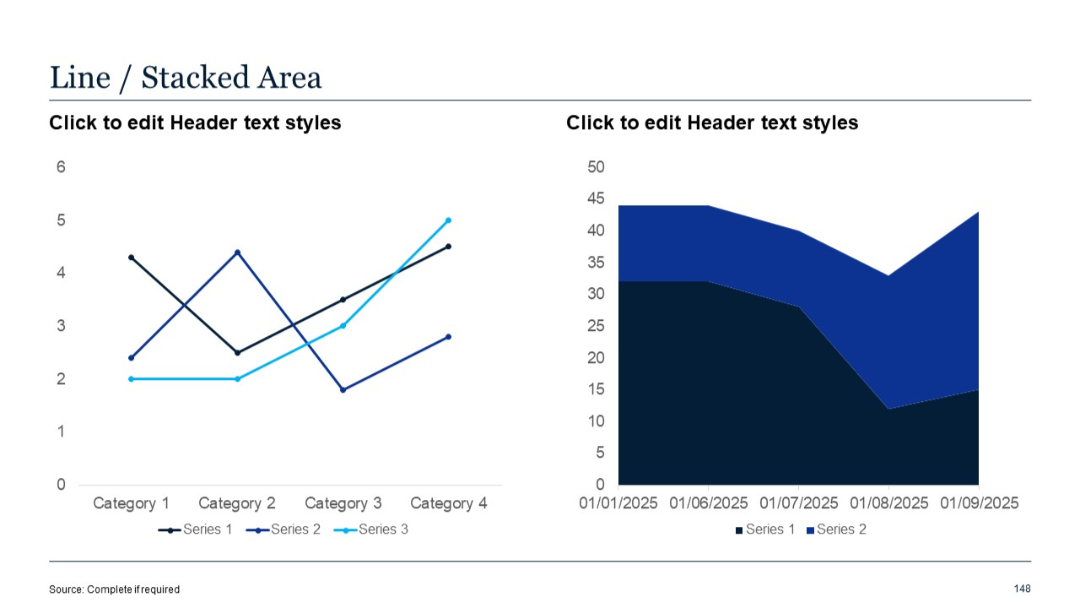
Left chart is a line chart for 3 series; right chart is a stacked area for 2 series. Split visual structure balances time and category views.
PRO
Left pane shows a waterfall chart; right pane presents a 100% stacked line chart emphasizing proportion distribution trends.
PRO
Four circular ribbon-like icons with numbers (1–4) below each, spaced horizontally, each labeled “Title” with accompanying placeholder text underneath.
PRO
Four stacked colored bands with titles and numbers on the left side.
PRO
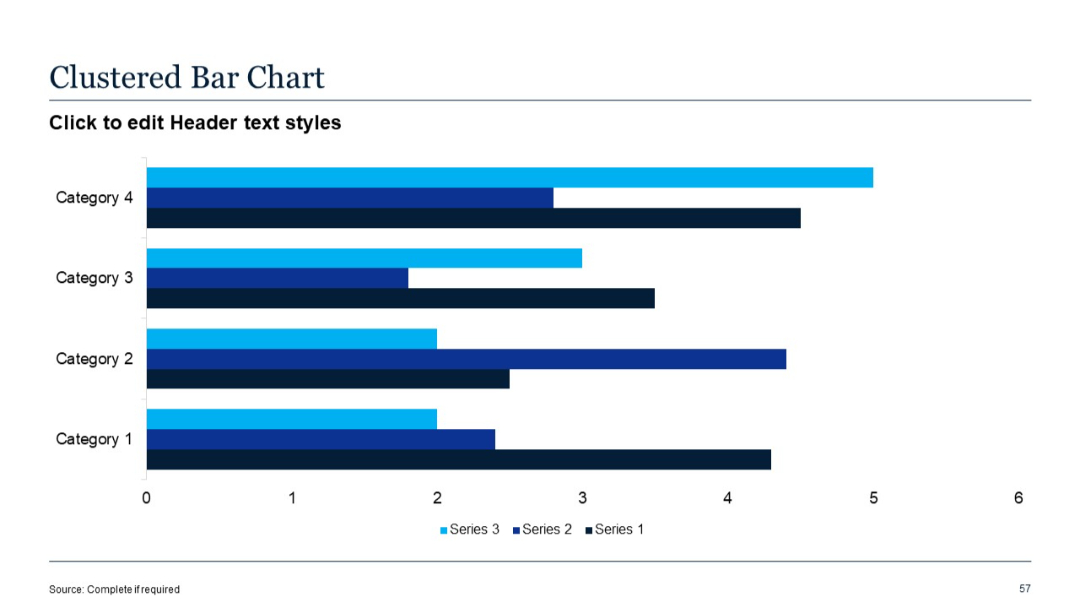
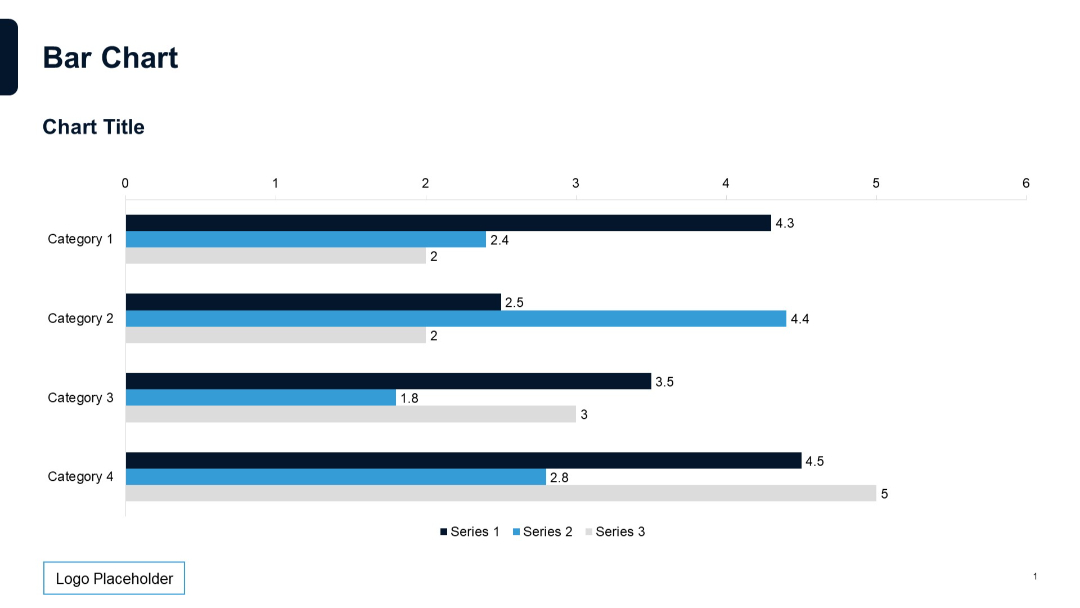
Horizontal clustered bar chart; three series per category shown side-by-side; color-coded.
PRO
Left-aligned horizontal bar chart with five dark green bars of varying lengths and numerical labels. Right panel with icon and placeholder text.
PRO
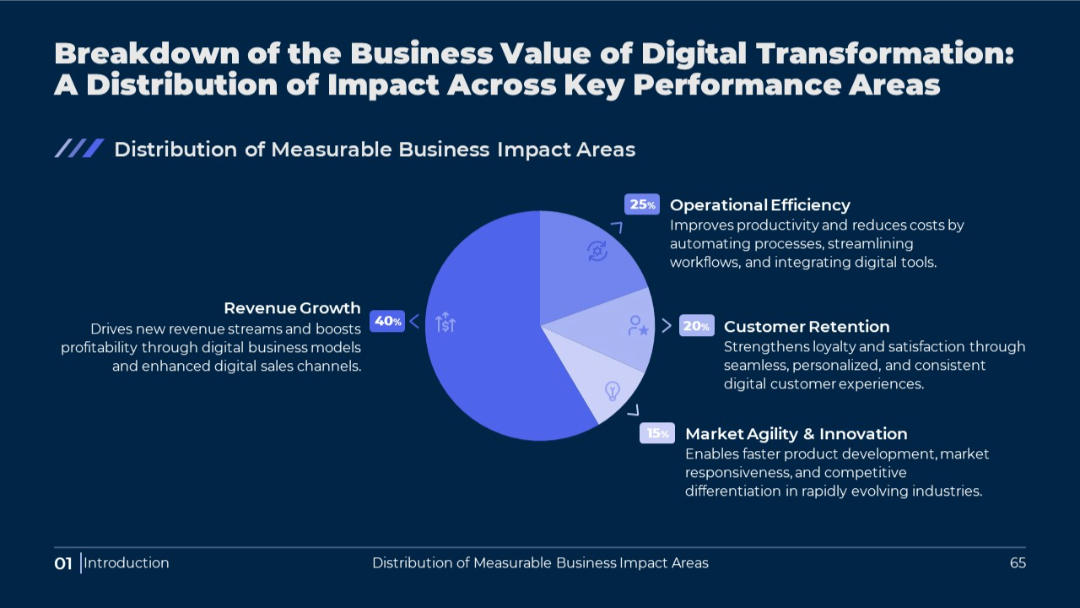
Circular pie chart in the center, surrounded by value descriptions. Dark background with light blue accents. Percentages highlighted for each segment.
PRO
Color-coded grid with rows and columns representing values, legend below with thresholds, top-left title, and dark header row.

PRO
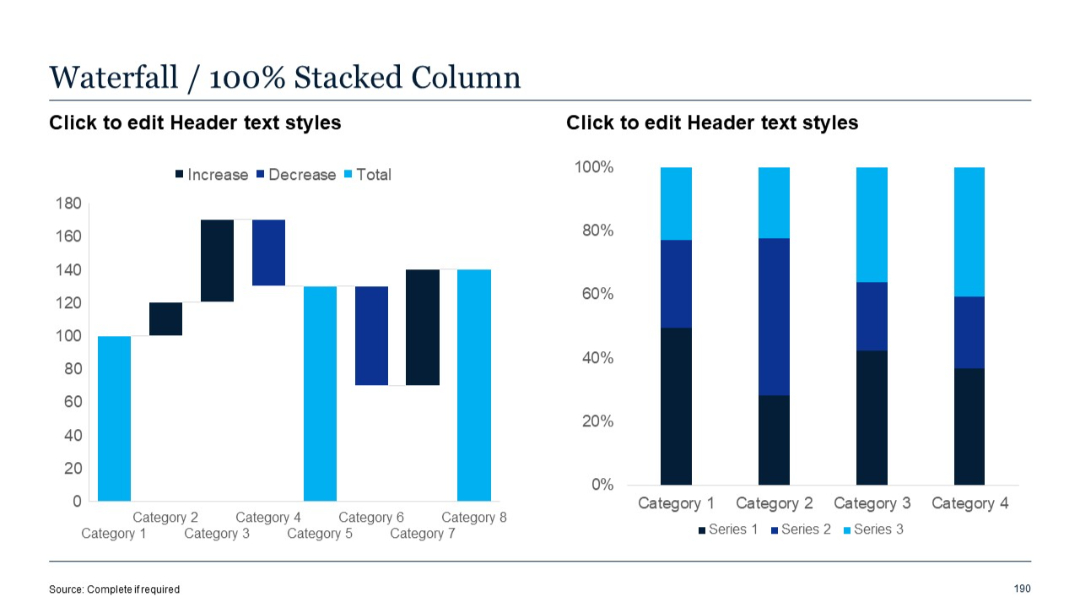
Waterfall chart (left) and 100% stacked column chart (right), showing proportional contributions of three series per category.
PRO
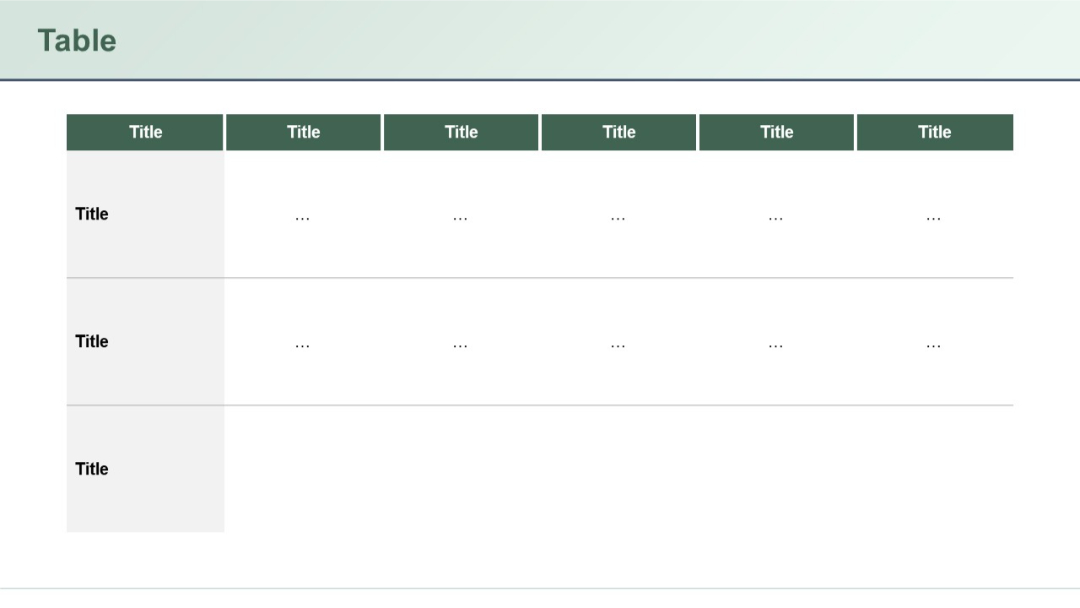
Expanded version of the previous layout, now with three rows of entries and six vertical column headers. Minimal placeholder text suggests quantitative content.
PRO
Four-column layout with icons and short paragraphs; clean white background with bold blue headings and minimal design accents.

PRO
Horizontal bar chart with three series per category, data labels on bars, and categories listed on the y-axis.
PRO
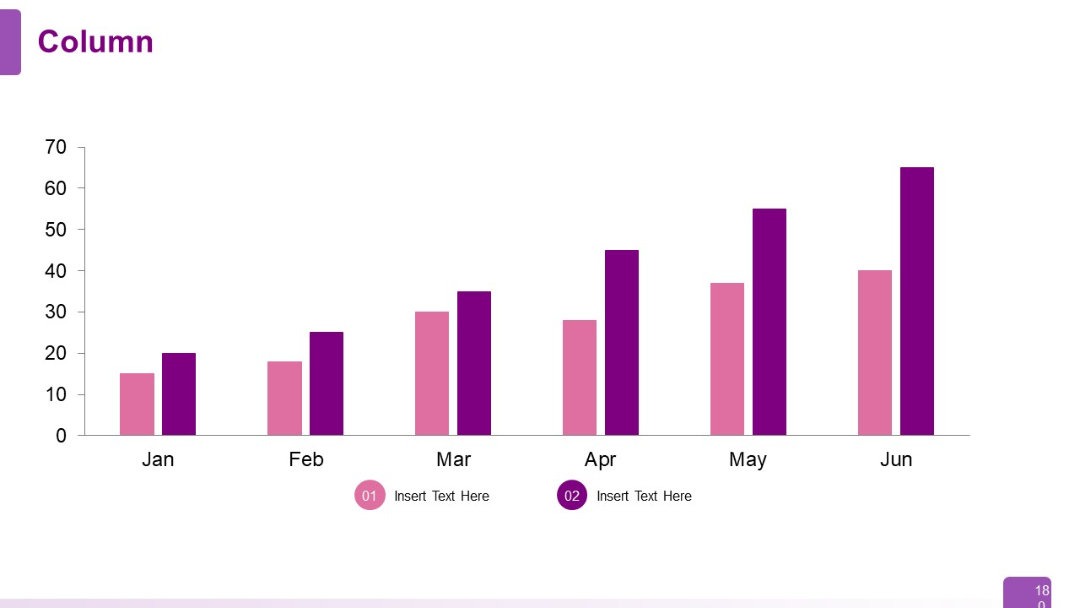
Vertical column chart displaying six months of data (Jan–Jun), with two series per month in distinct colors. Below are icon-based annotations (01 and 02).
PRO
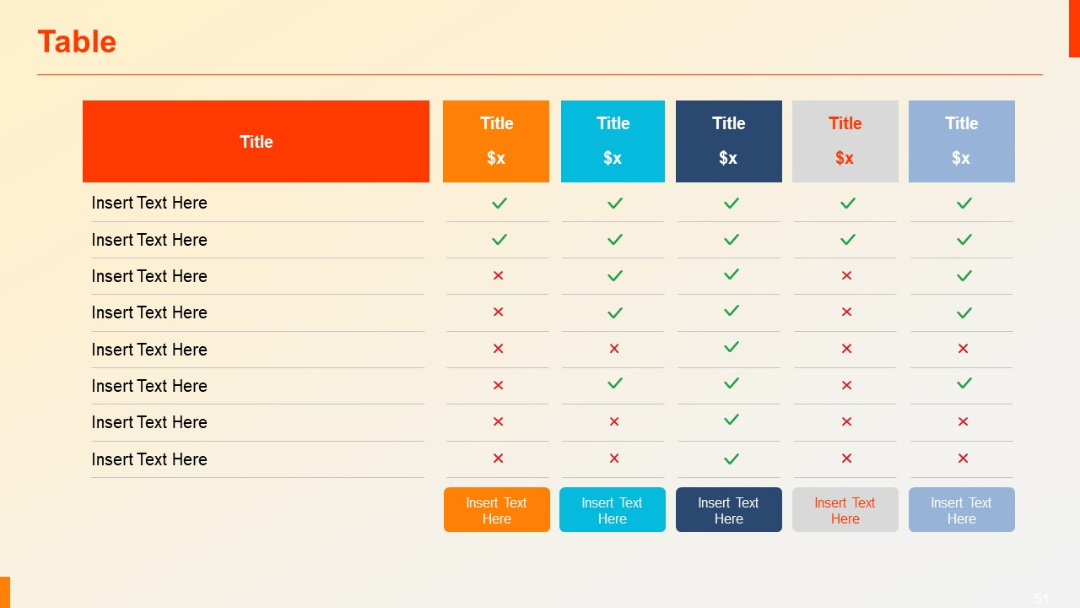
A 7-column comparison matrix using colorful headers (orange, blue, gray), check marks, and crosses. Includes a bottom row of colored buttons for CTA/input options.
PRO
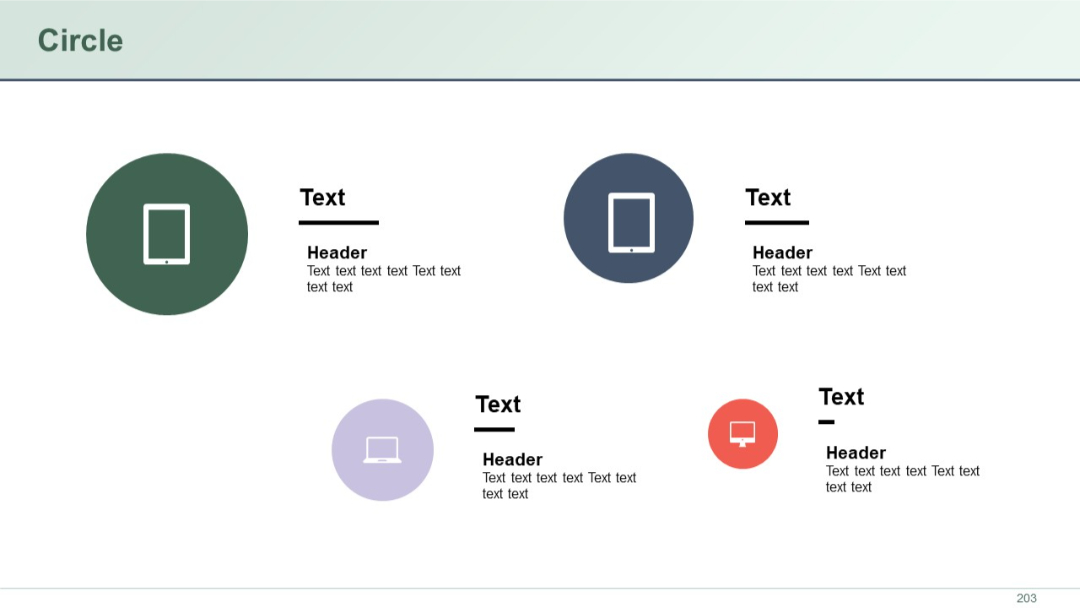
Four circle icons with device illustrations and corresponding text. Distributed across two rows in a grid format. Simple and minimal.
PRO
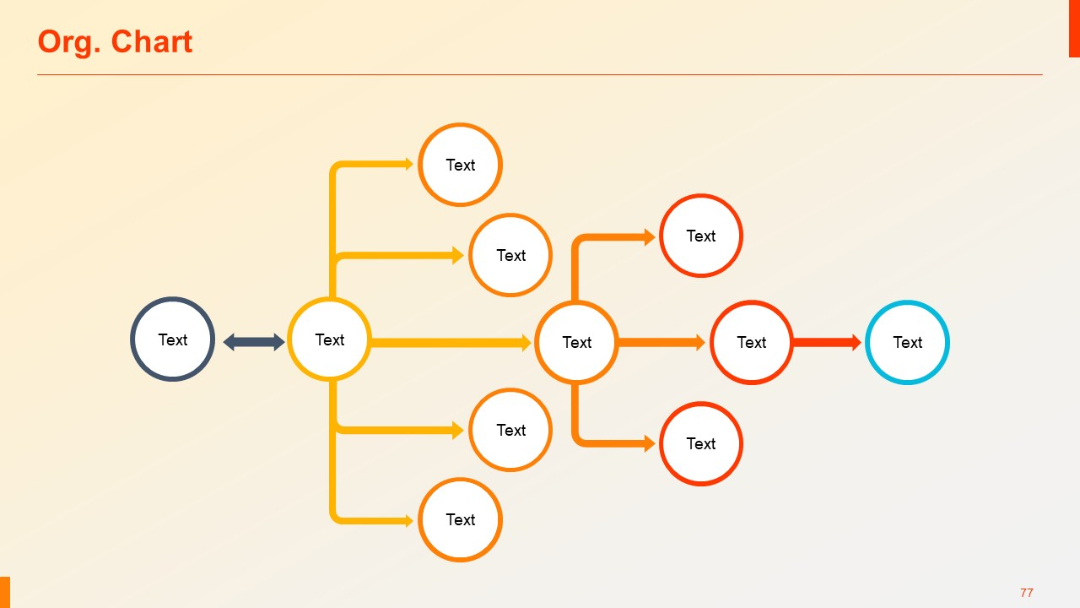
Flow-style organizational chart using colored circular nodes and arrows to indicate relationships.
PRO
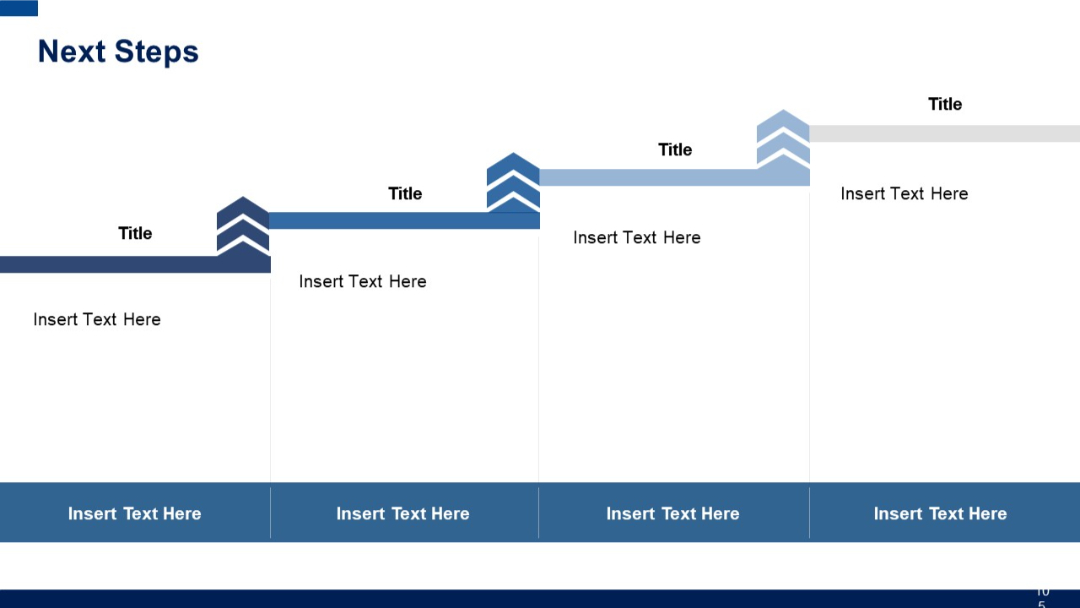
Chevron-step layout with four distinct vertical blocks, each containing icons, titles, and text sections beneath.
PRO
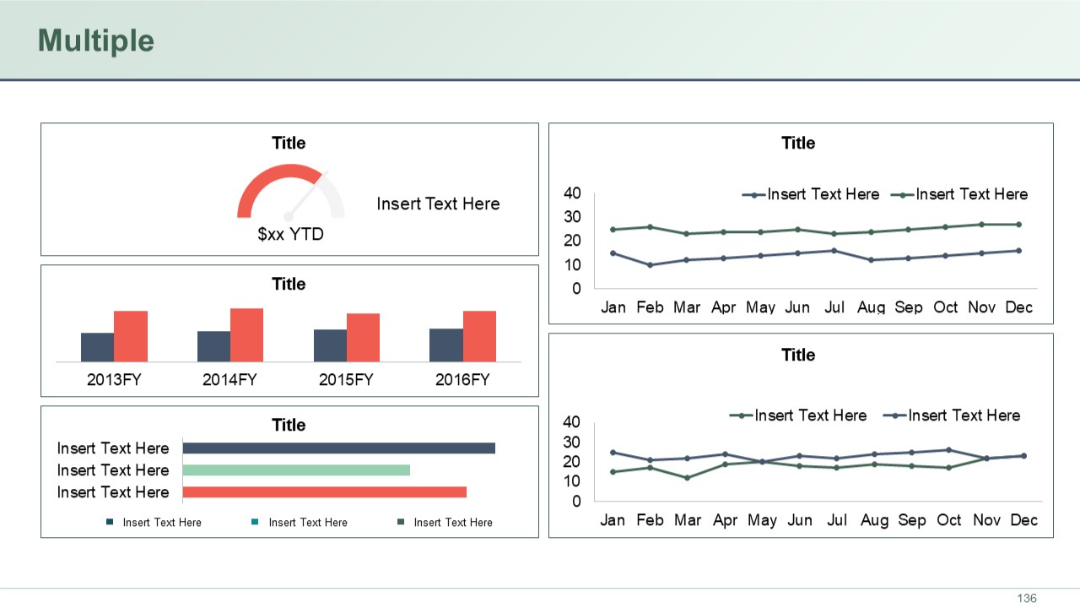
Dashboard layout with various chart types (gauge, bar, line) arranged in grid. Multiple KPIs and trends visualized in distinct panels.
PRO
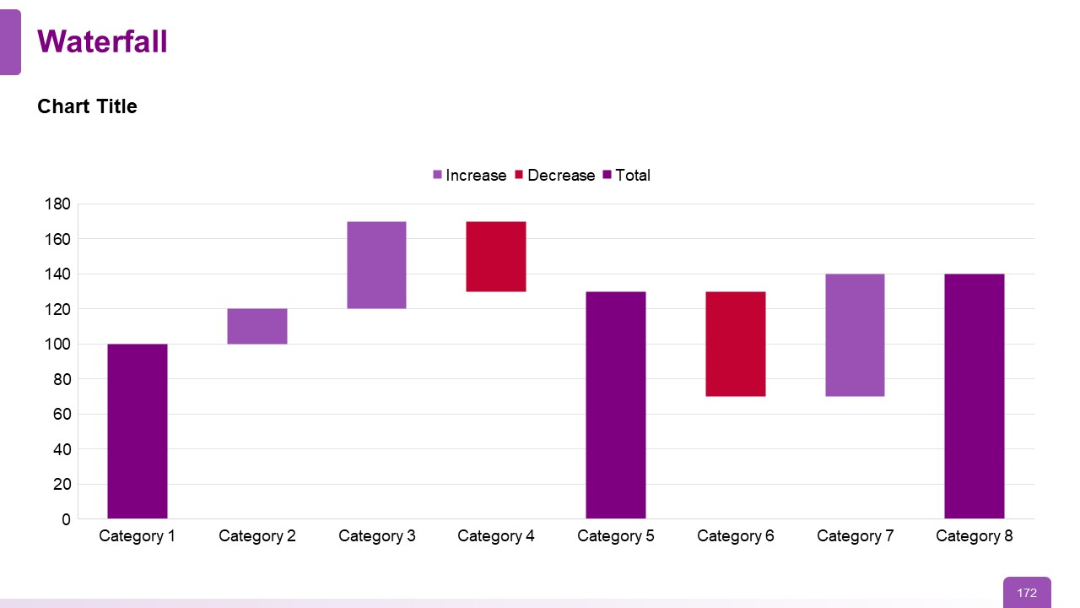
A waterfall chart with bar segments in different colors indicating increase, decrease, and total across eight categories. Minimalistic layout with bold chart bars.
PRO
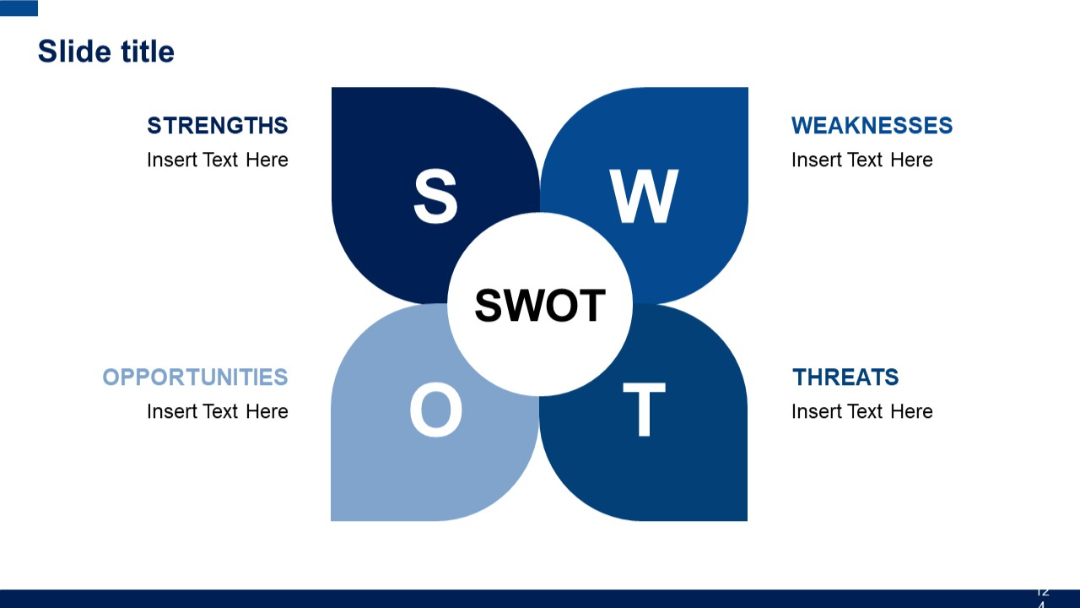
Flower-petal-style SWOT diagram with four rounded quadrants around a central circle labeled "SWOT". Bold blue color scheme.
PRO
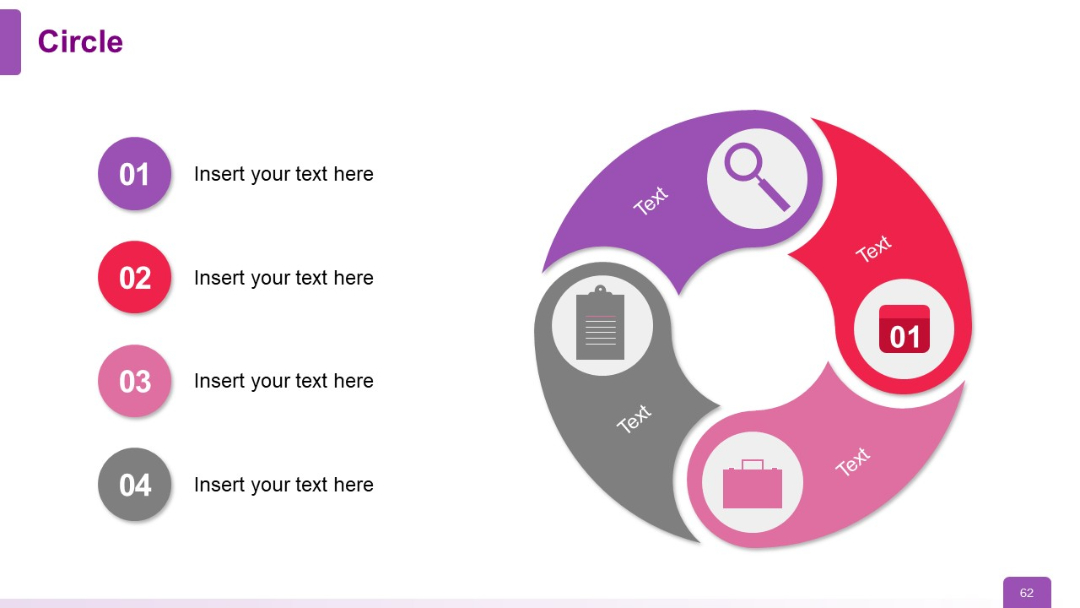
Spiral-like segmented circular graphic on the right, paired with a vertical list of 4 color-coded numbered bullets on the left.
PRO
Minimalist grid layout on a light background showing 8 numbered agenda sections.

PRO
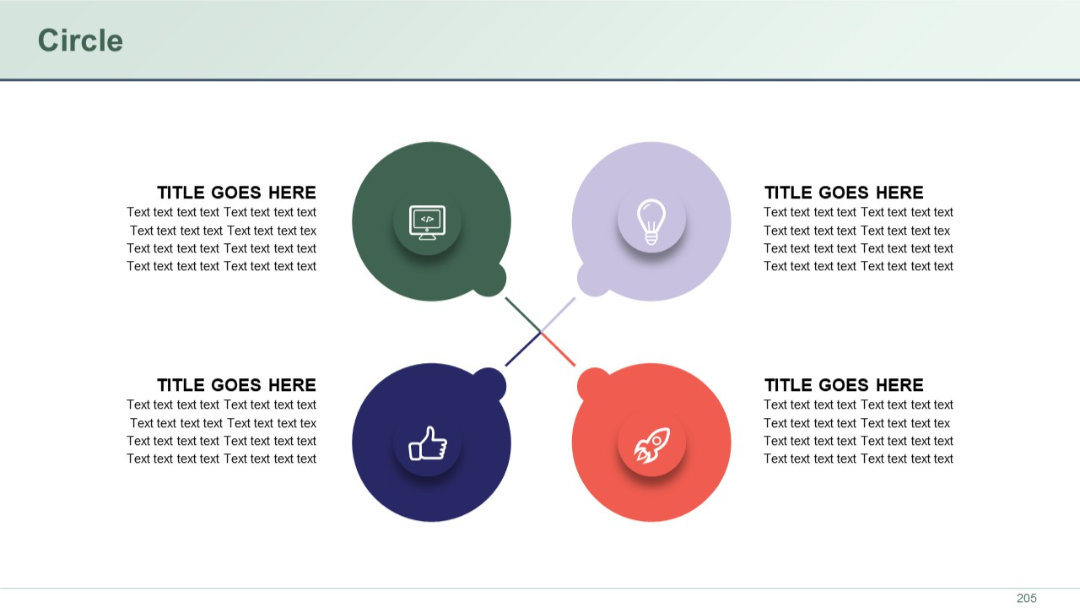
Four balloon-like circular icons in a cross formation with embedded icons and title text. Decorative lines connect the quadrants.
PRO
Text-heavy layout with a bold heading above a bullet-pointed list, occupying a single column across the page.


