PRO
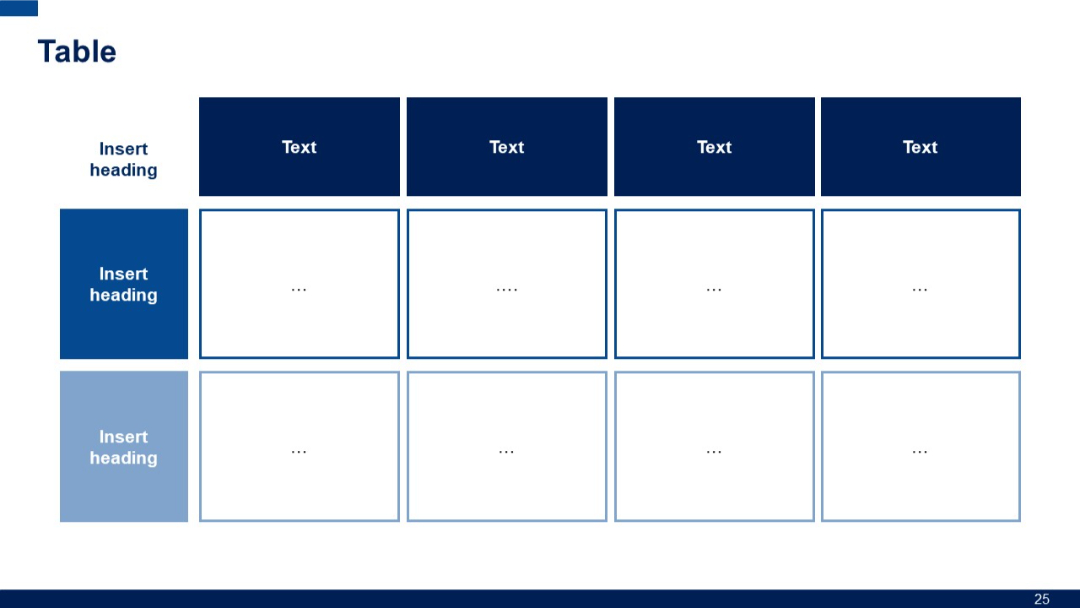
Two-row, five-column table layout; large dark green rectangles on the left, followed by four slim columns with placeholder text. Minimal design.
PRO
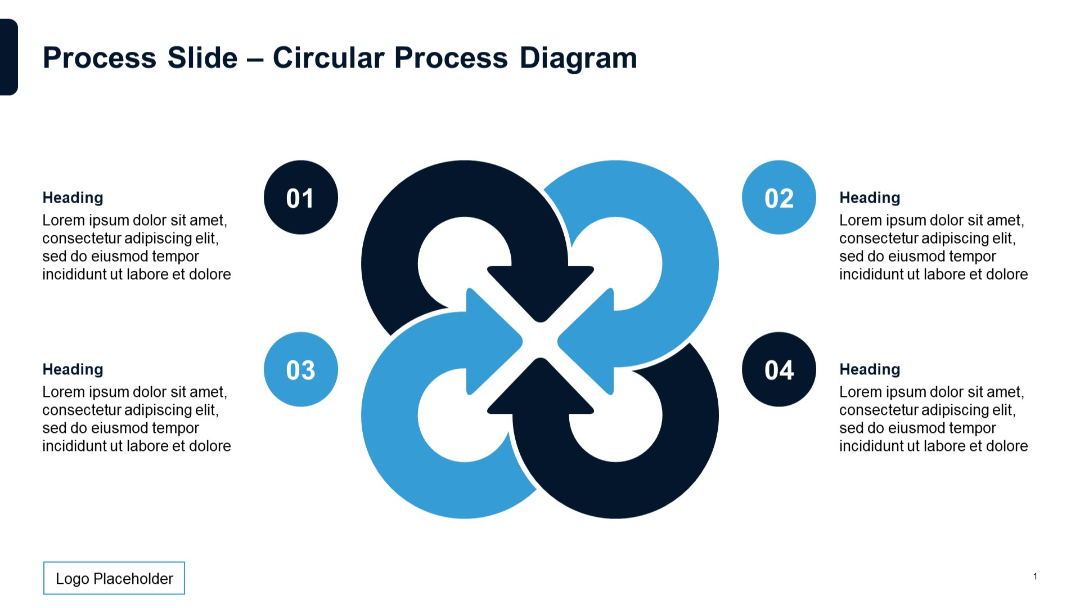
Four-loop interconnected circular arrows with numeric indicators and text blocks on both sides.
PRO
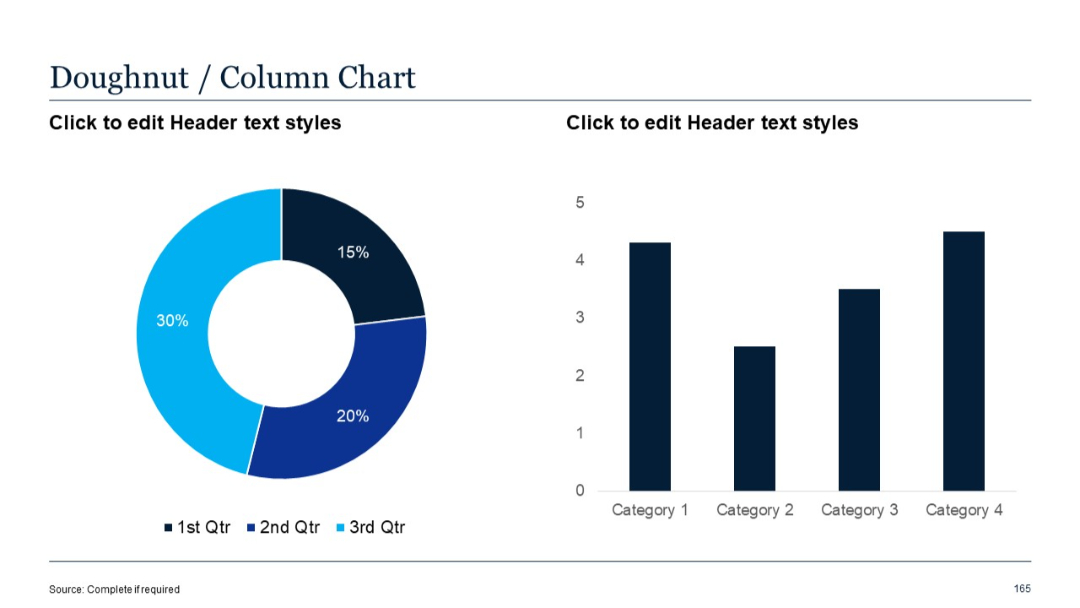
Doughnut chart on the left and vertical column chart on the right, each representing the same categories.
PRO
Dense layout of icons representing people, finance, transactions, payments, and organizational roles in a thin-line icon style.
PRO
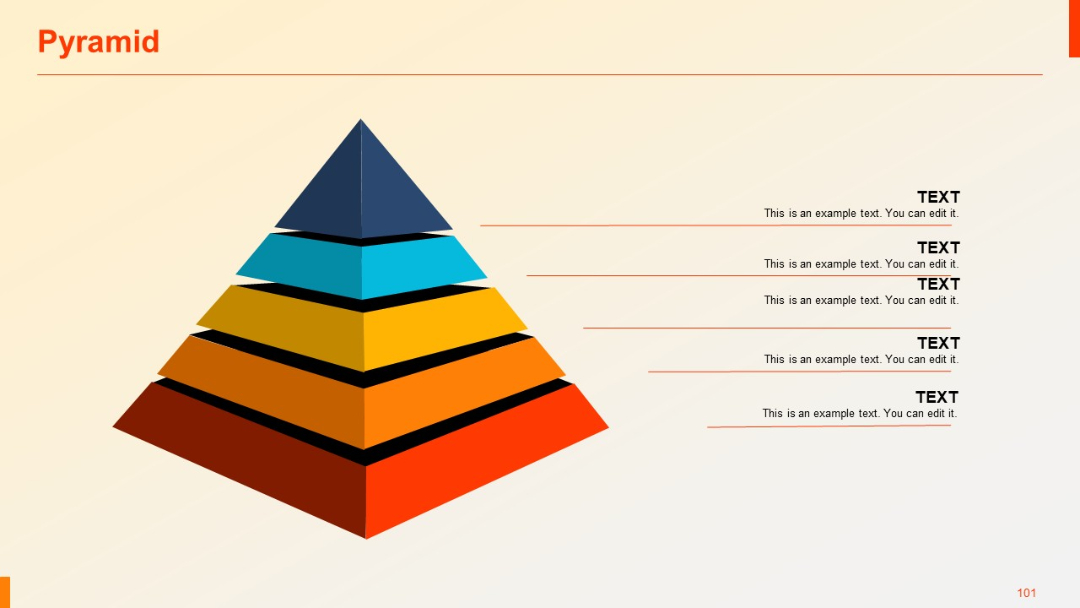
3D multicolored pyramid graphic (5 layers) on the left with aligned text labels on the right; minimalistic, clean design with light background.
PRO
Slide is divided into three vertical sections, each with a heading and bulleted list. Some use of alternating header colors for separation.

PRO
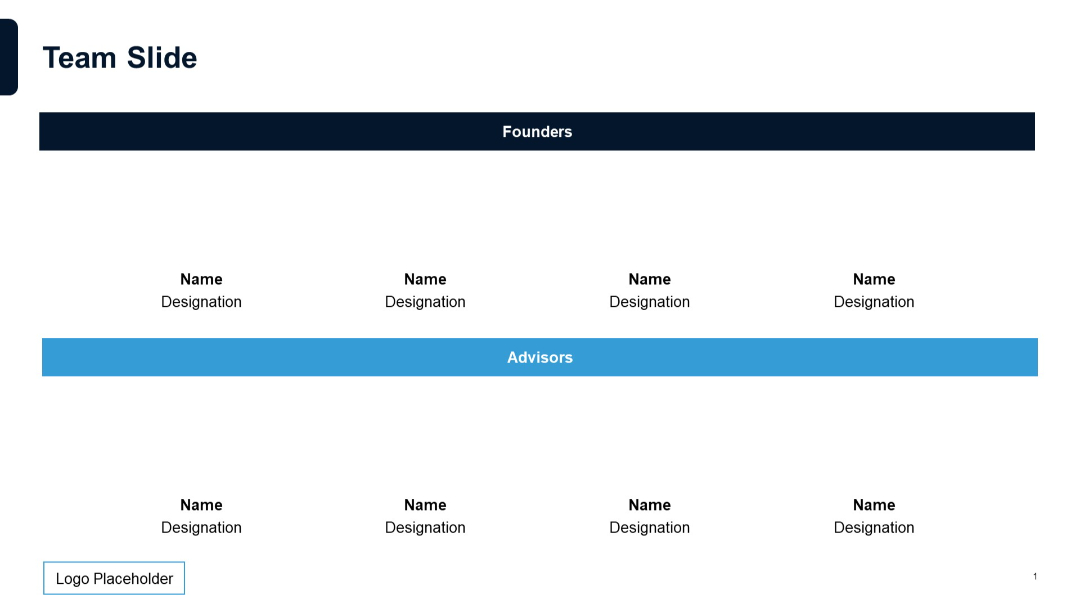
White background with two horizontal color bars separating “Founders” and “Advisors”; names and roles in grid layout.
PRO
Left side features a large calendar icon; right side displays a standard 7-column (Sun–Sat) by 6-row grid calendar with placeholder text "XX".

PRO
A full-width horizontal stacked bar chart with six rows, each bar divided into three color segments with percentage axis on the x-axis.

PRO
3x4 grid with left and top headers in blue, alternating row colors, and dots in each cell. A basic matrix for attribute presence or evaluation.
PRO
Vertical stacked blocks with purple side labels and icon-enhanced title sections. Each block contains bullet points with indented subtext.
PRO
Minimalist timeline with four circular markers (01–04), each connected to a horizontal line and text box.
PRO
Layered spiral/radar-style circle diagram with 4 curved layers on the right, matched with corresponding headers and descriptions on the left.

PRO
A straight horizontal timeline with seven equally spaced dots leading to vertically stacked text boxes below each dot and downward arrows indicating flow.
PRO
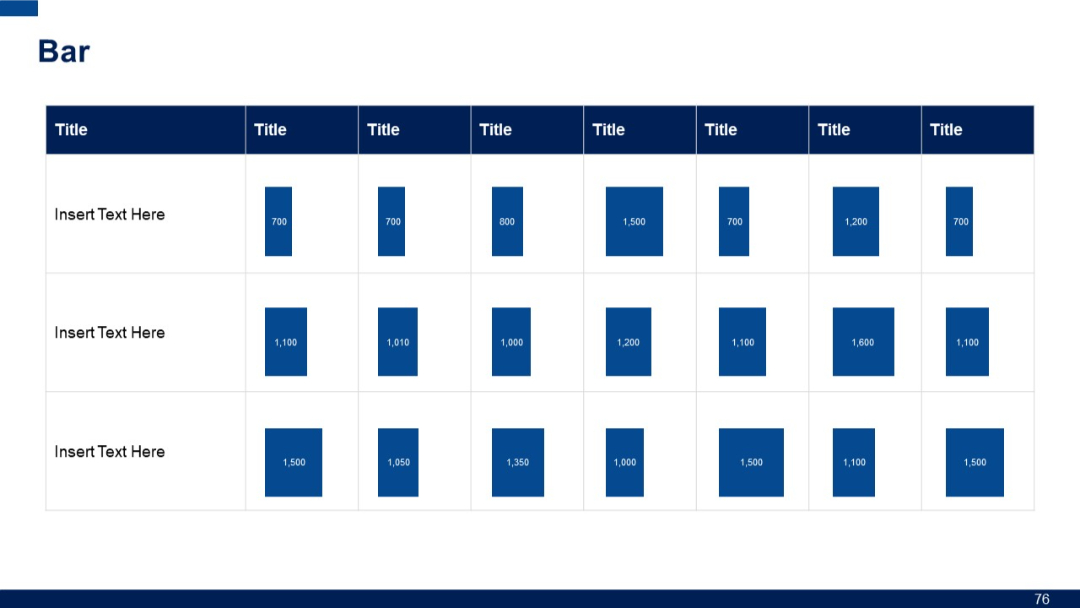
Grid layout with rows of vertical bar charts embedded in a table format. Each cell includes a value and a corresponding bar.
PRO
Three horizontally aligned rounded boxes labeled 30, 60, and 90 DAY, each with an icon and placeholder text below.
PRO
A slide with eight segmented petals forming a wheel and supporting text blocks aligned on either side.

PRO
Two-column layout with numbered circular purple icons from 1 to 10; central column lists date and title; breaks (Lunch, Coffee) marked by horizontal lines.
PRO
Full-screen background image with white text box overlay and large green dot icon.

PRO
Five numbered circles connected by a curved timeline-like path. Text and headings accompany each number.
PRO
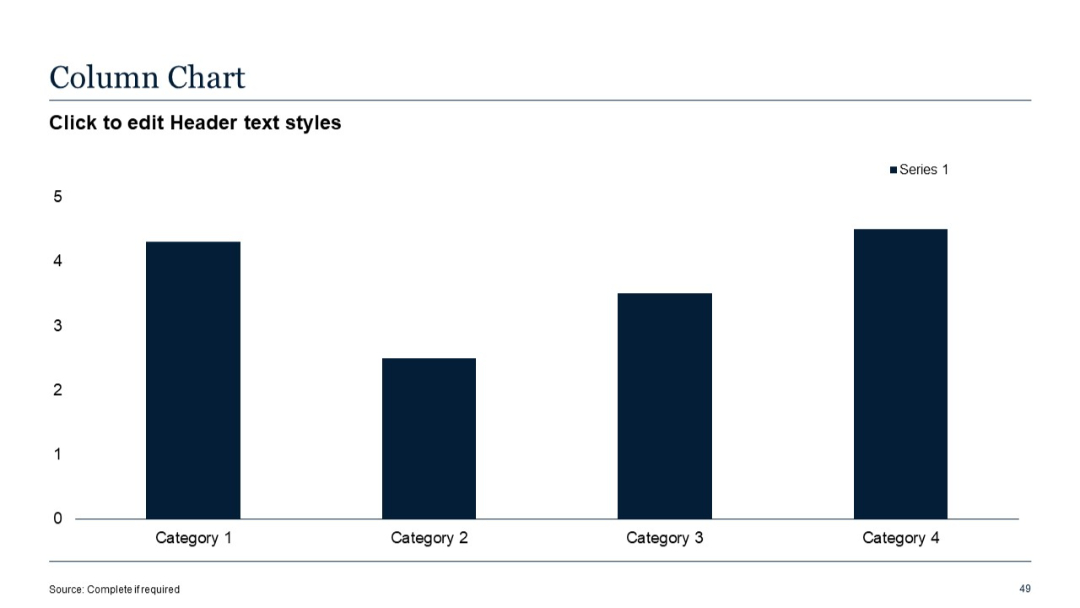
Vertical bar chart with one data series shown across four categories. Y-axis indicates value scale.
PRO
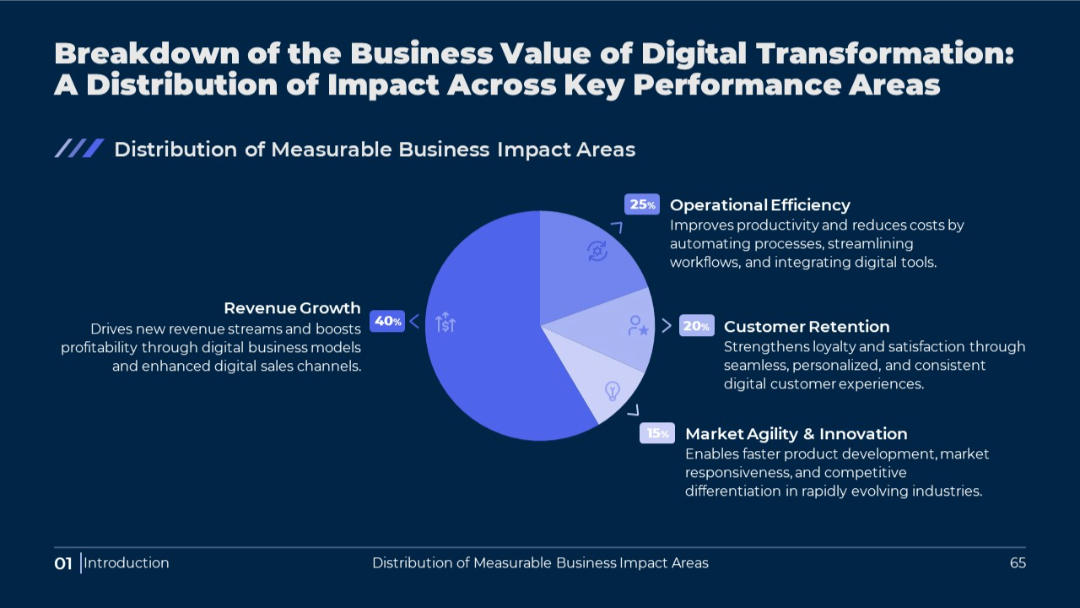
Circular pie chart in the center, surrounded by value descriptions. Dark background with light blue accents. Percentages highlighted for each segment.
PRO
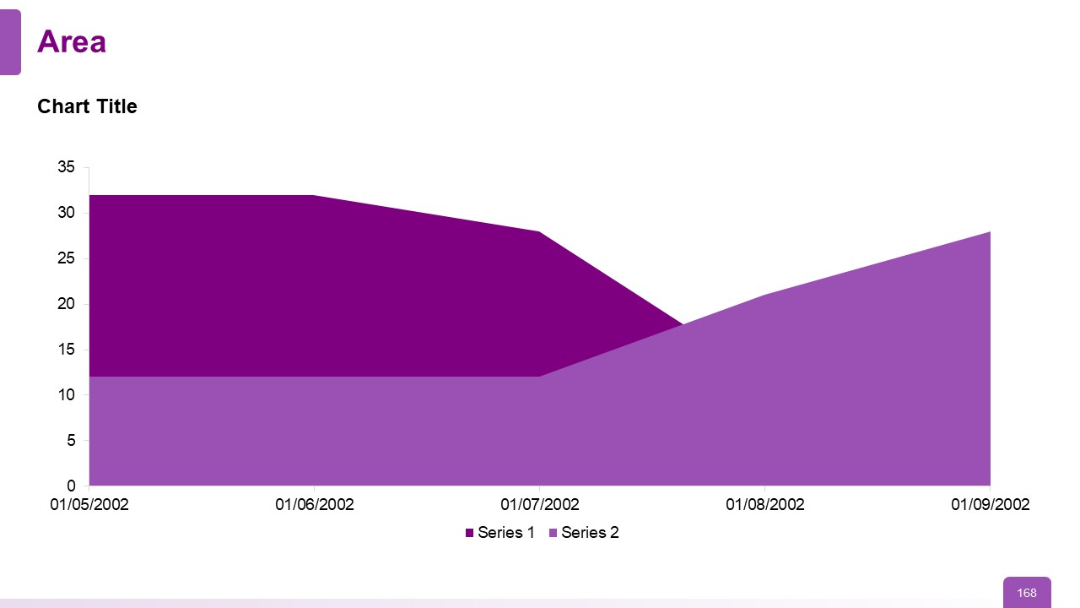
Area chart with two series plotted across a date-based x-axis; purple gradient fill areas with clear y-axis values; includes placeholder labels.
PRO
A structured array of time-related icons including clocks, calendars, timers, and watches, all styled in purple outlines.

PRO
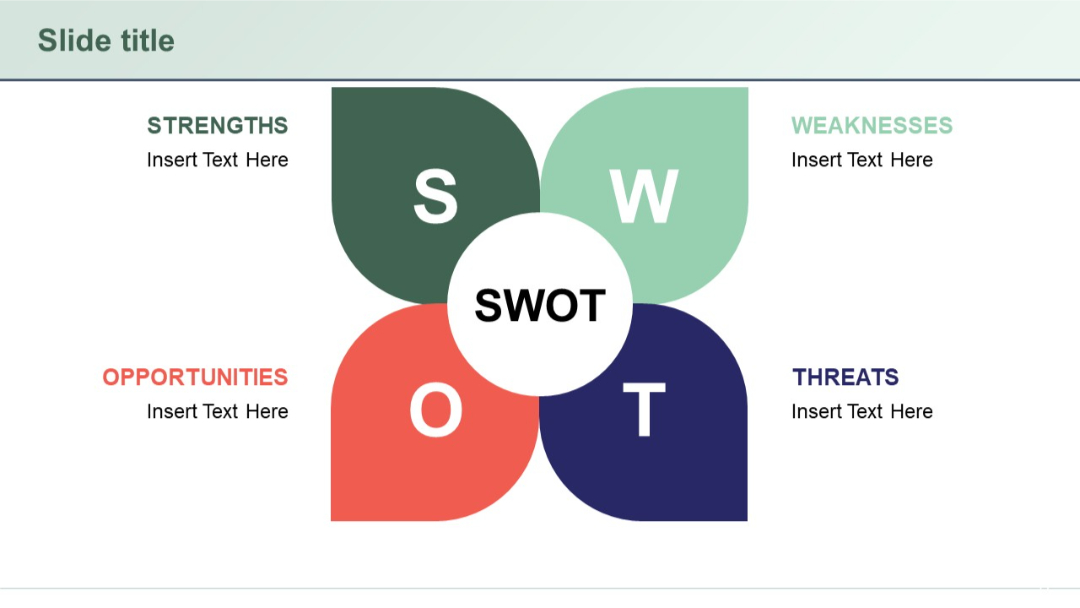
Petal-shaped SWOT layout surrounding a central circle. Each petal contains one SWOT element. Color-coded sections and symmetrical design.
PRO
Similar structure to Slide 3 with added subheading "Rethinking the Future of Work and Operations." Two main content blocks under distinct subheadings. Clean layout with white background and consistent typography.
PRO
Stacked area chart on the left; text with bullets on the right.

PRO
Central lightbulb graphic flanked by three circular icons with arrows pointing inward; bullet list on left.

PRO
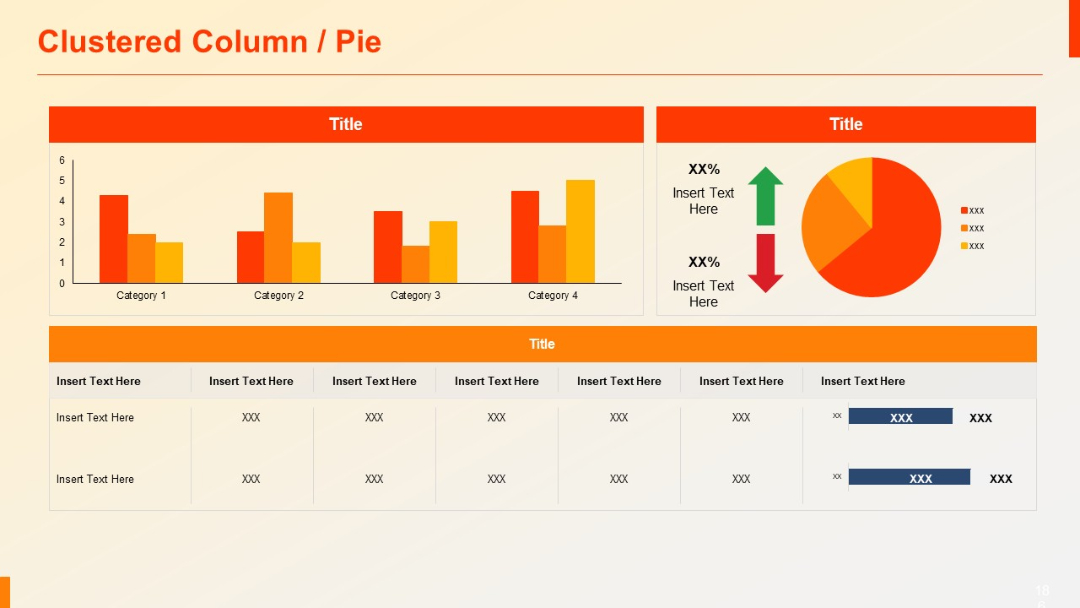
Dual visual layout: clustered column chart on the left and pie chart with up/down arrows on the right. A data table is placed at the bottom.
PRO
Four vertical sections with bold blue headers ("Text") and titled areas underneath. Clear segmentation with dividing lines between sections.