PRO
Centered, bold quote box design with top header section and large quote body using rounded corners.
PRO
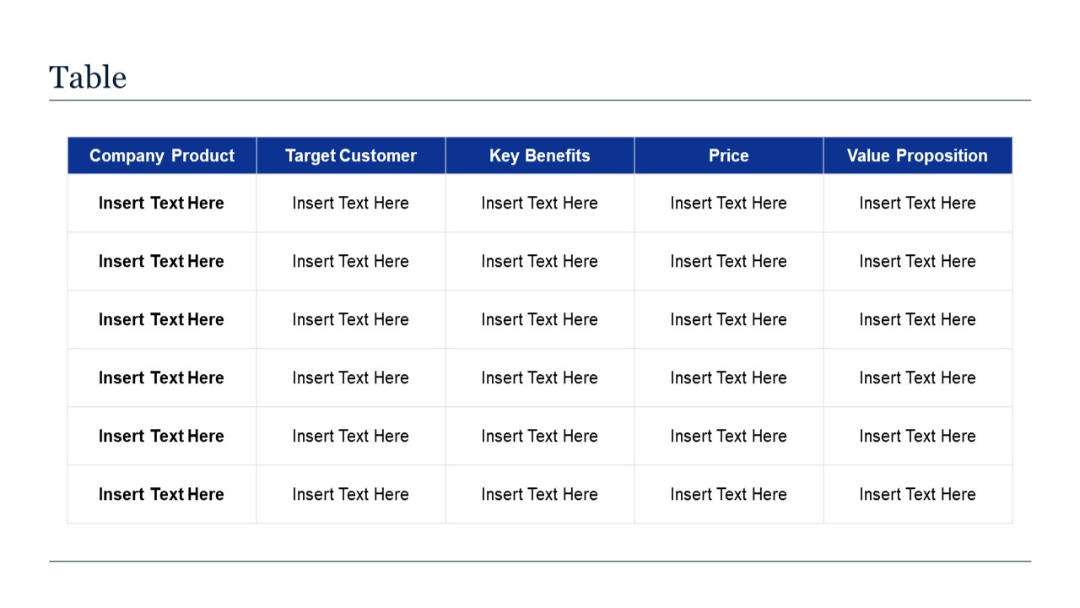
A 6-column by 6-row table with blue headers and editable placeholder text in each cell. White background with simple, clean layout and gridlines.
PRO
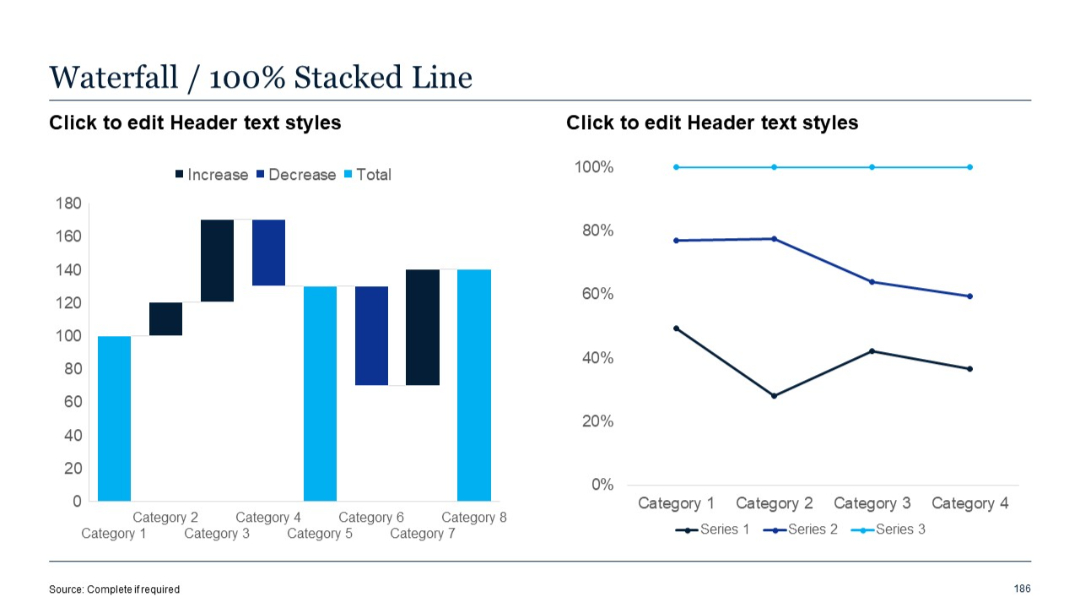
Left pane shows a waterfall chart; right pane presents a 100% stacked line chart emphasizing proportion distribution trends.
PRO
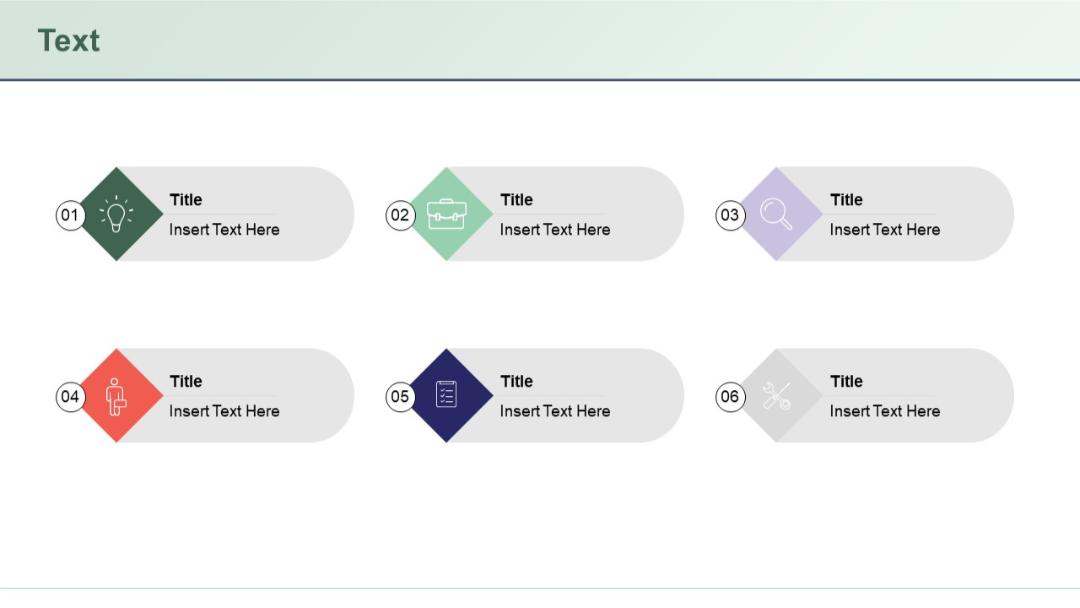
Grid layout of 6 labeled and numbered items using diamond-shaped icons. Each has a symbol (e.g., lightbulb, briefcase) and text title and description.
PRO
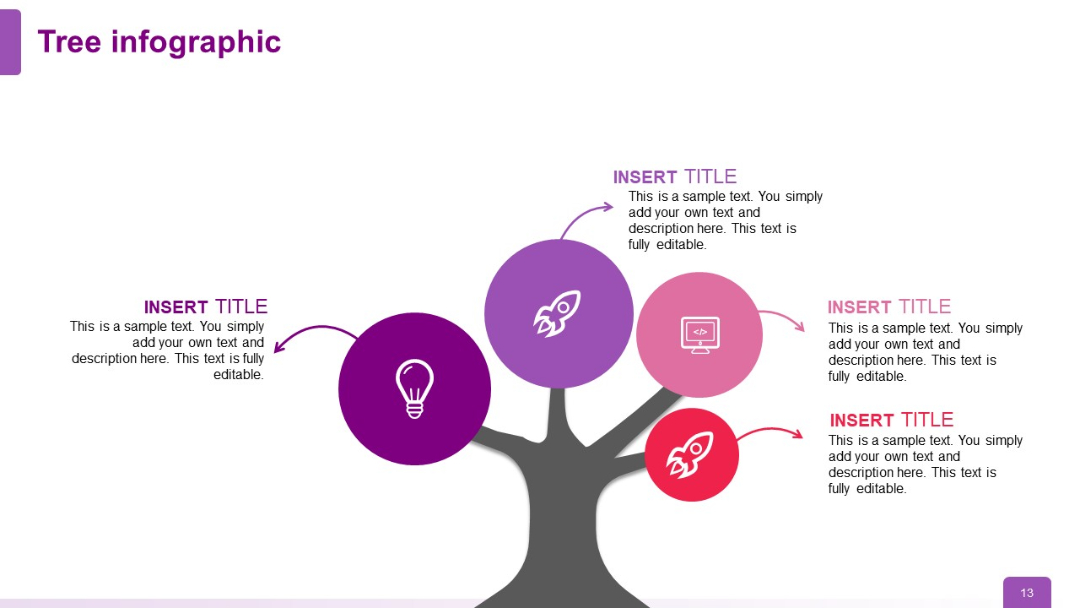
Enhanced version of the tree diagram with four icons (lightbulb, rocket, computer, rocket) branching out across various limbs of the tree structure.
PRO
Similar to slide 14 but with four rows. Vertical table-like layout with blue header sections and right-aligned details.

PRO
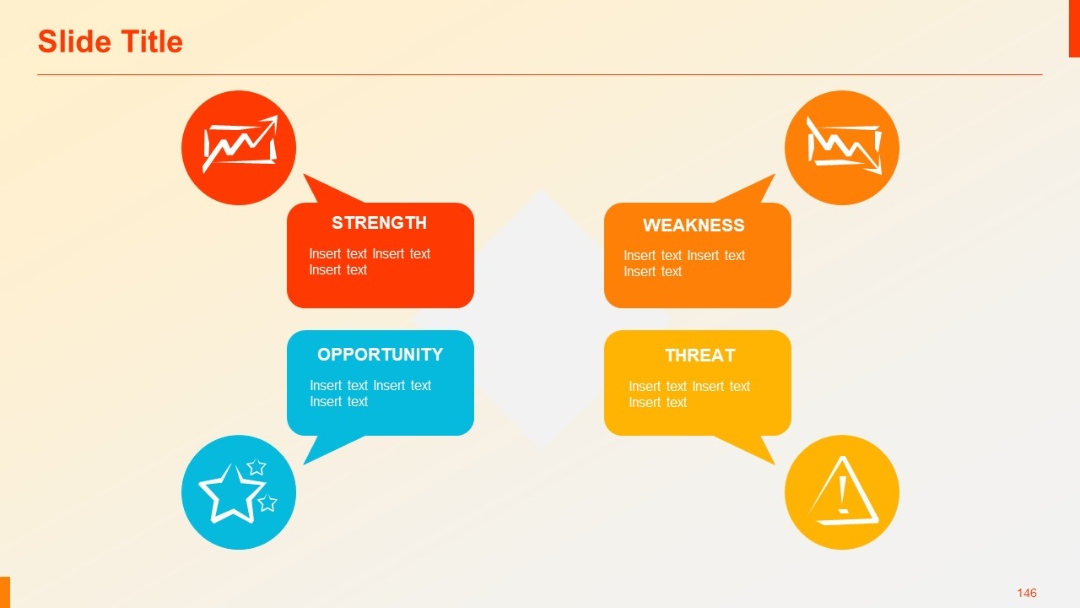
SWOT matrix layout with icons and colored speech bubbles, surrounding a diamond-shaped center.
PRO
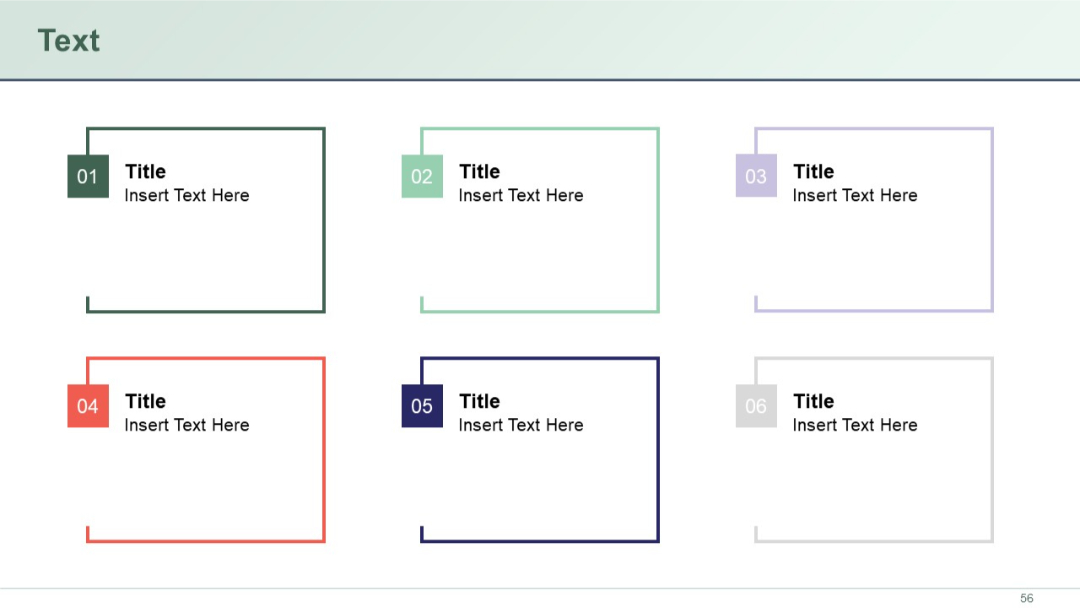
Grid layout of six square boxes with numbered tabs at the top-left of each. Each box contains a bolded title and placeholder description.
PRO
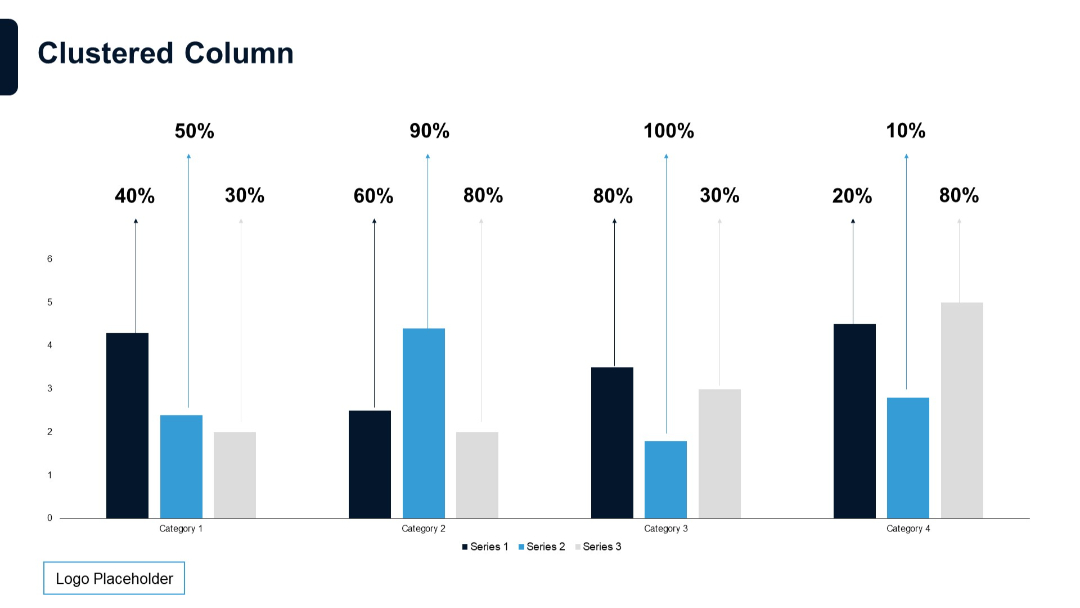
Centered clustered bar chart with vertical percentage annotations. Simple layout with three series per category.
PRO
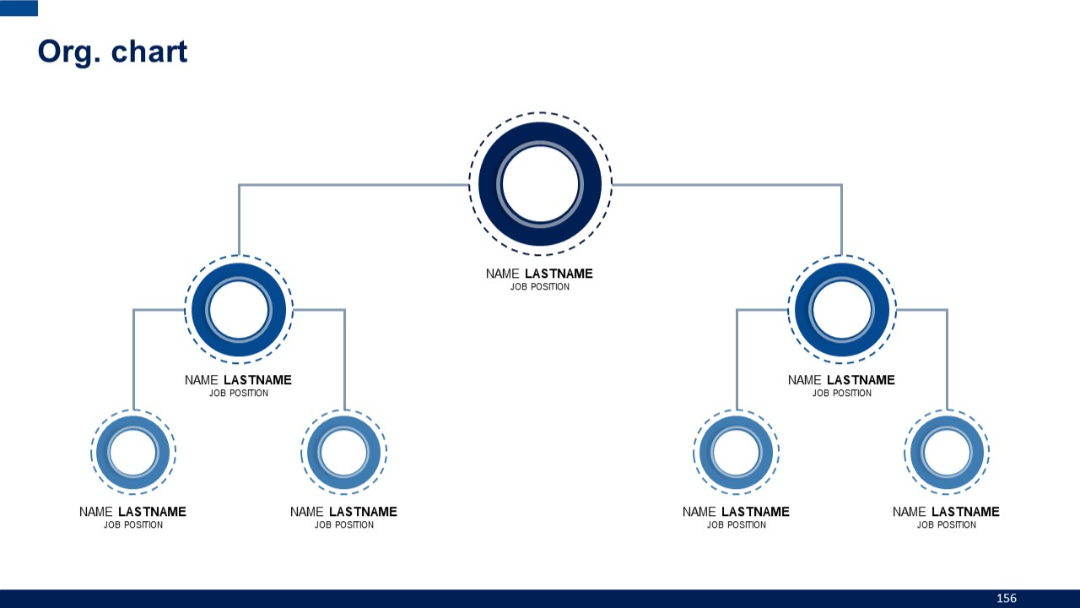
Hierarchical organization chart with dotted-line circular icons connected by straight lines. Top-down layout.
PRO
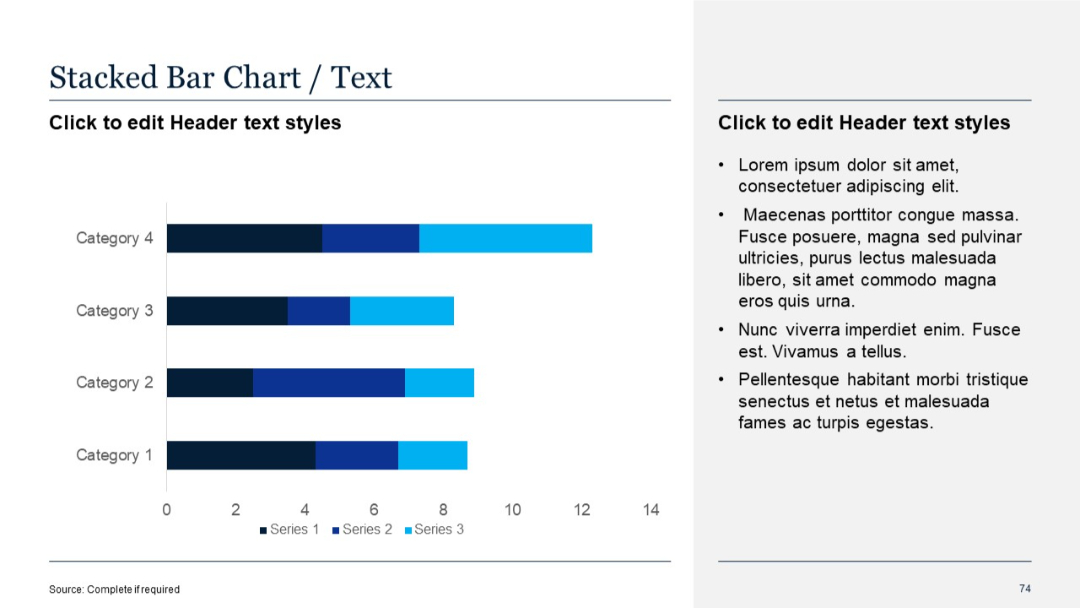
Horizontal stacked bar chart with three data series per category. Bullet points on the right. Varying shades indicate different data series.
PRO
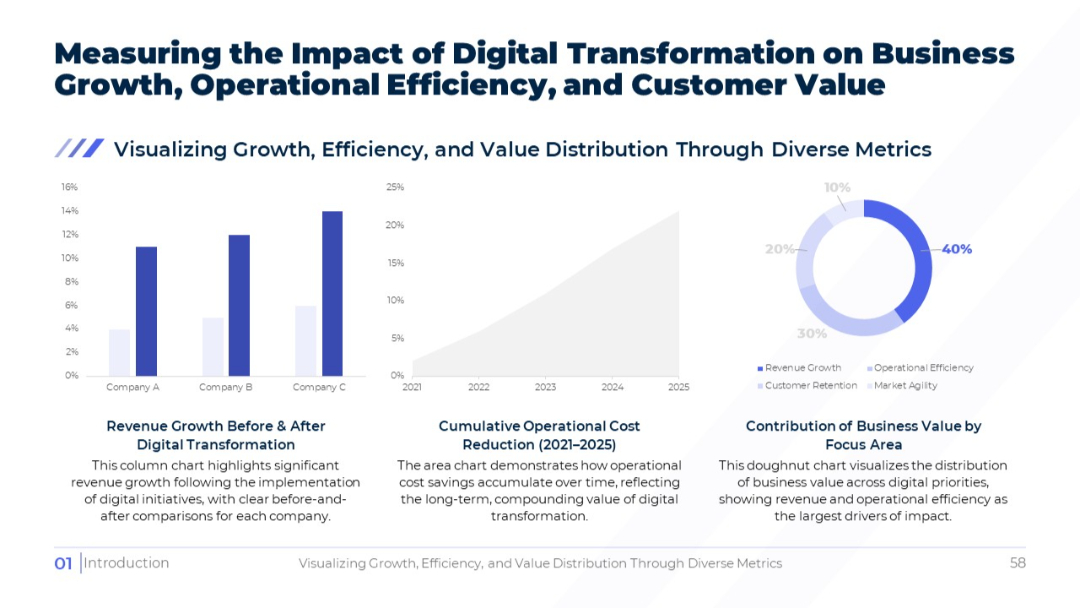
Three-chart layout: bar, area, and doughnut; focuses on revenue, cost savings, and business value distribution respectively.
PRO
Four-row layout with colored badge numbers on the left and title-text fields aligned to the right.
PRO
Minimalist design with a large section title and a thin red divider line across a light gradient background.

PRO
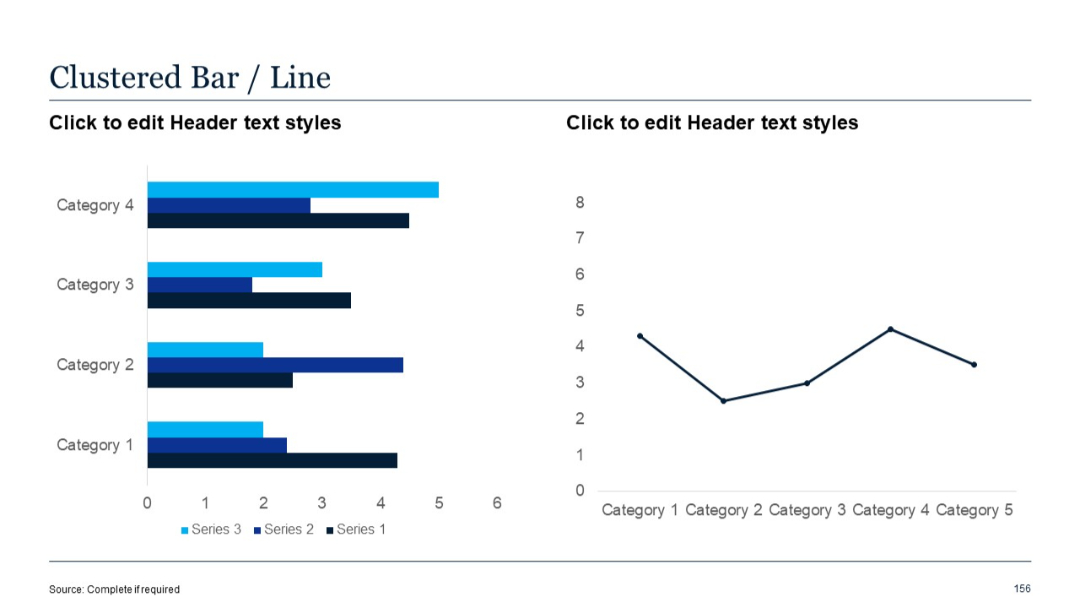
Horizontal clustered bar chart on the left, line chart on the right. Each series is separately colored for clarity.
PRO
Horizontal checklist with circular colored markers and an illustration of a clipboard with checkmarks.

PRO
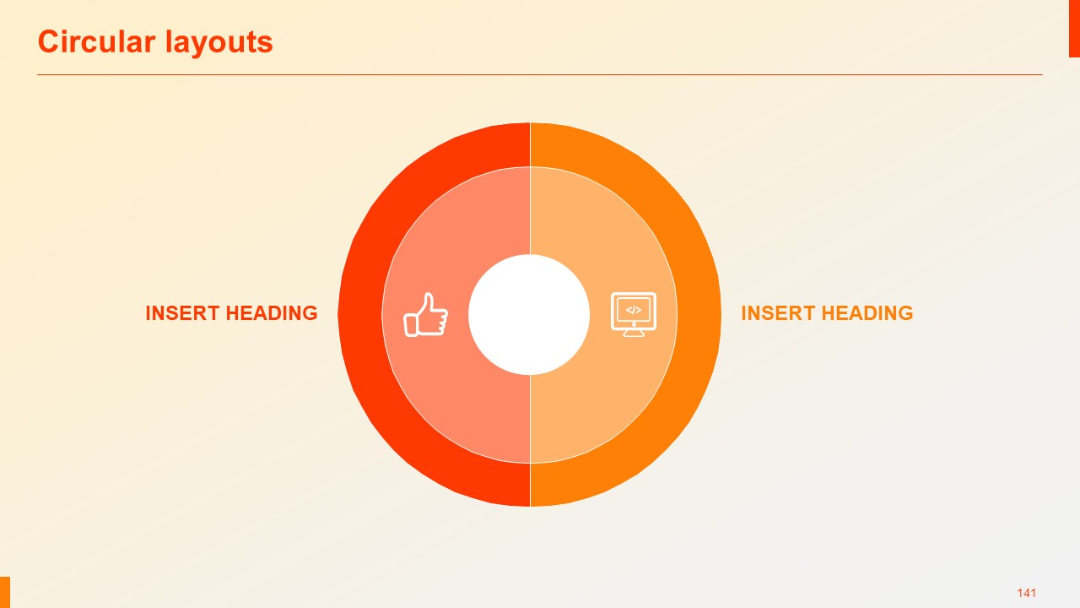
Two-part circular diagram with central icons and surrounding gradient ring, orange-red color scheme.
PRO
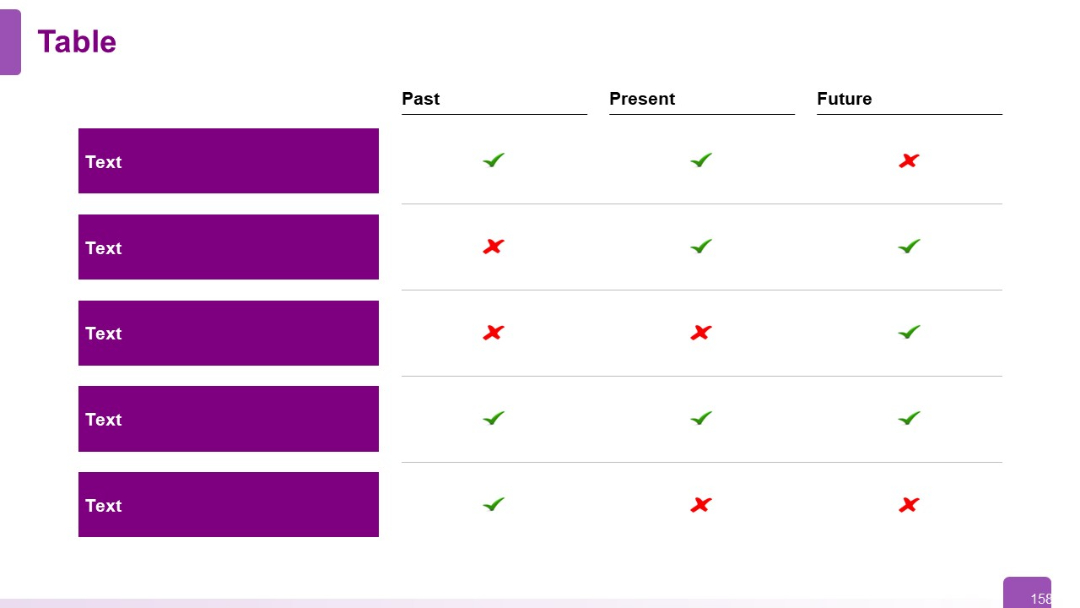
Past-Present-Future layout across three columns; rows represent different topics. Visual check/cross marks indicate status over time.
PRO
Centered quote with large quotation mark icons and author’s name and initials shown below with a round photo placeholder.

PRO
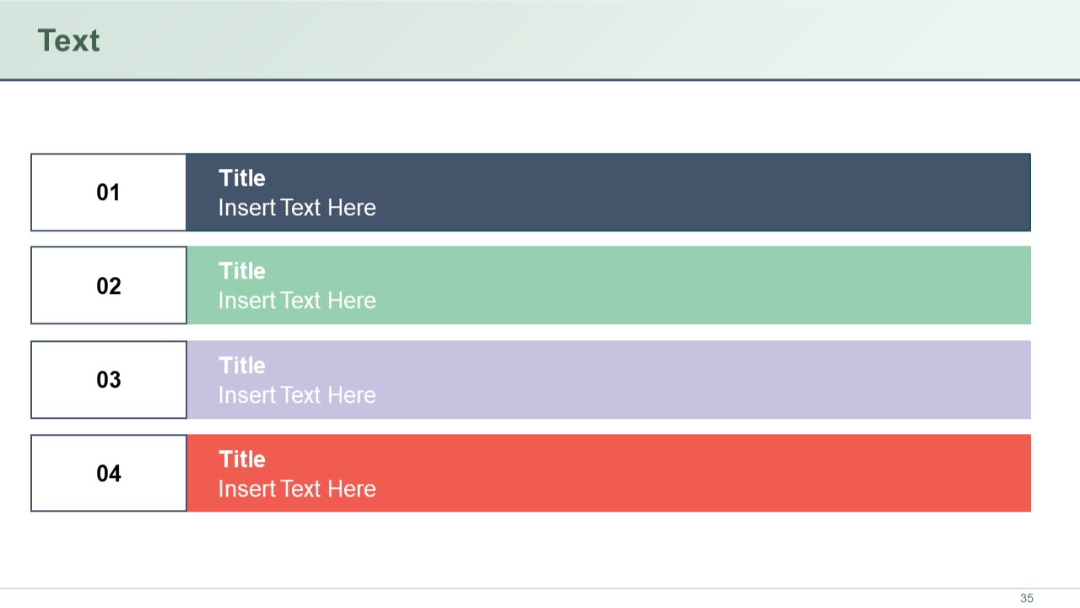
Four stacked colored bands with titles and numbers on the left side.
PRO
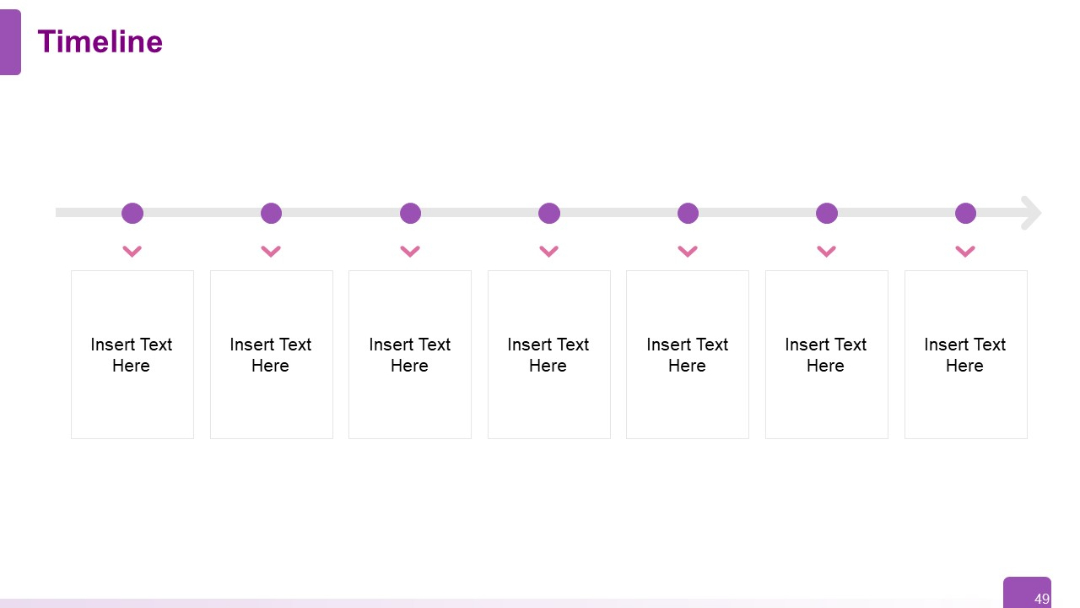
Clean timeline with 7 points marked by circles and arrows pointing to editable boxes below. Layout is symmetrical and minimalist.
PRO
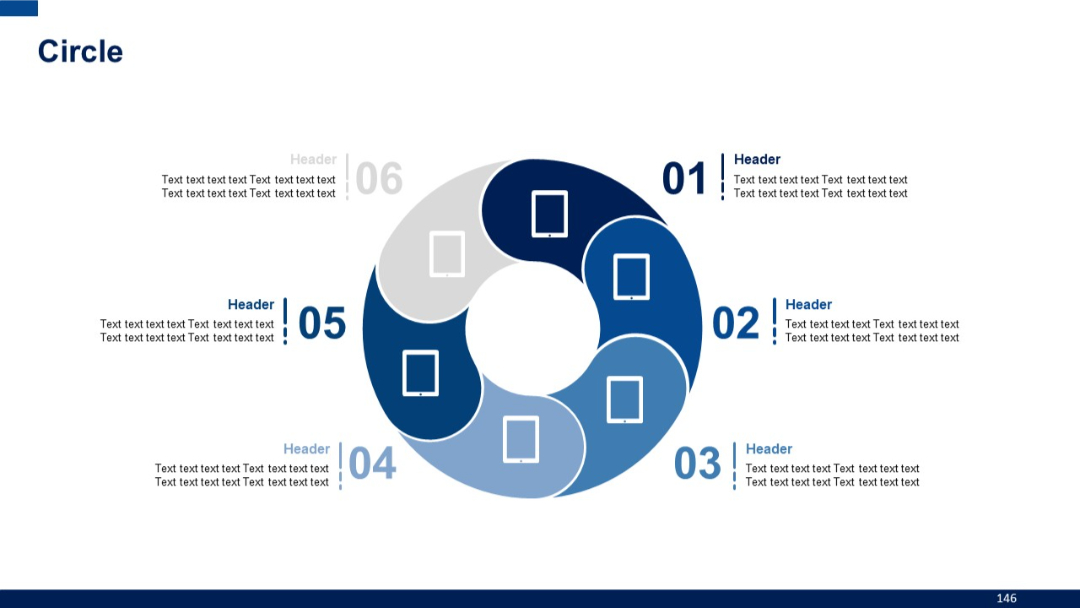
Stylized 6-part circular flow with alternating dark and light blue swirls. Each segment includes an icon and corresponding numeric label with text on either side.
PRO
World map with highlighted countries; each region is linked to a specific transformation domain via icons and text callouts.

PRO
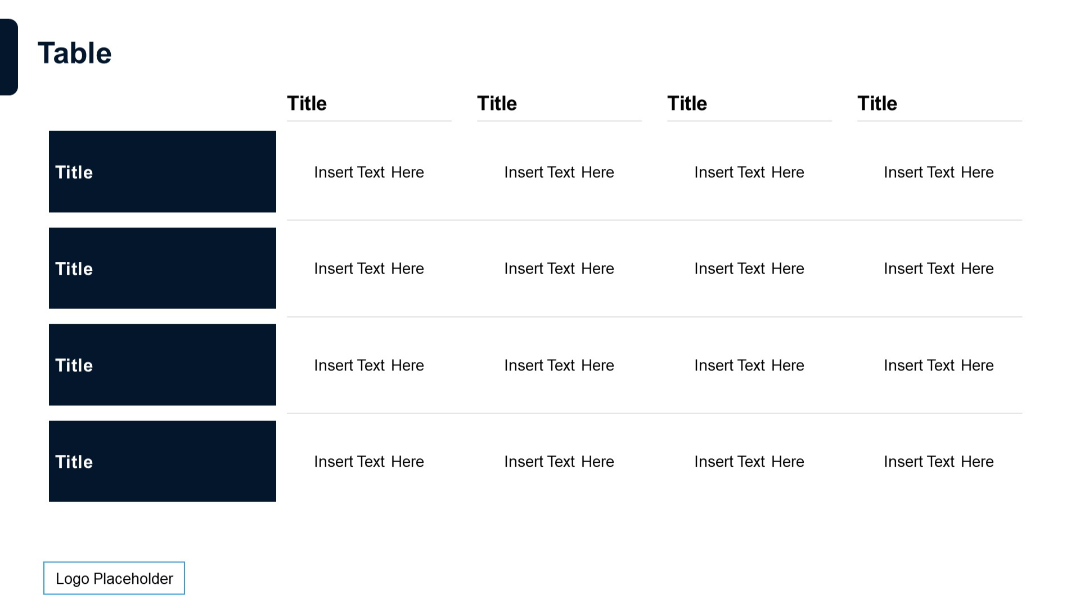
Table with 4 rows and 4 columns; left column has shaded title blocks; remaining cells are plain with text placeholders.
PRO
Four-column layout with colored headers (dark purple, lavender, pink, red), white background, and a red title bar.
PRO
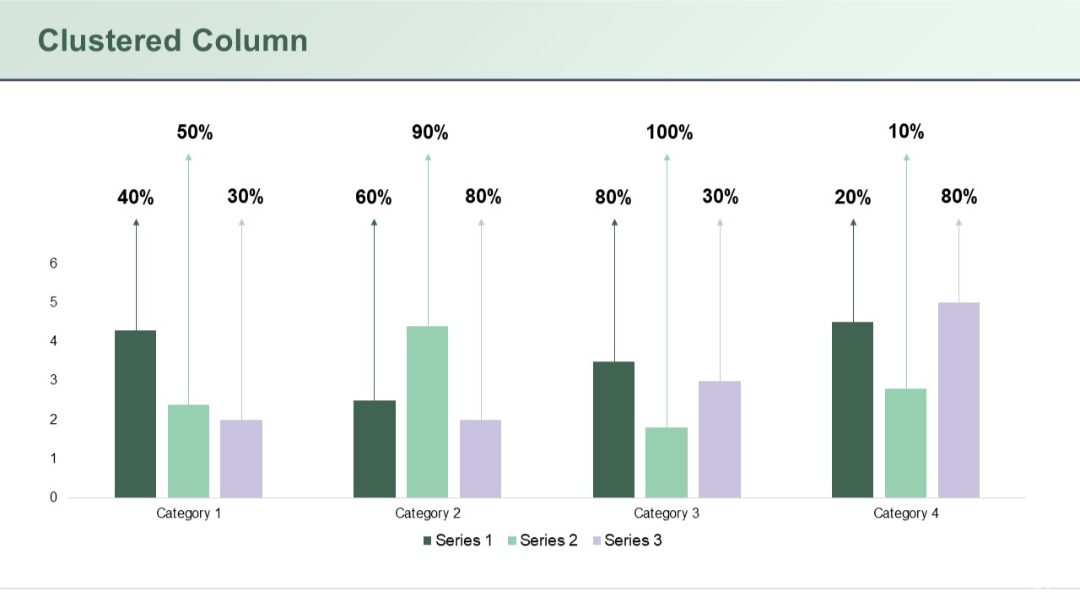
Simple clustered column chart layout with three vertical bars per category and percentage labels above each column. Light gradient background.
PRO
Four rows with colored diamond shapes (green, mint, lavender, red) on the left and placeholder text on the right.
PRO
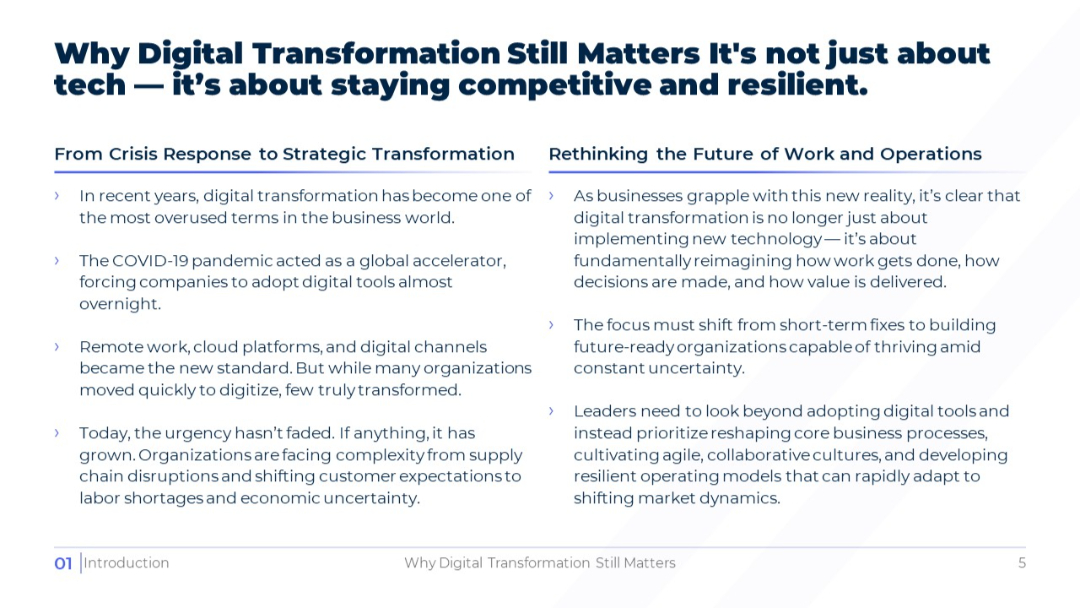
Two-column layout dividing content into "Crisis Response to Strategic Transformation" and "Rethinking the Future of Work and Operations." Each side features bulleted text. Clean and structured with ample white space.
PRO
Left-aligned vertical title column with dark blue background, connected to horizontally oriented data fields for each row.

PRO
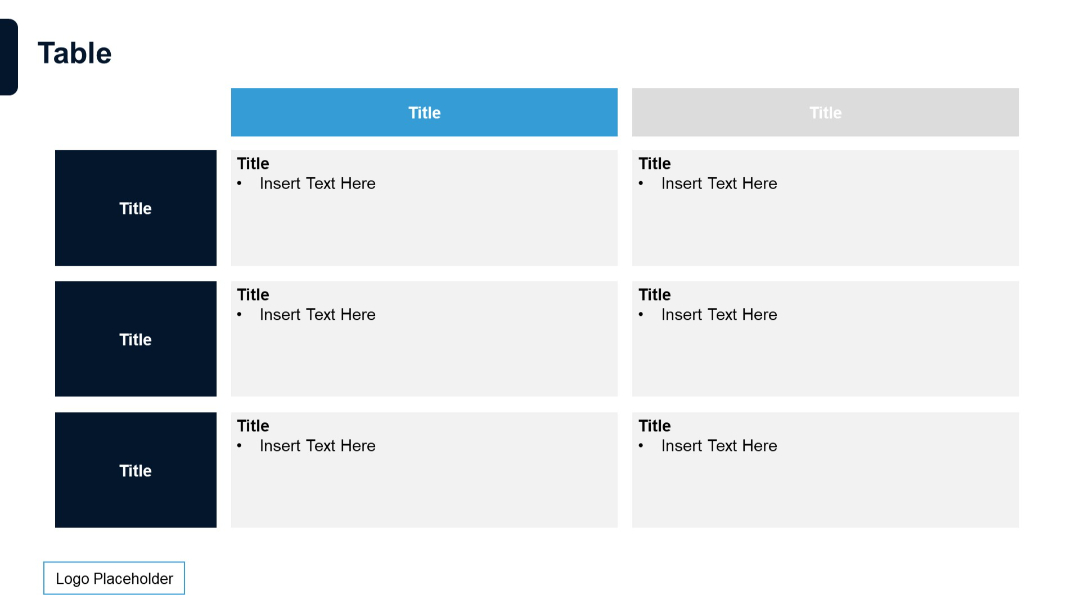
Color-coded table layout with dark blue row headers and blue/grey column headers. Bullet points in cells for emphasis.