PRO
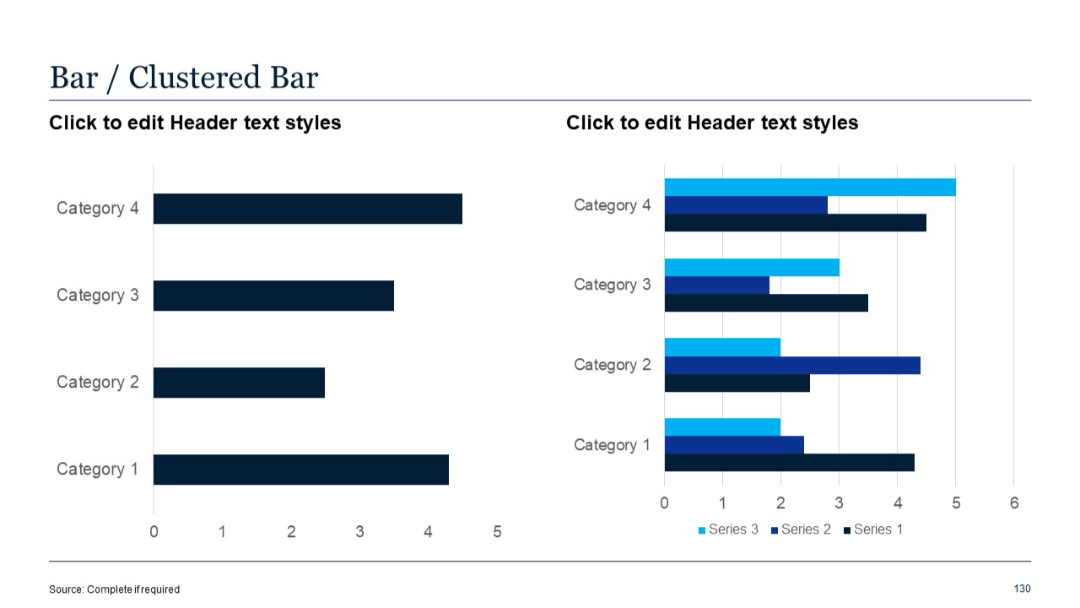
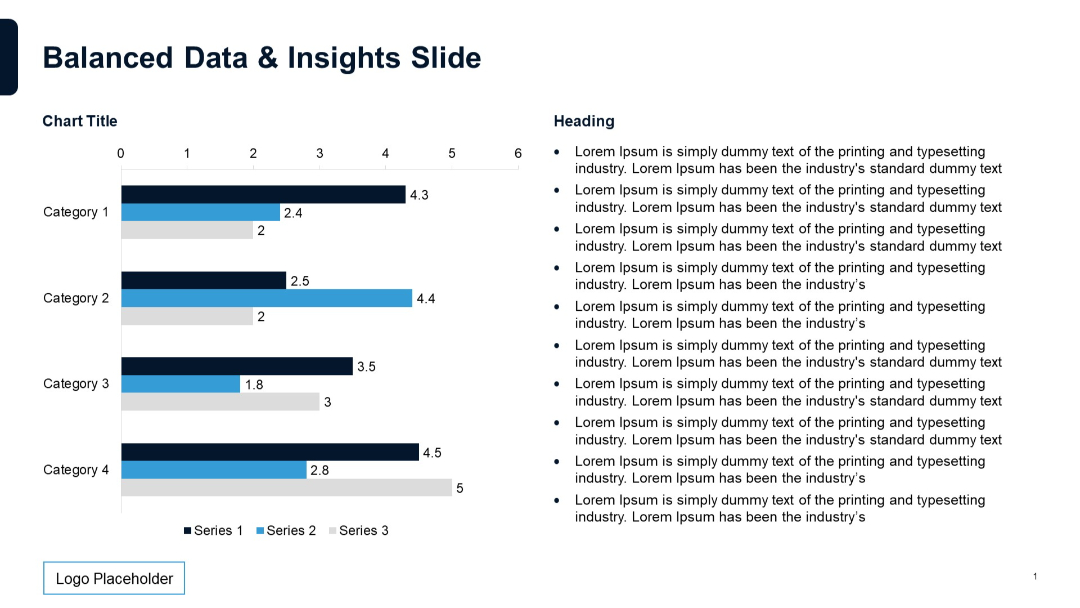
Left: plain bar chart; Right: clustered bar chart showing three series side-by-side per category.
PRO
Calendar format similar to Slide 13 but with a heading box on top-left labeled “Insert Text Here” in red; calendar icon moved to top-right.
PRO
Donut chart with five divisions, each with a circular label outside the perimeter. Clean, radial design for showcasing balanced distribution.
PRO
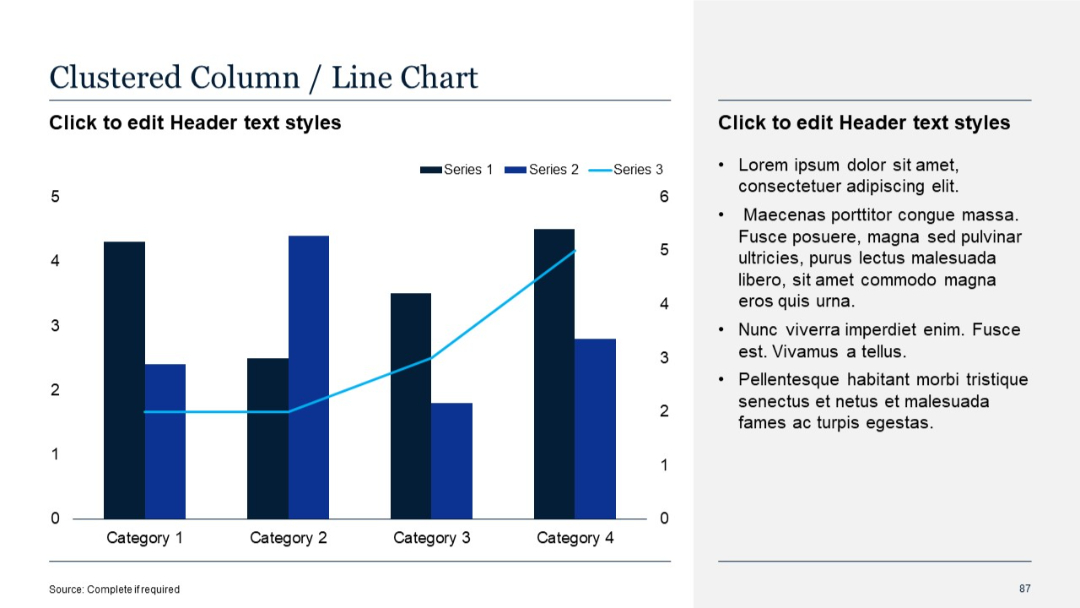
Clustered column chart with a secondary line series; text section on right
PRO
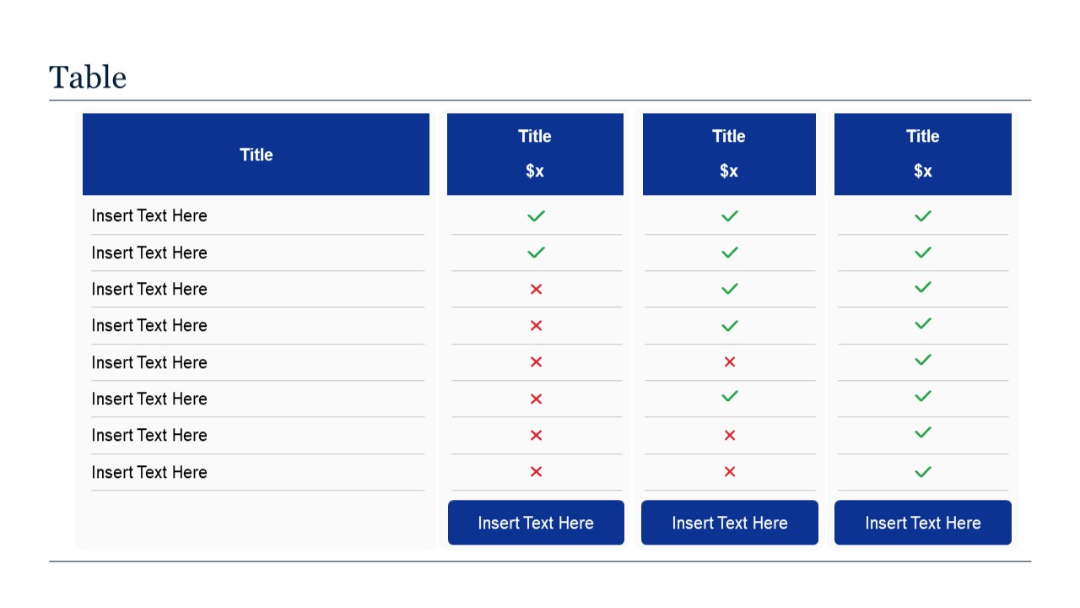
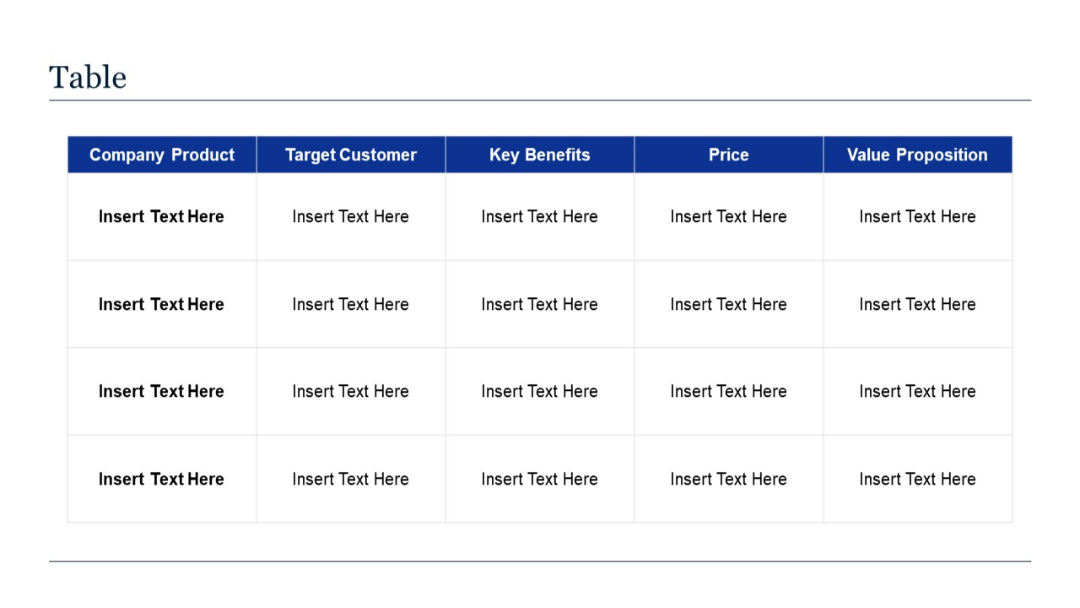
A 4-column vertical comparison table with one left-aligned features column and three offering columns using checkmarks/crosses for each feature.
PRO
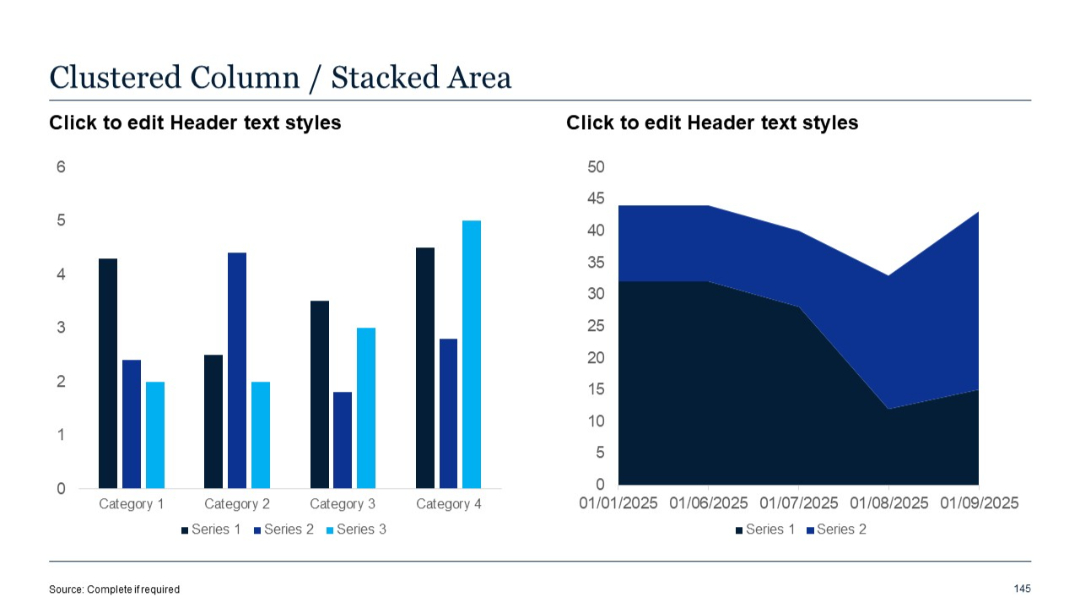
Left side is a clustered column chart, and the right shows a stacked area chart. Blue color palette used throughout.
PRO
Title slide with a vertical orientation and rounded corner on the right; blue background dominates right side; white left margin.

PRO
Dark background slide with bold section title and supporting bullet points. Clean layout with structured spacing.

PRO
Duplicate of Slide 133 – Semi-circular design with five labeled segments and a central heading.

PRO
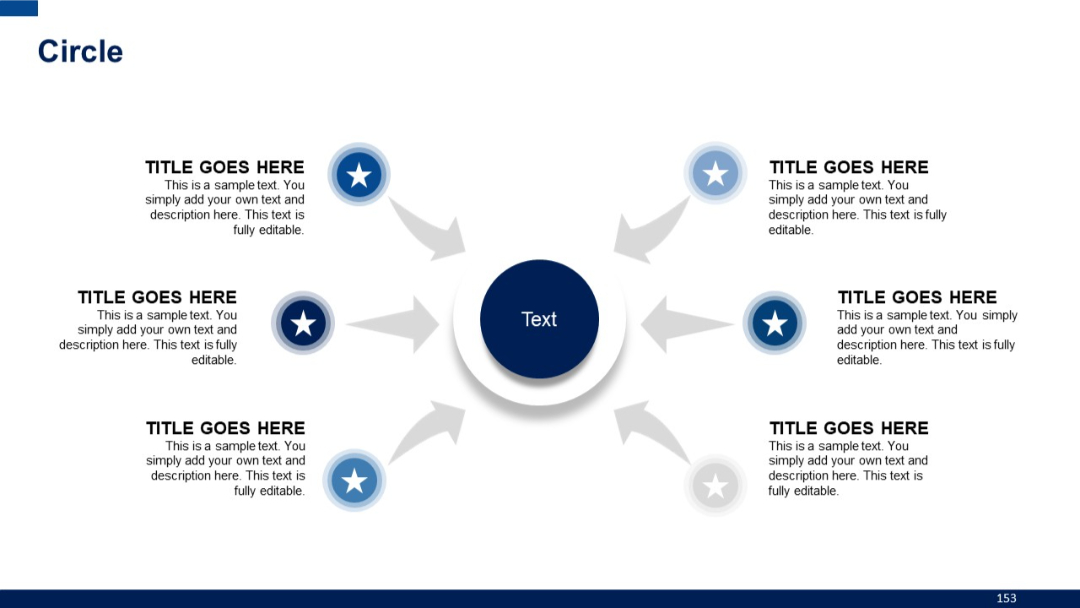
Central dark circle with “Text” and six arrows pointing outward to icons and text boxes evenly distributed around. Radial layout.
PRO
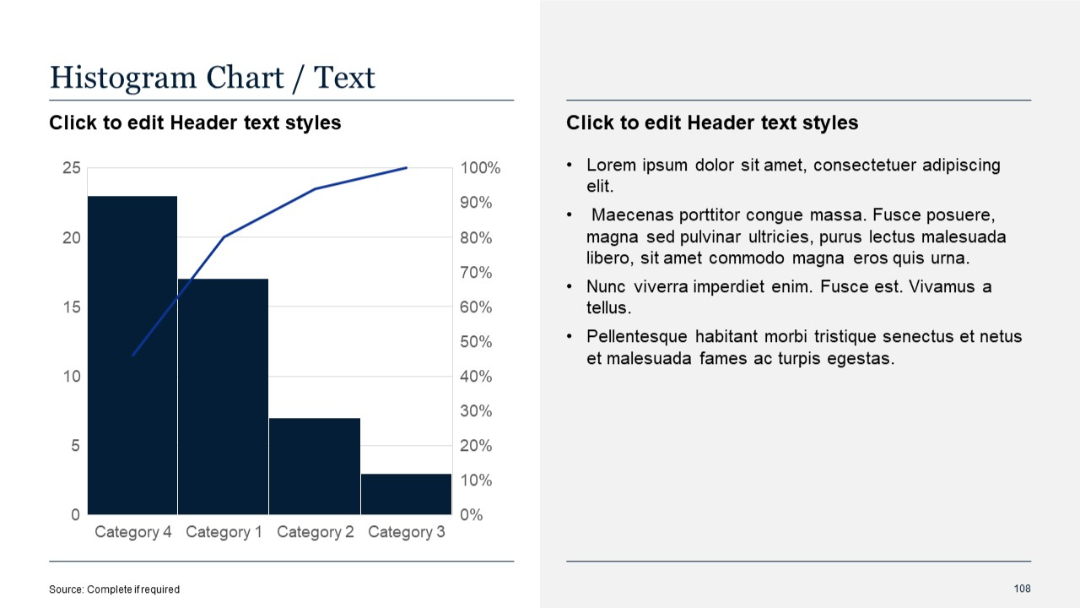
Bar chart with overlaid line (likely cumulative %) on left; bullet text on right.
PRO
Horizontal bar chart similar to Slide 31; consistent styling; placeholder bullets on the right.
PRO
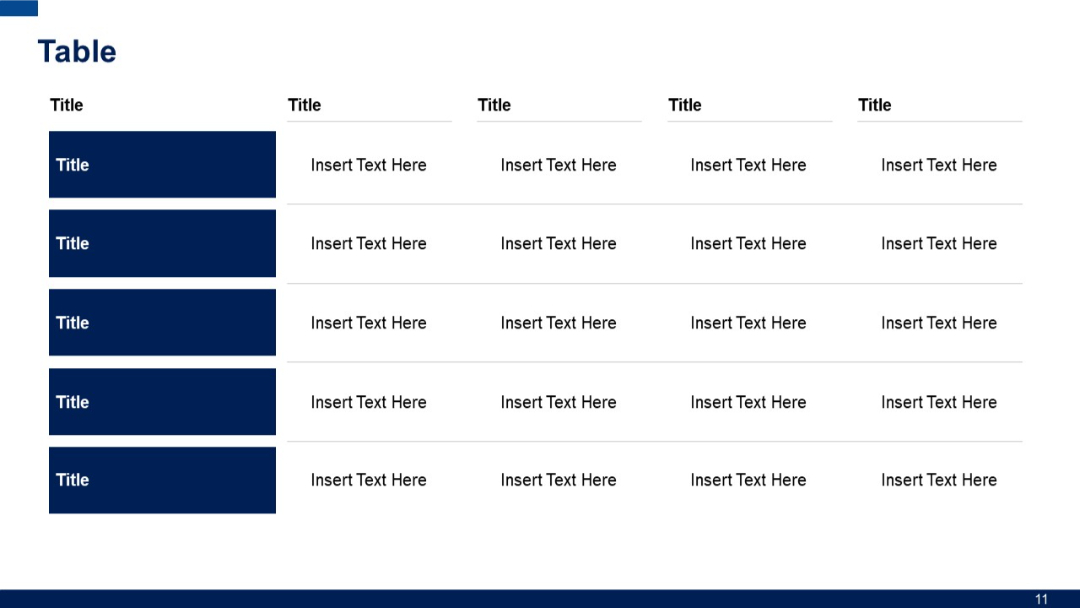
A 5x5 grid table layout; leftmost column has blue-colored cells with bolded "Title"; remaining cells are white with placeholder text.
PRO
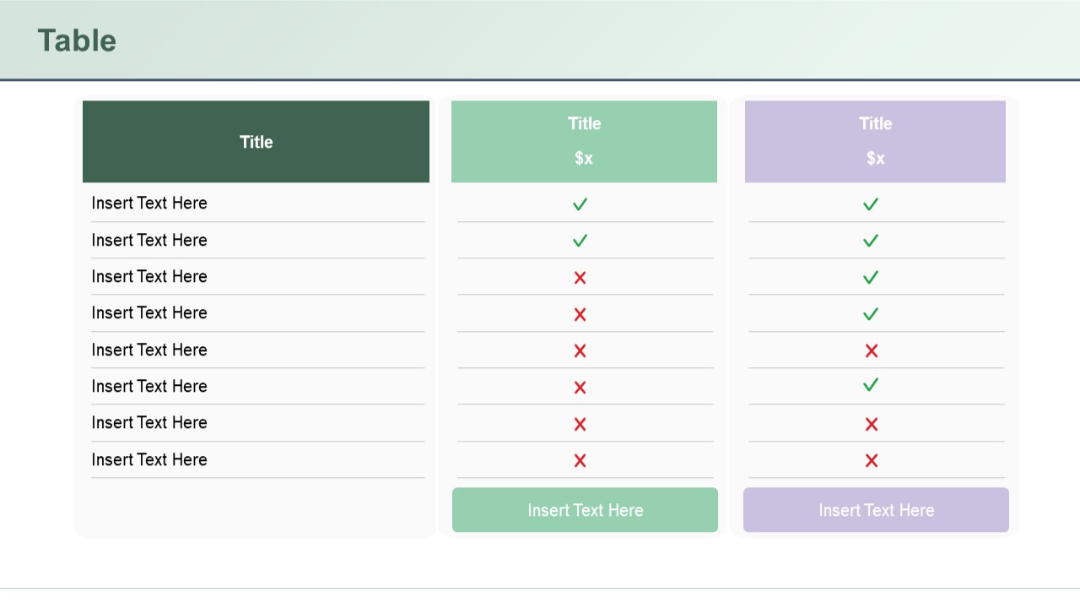
Three-column comparison table; first column is dark green with text rows, other two are pastel green and lavender with checkmarks and Xs; rounded rectangular layout.
PRO
Duplicate of slide 53, with nearly identical layout and content—map and three vertical columns for focus areas.

PRO
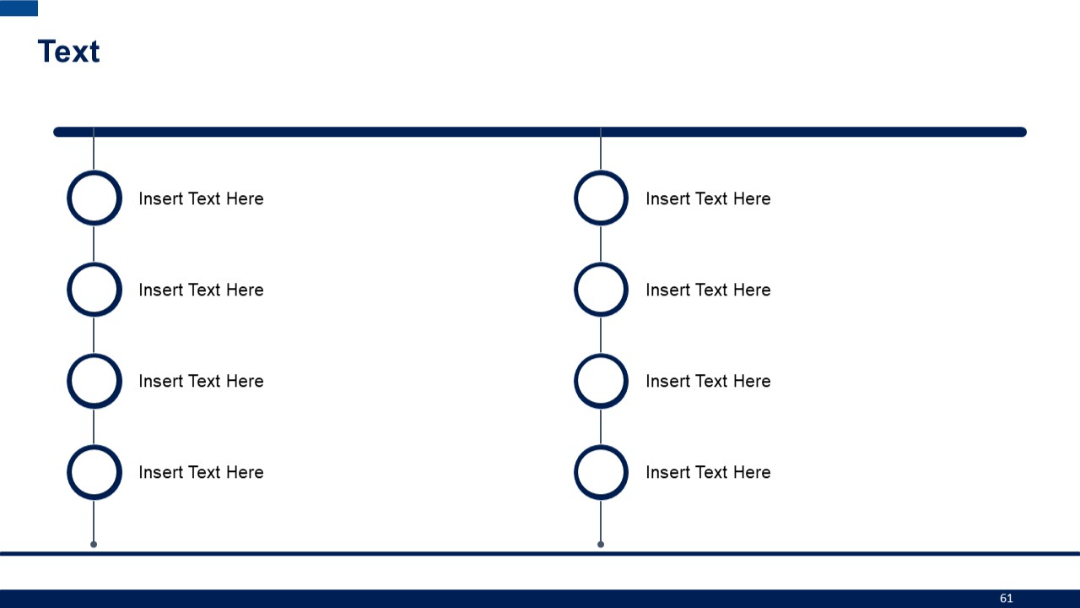
Horizontal timeline with two vertical branches (left and right), each with four circular icons and placeholder text beside each. Clean and symmetrical.
PRO
Split background with a gradient green upper half and white bottom. Minimalist design with large numeric indicator and bold section label.

PRO
Dark background with large stylized quotation marks and centered bold text quote.

PRO
Extended version of Slide 29 with four rows; maintains the same column structure but adds more data entries for comparative analysis.
PRO
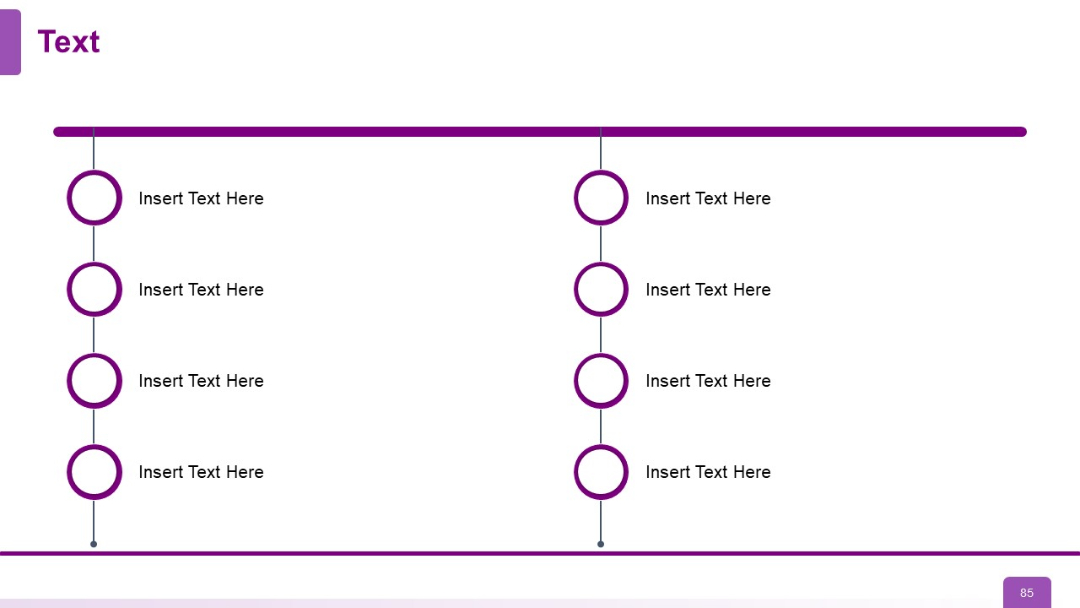
Symmetrical horizontal timeline with circles connecting to alternating left and right text blocks. Strong central divider.
PRO
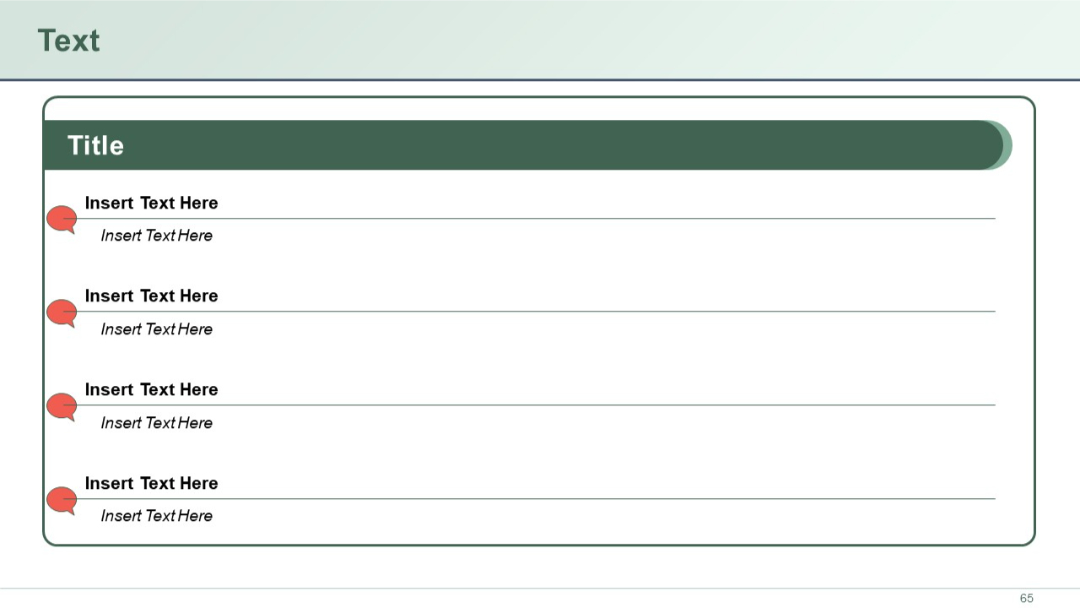
Message board-style layout with a large header bar and four speech bubble icons. Each row includes bolded and italicized text areas.
PRO
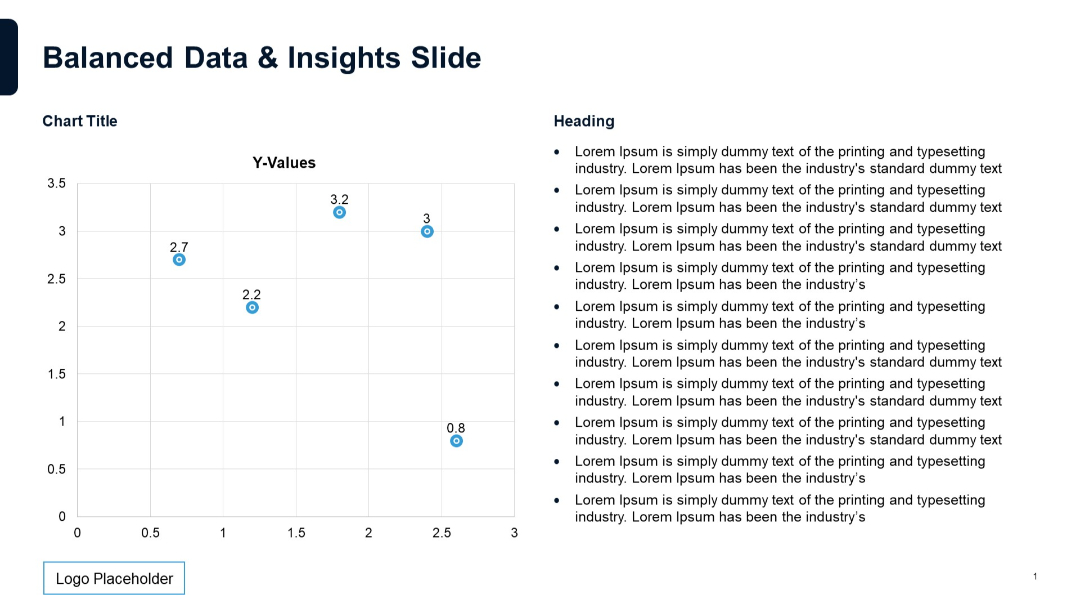
Scatter plot chart on the left labeled with Y-values. Even split between chart and bullet text section.
PRO
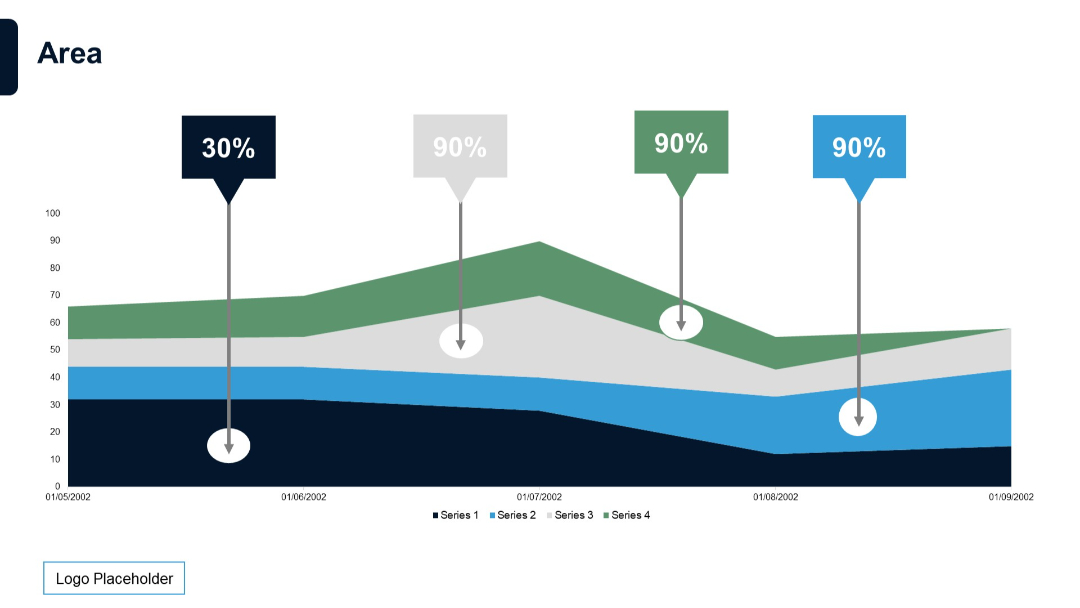
Stacked area chart with annotations (percentages on callouts) and four series. Emphasizes key data points over a time series.
PRO
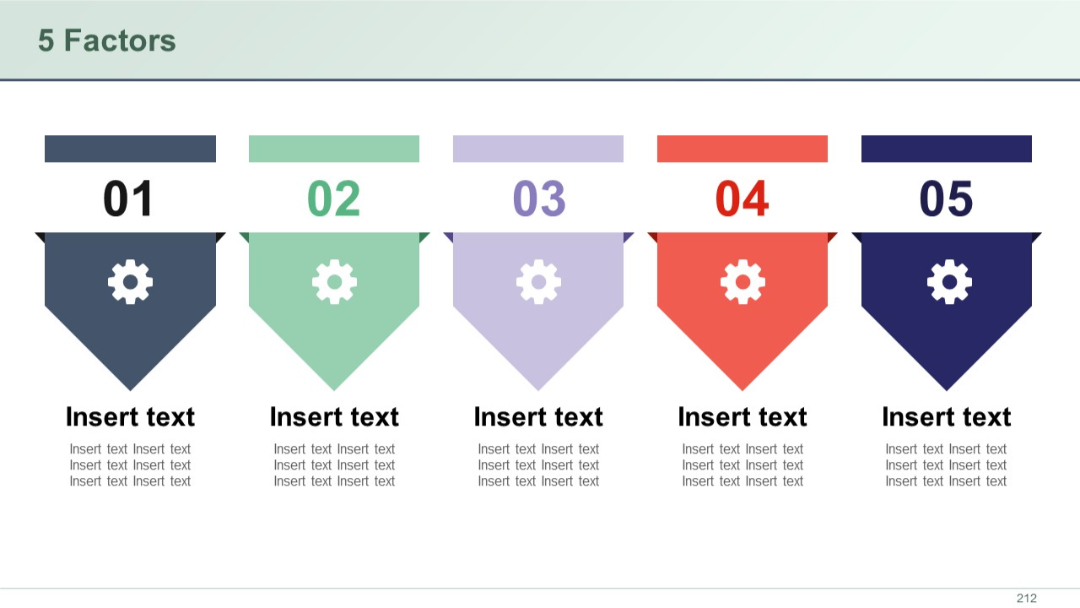
Five vertically hanging arrow elements shaped like banners with cog icons, each numbered and color-coded, aligned horizontally with space for corresponding text.
PRO
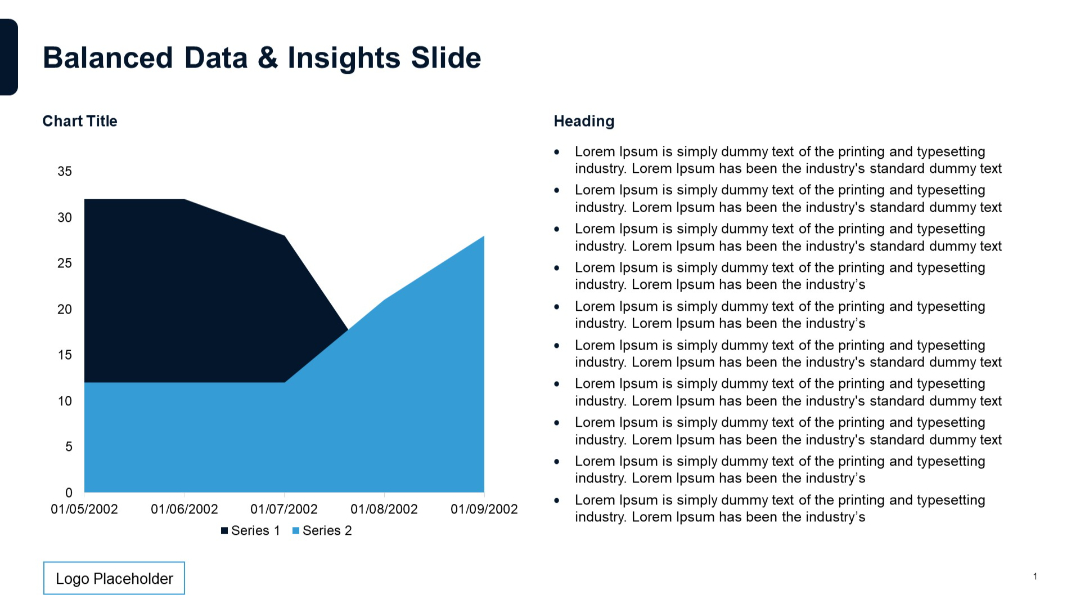
Filled area chart (2 series) on left side and bulleted text on the right. Clean, minimalist layout with left chart and right text split evenly.
PRO
A vertical funnel divided into five segments with icons in the center of each layer and descriptive text boxes placed on alternating sides.

PRO
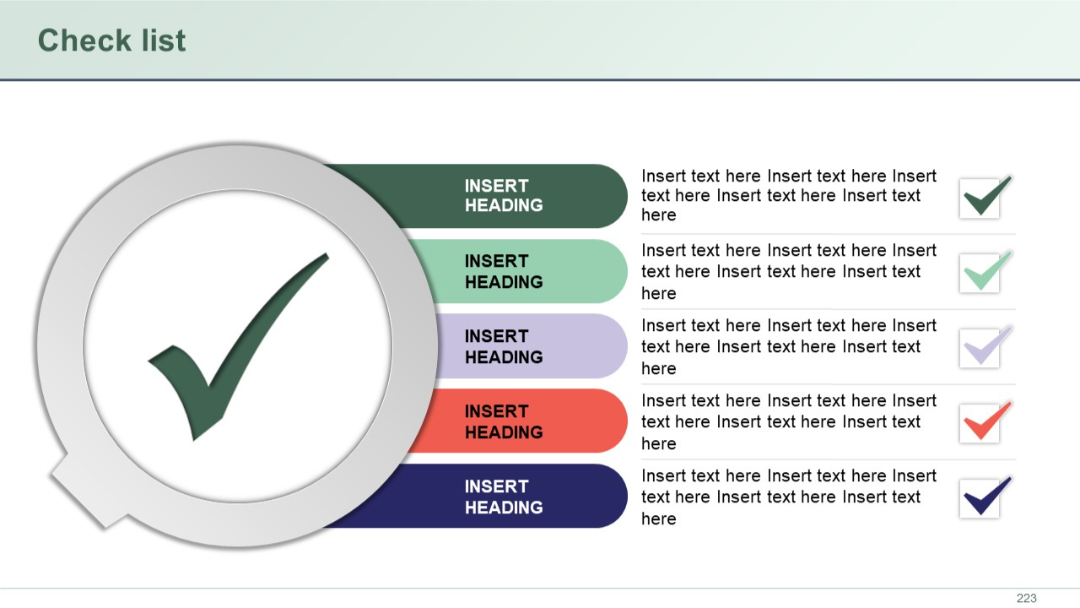
Large checkmark icon on left with vertical rows of colored rounded rectangles and checkmarks on the right. Multicolor styling.
PRO
Dark blue background, bold gradient text, minimal elements with a date in the top-right corner.

PRO
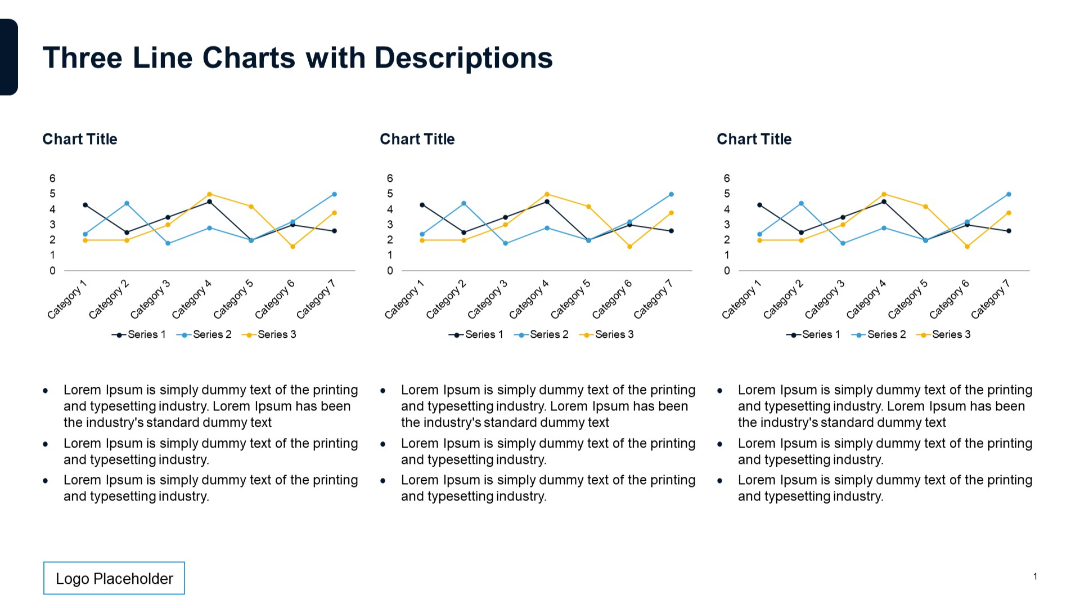
Three line charts placed horizontally, each with a 3-series trend over 7 categories. Text below each chart in bullet format.
PRO
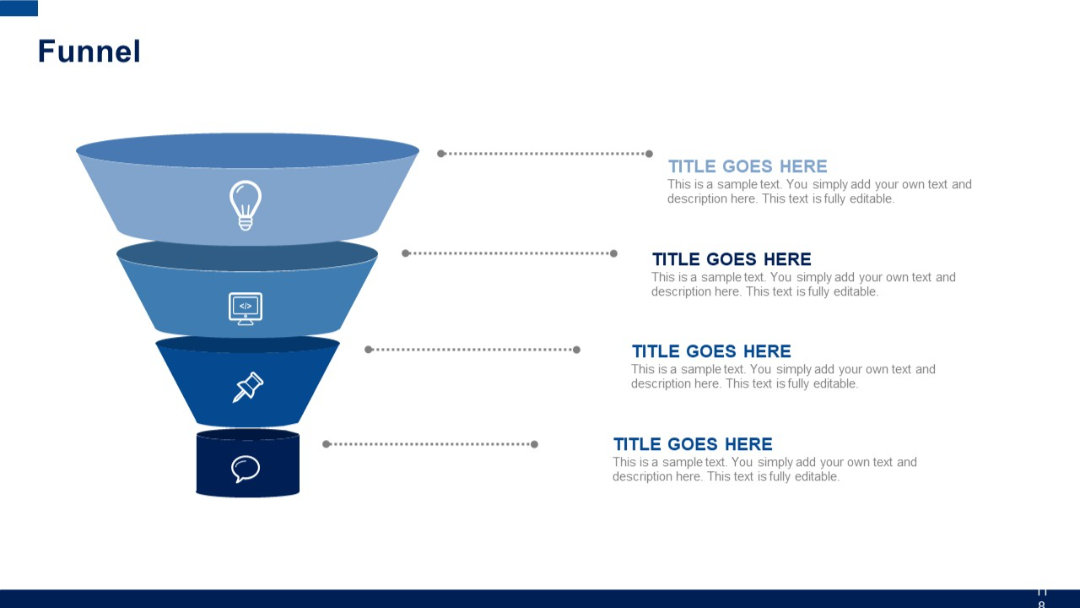
Vertical layered funnel diagram with four funnel levels, each with an icon and aligned descriptive text to the right.