PRO
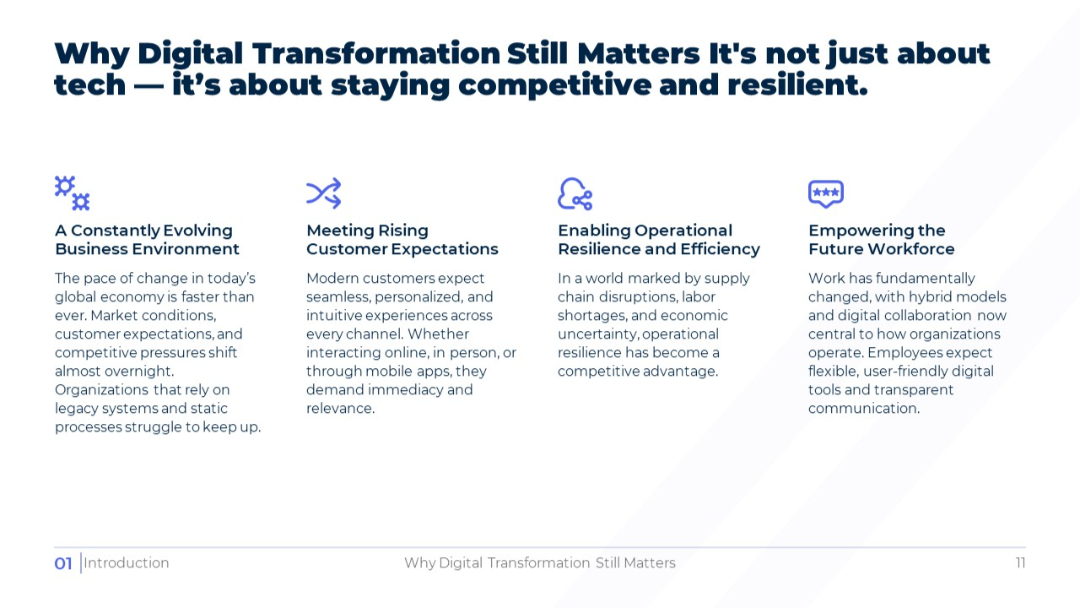
Four-column layout with icons and short paragraphs; clean white background with bold blue headings and minimal design accents.
PRO
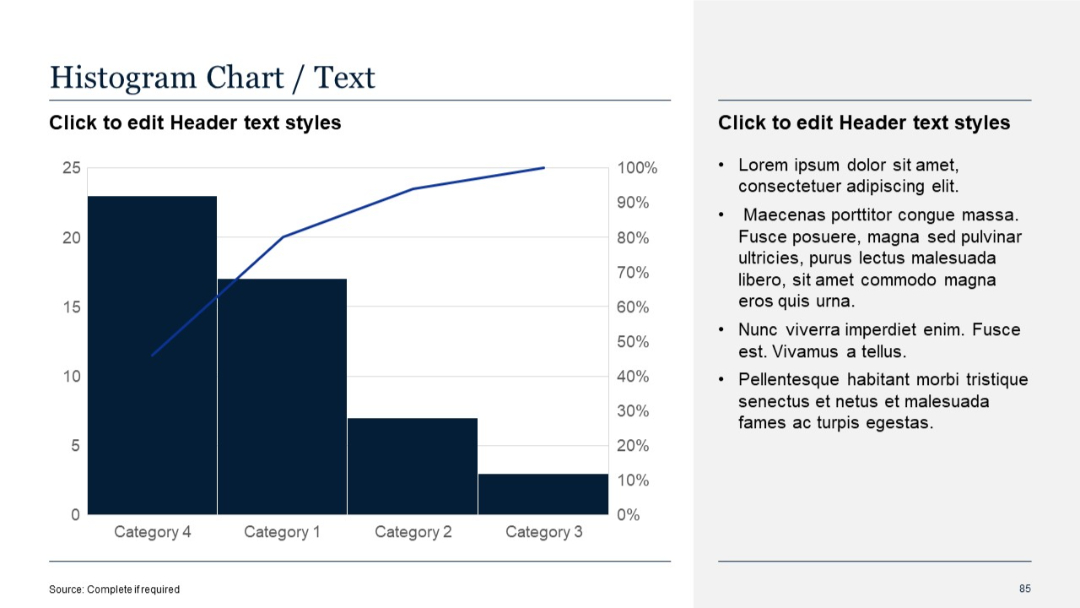
Vertical bar chart with overlaid line chart (Pareto-style); explanatory text on right
PRO
Dark navy background with a central horizontal white line ending in a dot; title text is bold and left-aligned.

PRO
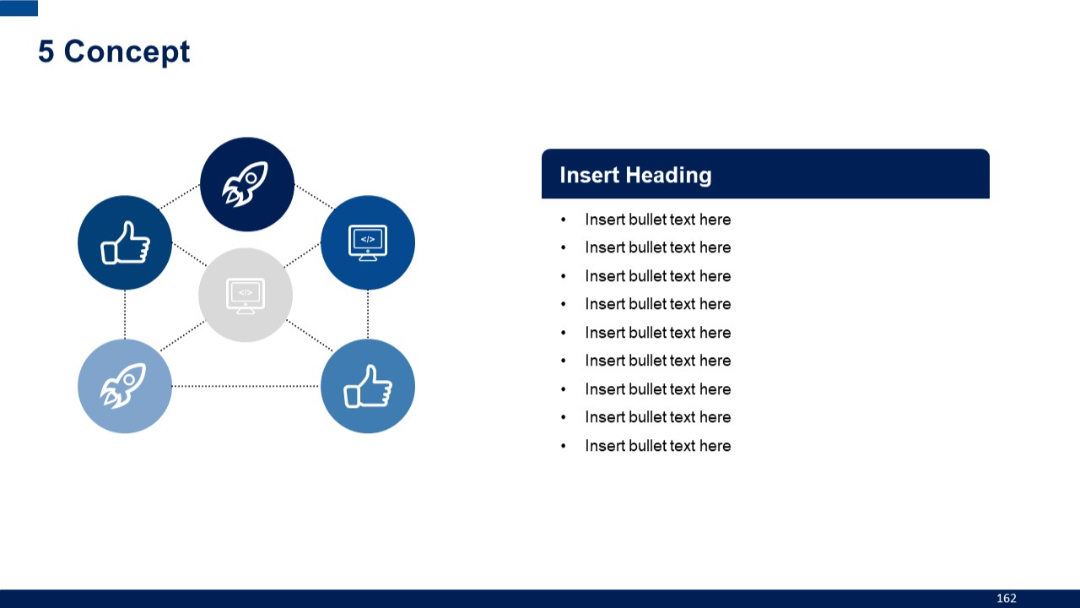
Similar structure to previous, but with changed emphasis: darker shading on rocket and thumbs-up icons. Network expanded to five icons.
PRO
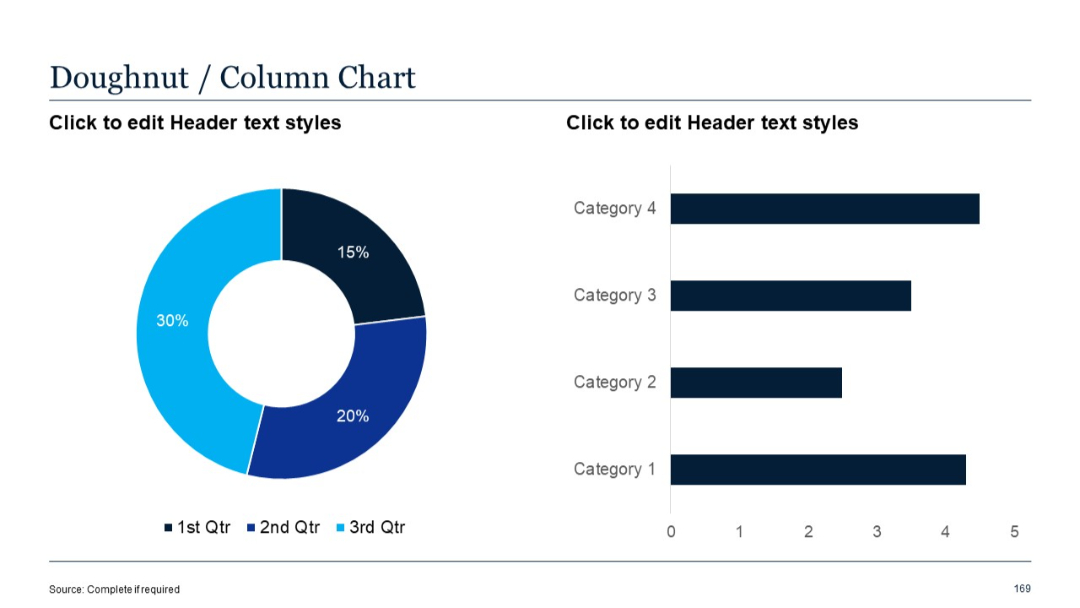
Doughnut chart with corresponding horizontal bar chart (column format) for four categories.
PRO
Visual slide with full-image background of glass building and binary code. Bold section number and title overlay.

PRO
Spiral-like segmented circular graphic on the right, paired with a vertical list of 4 color-coded numbered bullets on the left.
PRO
Four-column layout with repeating “Title” and “Slide No.” fields across three side-by-side tables. Extensive list format.
PRO
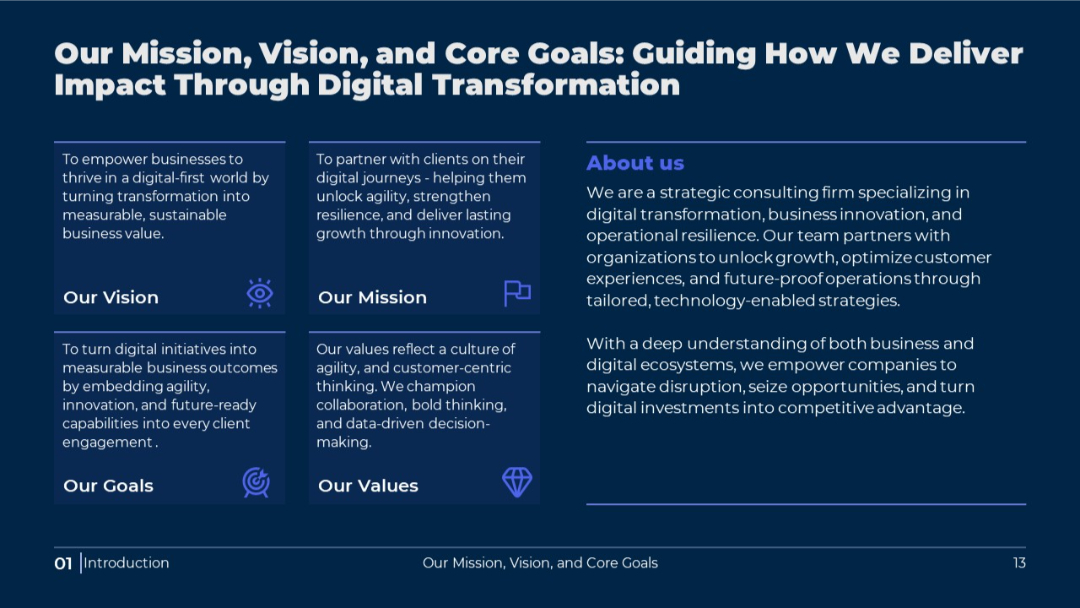
Two-panel layout with dark background; left shows mission, vision, goals, values in blocks; right includes a detailed "About us" section.
PRO
Five-row, five-column grid with same layout as slides 41–42. Balanced structure, red headers, placeholder text.
PRO
Three-column layout; dark background with bold text stats; evenly spaced with central alignment; modern infographic styling.

PRO
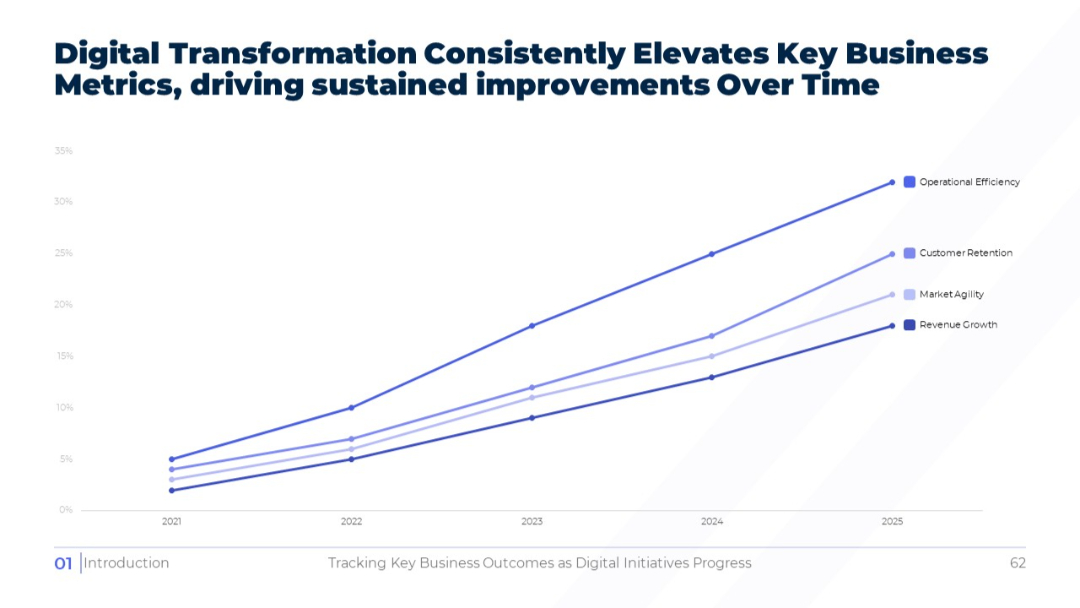
Full-width line graph on white background showing upward trends for key metrics from 2021 to 2025. Legend to the right identifies lines by color and label.
PRO
Clean, minimalist boxes for each time period (30/60/90 days) with corresponding motion-themed icons in box corners.
PRO
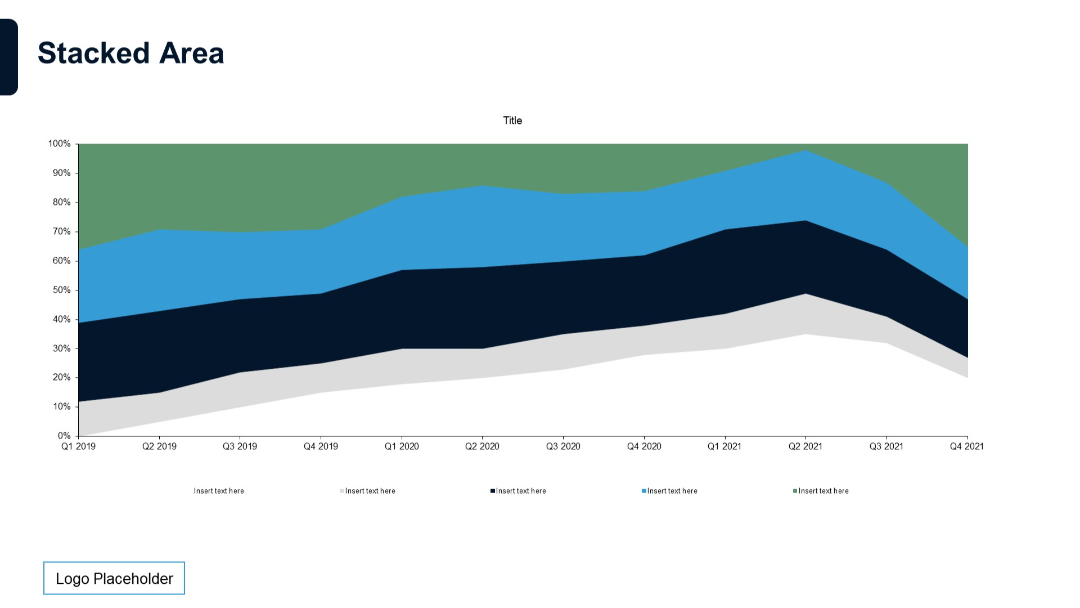
Full-width stacked area chart across a timeline from Q1 2019 to Q4 2021. Clean layout with labeled segments and soft color transitions.
PRO
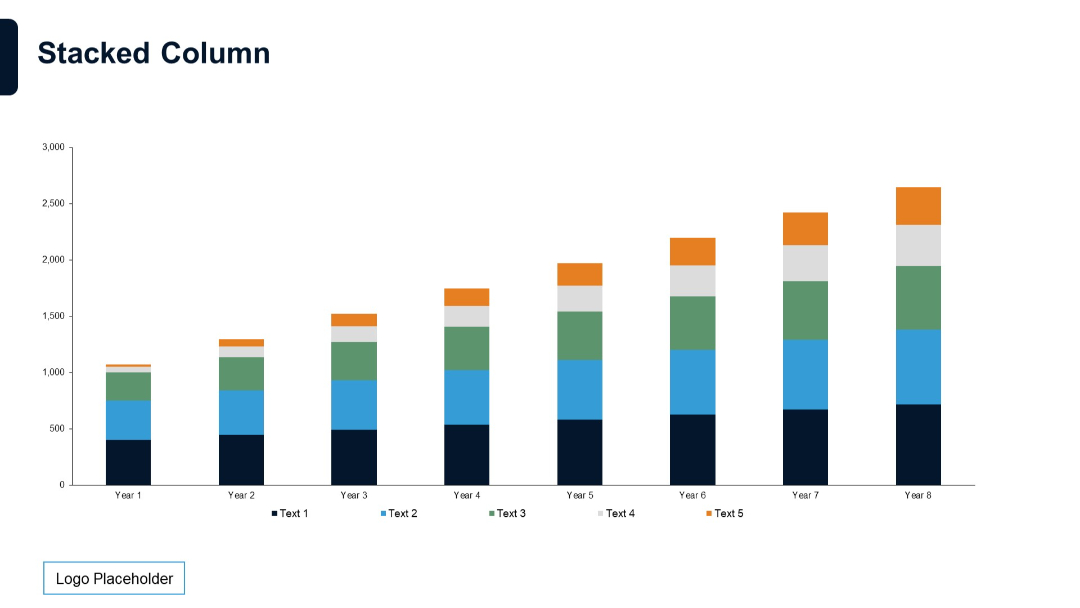
Vertical stacked column chart for 8 years. Each column is divided into five color-coded segments with legend.
PRO
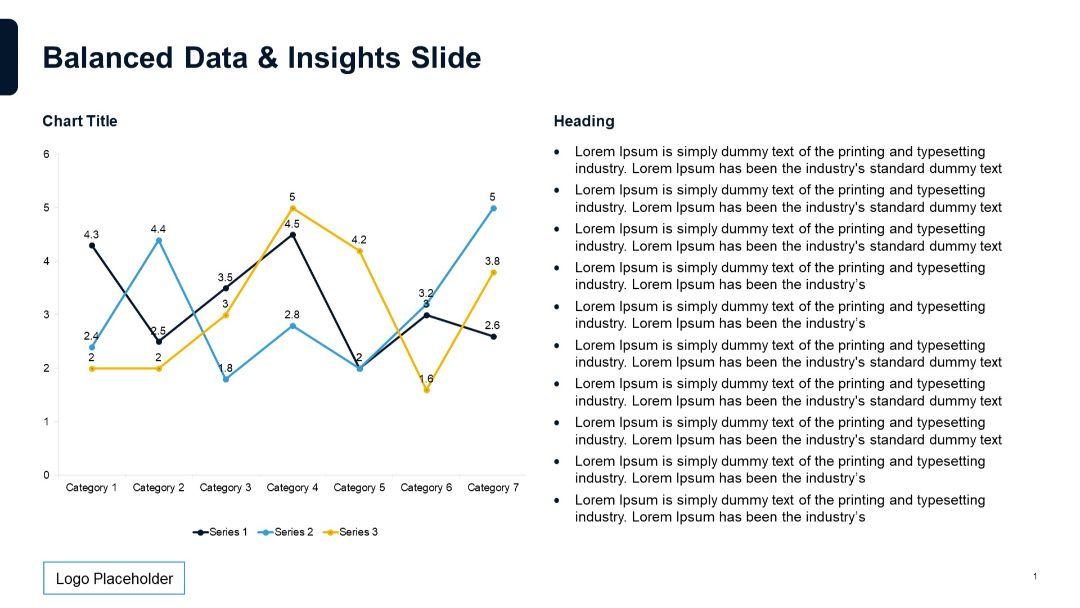
Multi-line chart with points labeled; seven categories; bullet list on the right.
PRO
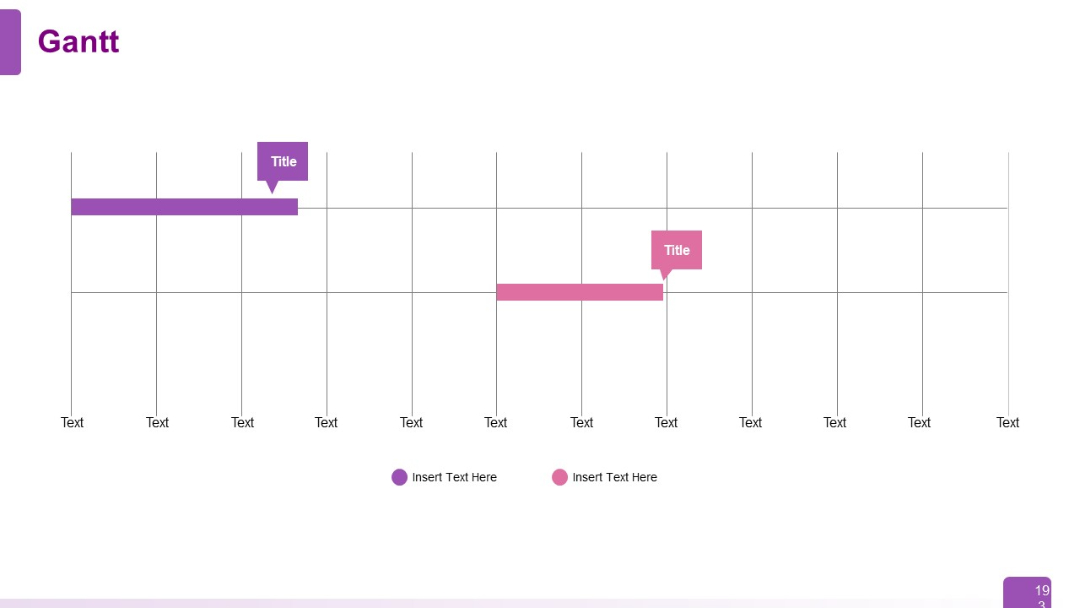
Minimalist Gantt chart using colored bars and speech bubbles for labels; sparse grid, light background.
PRO
Horizontally oriented funnel graphic with icons and text boxes on the left feeding into a dark funnel that narrows to a blue endpoint on the right.

PRO
White background with a dark purple header bar and large centered text box bordered with rounded edges; quote icons on upper-left and lower-right of the quote box.
PRO
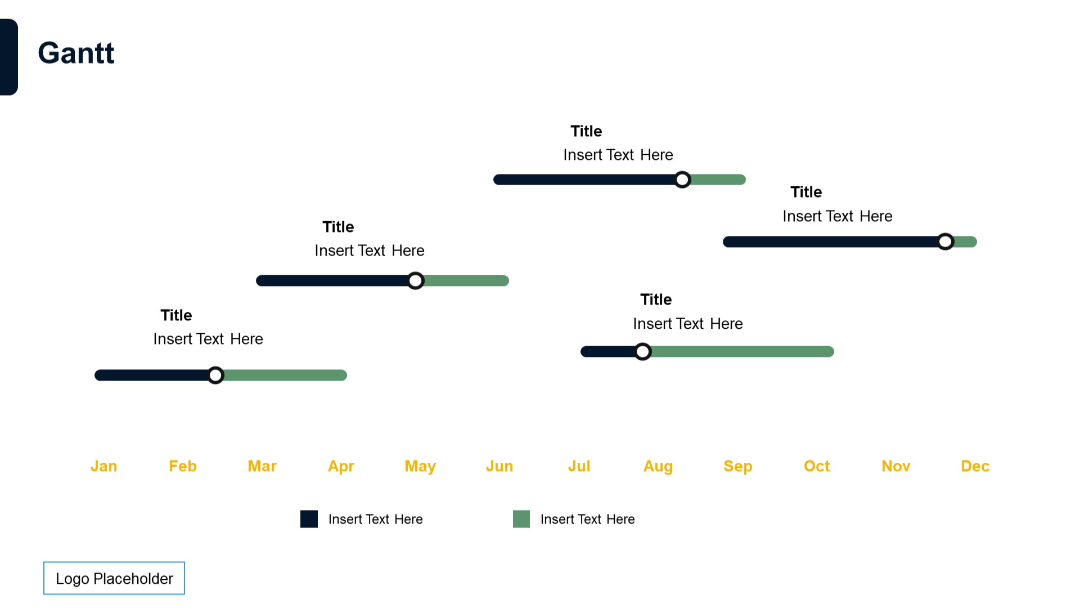
Stylized, minimalist Gantt chart using timeline dots and dual-colored horizontal lines mapped to months.
PRO
Five-row vertical layout with shaded title blocks on the left, paired with corresponding horizontal rows of four text-entry cells each.
PRO
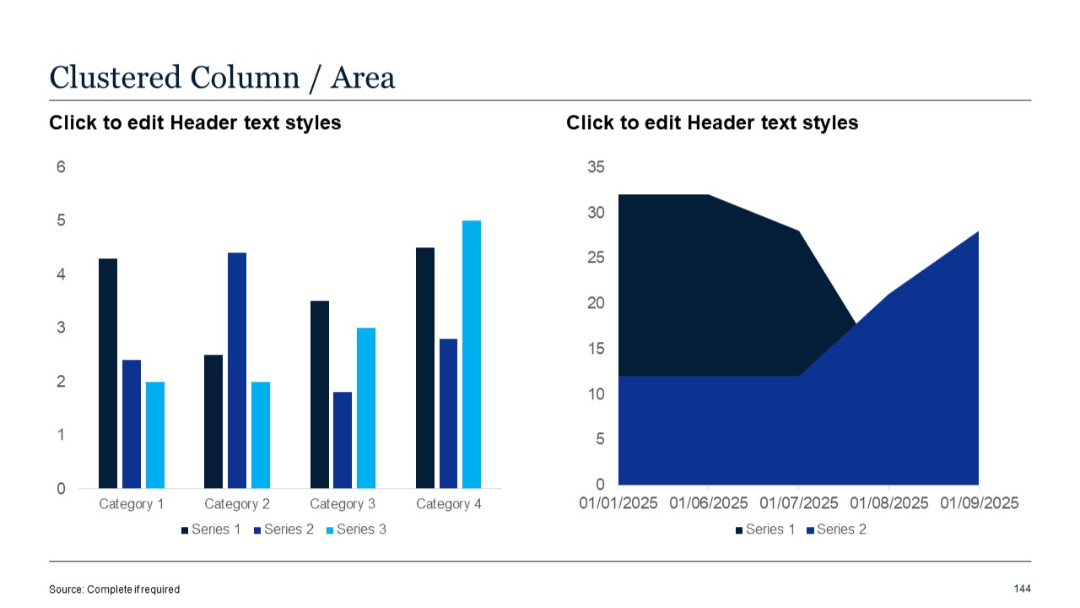
Left chart is a clustered column chart with 3 series across 4 categories; right is a standard area chart with two series over time.
PRO
Split layout with two columns: blue on left, red on right. Each column has six rows with numbered boxes and placeholder text. Circular icons above each section.

PRO
Title on the top left. Single dark banner with heading, followed by three sections with subtitles and bulleted text. Minimalistic white background with black/blue text.
PRO
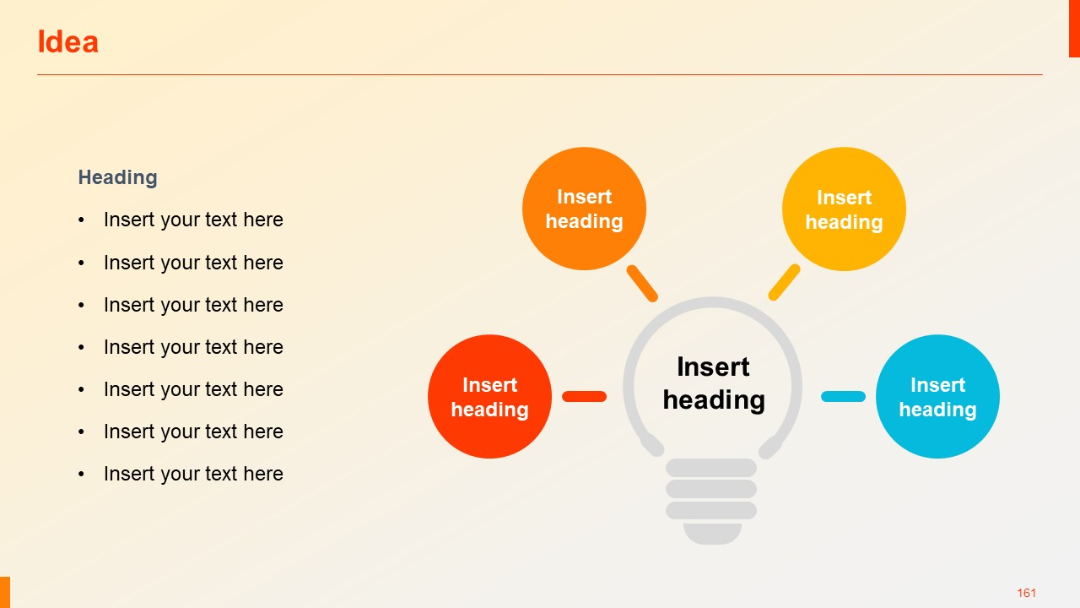
Light beige background, title on top left, left-aligned bullet list, central lightbulb graphic with 4 colored circles branching out.
PRO
Vertical timeline-style layout with alternating icons: checkmarks and circles. Each row has placeholder text aligned to the right of the timeline line.
PRO
Simple circular diagram divided into 4 equal quadrants with labels placed on small circular nodes outside each quadrant. Dark blue background circle with white nodes.
PRO
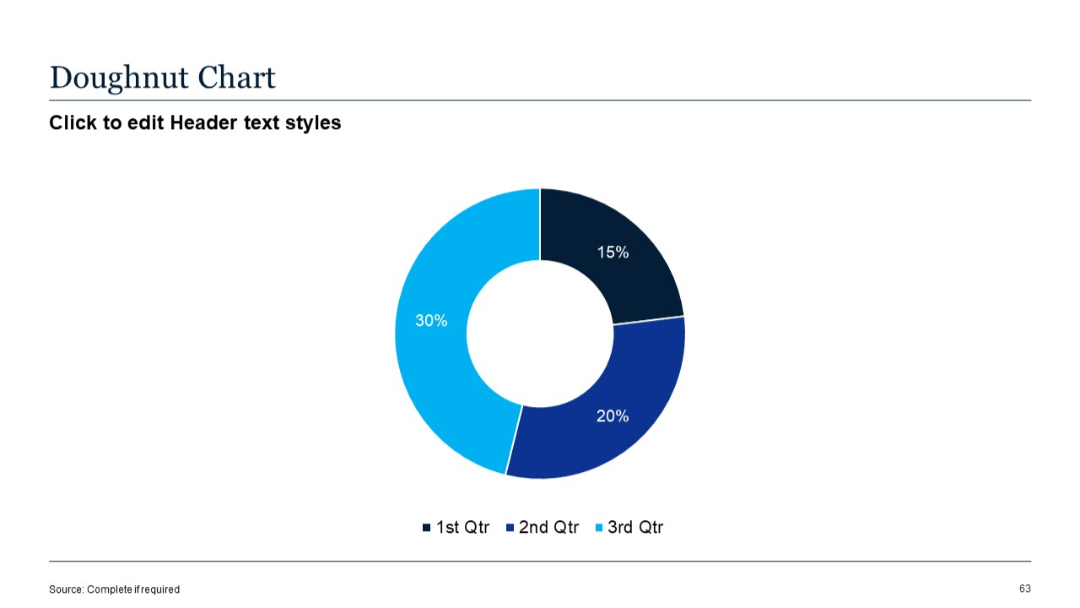
Circular doughnut chart with three segments labeled by percentage; clean white background.
PRO
Clean vertical list with three horizontally stacked rows; each item features a number (01–03) and text aligned beside it in a minimalist style.
PRO
Light-themed comparison table showing regional maturity levels from 2020 to 2025 across five global regions.


