PRO
Clean three-column layout with numbered headings and icons. Each pillar is supported by a short descriptive paragraph explaining its strategic importance.

PRO
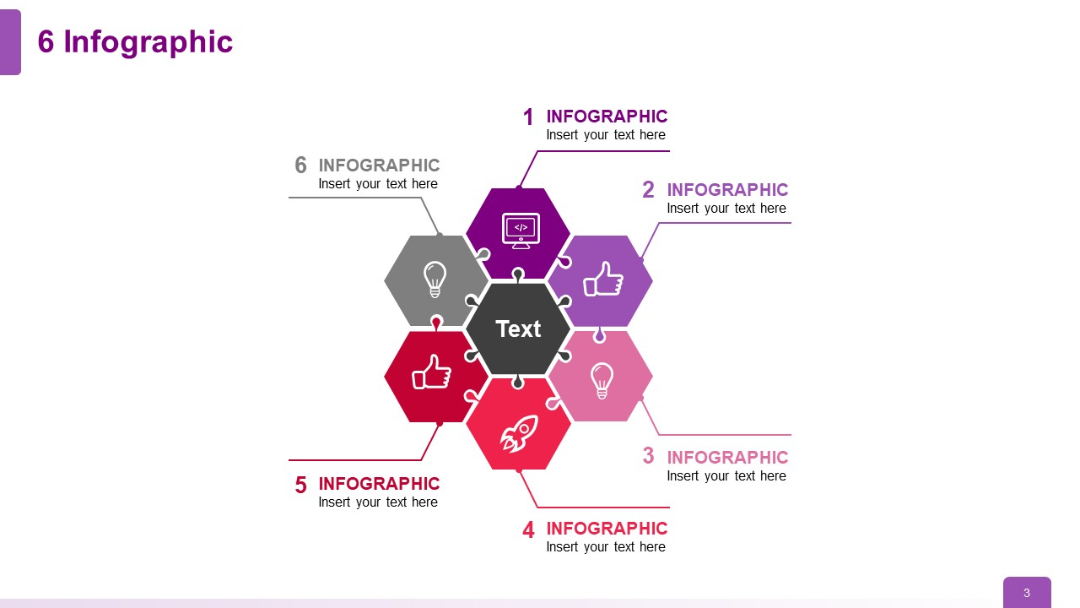
Central hexagon surrounded by six colored hexagons with icons and text, forming a beehive-style layout.
PRO
Two side-by-side vertical tables; each with title and slide number; alternating columns for entries.
PRO
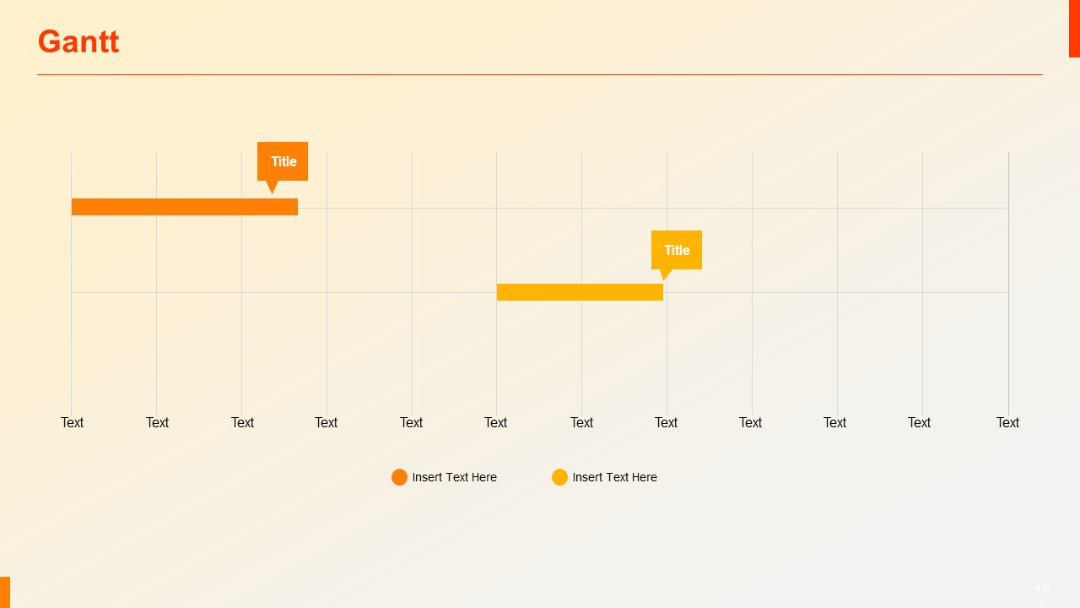
Two Gantt bars with speech bubble-style labels over a light grid layout; minimalistic design.
PRO
Large quote block on a blue background with stylized quotation marks and an adjacent white panel.

PRO
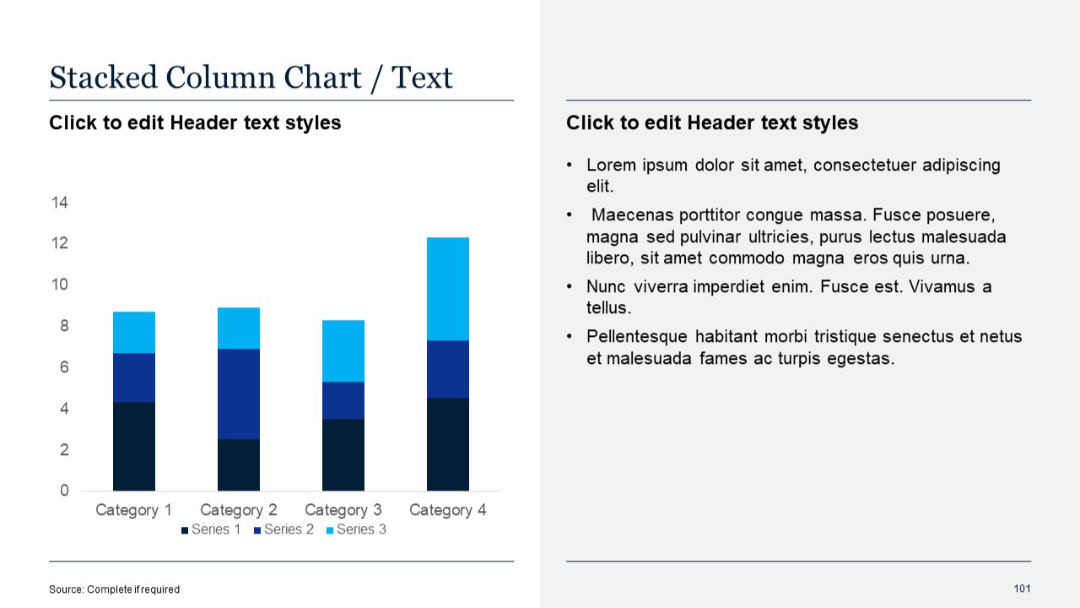
Two-column layout; left side features a stacked column chart with legend, right side has bullet text.
PRO
Slide presents four vertical columns, each with a heading and bulleted list. Compact layout, evenly spaced.

PRO
Dark-themed, vertically segmented flow diagram with five labeled stages and supporting icons.

PRO
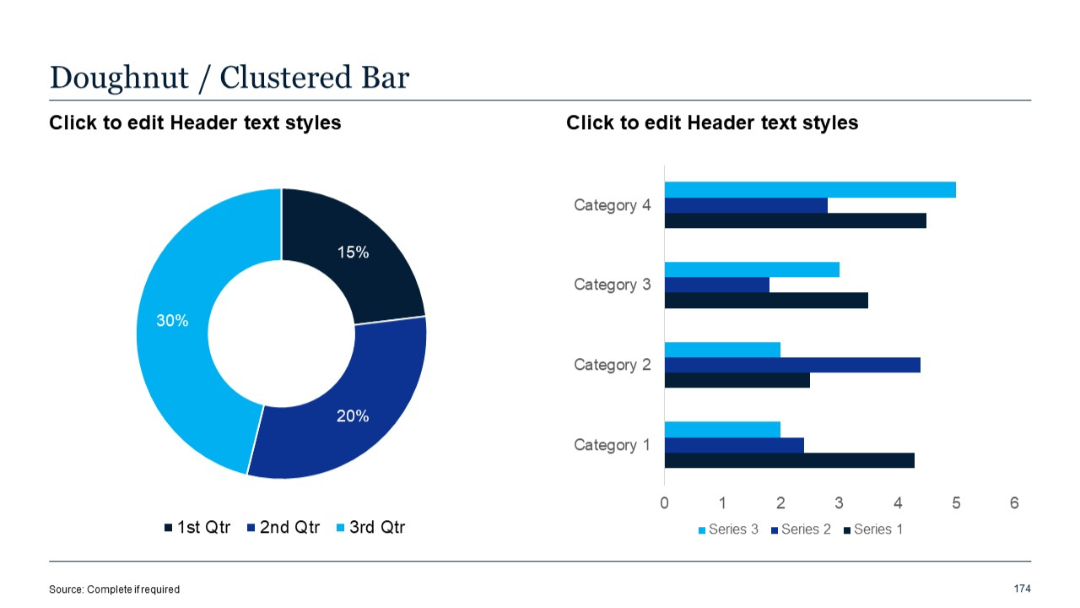
Left-aligned doughnut chart and right-aligned clustered horizontal bar chart with three series per category.
PRO
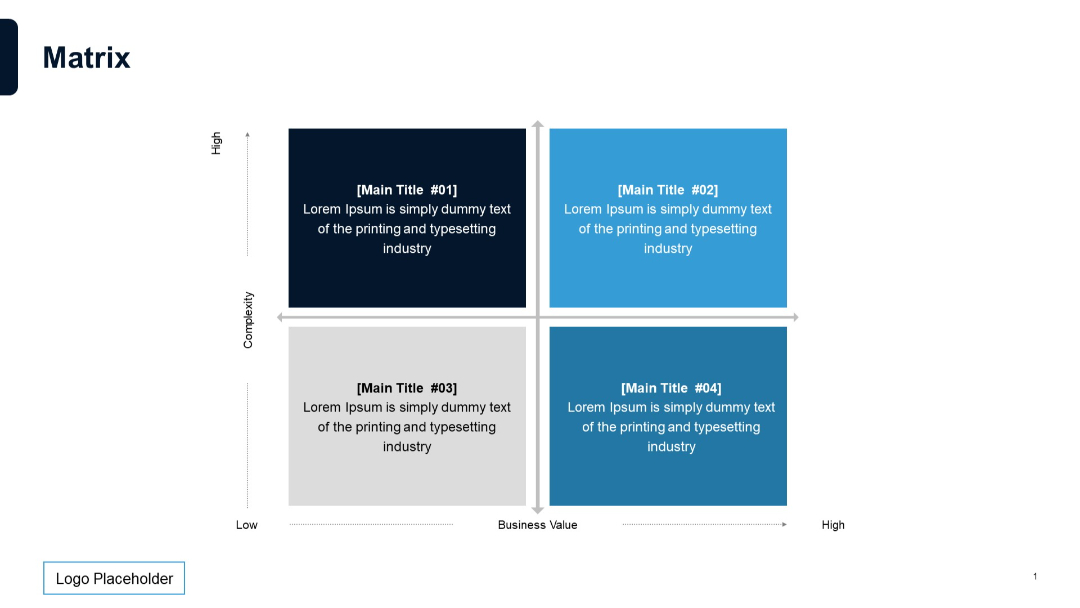
2x2 matrix layout with axis labels (Complexity vs. Business Value), quadrant blocks color-coded, each with title and description inside.
PRO
Four stat blocks, two rows; consistent blue tone; iconography included; white font on dark background with clear numeric highlights.

PRO
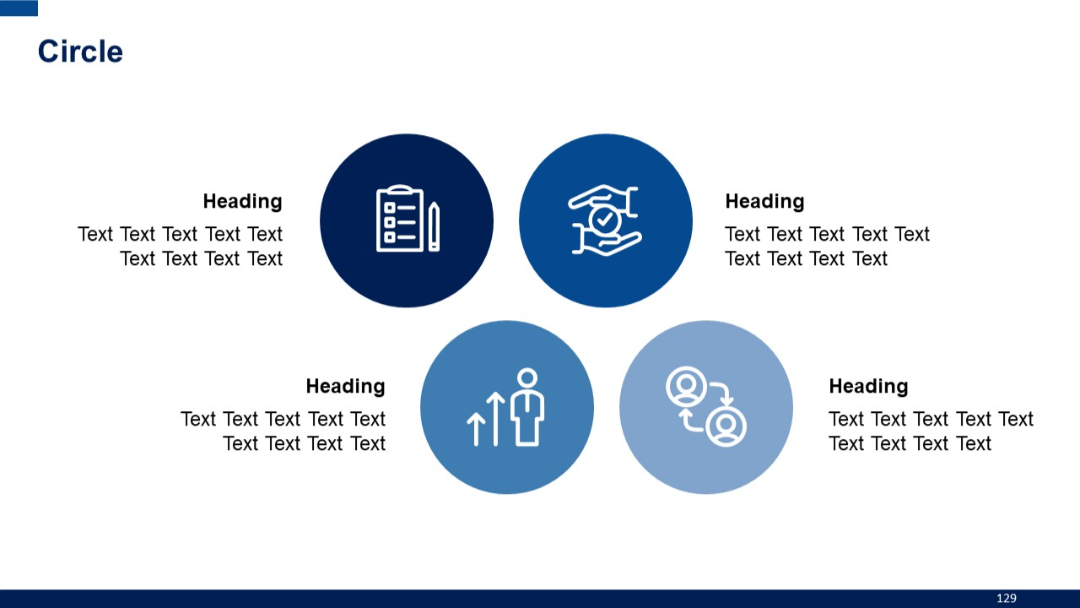
Five icons inside circular shapes arranged in a triangle pattern. Headings and short text surround each icon.
PRO
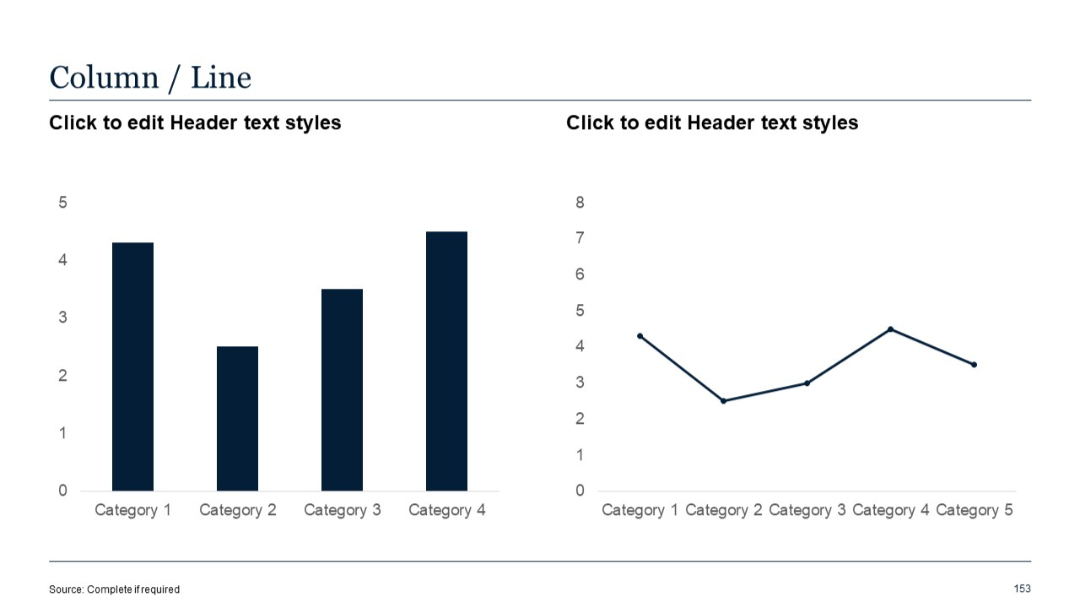
Left chart is vertical column bars; right chart is a line graph with five data points. Clean layout with axis labels.
PRO
Diagonal chain of four numbered diamond-shaped icons connected by arrows; each icon has editable labels and text on either side.
PRO
Four balloon-like circular icons in a cross formation with embedded icons and title text. Decorative lines connect the quadrants.
PRO
Horizontal clustered bar chart overlaid with a line graph; dual axis layout.

PRO
Eight-icon circular network with dotted lines; colorful visual balance with coding icon in center; bullets on the right.
PRO
Two-column layout with icon and text block on the left and text area on the right.
PRO
Numbered circular path from 1 to 5 in an arc. Icons and headings accompany each number.

PRO
Dark blue background with a structured two-column table listing digital challenges and corresponding solutions. Icons represent each solution, and a footer includes a performance improvement summary.

PRO
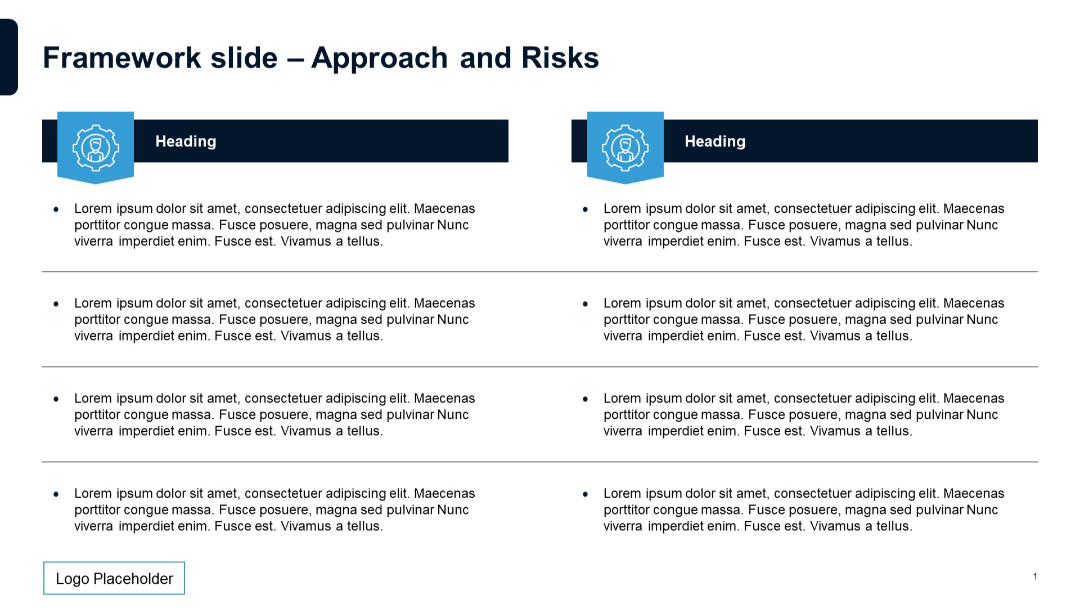
Two-column layout with icons and headers, followed by bulleted text rows separated by lines.
PRO
Centralized dark header bar followed by six content boxes (3x2) with numbered red blocks on left and right ends.
PRO
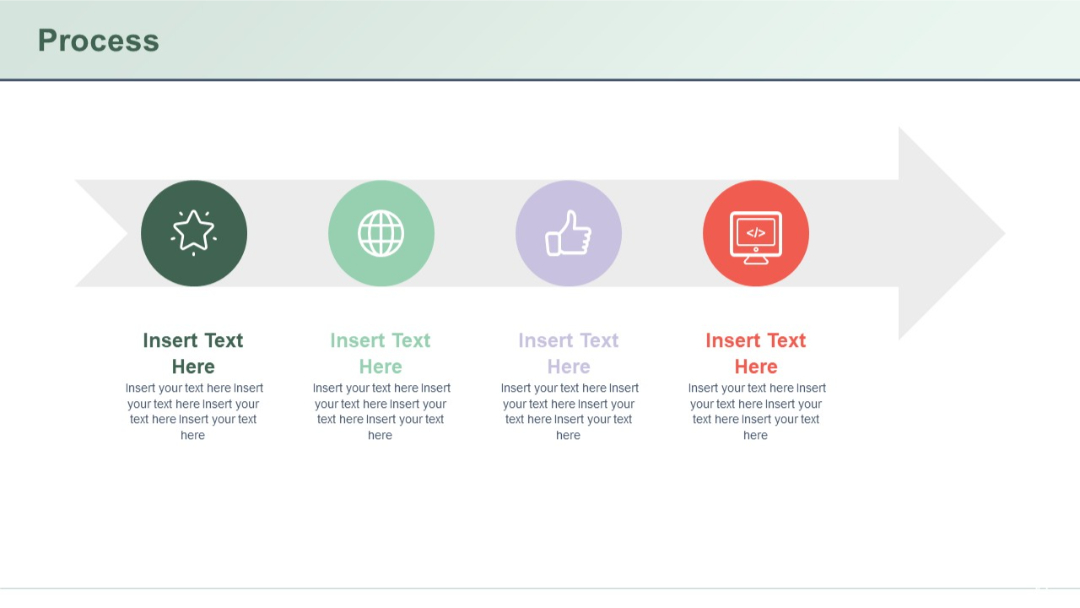
Horizontal arrow background with four circular icons overlayed, each representing a different step.
PRO
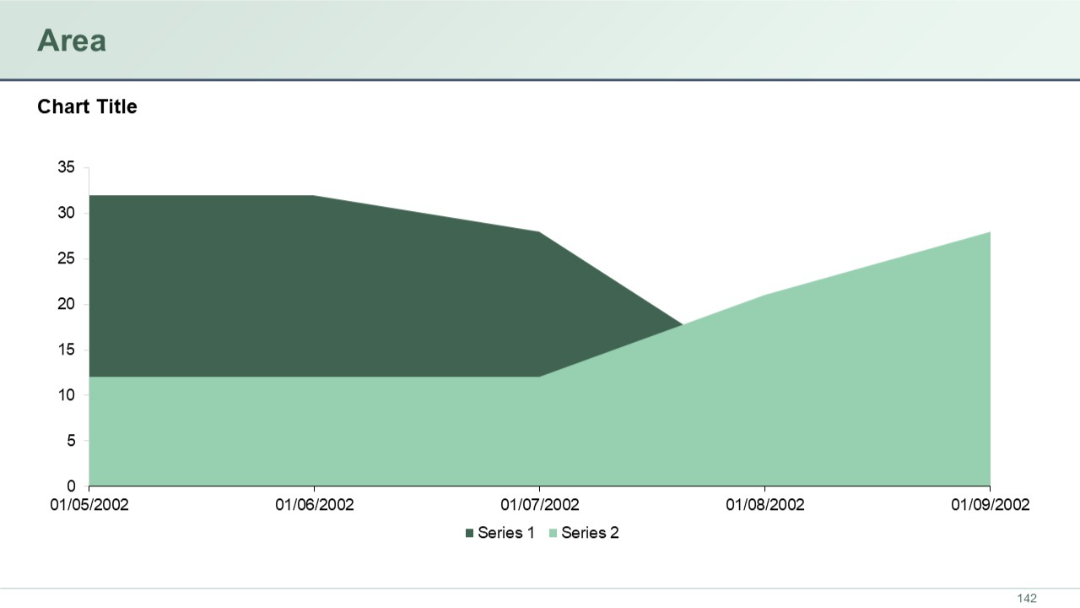
A simple stacked area chart with two data series, using dark green and light green colors, charting values over time with dates as the X-axis labels.
PRO
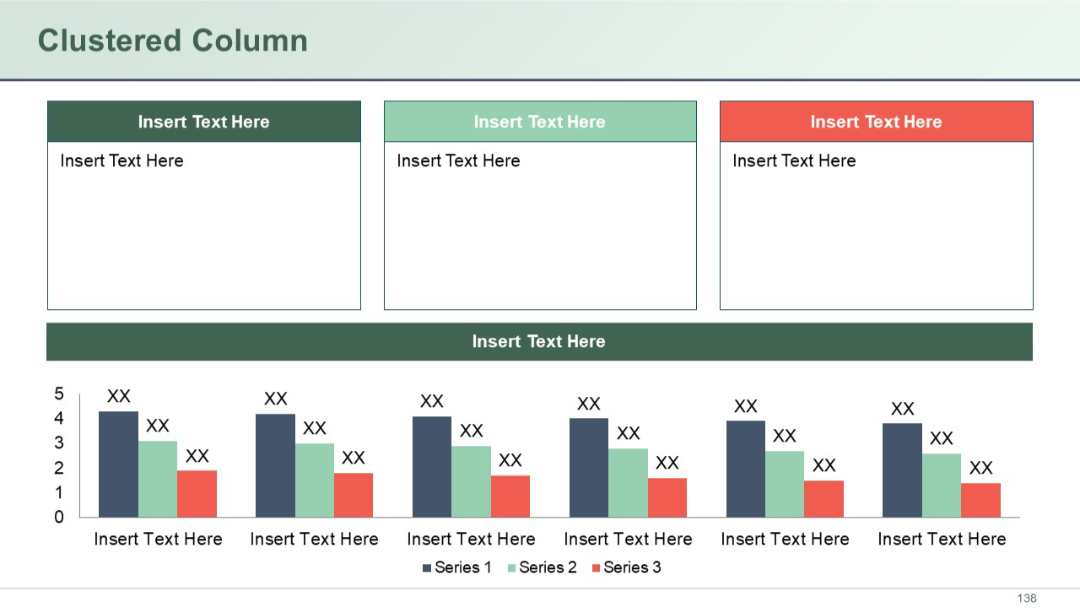
Three large colored boxes on top with text areas, followed by a full-width header, and a clustered column chart beneath.
PRO
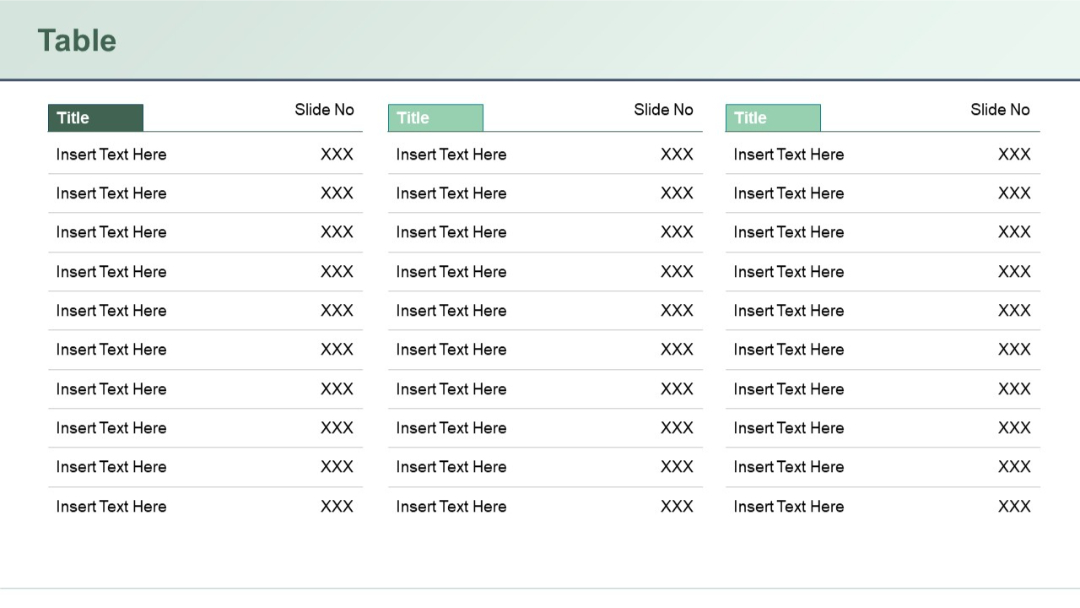
Three-column table layout repeated in three vertical sections. Each column has a "Title" header and rows with placeholder text entries labeled “Insert Text Here.”
PRO
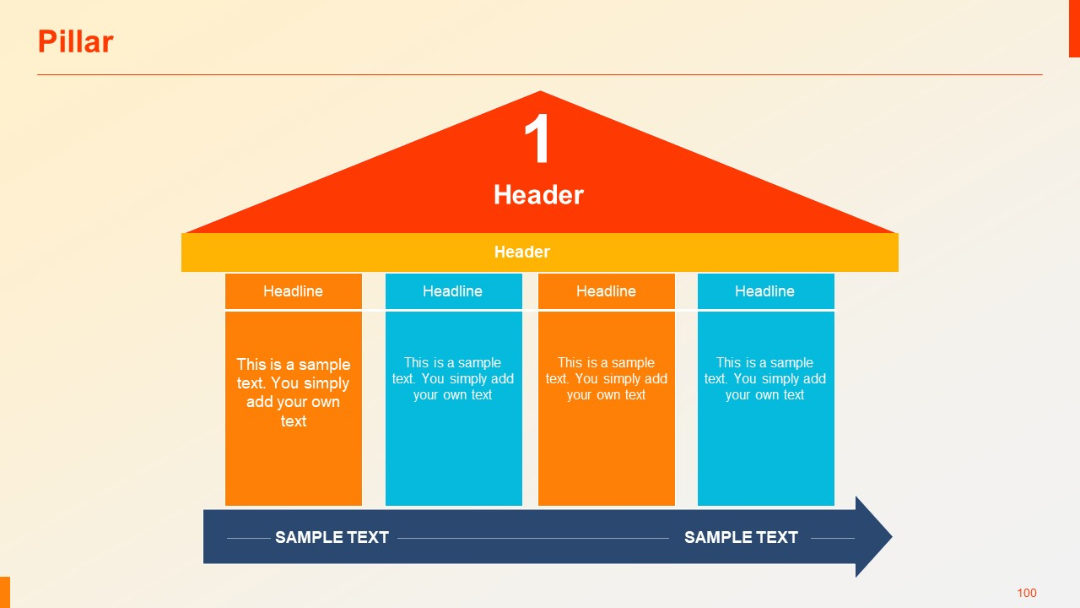
Stylized building structure with one triangular roof over four vertical columns, each column containing a headline and sample text.
PRO
Magnifying glass icon on the left; large content box on the right with a green top header labeled "Title" and placeholder text beneath.
PRO
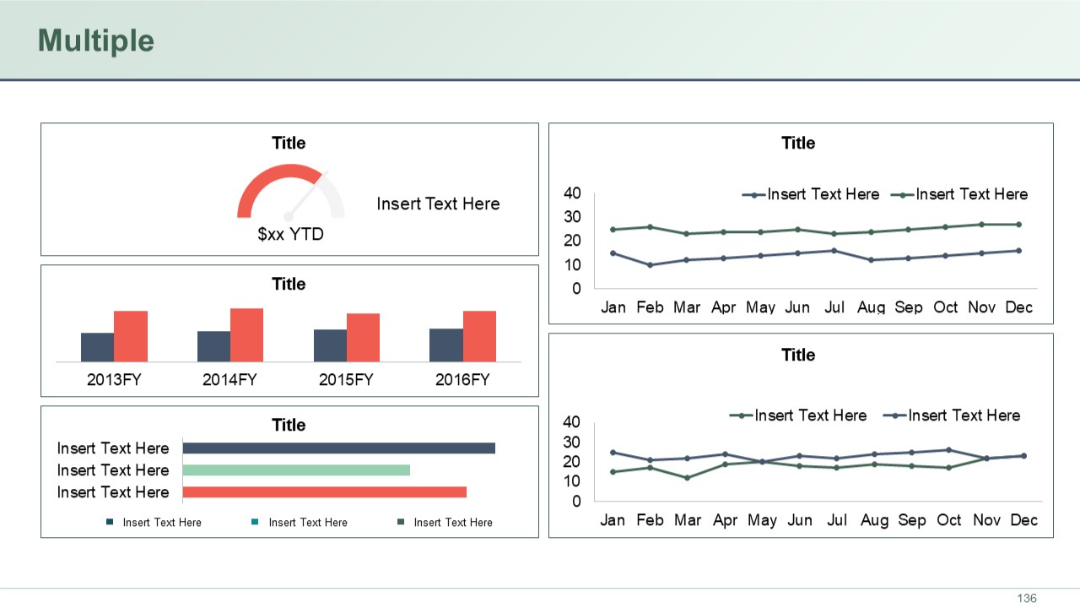
Dashboard layout with various chart types (gauge, bar, line) arranged in grid. Multiple KPIs and trends visualized in distinct panels.
PRO
Matrix chart with quadrant analysis and right-aligned explanatory text. Dark theme with bold white and blue text.