PRO
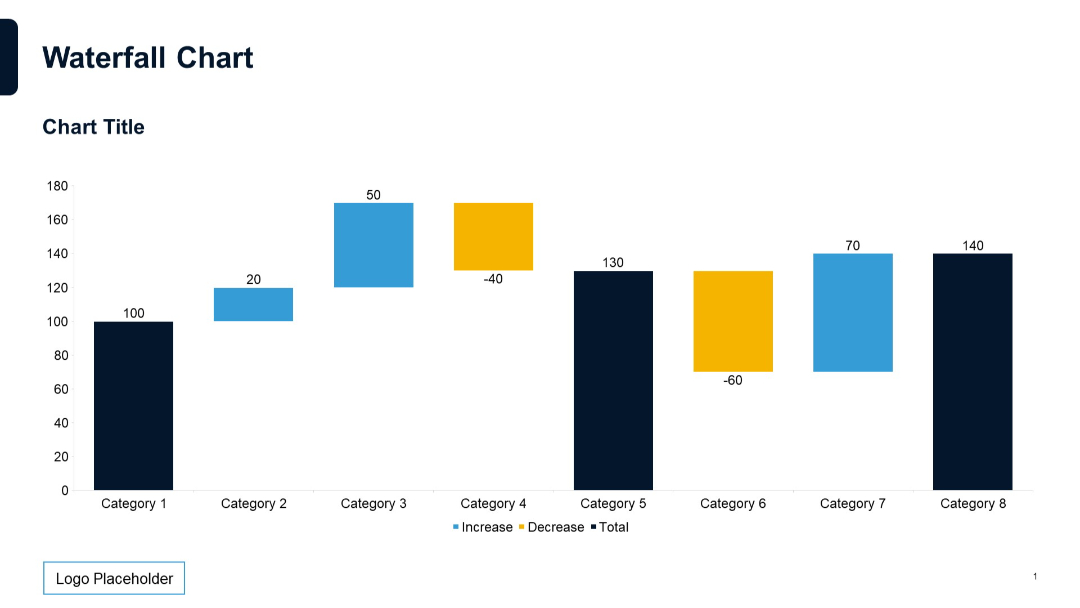
Horizontal waterfall chart with color-coded bars (increase, decrease, total), legend and category labels, clean layout with no gridlines.
PRO
Title-only slide with section number and bold heading. Minimalist layout with diagonal accent lines in background.

PRO
Curved vertical timeline with circular nodes and lines connecting four titled segments. Gradient fill and bold colors are used.
PRO
Three tall rectangular columns labeled 30, 60, and 90 Day, each with walking/running icons.

PRO
Circular infographic with four surrounding icons and text, evenly spaced in a balanced radial layout.

PRO
Triangular layout with three text blocks and icons. One icon at top, two at bottom corners, forming a triangular structure around a central shape.
PRO
Split layout with a green gradient upper half and white bottom half. Minimalistic and number-labeled.

PRO
Enhanced version with five colored product columns vs single feature list. Uniform check/cross layout and action buttons.
PRO
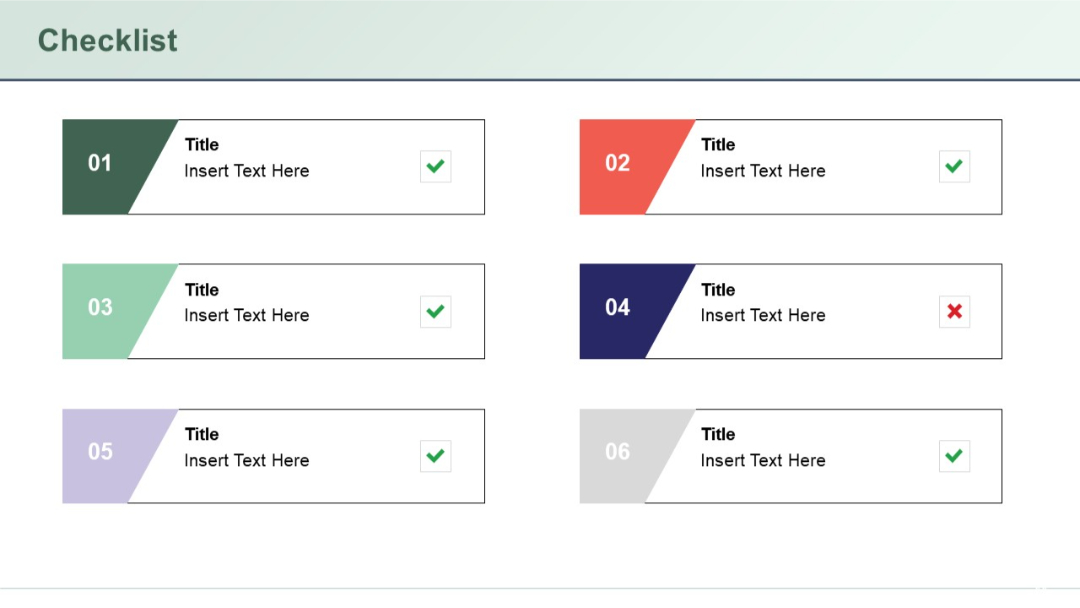
Two-column layout with six colored checklist blocks numbered 01–06, each with a title, description placeholder, and check or cross icon on the right.
PRO
Horizontal sequence of four colored squares connected by black chevron arrows.
PRO
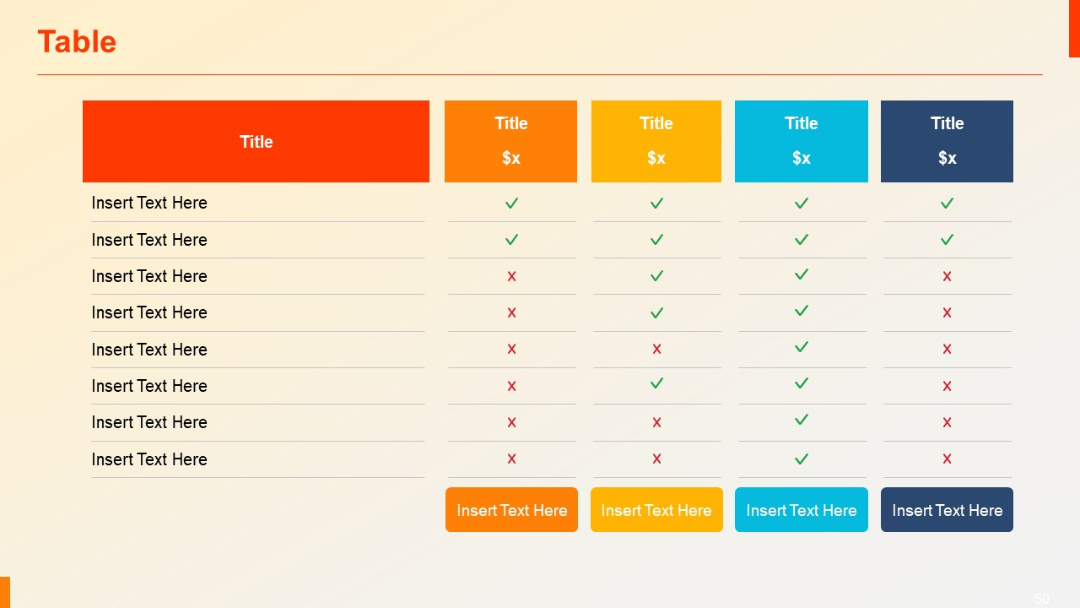
A six-column horizontal comparison table with alternating header colors; checkmarks and crosses used for quick visual comparison.
PRO
Split layout with two text columns, each containing bullet points and bold headings. Balanced visual distribution.
PRO
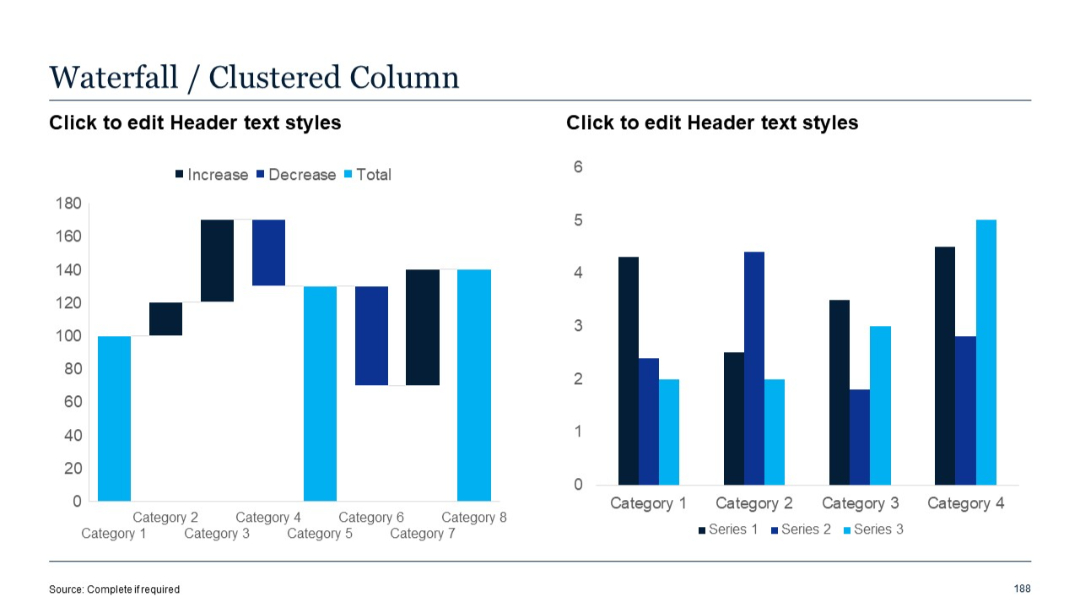
Left chart is a waterfall; right chart is a clustered column bar showing three data series for each category.
PRO
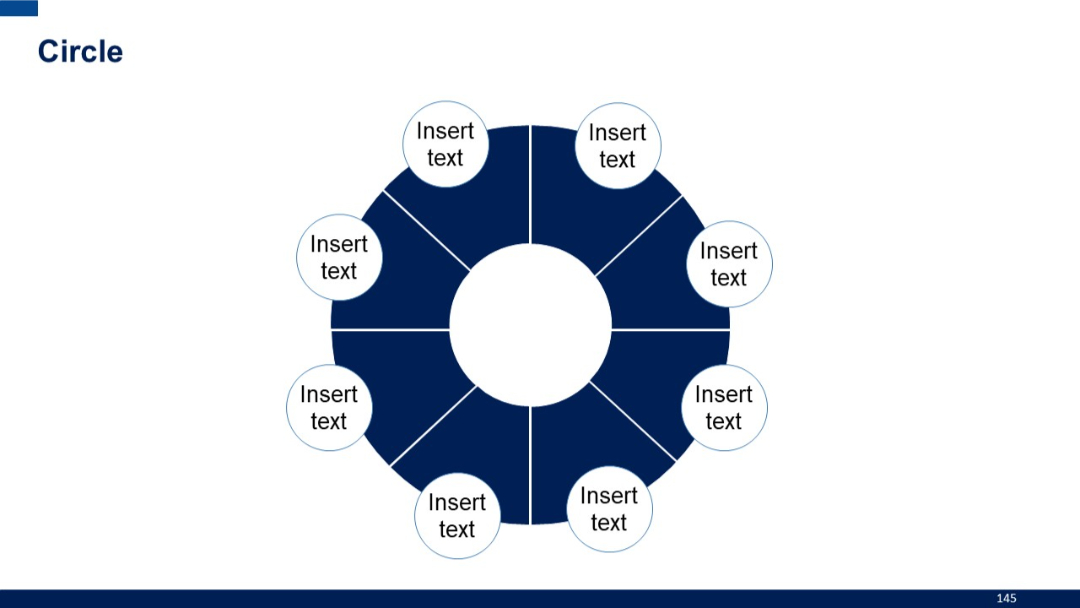
A circular process broken into 8 sections with circular labels attached to each. Uniform, segmented layout in dark blue tones.
PRO
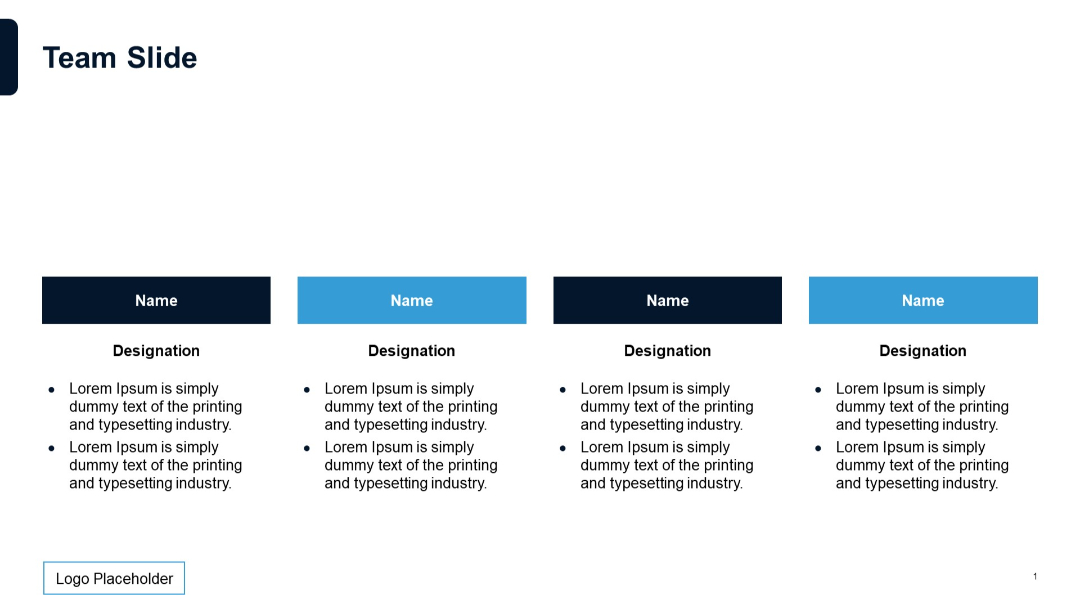
Four-column layout with rectangular blocks showing names, designations, and short descriptive bullet points; alternating color blocks (dark/light).
PRO
Line chart on the left and horizontal bar chart on the right, both using the same categorical data. Equal spacing and balanced format.

PRO
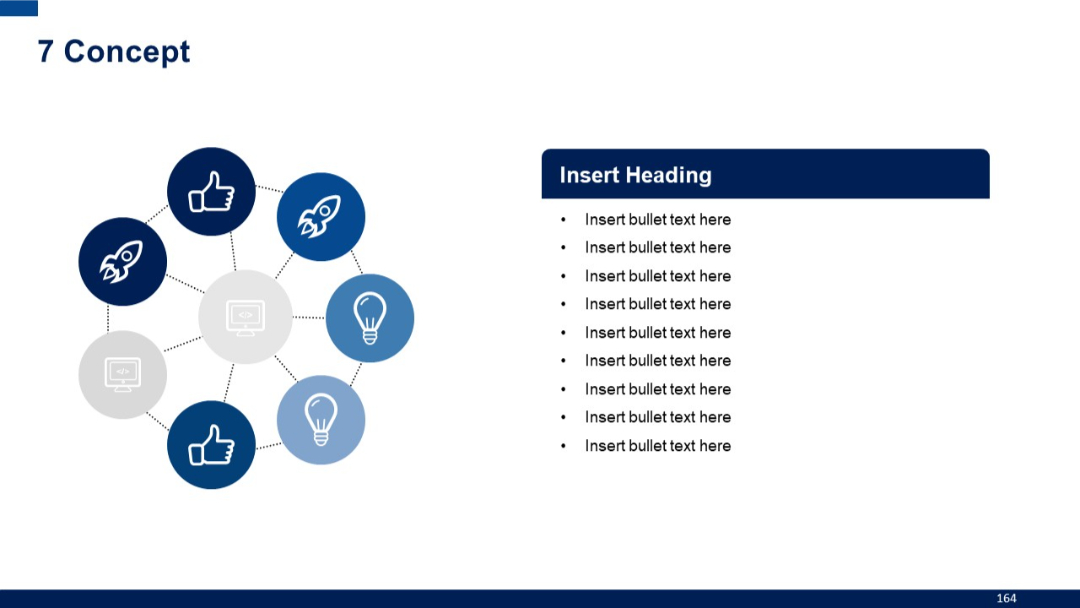
Expanded circular network with eight icons, maintaining full connectivity. Icons are increasingly diversified (lightbulb, rocket, thumbs-up).
PRO
Slide master layout with placeholder for logo at top left; large editable title and subtitle fields on a dark blue wave-themed background.

PRO
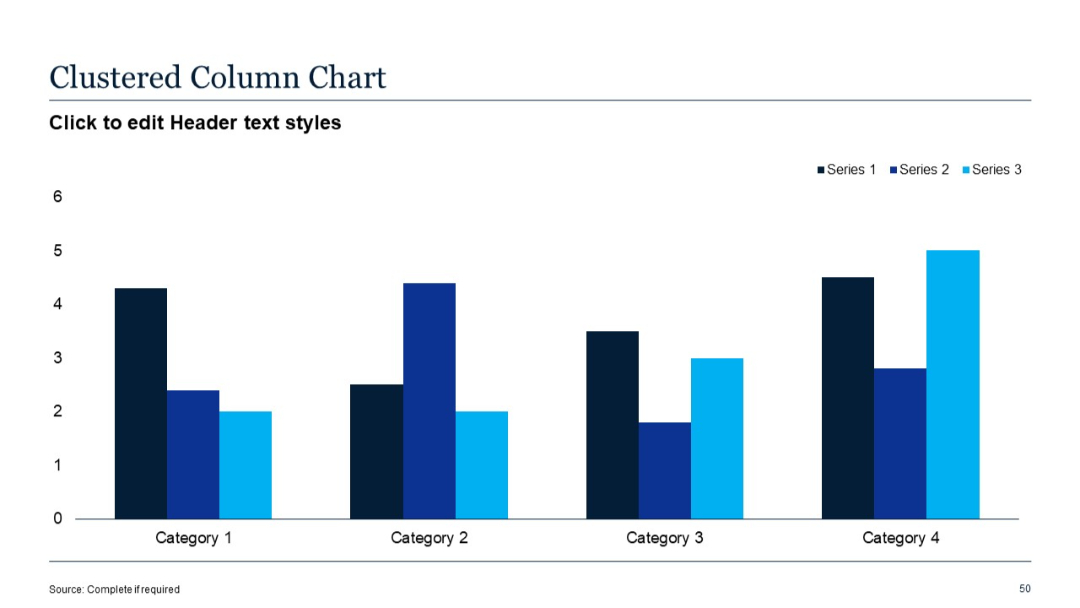
Clustered vertical bar chart with three data series shown across four categories. Each category contains grouped bars in different shades of blue.
PRO
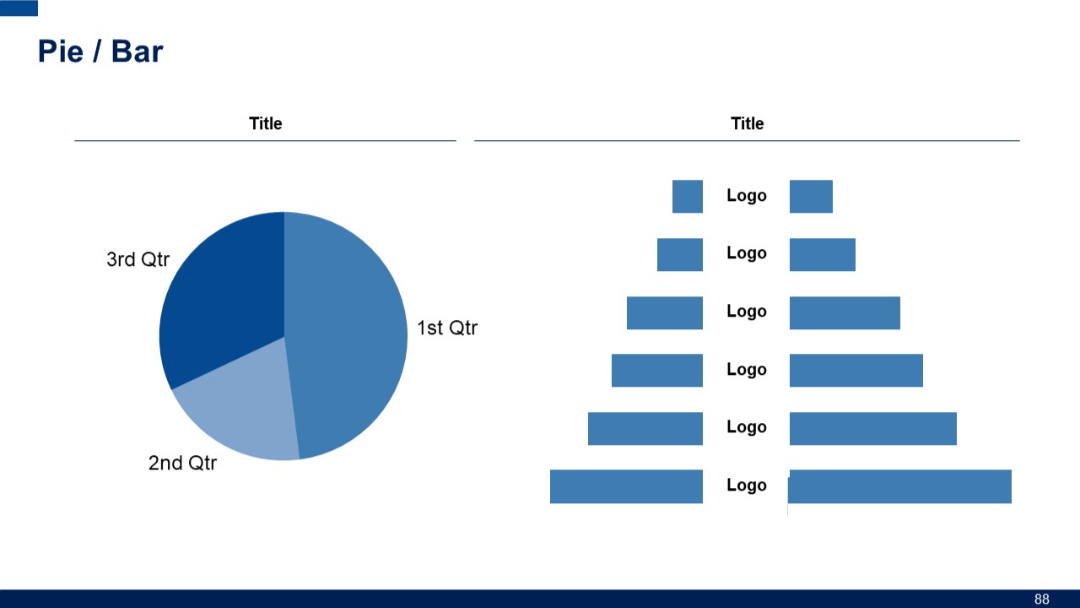
Left: Pie chart with three segments labeled by quarter. Right: Pyramid-like bar chart showing bars with logos, decreasing in width as they go up.
PRO
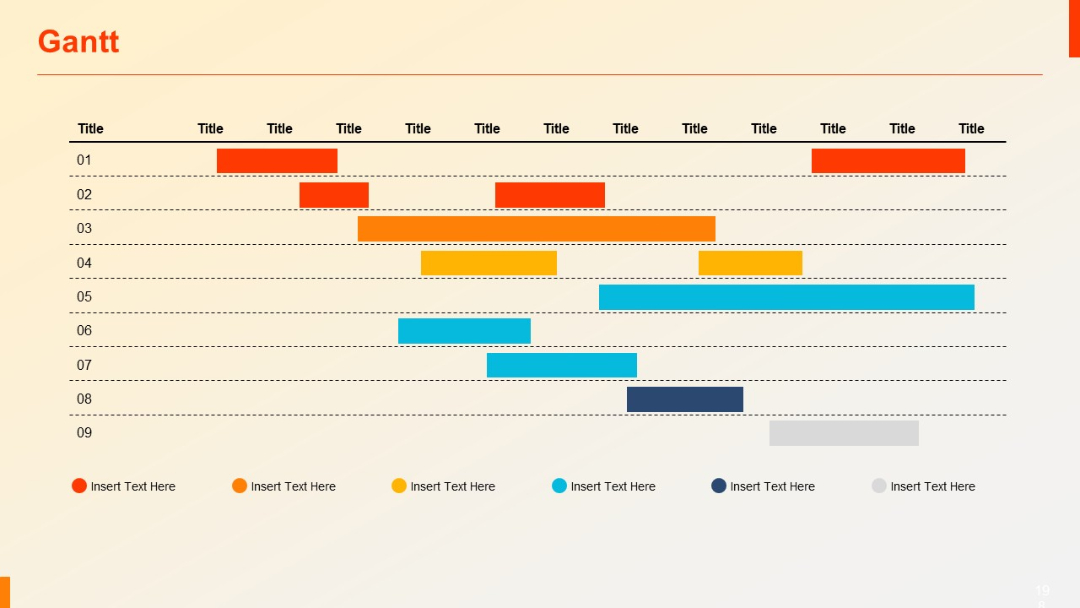
Detailed Gantt chart with nine rows and multiple color-coded bars; includes legend and grid lines.
PRO
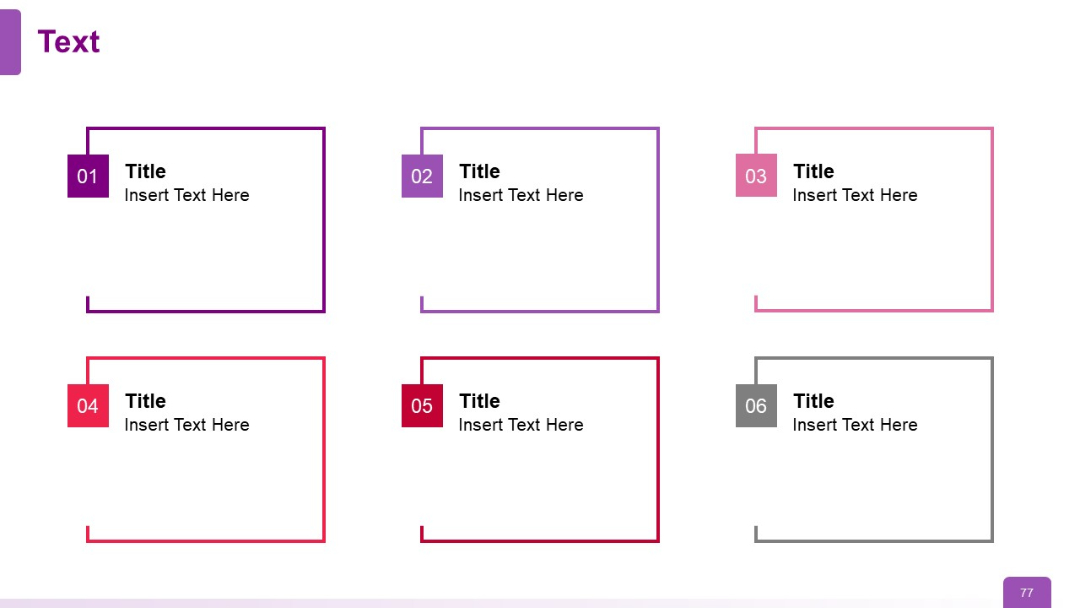
Six framed text boxes with colored corners labeled 01–06, arranged in a grid. Each box includes a bold title and description text.
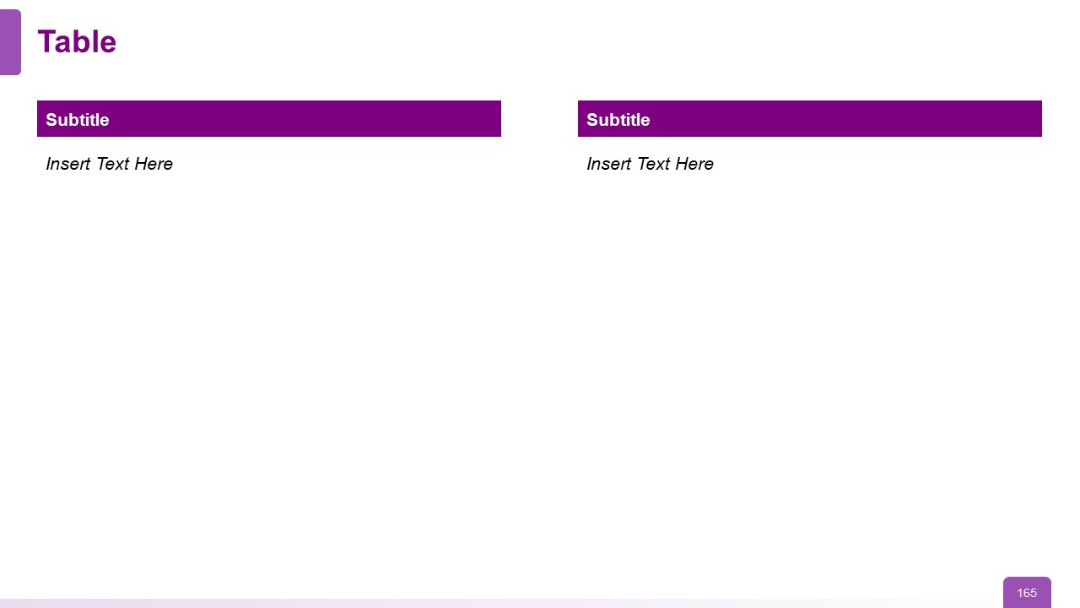
PRO
Two-column layout with bold subtitle headers, each in a purple bar, and placeholder text below; simple and symmetrical.
PRO
Vertical timeline with gear/checkmark icons on the left and corresponding bullet text items aligned to the right.

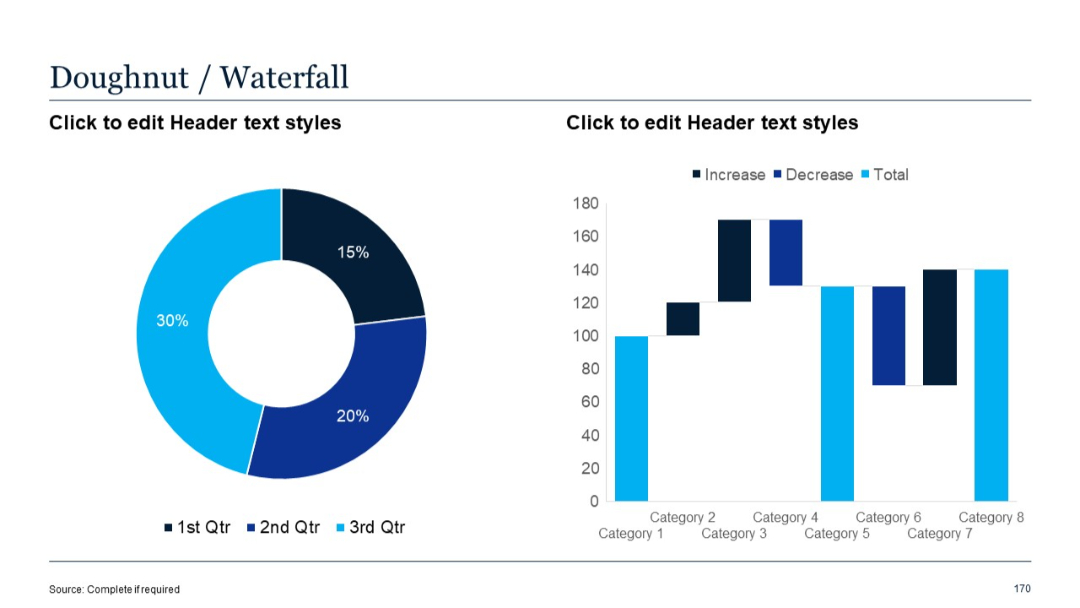
PRO
Doughnut chart paired with a waterfall chart showing increases, decreases, and totals over eight categories.
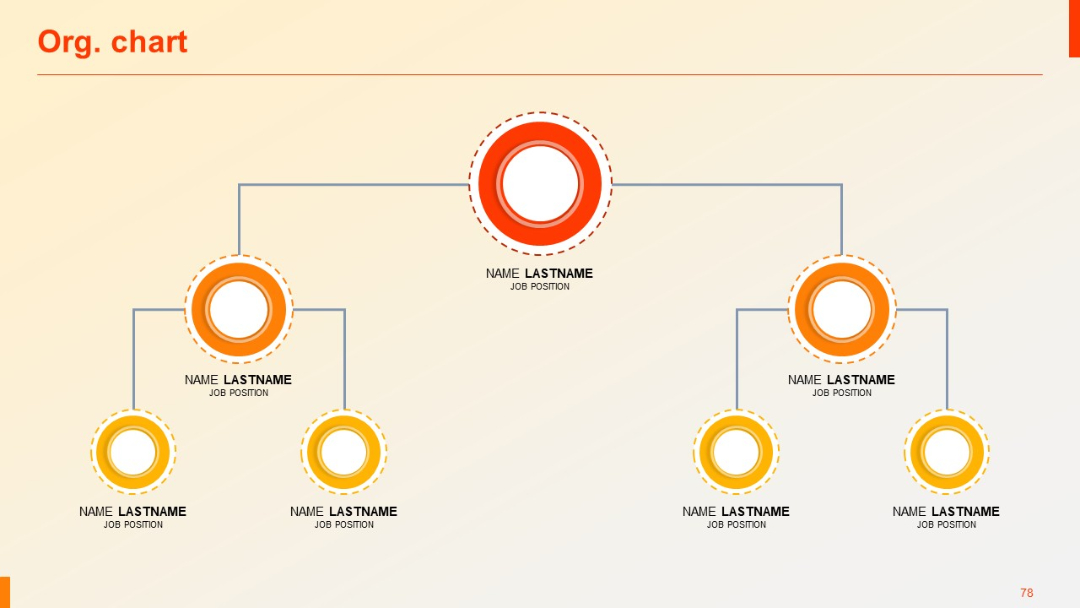
PRO
Classic vertical org chart with circular nodes and job titles, top-down reporting structure.
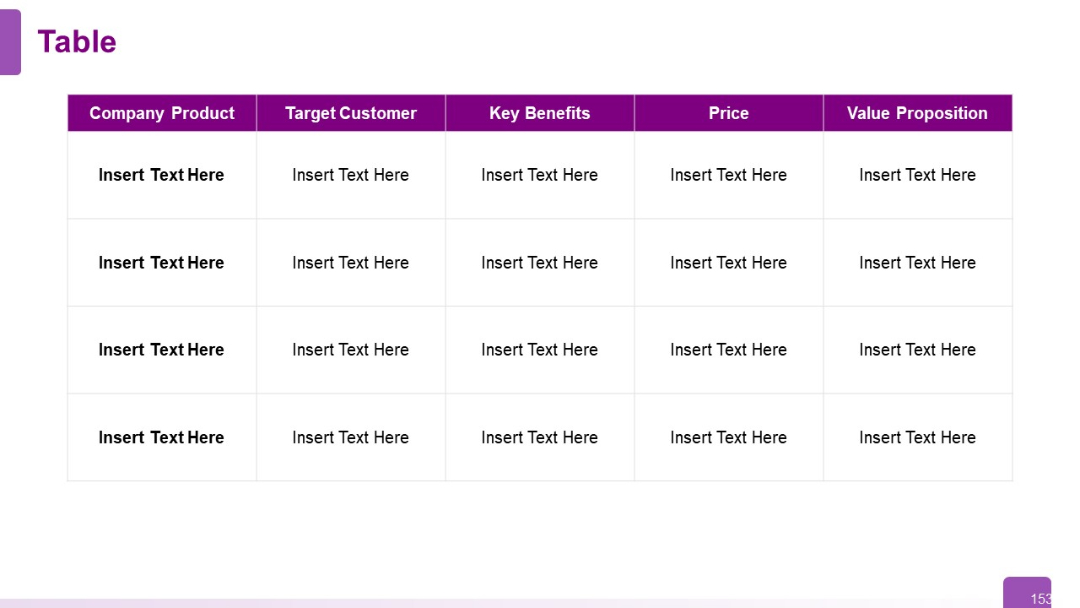
PRO
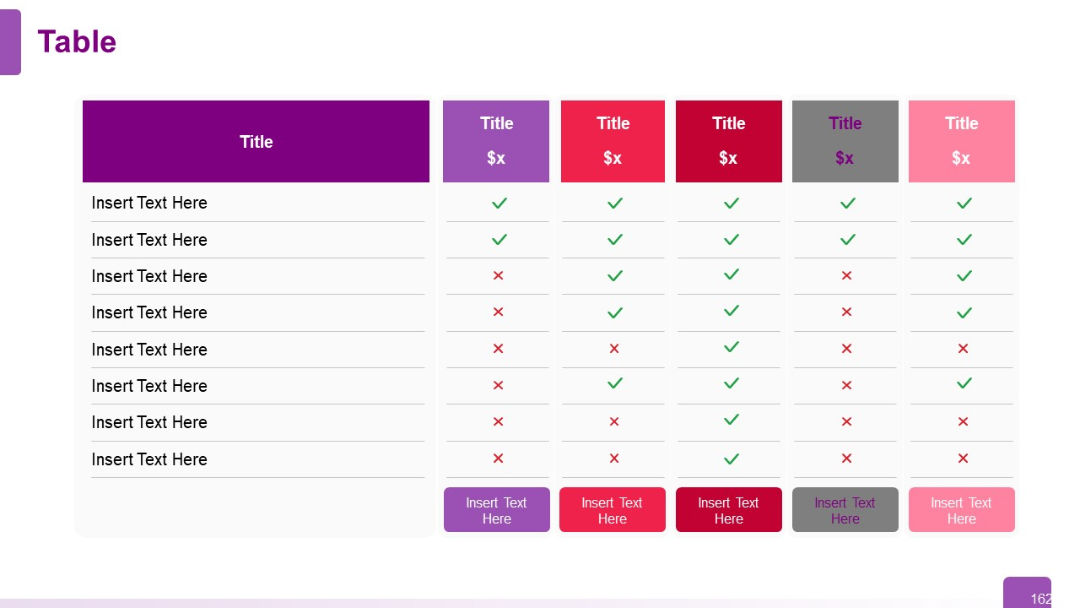
Same structure as previous, expanded to five rows for more product comparisons. Purple header row and structured grid format.
PRO
Four-step horizontal layout with numbered circular endpoints and left-aligned text. Each row uses dotted lines with different shades of purple/red.

PRO
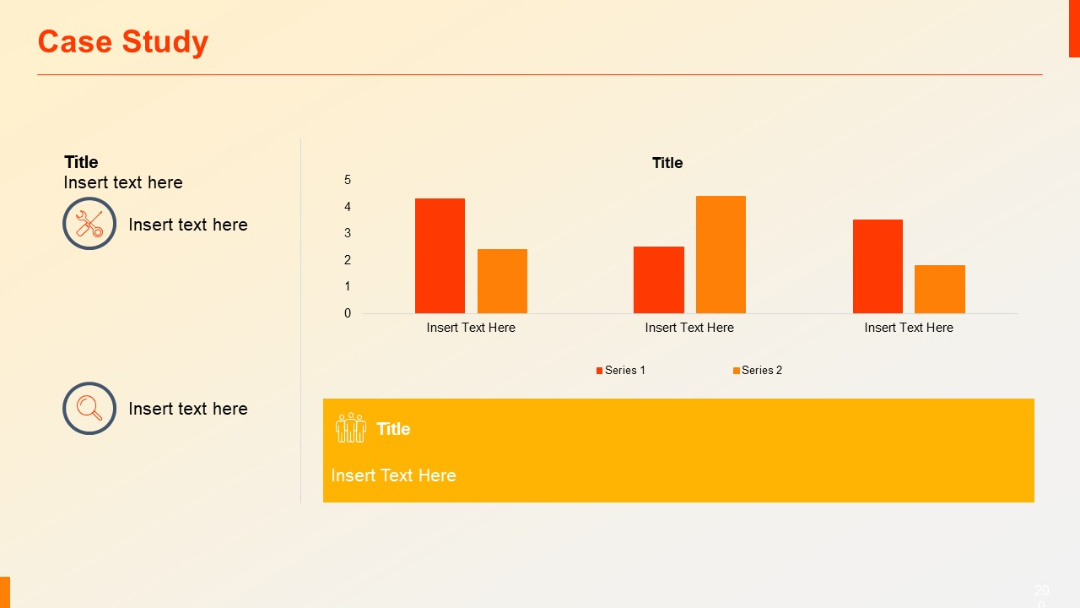
Left pane includes icons with text, right pane displays a bar chart and highlighted section below.
PRO
White background with dark diagonal geometric shapes on the left; centered title text and logo at bottom left.