PRO
Four square quote blocks arranged in a 2x2 grid; each block uses quotation mark icons and placeholders for text.
PRO
Vertical list layout with three quote sections. Each has a speaker icon on the left followed by space for text and a thin horizontal line guiding the eye.
PRO
Six-pointed star layout with matching headers and icons surrounding a central shape. Text sections aligned with each icon.
PRO
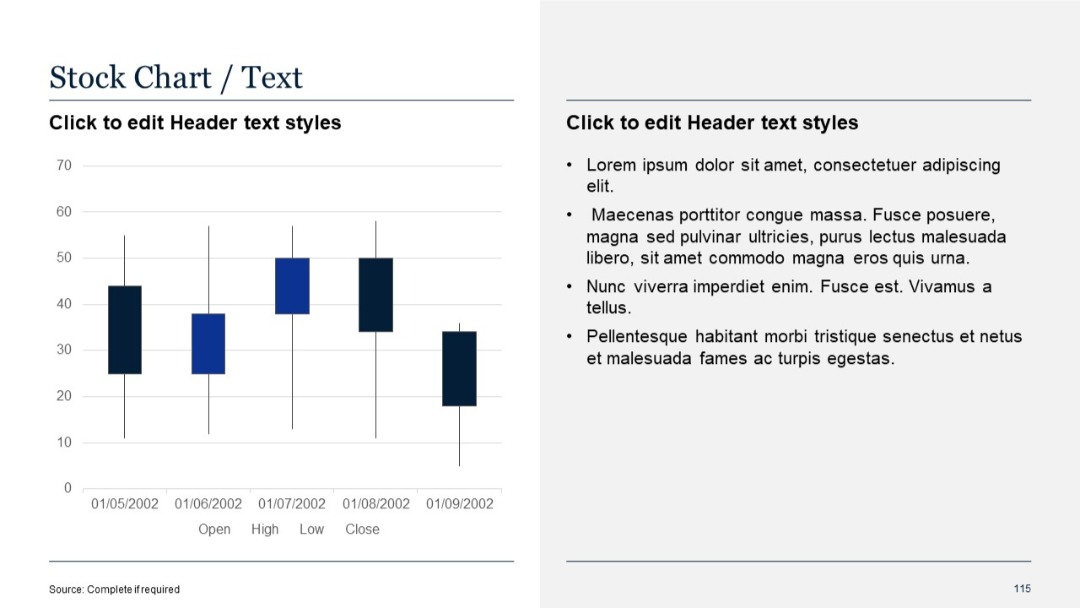
Left side includes candlestick stock chart over time; right contains placeholder bullet text.
PRO
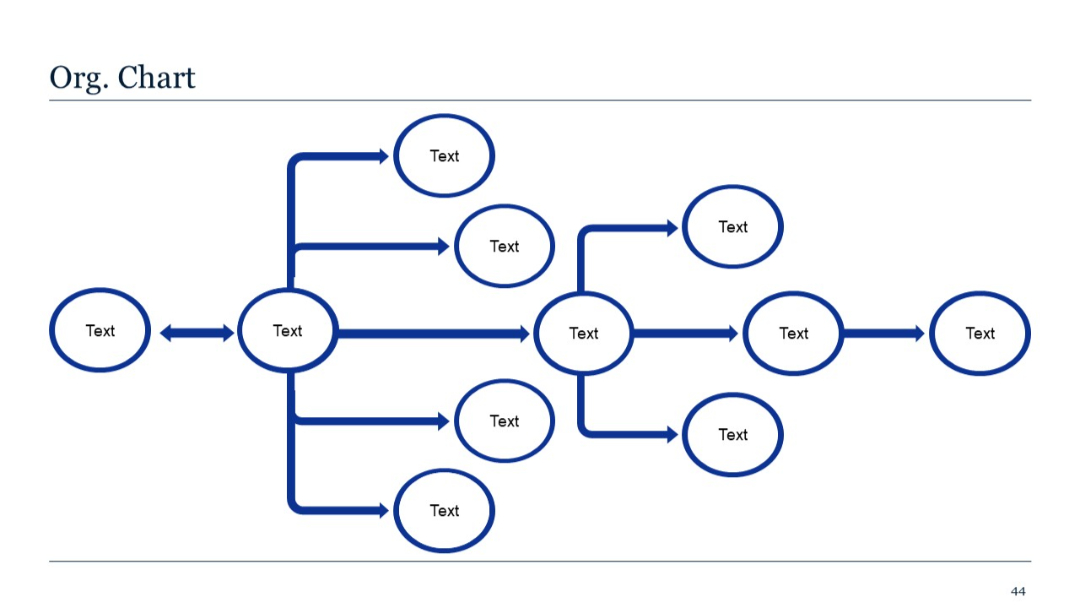
Flowchart-style org chart using ovals connected with arrows, branching horizontally and vertically. Circles contain placeholder "Text".
PRO
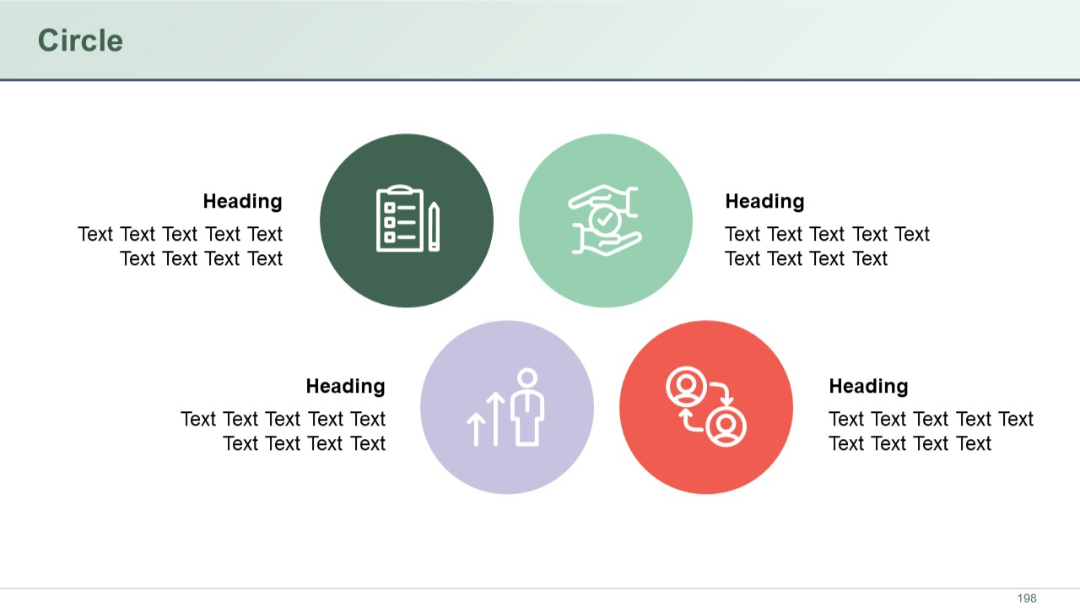
Five circle icons arranged in a symmetric cluster. Headings and text paired with each icon.
PRO
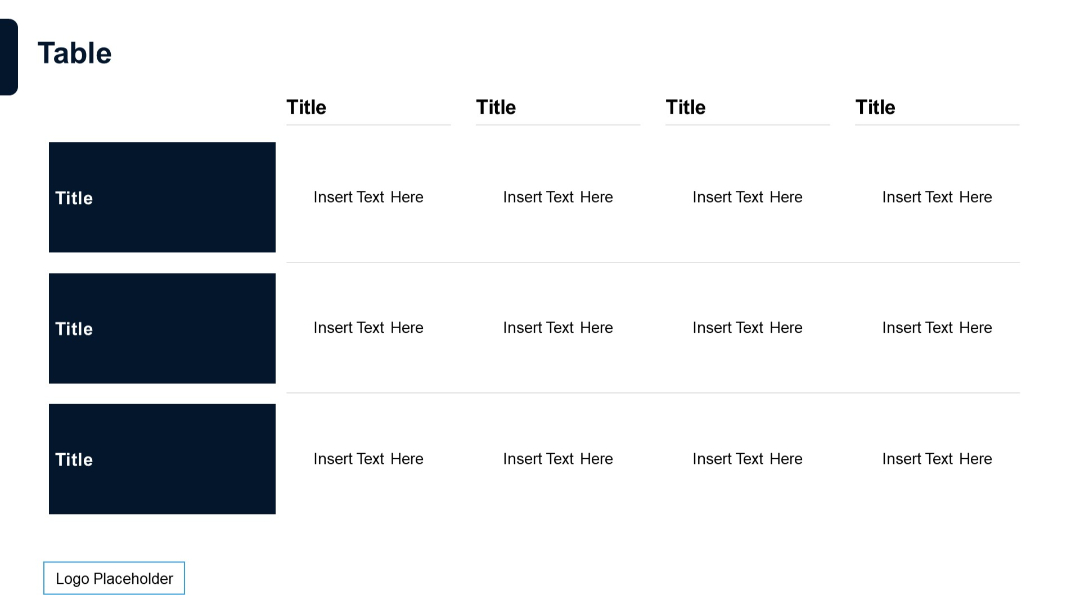
Matrix layout with 3 rows and 4 columns; bold titles on left; top row headers; alternating white rows; logo bottom left.
PRO
Two-column comparison layout with bullet lists under arrow-shaped headers pointing inward; a large red question mark icon centered between them.
PRO
A three-column layout with a purple left sidebar (icon and text), and two main content areas in white and gray, each containing bulleted list placeholders.
PRO
Circular loop with four curved arrows forming a cycle around a central "Header" circle; outer segments with text.
PRO
Three clustered vertical bars in four categories; warm gradient color palette; light beige background.

PRO
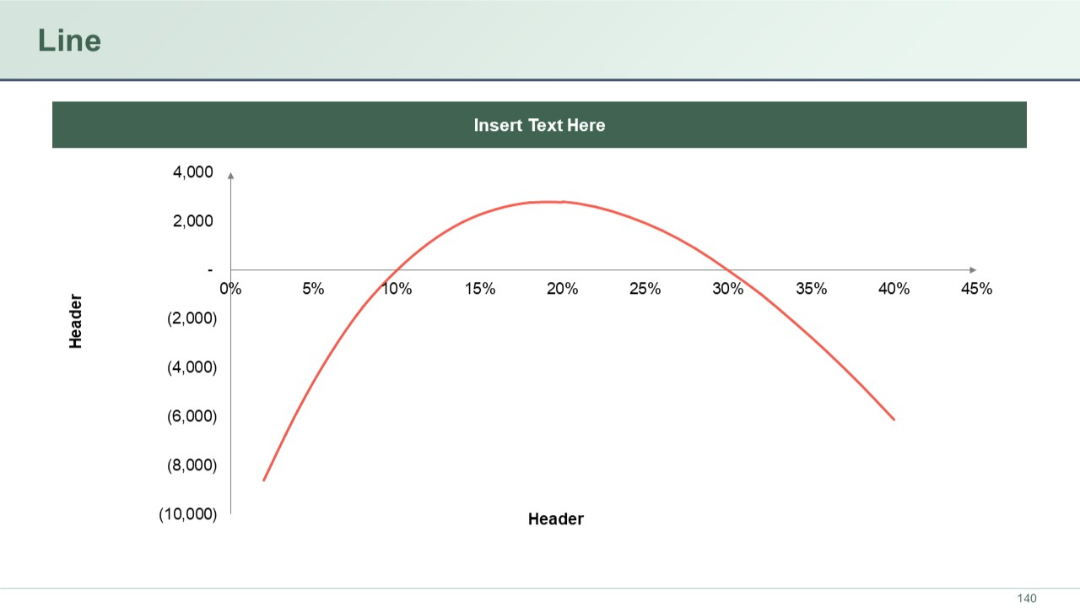
Single curved line chart showing trend along a horizontal percentage axis with vertical value labels. Dark green title bar at the top.
PRO
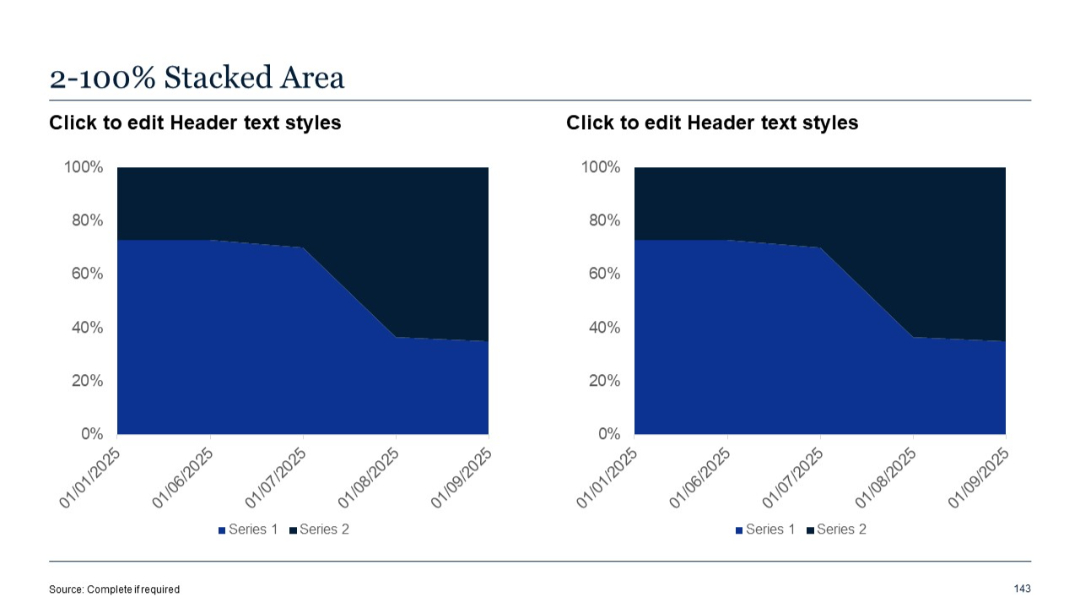
Dual 100% stacked area charts displayed side-by-side. Percentages on y-axis highlight proportional changes over time.
PRO
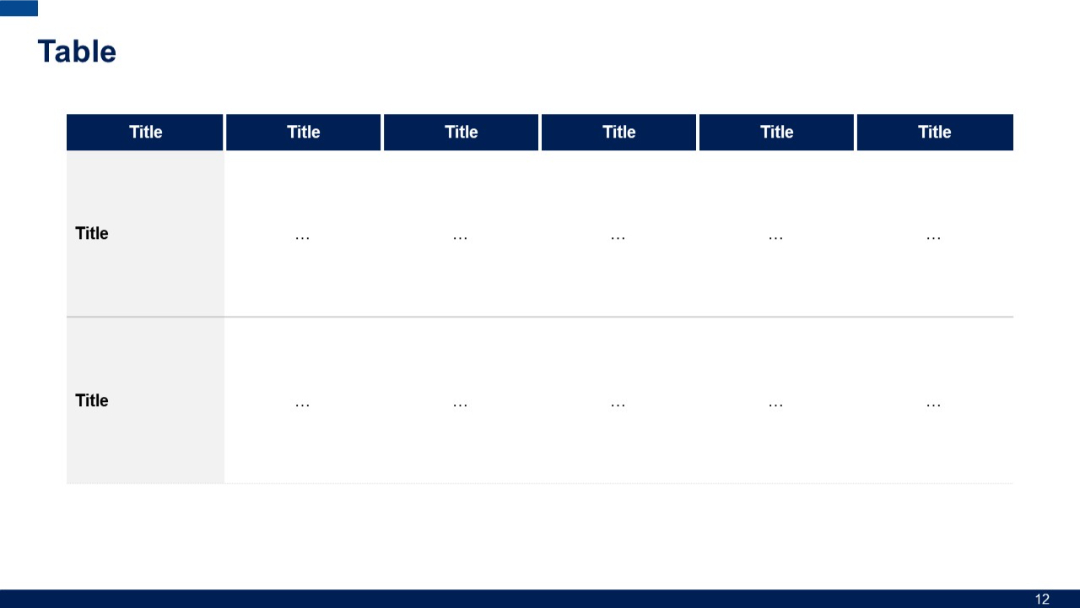
A horizontal table with a top header row in blue and two data rows. Leftmost column is wider for row titles. Grid lines separate sections.
PRO
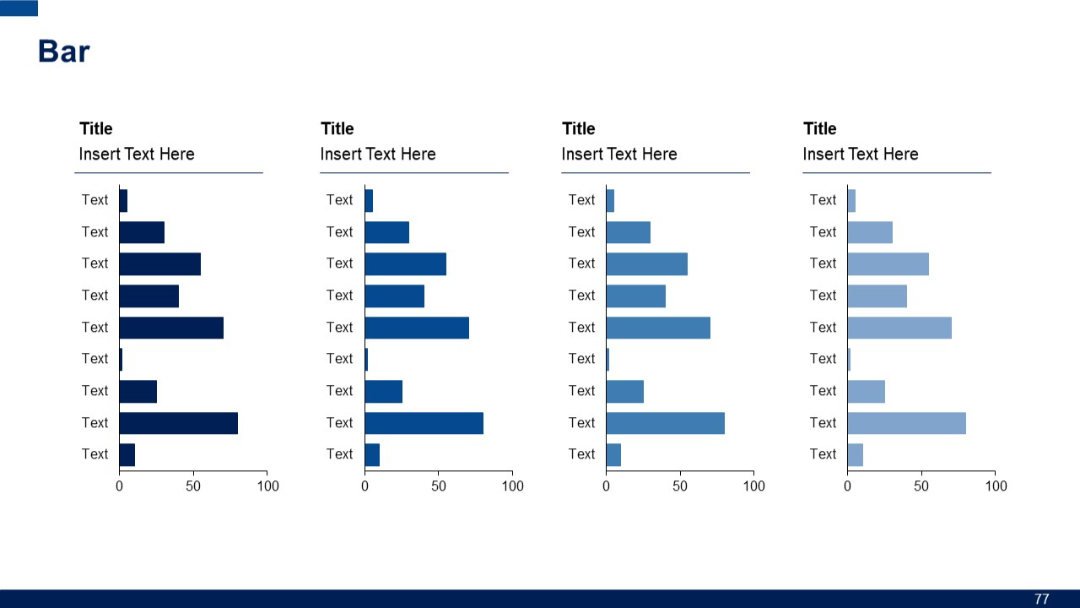
Four grouped vertical bar charts with mirrored labels. Each group has its own title and placeholder text beside it.
PRO
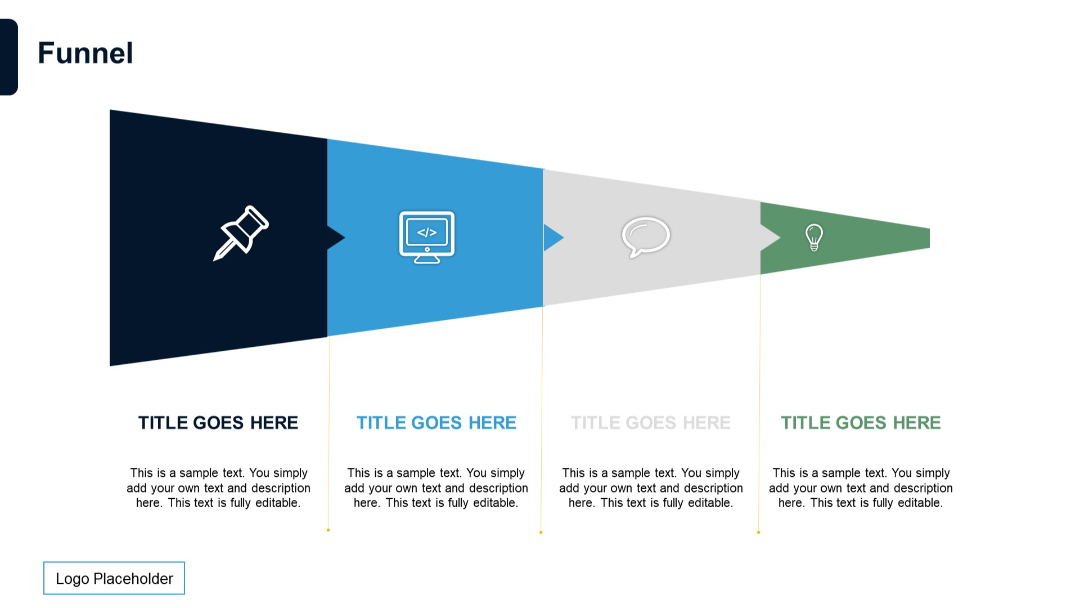
Horizontally aligned, multi-stage funnel with chevron arrows for each step. Color-coded stages with icons and explanatory text beneath.
PRO
White background with evenly spaced purple outline icons, all magnifying glass or research-related graphics arranged in a clean 4x6 grid.
PRO
Clustered column chart (4 categories) with percentage labels above each series. Minimalist layout focused on comparing percentages.

PRO
Curved vertical timeline on the left with four colored circular nodes and matching horizontal text entries on the right.
PRO
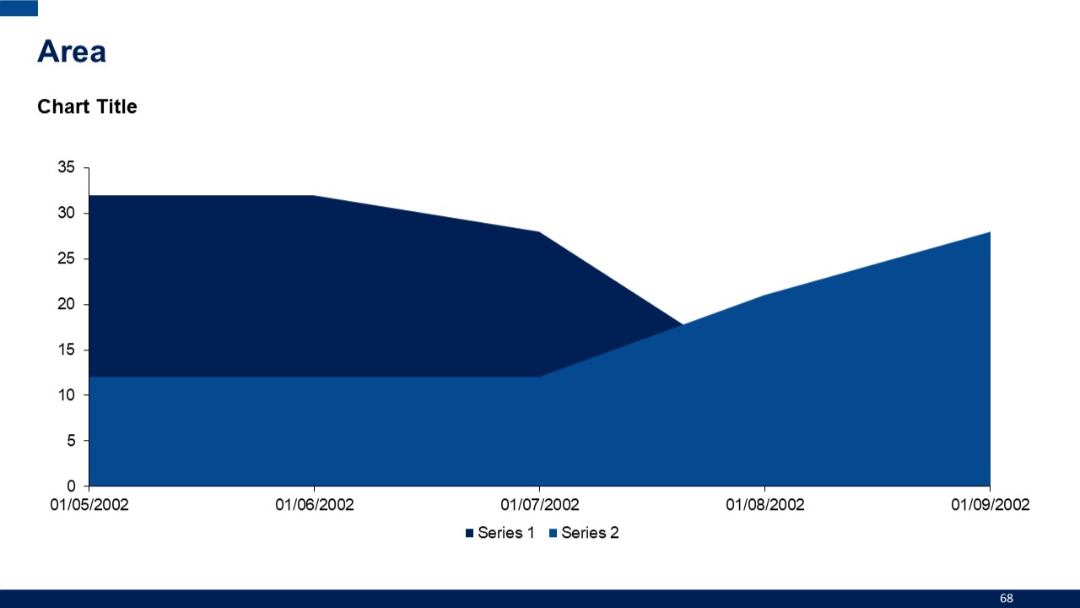
Area chart with two stacked segments (Series 1 and Series 2). Blue tones with a date-based x-axis and values on the y-axis.
PRO
Minimalist layout with two text boxes (subtitles) on either side of a blank white canvas; very basic structure.
PRO
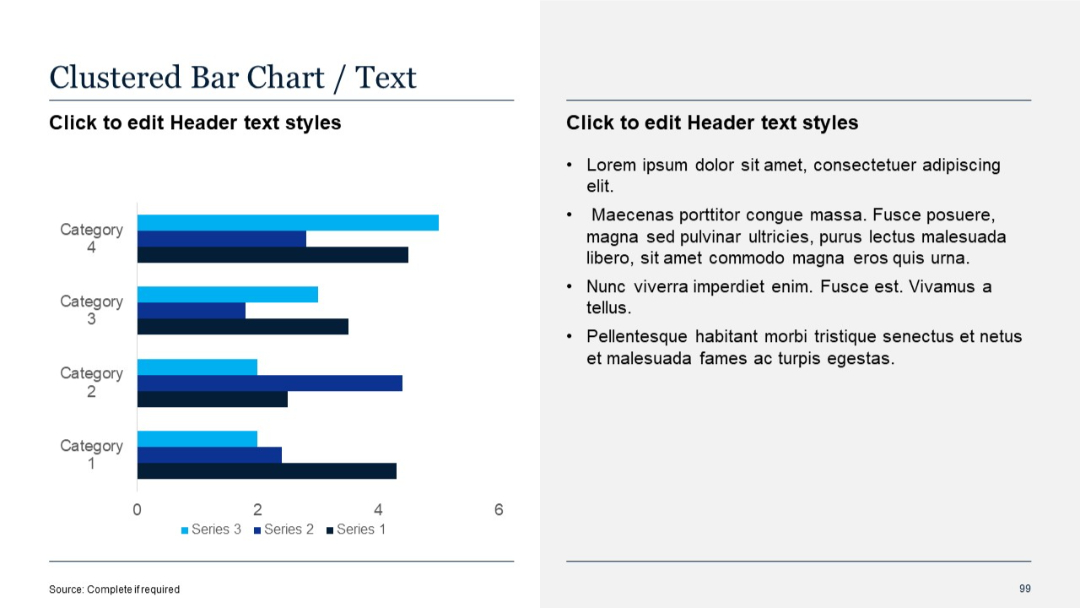
Clustered bar chart with three series per category; sidebar with bullet text.
PRO
Balanced 3x2 grid plus one bottom-right block; uses consistent icon set and blue highlight colors; numbered flow.

PRO
Four circle icons with device illustrations and corresponding text. Distributed across two rows in a grid format. Simple and minimal.
PRO
Three stacked segments labeled Vision, Mission, and Goals with icons on the left and text blocks on the right. Pastel colors create soft contrast.
PRO
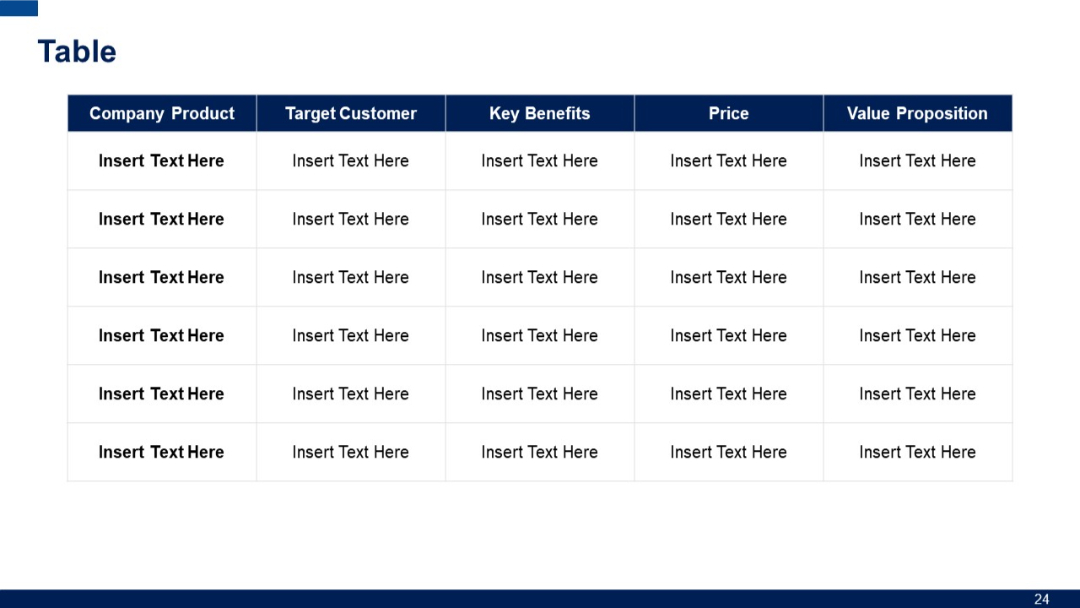
6-row, 5-column table with consistent layout from Slides 22–23, allowing deeper comparative data input.
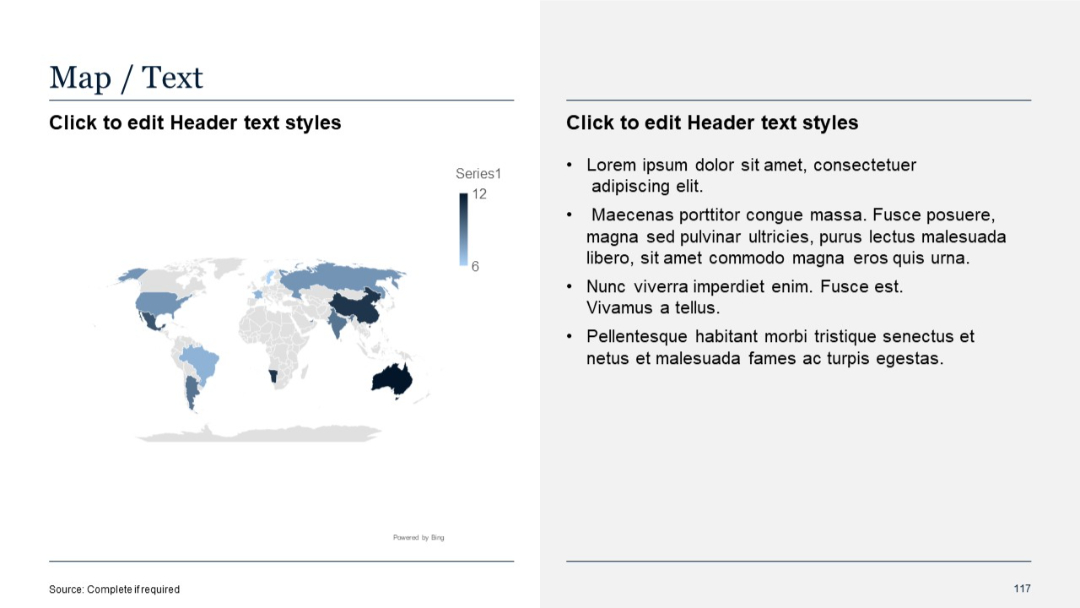
PRO
Map visual (choropleth style) on left with color gradient; right side contains placeholder bullet text.
PRO
Basic line chart over five categories on left; placeholder text on the right.

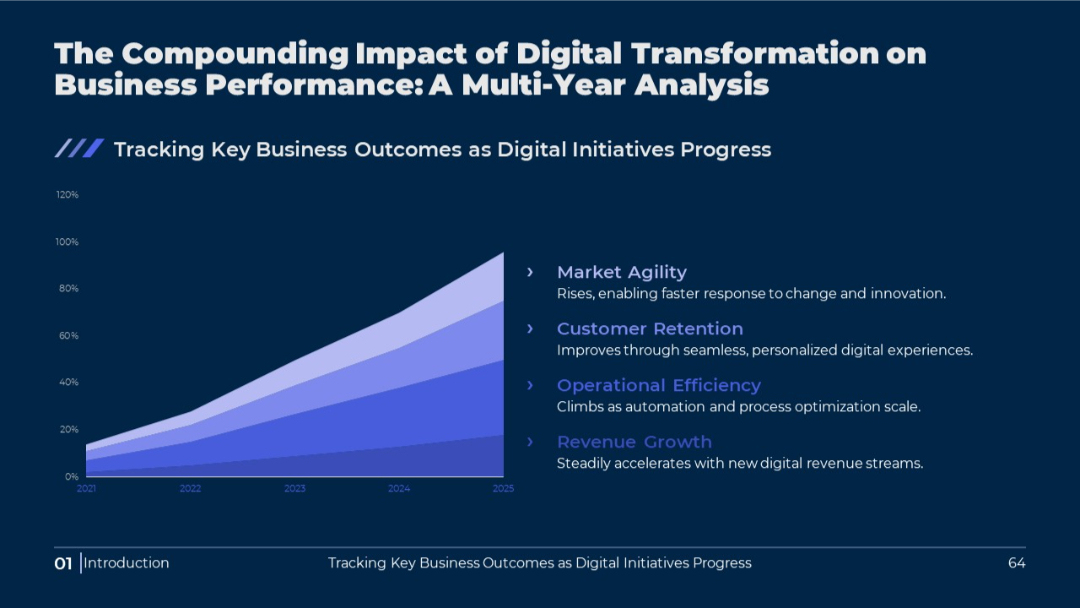
PRO
Dark background area chart with four stacked performance layers and labeled growth drivers. White and blue color theme for text and data layers.
PRO
Four overlapping rounded arrow blocks in a diagonal step layout, each numbered and colored differently (green, gray, purple, red), with placeholder text beside them.