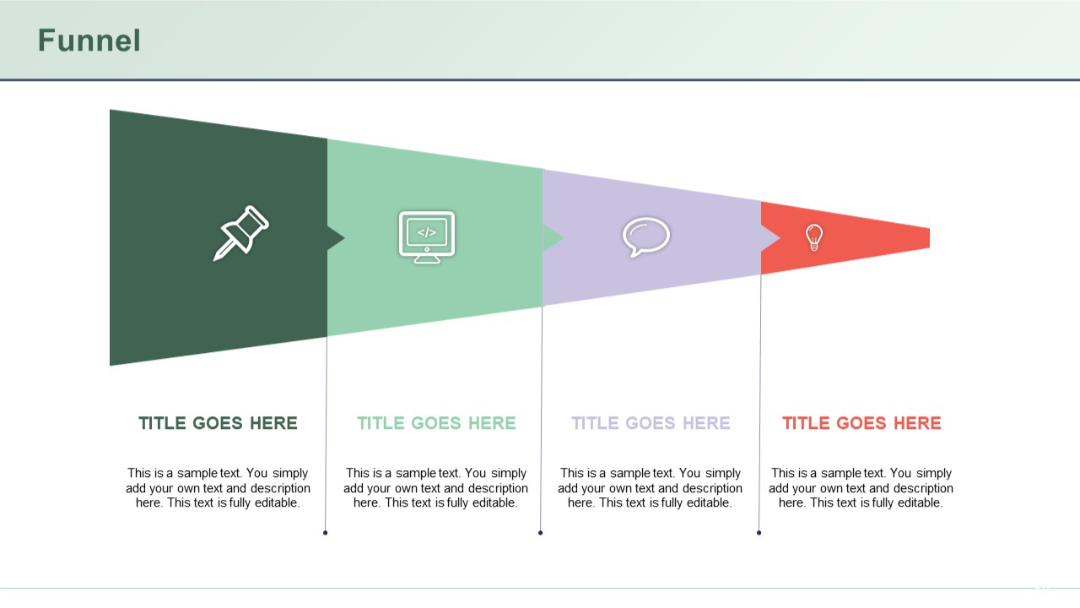
PRO
Triangular horizontal funnel with four sections, each containing an icon and text area below the funnel shape.
PRO
Vertical list with circular gear-like icons and numbering, aligned left. Each entry includes a title and subtitle.

PRO
Title slide with gradient blue background and wave lines; large central heading.

PRO
Three-column format, each with a numbered purple header and three aligned content rows with side-colored titles.
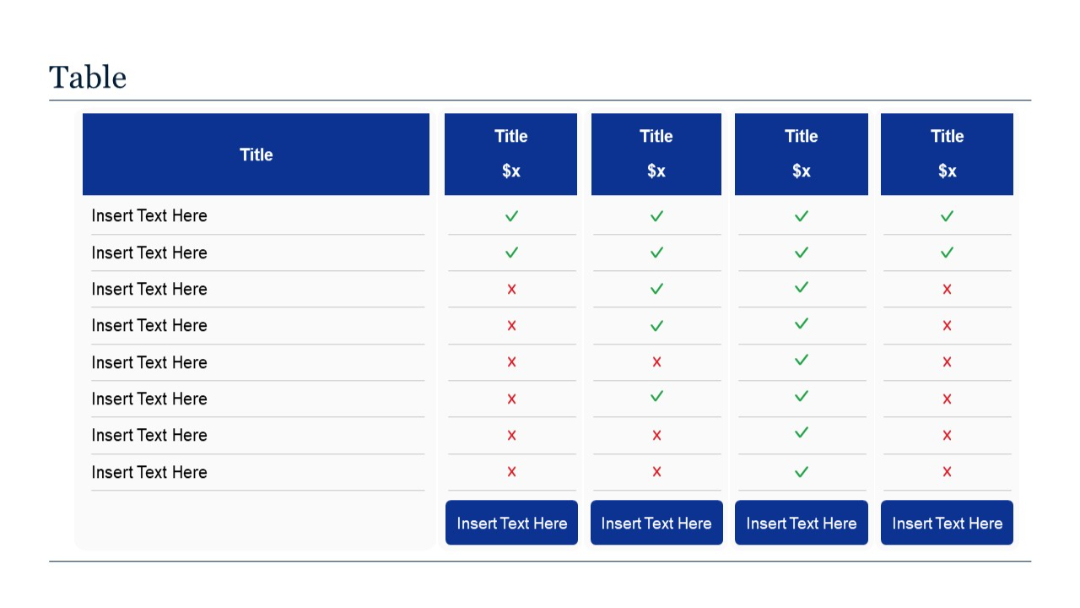
PRO
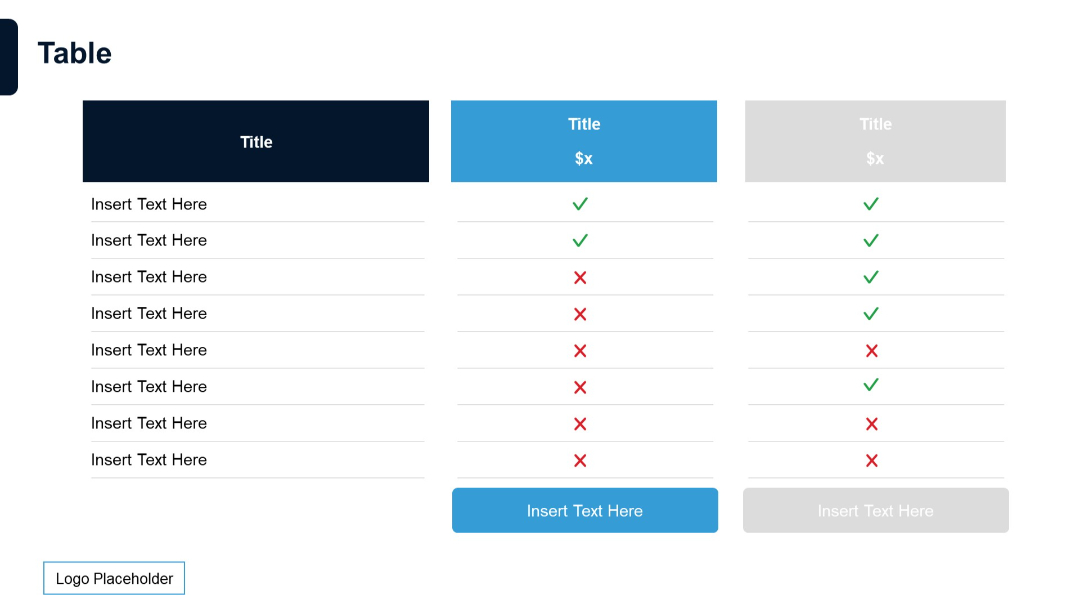
A 5-column comparison layout with one features column and four offering columns, all with checkmark/cross symbols and bottom call-to-action cells.
PRO
Similar format to Slide 178 but with fewer columns and subtle color variation; maintains pricing title and checkmark layout.
PRO
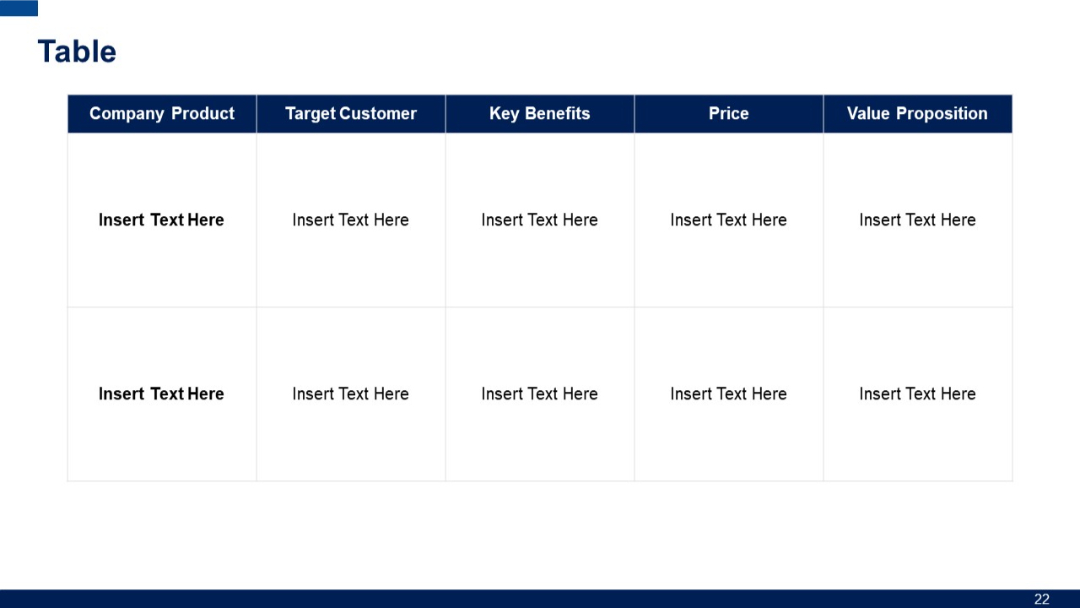
Simple 2-row, 5-column table with uniform width columns, bold dark blue headers, and plain white cells with placeholder text.
PRO
Vertical flow layout with four checkmark icons inside gear shapes connected by a line; text to the right of each.

PRO
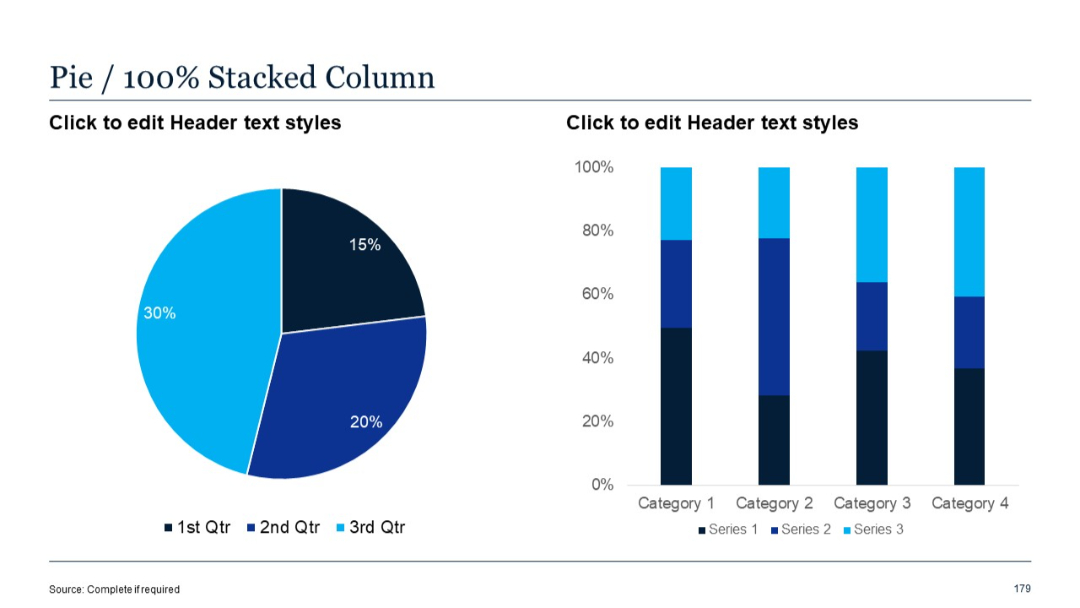
Pie chart on the left and 100% stacked vertical bar chart on the right.
PRO
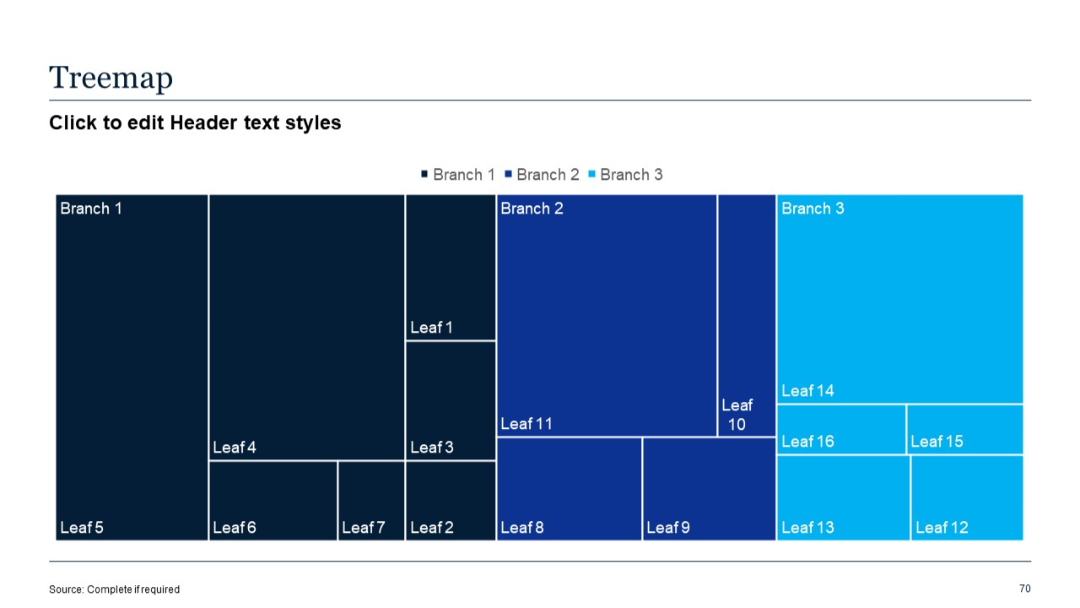
Treemap visualization with nested rectangles representing hierarchical data across three branches.
PRO
Minimal layout with two icons and text blocks positioned left and right of a diamond-shaped central graphic. Clean, white background.
PRO
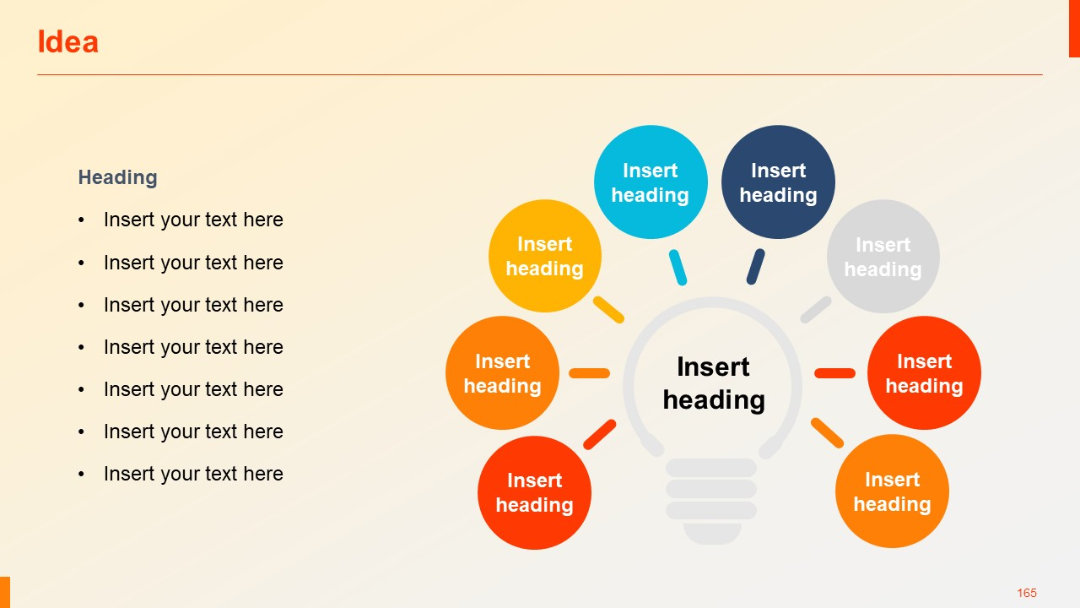
Eight surrounding color-coded circles around the central lightbulb; balanced radial layout with consistent design.
PRO
Horizontal matrix-style table with 2 rows and 6 columns; top row has blue headers, first column on left is shaded vertically for row titles.

PRO
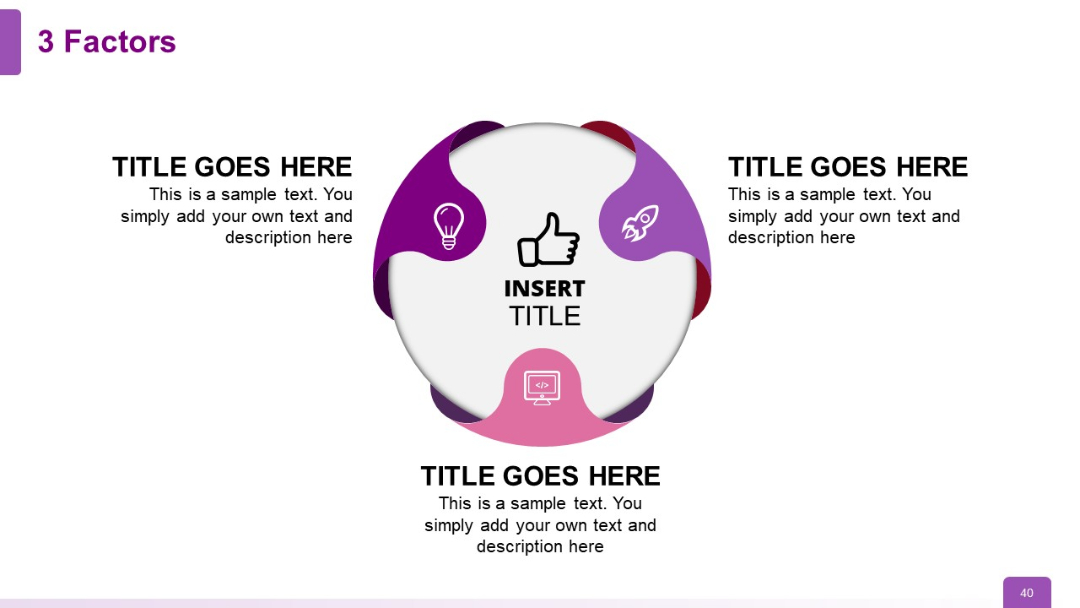
Circular design with three evenly spaced headers/icons surrounding a central thumbs-up icon; symbols imply innovation, launch, and development.
PRO
Four cogwheel-shaped graphics in a row, each containing a central header and supporting text below. Uniform in layout.

PRO
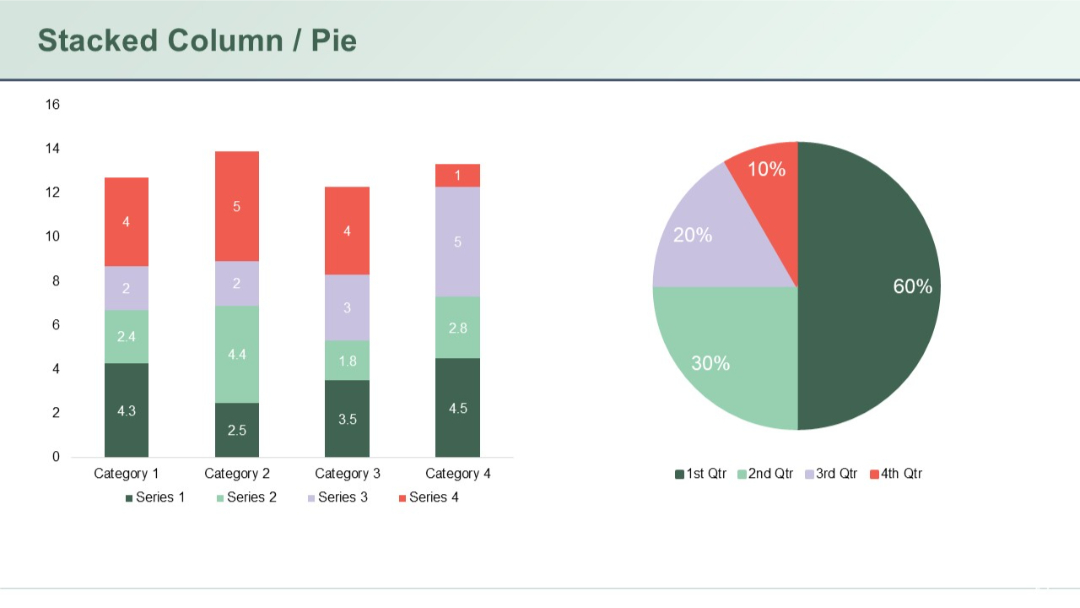
Combined slide showing stacked columns for four categories on the left and a pie chart on the right; clear use of color to represent four series.
PRO
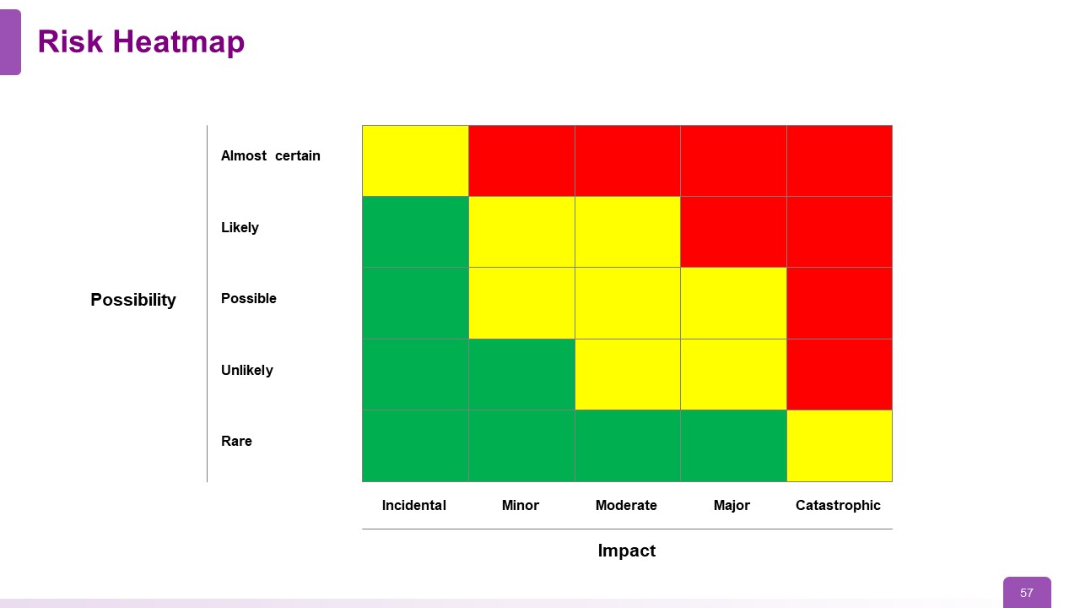
5x5 risk matrix heatmap with axes labeled "Impact" (horizontal) and "Possibility" (vertical). Color-coded: green (low), yellow (medium), red (high).
PRO
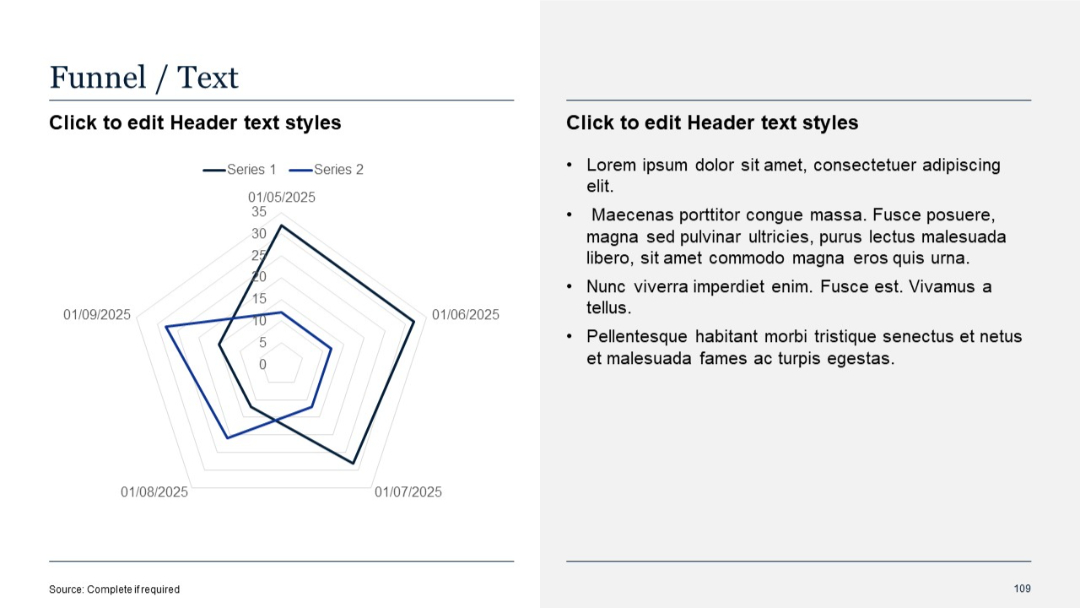
Radar chart/funnel format on the left; bullet point text on the right.
PRO
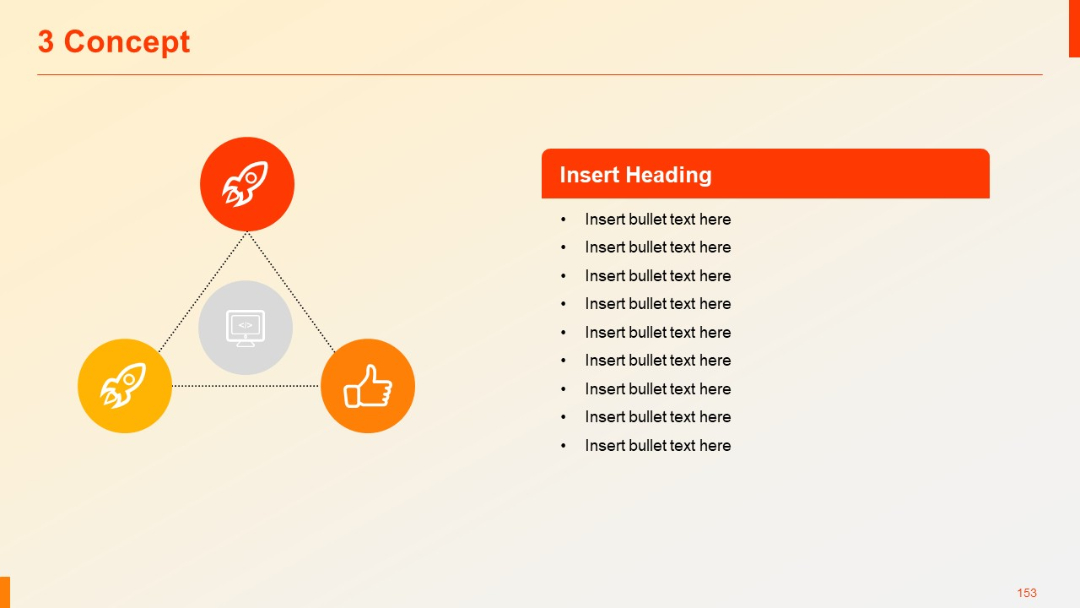
Triangular connection of three colored icons (rocket, code, thumbs up) with central icon; bullet list on right.
PRO
4-column table with header rows; structured for tabular text; white background.

PRO
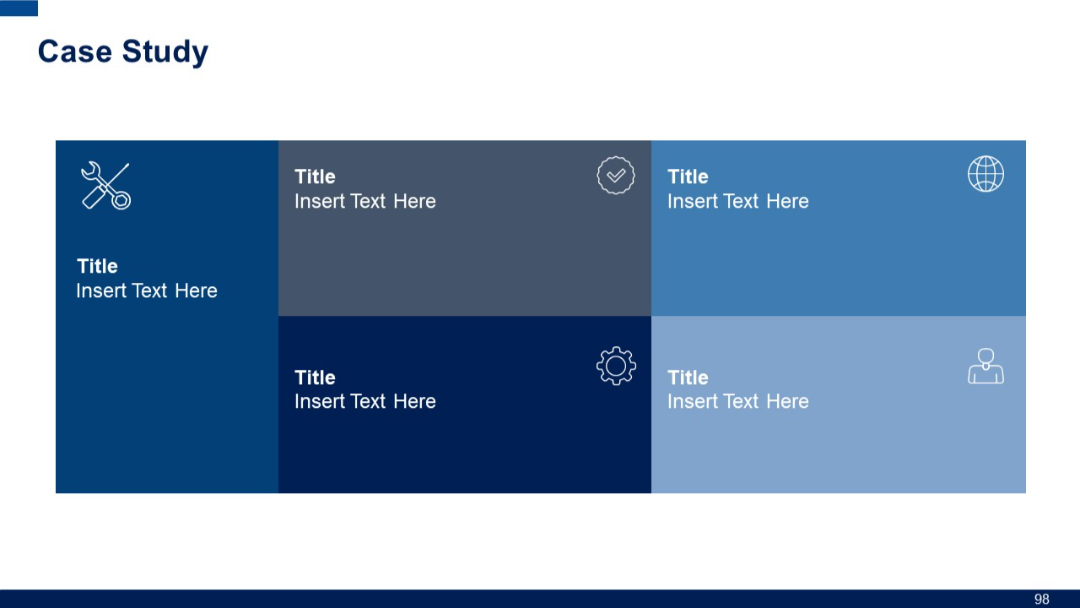
Grid layout with six rectangular sections, each with icon, title, and placeholder text; uses different shades of blue for visual distinction.
PRO
Mixed business, communication, and growth icons in red outline. Includes graphs, targets, emails, speech bubbles, and idea bulbs.
PRO
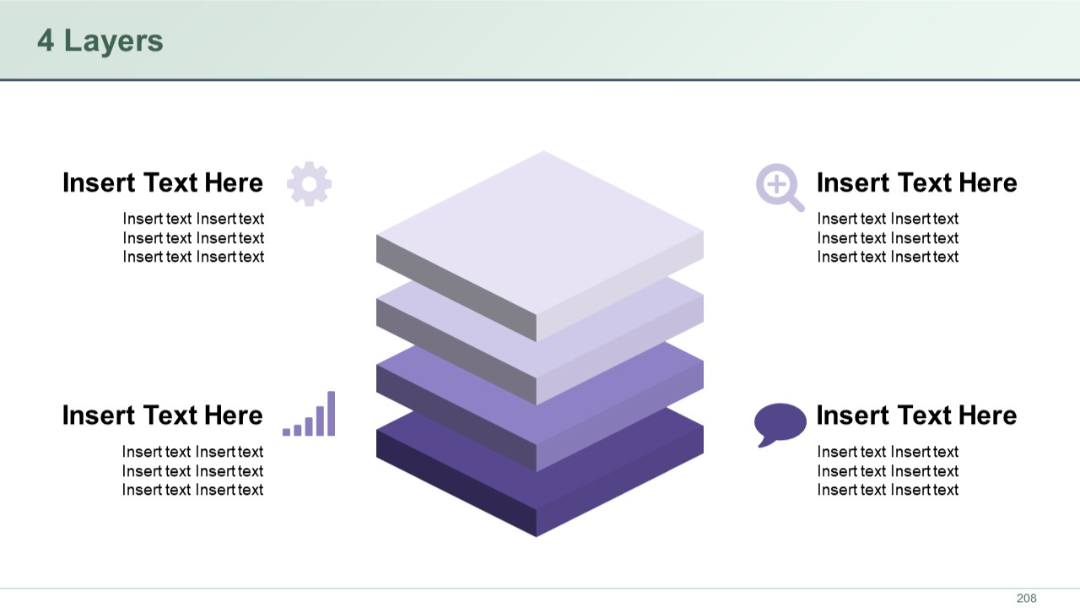
3D-style layered stack at center with four quadrants around it, each containing icons and text. Visual hierarchy implies depth or structure.
PRO
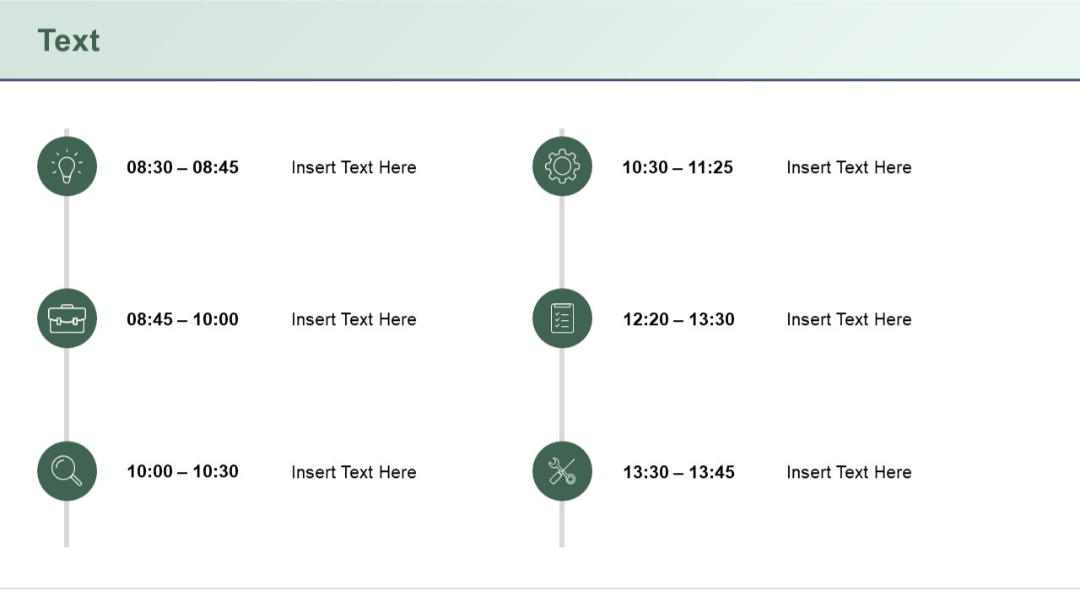
Vertical split timeline with six time slots and icons (lightbulb, briefcase, etc.). Time and topic text on both sides.
PRO
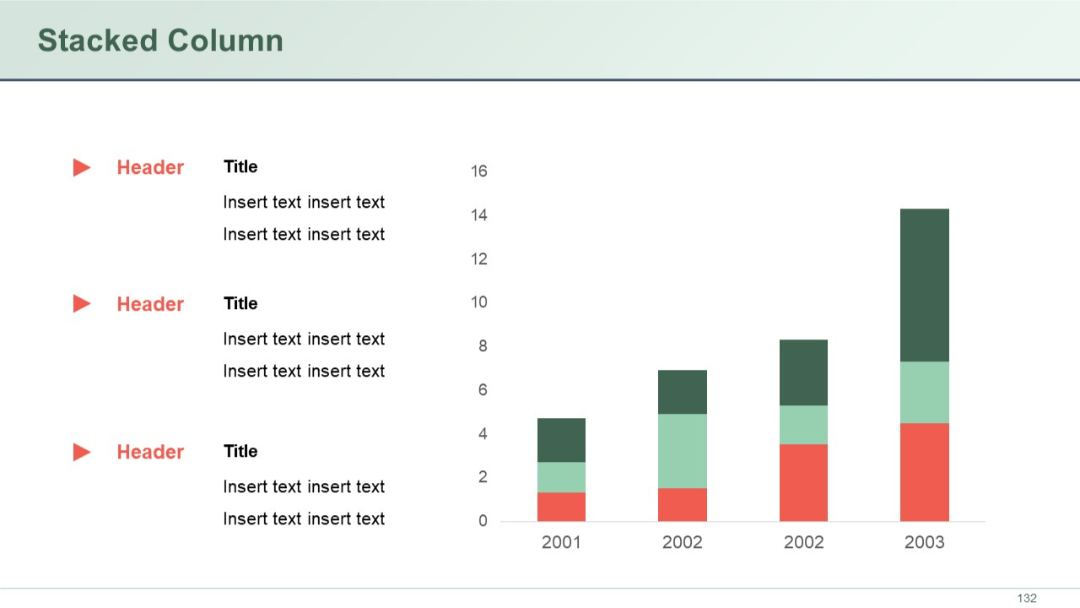
Left-aligned bullet text with red triangle icons, and a vertical stacked column chart on the right displaying yearly data in different color segments.
PRO
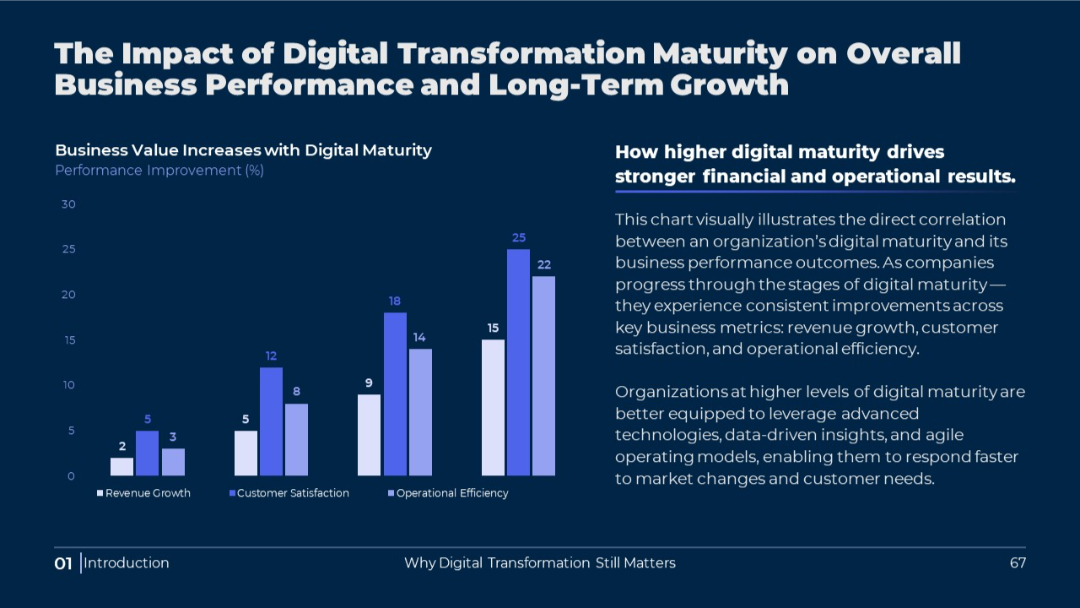
Bar chart with dark background, vertical bars representing performance metrics. Text explanation to the right of the chart, aligned in two columns.
PRO
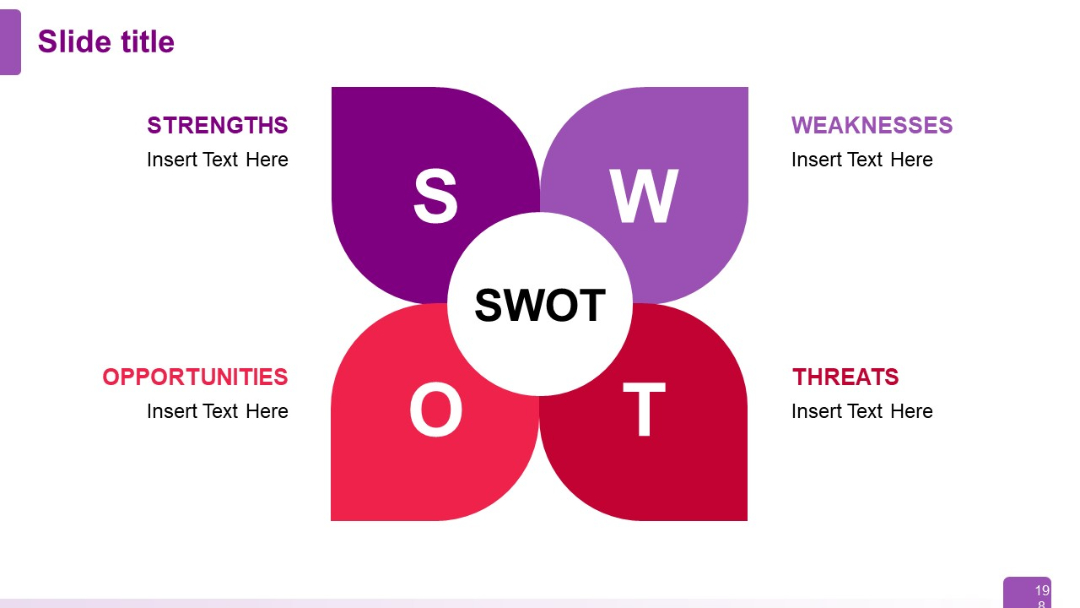
Petal-style SWOT layout with S, W, O, T in symmetrical floral design; white center circle.
PRO
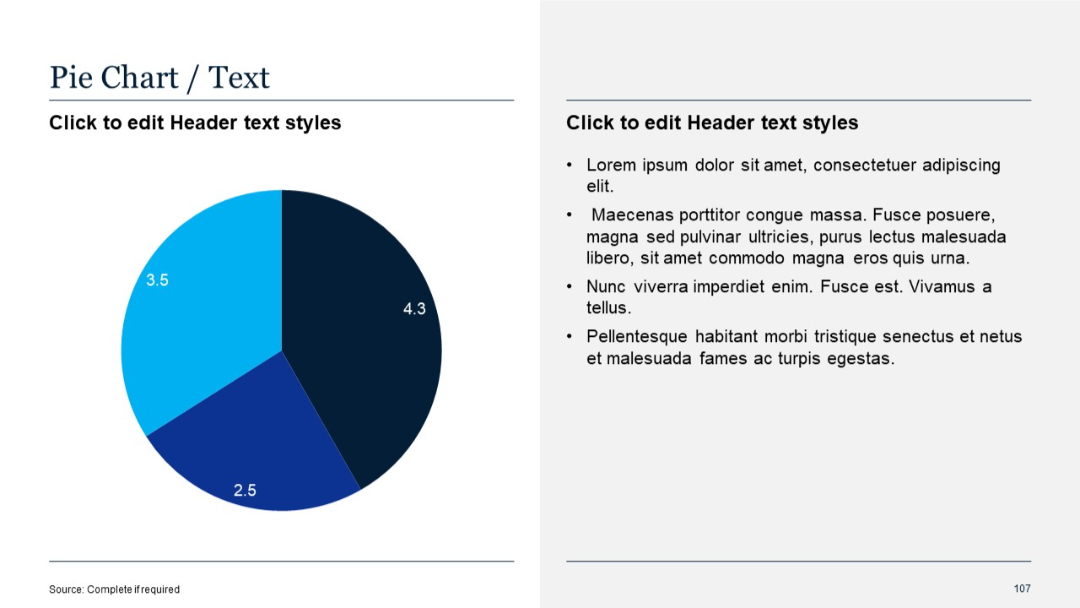
Clean pie chart on the left with segment labels; explanatory bullet points on the right.
PRO
Organized grid of icons depicting people, teamwork, finance, and transactions. Purple outline design is consistent across icons.
PRO
Left-aligned image (pen and planner) with two title and text content boxes on the right side using subtle colored bars.