PRO
Visual slide with full-image background of glass building and binary code. Bold section number and title overlay.

PRO
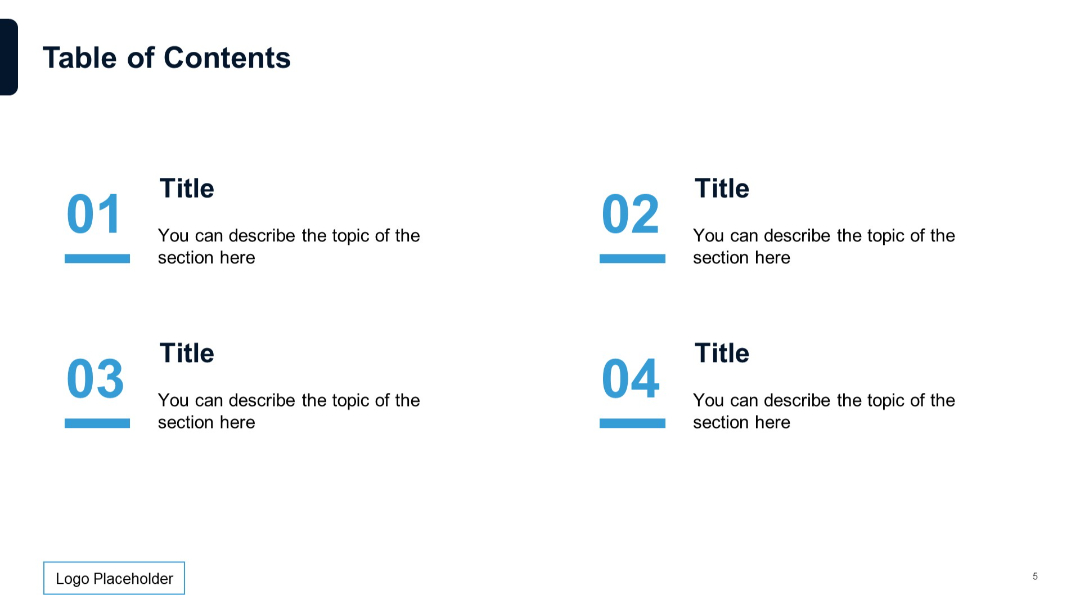
Two-column layout on a white background with four numbered sections and brief descriptions, logo at bottom left.
PRO
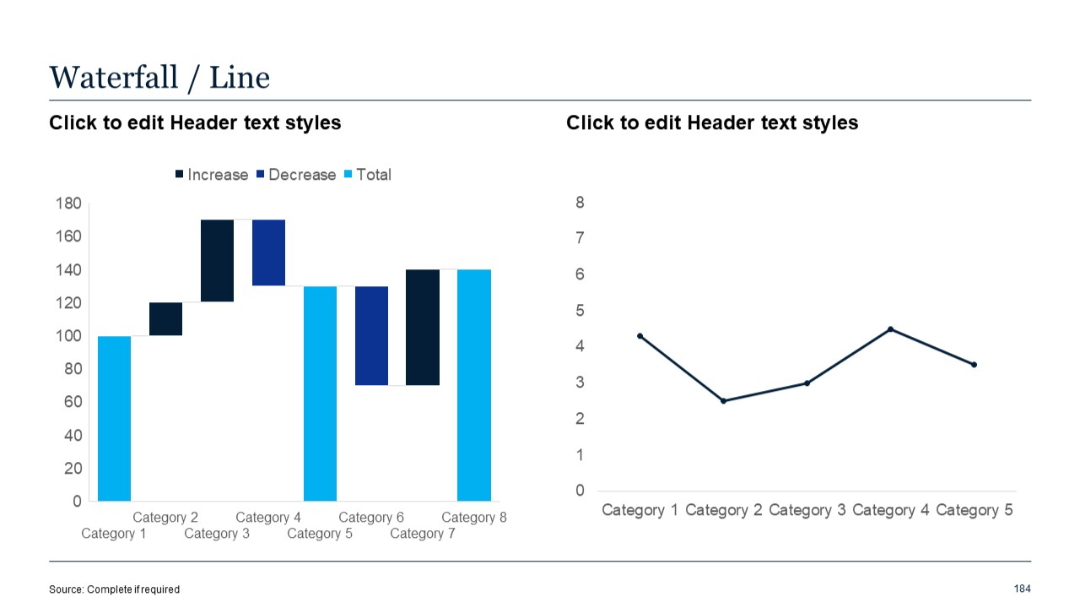
Dual chart format: waterfall chart (left) showing increase/decrease across categories, and single-line chart (right) plotting data trend across categories.
PRO
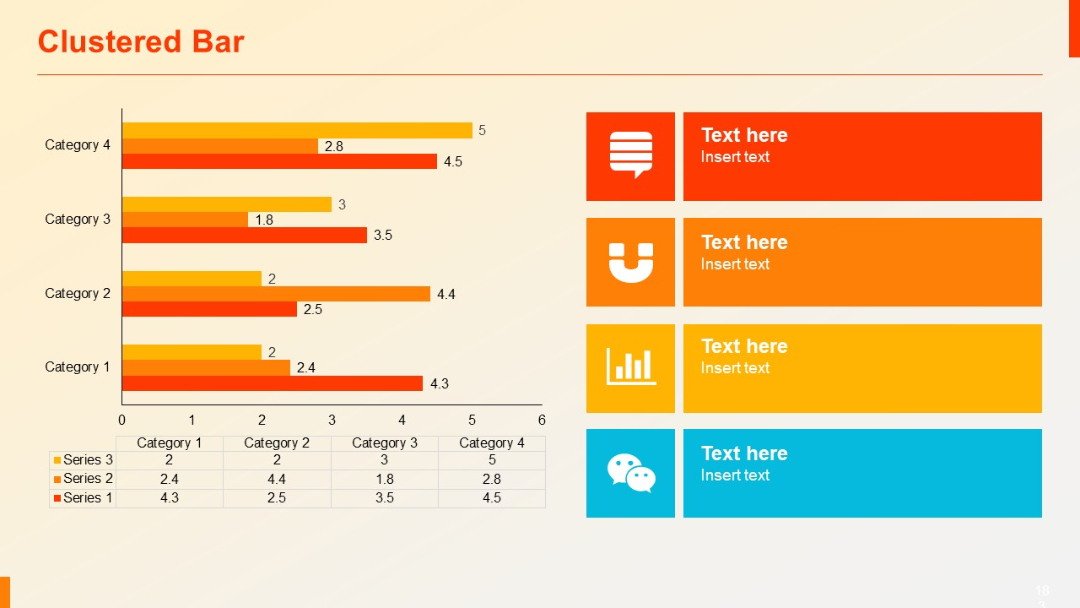
Left-aligned clustered horizontal bar chart with a four-color legend and a right-aligned grid of colorful text boxes with icons.
PRO
Zigzag flow from left to right with 4 numbered circular nodes and connecting vertical lines. Alternating top-bottom text placements.
PRO
Two-row, five-column grid with bold red column headers and light beige background. Equal column widths. Clean and structured layout.
PRO
Left-aligned gear-shaped icons with numbers and titles followed by short descriptions in a vertical list.

PRO
Horizontal blocks with arrow icons and left-aligned text; top title bar in dark blue.
PRO
2-row, 5-column table; first column shaded with titles; rest are white cells with centered text placeholders.
PRO
Eight-branch radial infographic layout with clear visual balance; icons and text flank a central hub.
PRO
Slide master layout with placeholder for logo at top left; large editable title and subtitle fields on a dark blue wave-themed background.

PRO
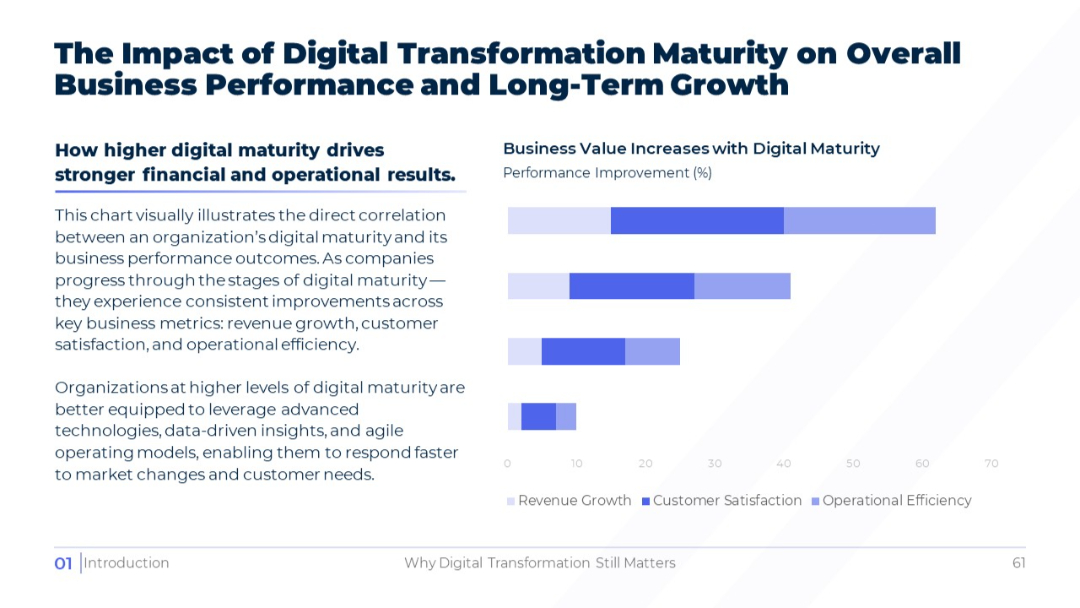
Split into two main sections: left with text and right with a horizontal bar chart using three shades of blue. Clean white background and structured layout.
PRO
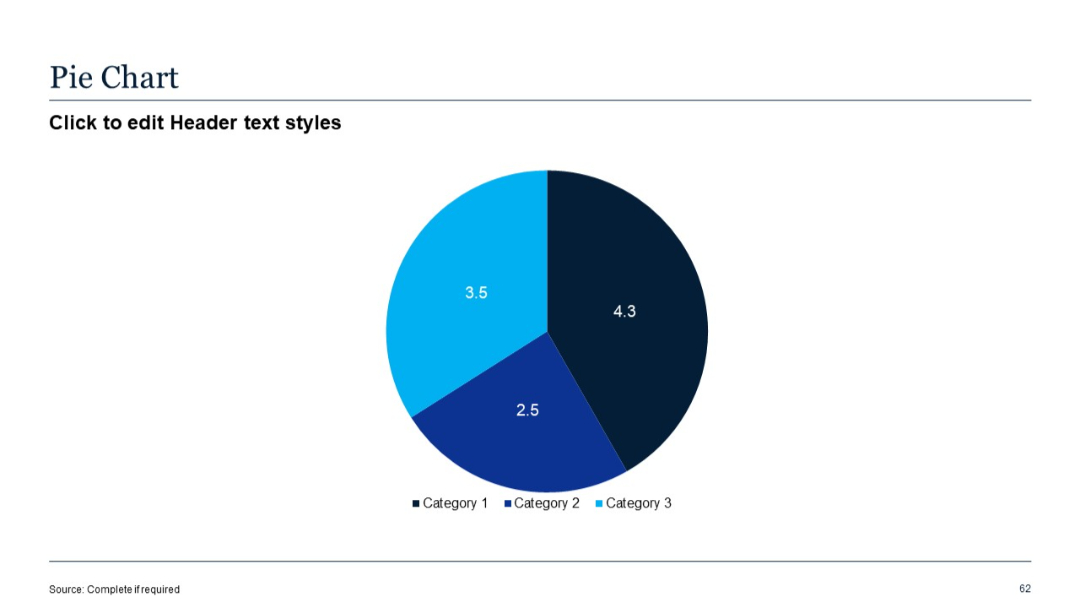
Centered pie chart with three segments in blue shades; minimalistic design with category labels.
PRO
Circular infographic with 6 equally spaced segments surrounding a central icon. Each segment includes an icon and sample text.
PRO
Simplified table with two rows, each containing a large red category cell and associated cells for editable content across four columns.

PRO
Title slide with abstract geometric background design; no specific chart or data shown.

PRO
Two-row, six-column table with bold purple headers and shaded first column. Dotted separators; minimalist look.
PRO
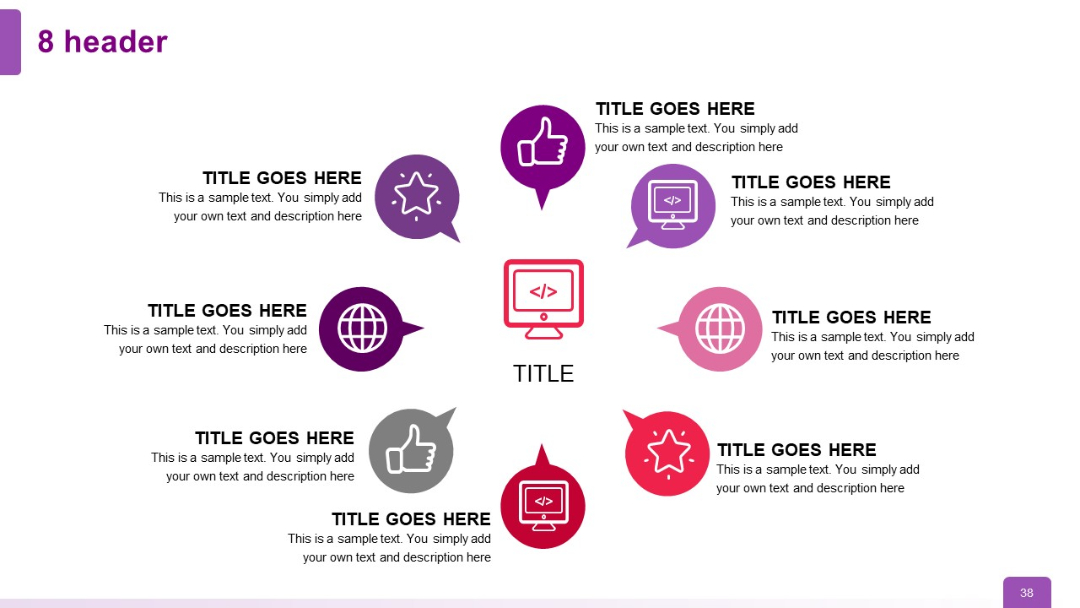
Symmetrical circular infographic with eight headers evenly spaced around a central code icon; each with its own unique color and icon.
PRO
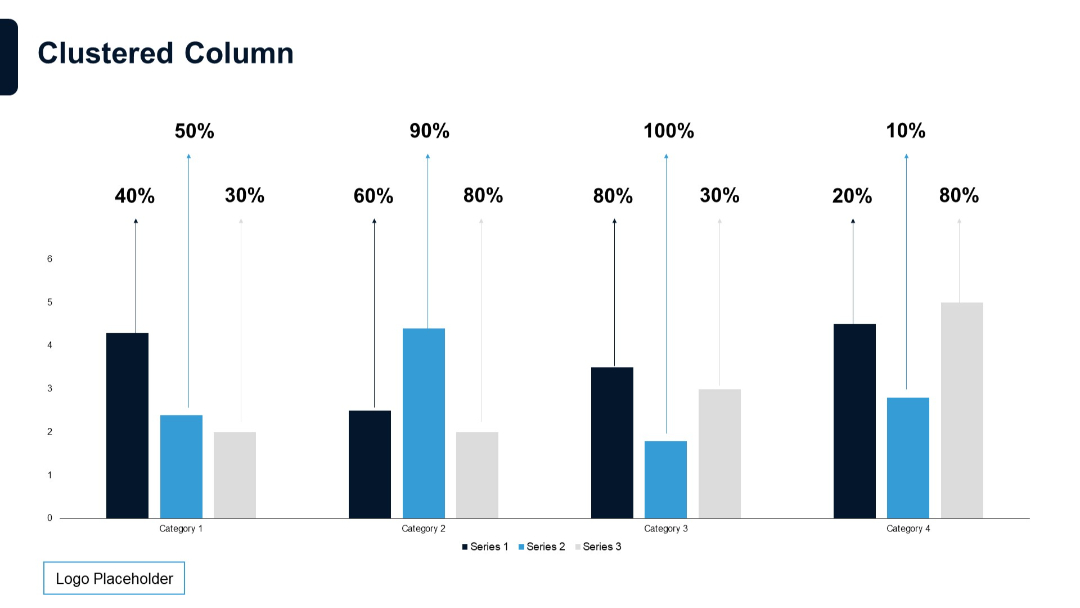
Centered clustered bar chart with vertical percentage annotations. Simple layout with three series per category.
PRO
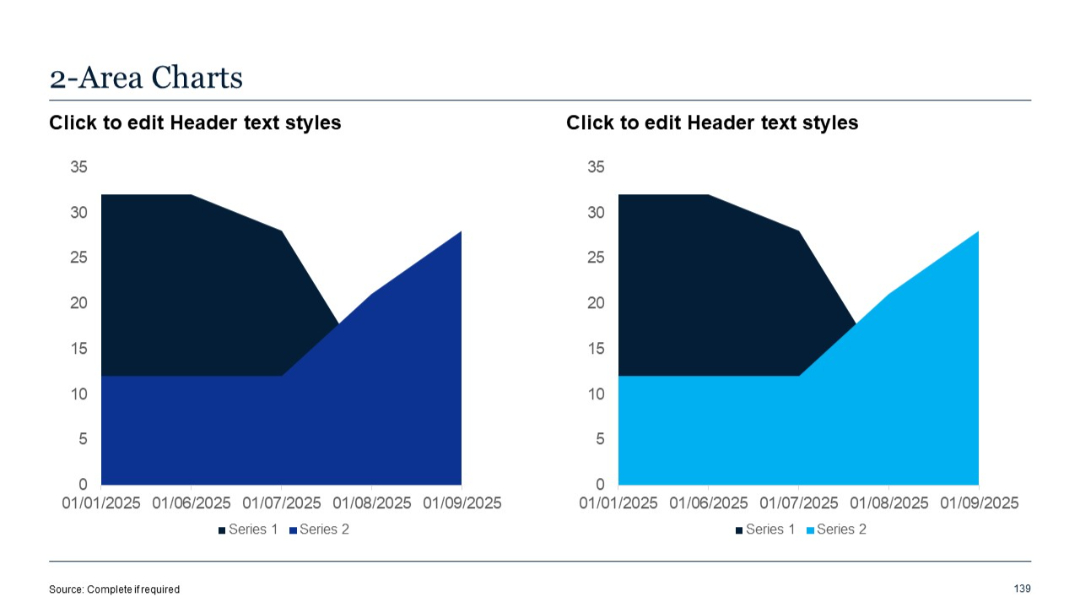
Two area charts side-by-side. Left chart shows two overlapping areas in dark blue and navy; right chart uses navy and cyan blue.
PRO
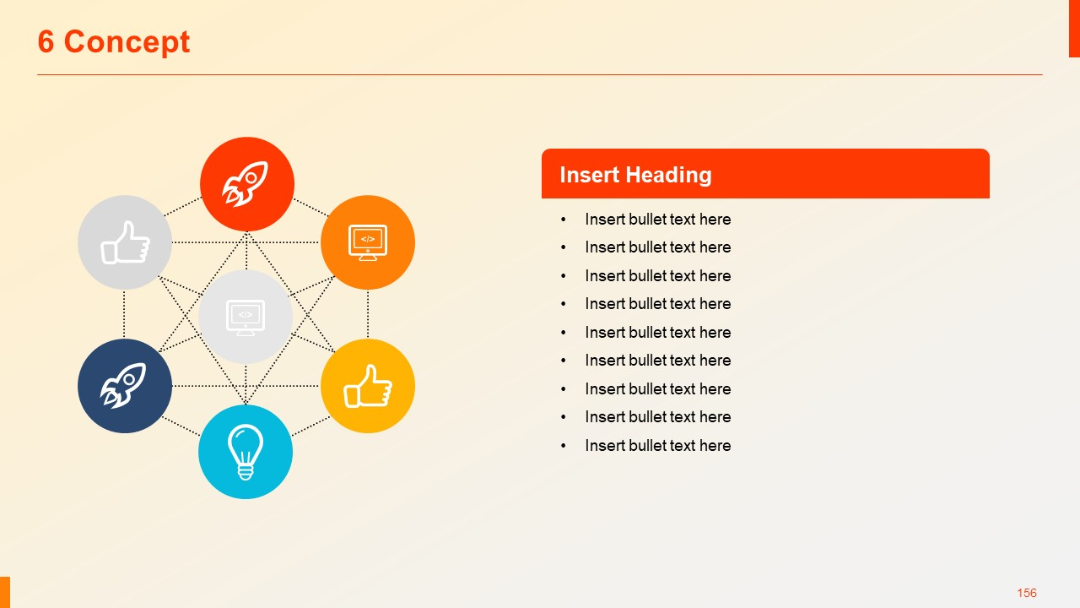
Seven icons in a circular, fully interconnected network with central icon; all connected via dotted lines; bullet list included.
PRO
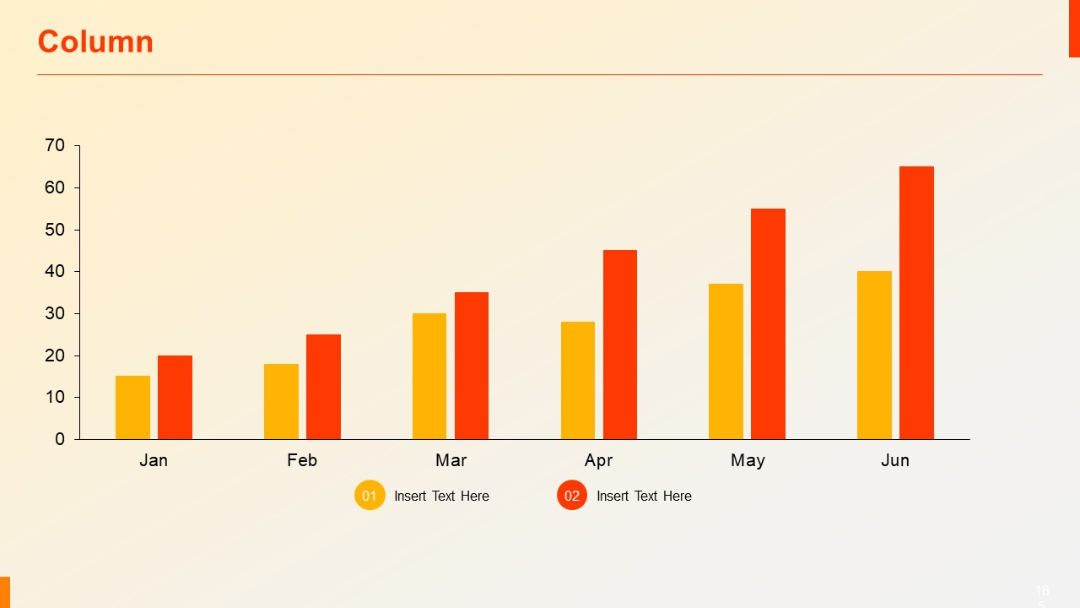
Basic vertical column chart showing values for six months (Jan–Jun) using two color series. Clean and minimal design with icons below chart.
PRO
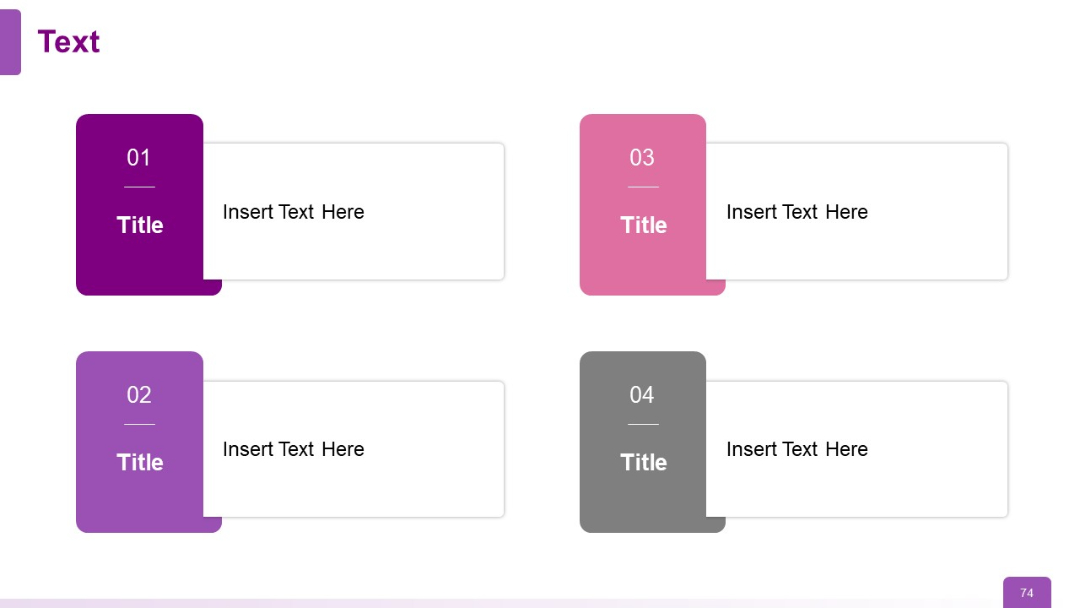
Four modular blocks with vertically stacked labels showing number and title, paired with content blocks on the right. Rounded corners, soft colors.
PRO
Combination of an area chart (left) and two donut charts (right), labeled 2023 and 2024 respectively, with percentage values and descriptive text boxes below.

PRO
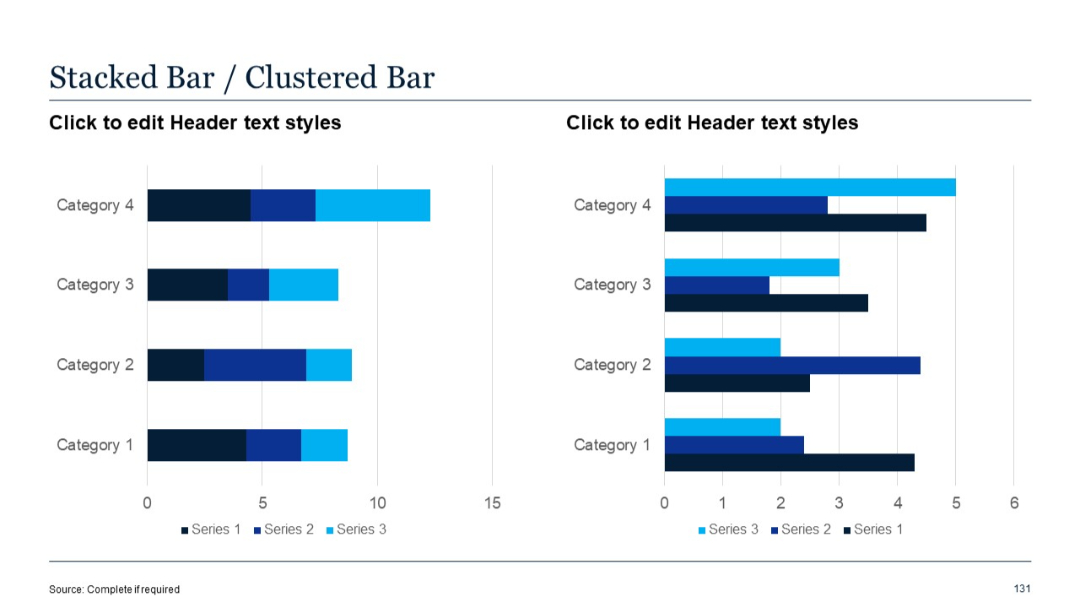
Two horizontally aligned bar charts side-by-side. Left shows stacked bars, right shows clustered bars, both segmented by category and series in blue tones.
PRO
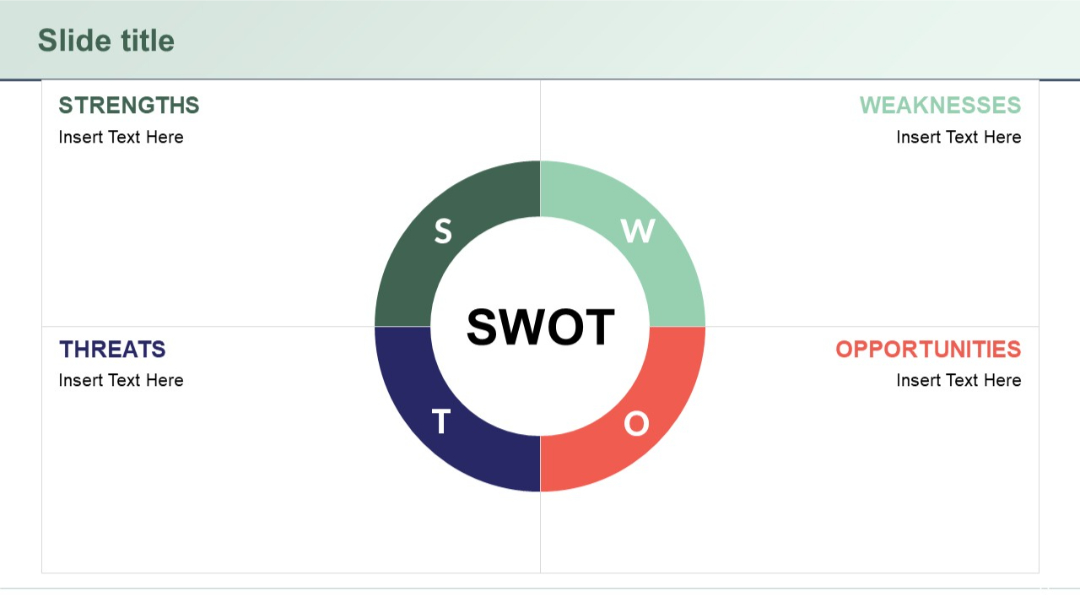
Circular SWOT layout with each quadrant labeled. Central circle says "SWOT", surrounding text includes Strengths, Weaknesses, Opportunities, Threats.
PRO
Two-segment donut-style circle with a hole in the center, split vertically, and labeled "Insert text" on either side.
PRO
Star-shaped central element with five icons and matching headers placed at each point. Balanced and symmetrical design.

PRO
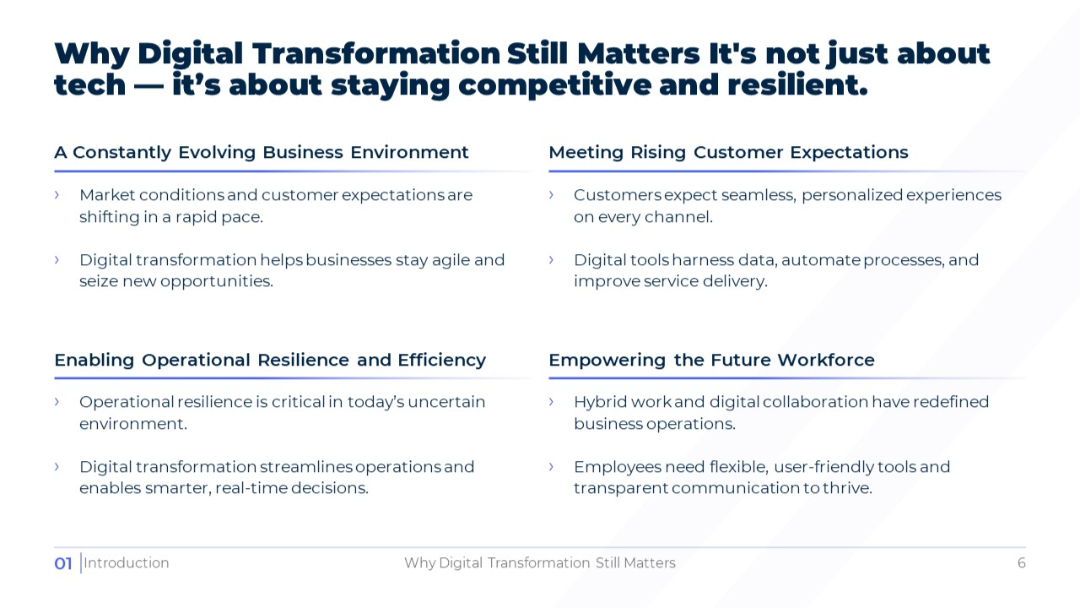
Four quadrant layout with paired headings: business environment, customer expectations, resilience, and workforce. Bullet points under each. Consistent color and spacing.
PRO
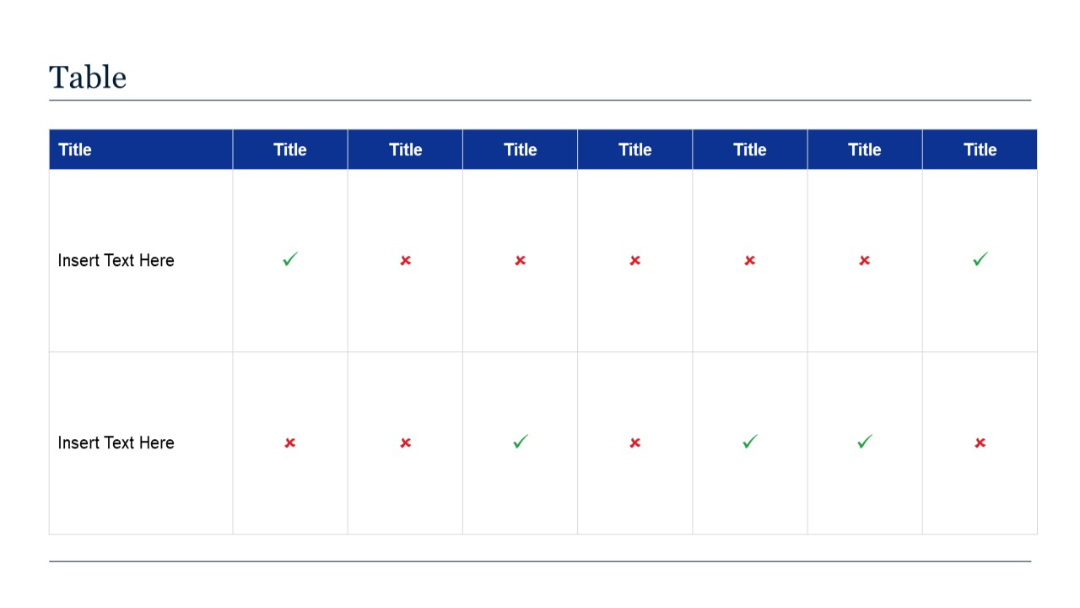
Simple table with rows and columns containing “Insert Text Here” placeholders. Visual is based on checkmarks and crosses.