PRO
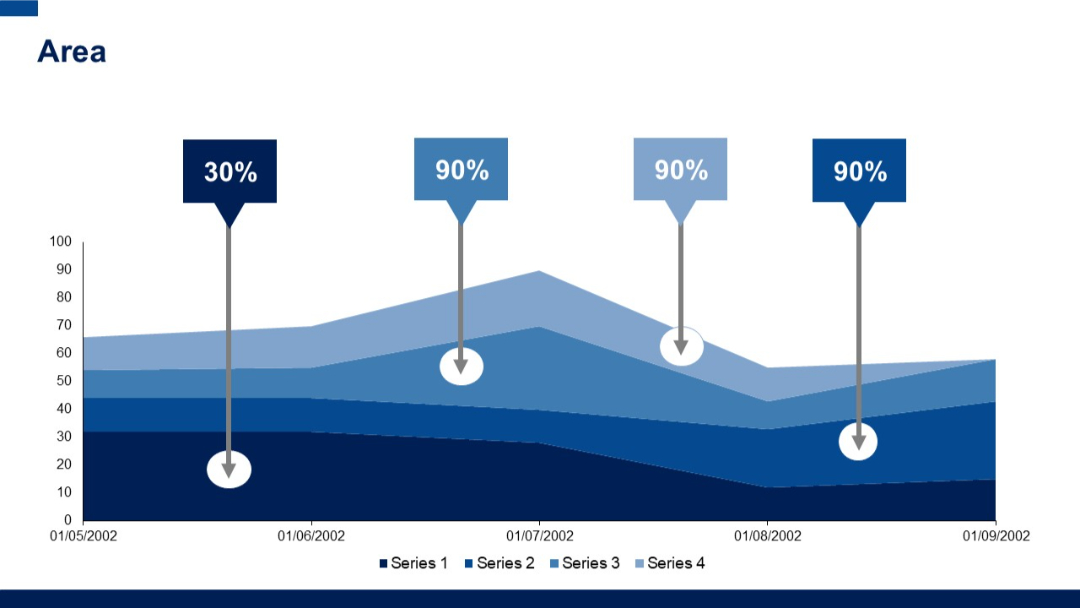
Doughnut chart visualizing four quarterly segments with numerical values. Right side features placeholder bullets.
PRO
Group handshake image with curved black shape on bottom framing the photo; modern aesthetic with minimal text.

PRO
Four horizontal checklist items, each with a colored number block (navy, blue, gray, green) on the left and placeholder text beside it. Minimalistic layout with white background.
PRO
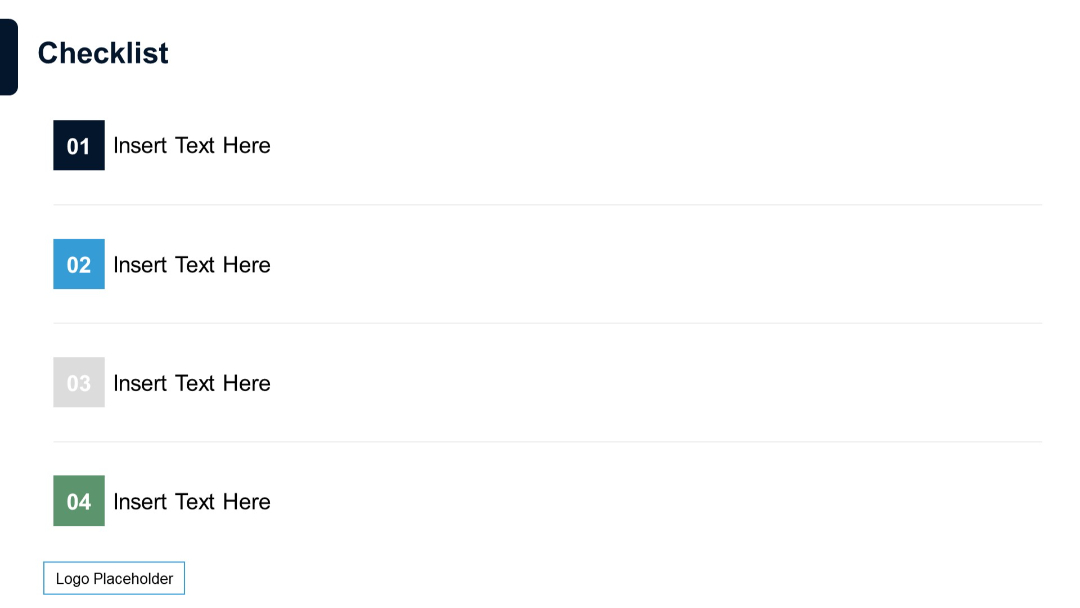
Five-column table, each with a title and price; uses checkmarks and Xs to compare attributes; pastel and bold colors define each column distinctly.
PRO
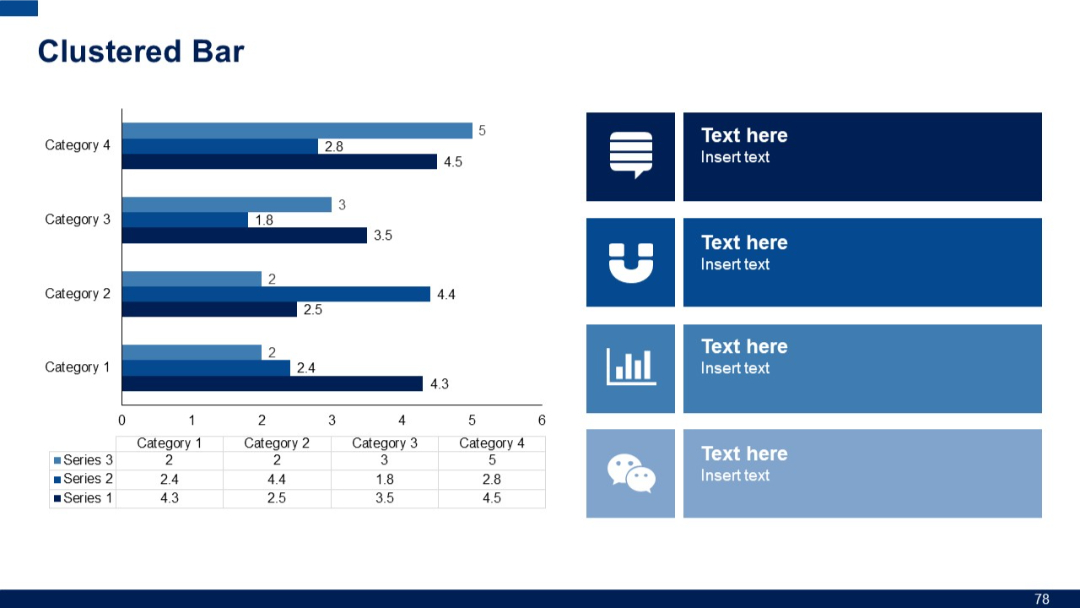
Clustered bar chart with four categories, showing three series per category. Includes icon-based text boxes on the right.
PRO
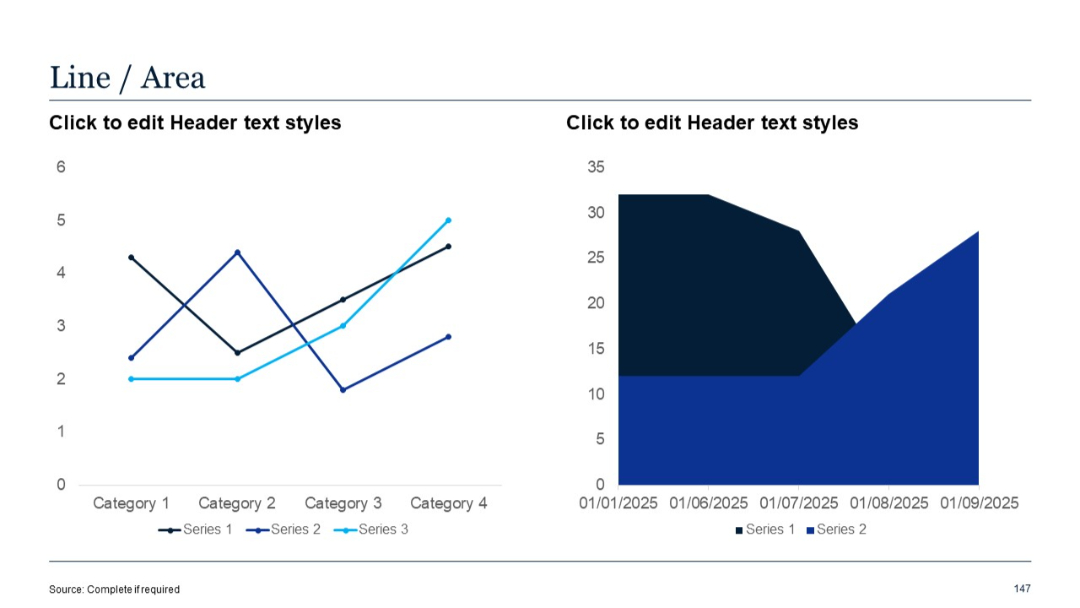
Left side has a 3-series line chart; right is a 2-series area chart. Time and category axes provide structured comparison.
PRO
4-column table with header rows; structured for tabular text; white background.

PRO
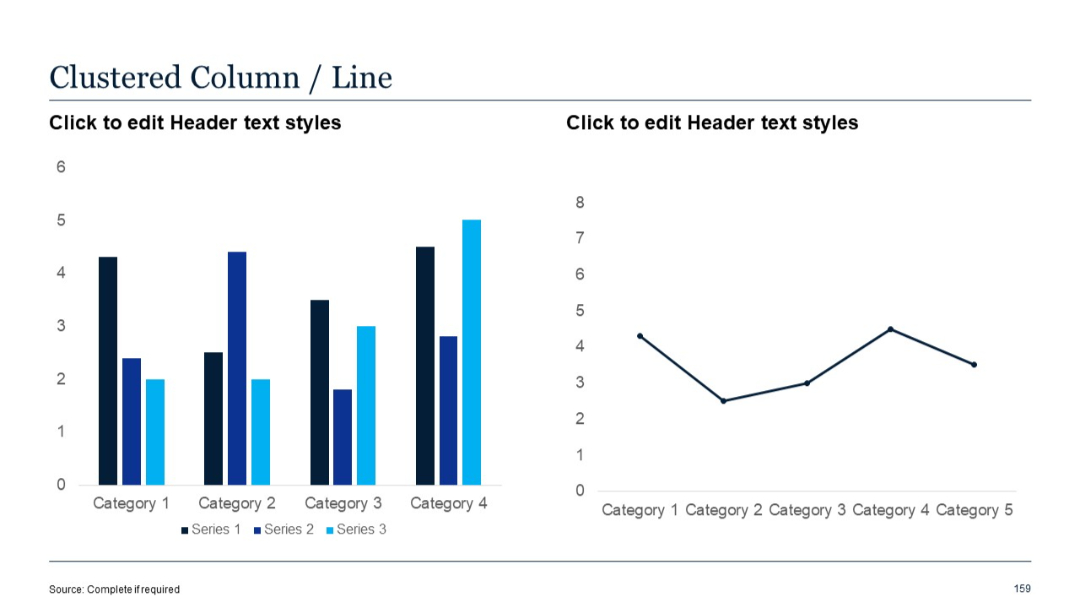
Left chart uses clustered vertical columns; right chart is a line graph. Series are clearly color-separated.
PRO
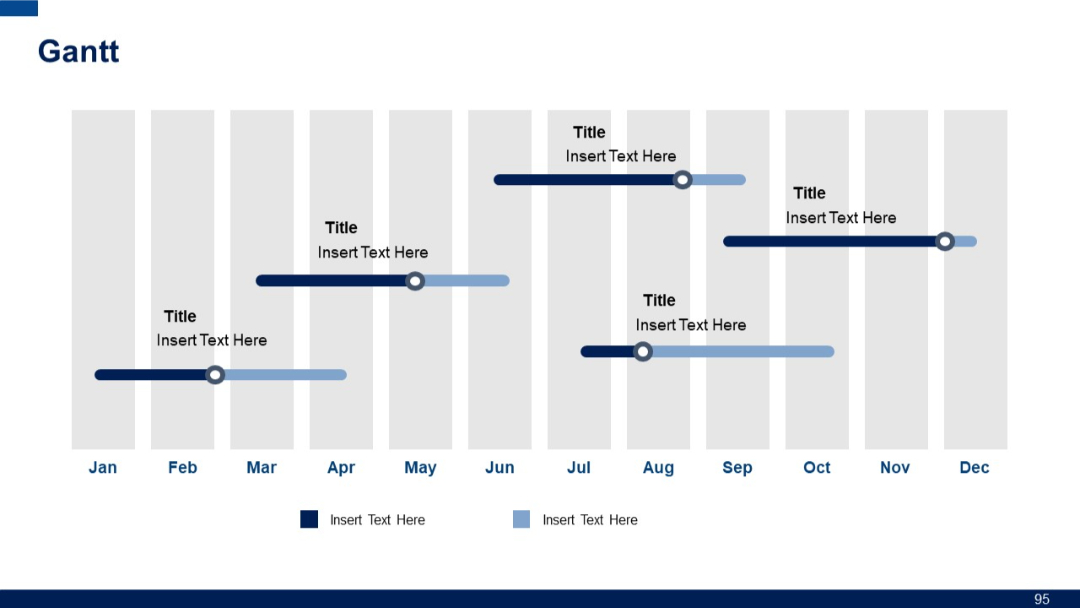
Calendar-style Gantt chart spanning Jan–Dec with horizontal progress bars across shaded months; rounded-end bars and milestone markers.
PRO
Simple slide with a two-tone color scheme (purple and white), large number "4", and the word "Others". Functions as a section divider or category marker.

PRO
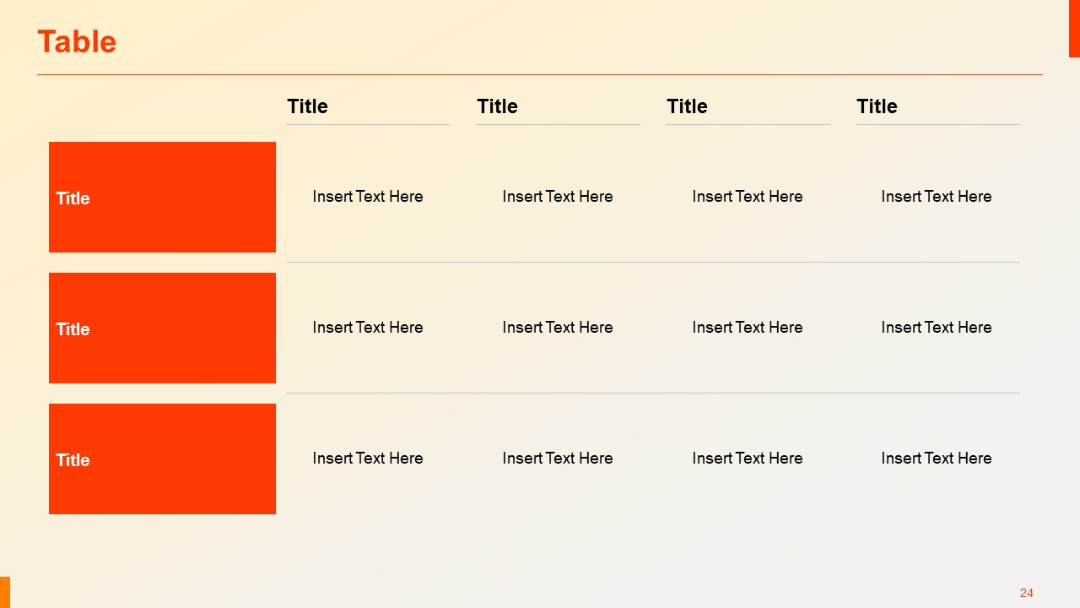
Four-column table layout with three rows; first column uses large red vertical blocks for category headers; remaining cells are for editable text.
PRO
Circular layout with seven icons surrounding a central icon; variation in icon shapes (star, thumbs-up, globe) enhances visual interest.

PRO
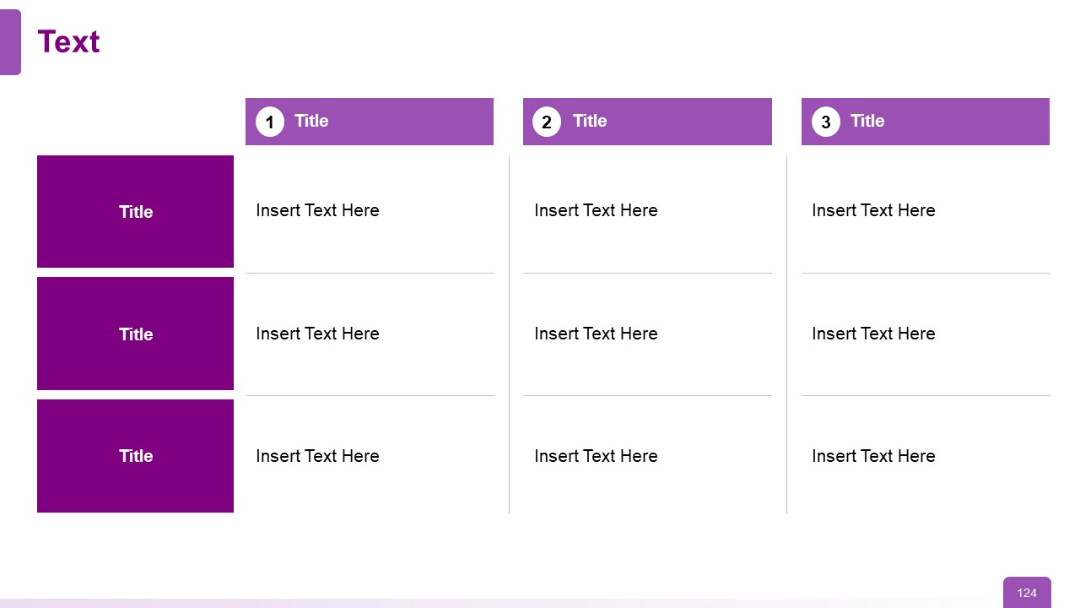
Three-column format, each with a numbered purple header and three aligned content rows with side-colored titles.
PRO
Diagonal step-ladder layout with four L-shaped blocks stepping upward to the right. Each step has a title and description.

PRO
Table with 5 columns and 5 rows. Bold left-side headers, grid lines, and dark blue blocks for headers. Clean and structured format.

PRO
Full-slide dark blue background with the word "Tables" in white and a thin horizontal line leading to a white dot. Branding and logo placeholder in lower left.

PRO
Simple white slide with title text at top and bulleted list with multiple levels of indentation. Footer includes “Source” and page number.
PRO
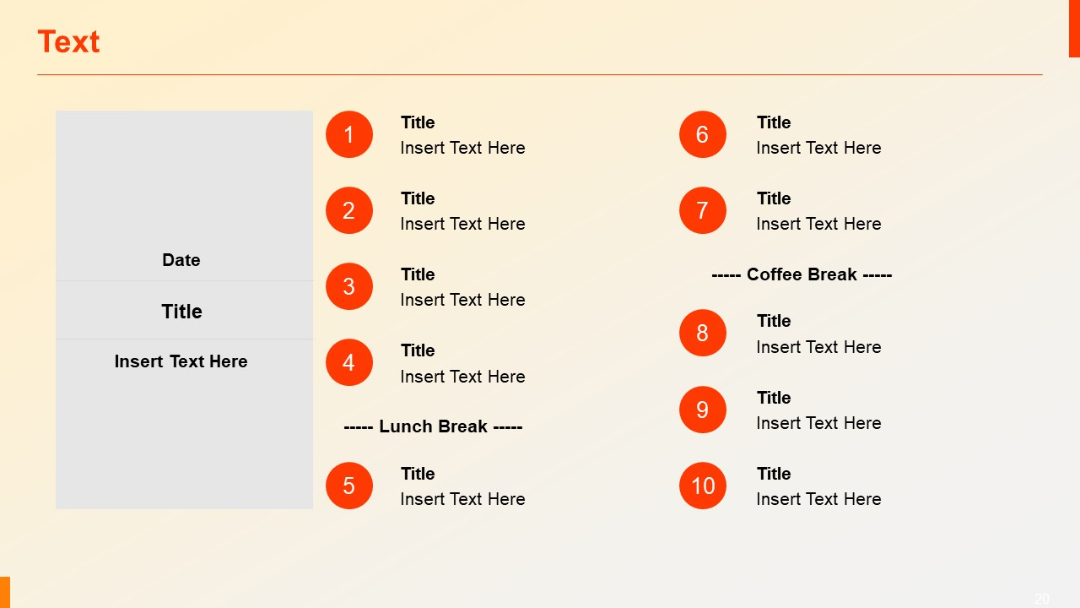
Agenda layout with two columns of numbered items and a grey content box for date and details. Visual separators for breaks (e.g., lunch, coffee).
PRO
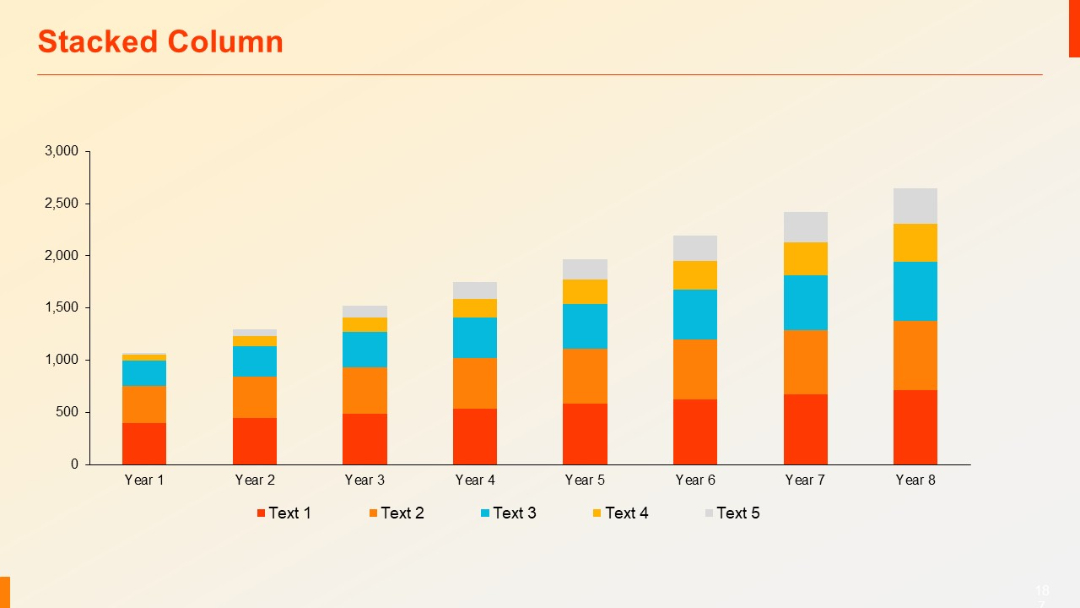
Column chart comparing multiple data segments across a timeline. Each bar has stacked segments representing different values.
PRO
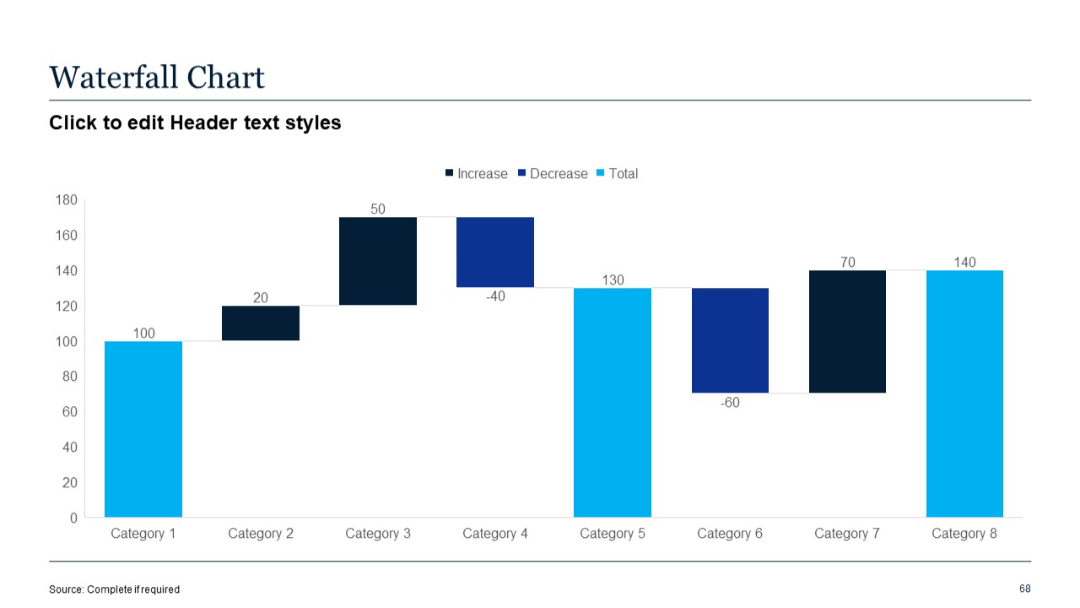
Waterfall chart with alternating increases and decreases across eight categories; labeled bars.
PRO
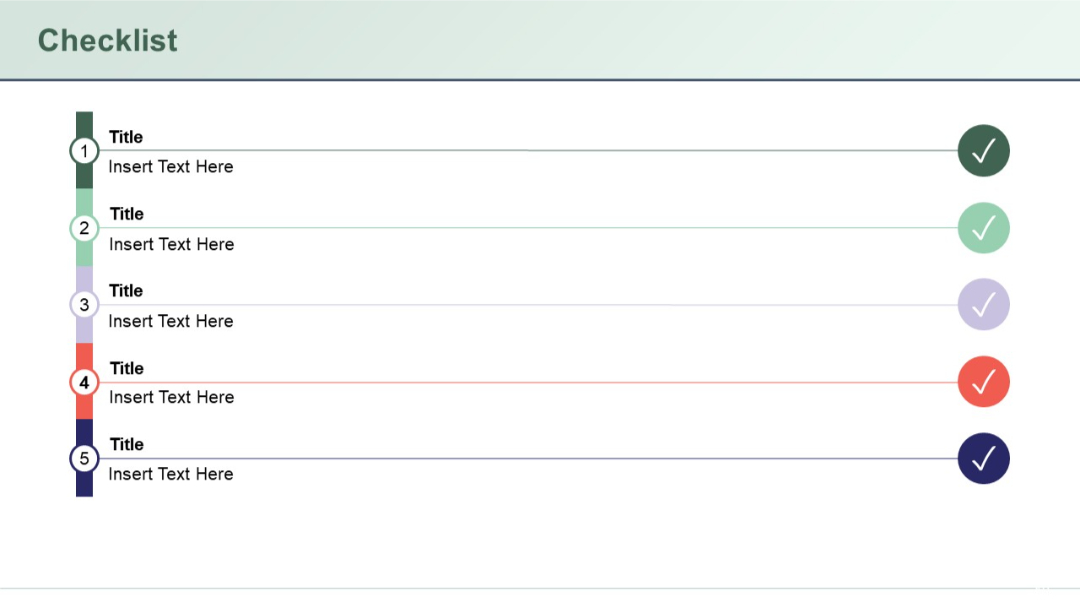
Vertical checklist with five steps shown as colored circles connected to titles and subtitles; includes tick icons at the far right.
PRO
Split layout with two columns: blue on left, red on right. Each column has six rows with numbered boxes and placeholder text. Circular icons above each section.

PRO
Simple title slide with large number "01" and text underneath, minimalistic and clean.

PRO
Clustered horizontal bar chart with three series compared across four categories. On the right, four icon-labeled colored boxes serve as space for commentary.

PRO
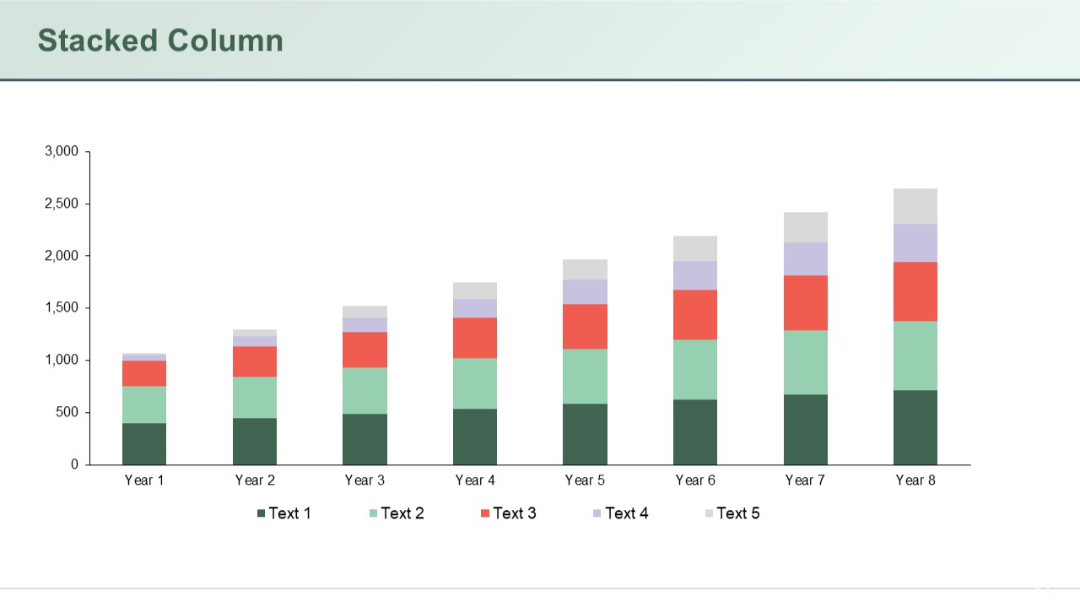
A stacked vertical column chart over eight time periods (Year 1–Year 8), with five colored segments per bar. Clean grid background.
PRO
A five-part circular diagram with petal-like segments arranged around a central text circle. Each segment is uniformly sized and colored differently.

PRO
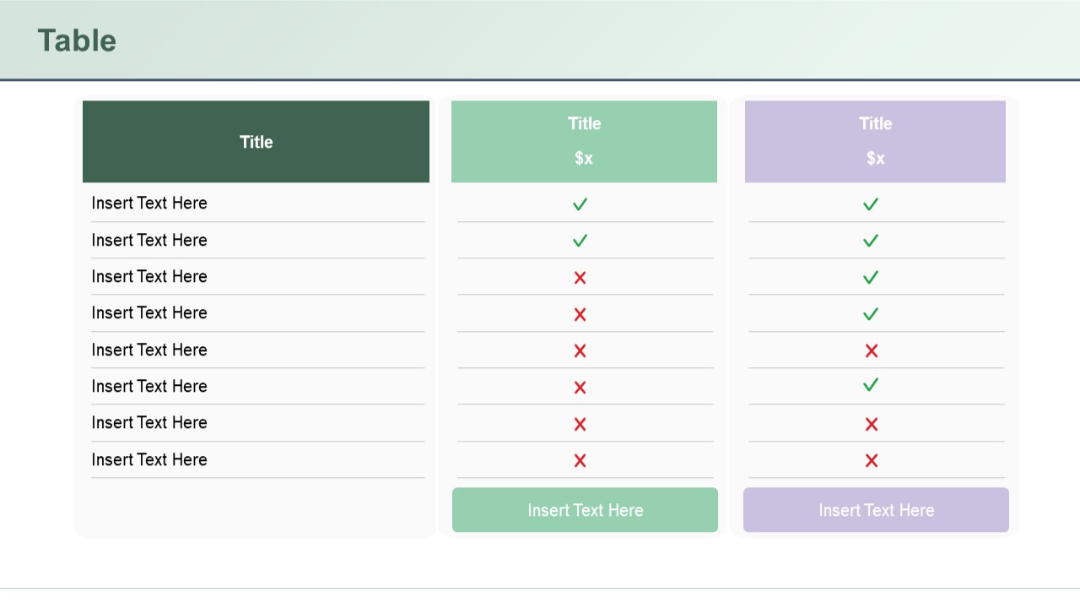
Three-column comparison table; first column is dark green with text rows, other two are pastel green and lavender with checkmarks and Xs; rounded rectangular layout.
PRO
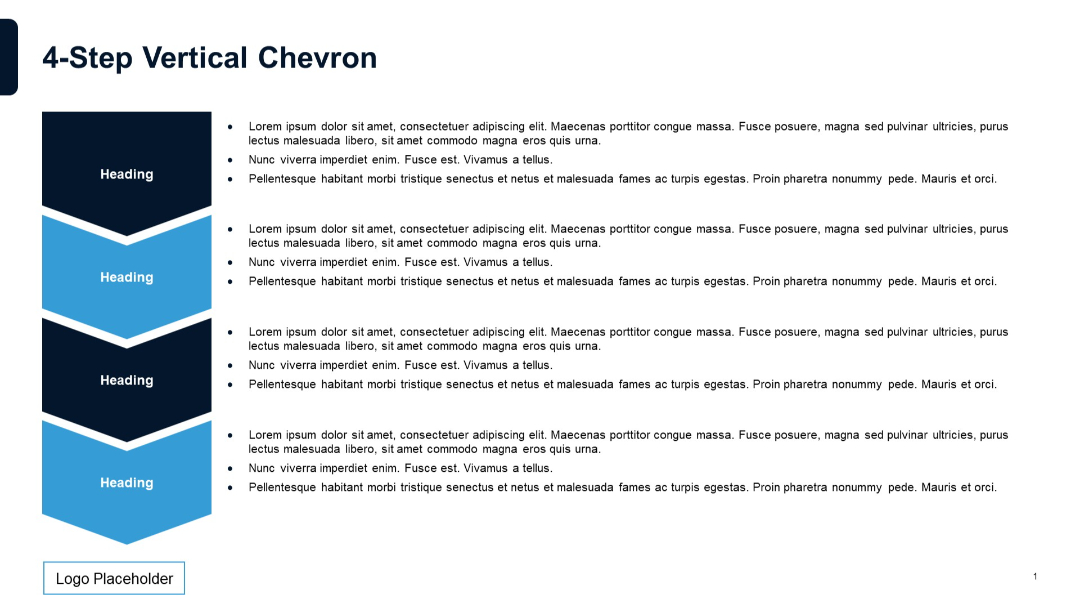
Four vertically stacked chevrons on the left. Right side contains corresponding bulleted text sections. Alternating dark and light blue chevrons.
PRO
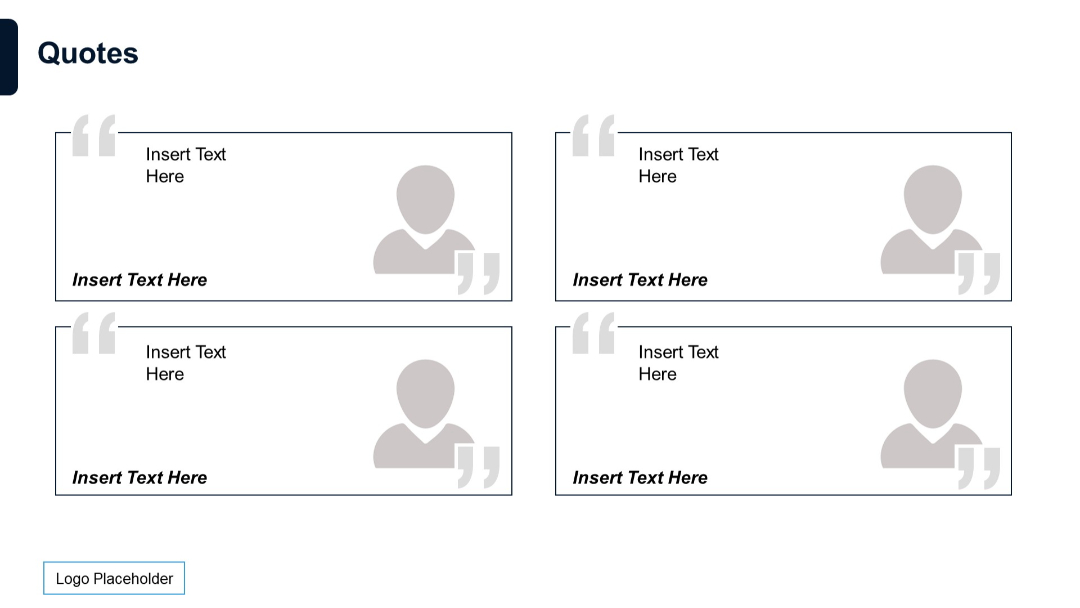
Four rectangular quote boxes arranged in a 2x2 grid. Each box contains placeholder text, a silhouette of a person, and stylized quotation marks. The layout is minimal, with a monochrome color scheme and a modern, clean design.
PRO
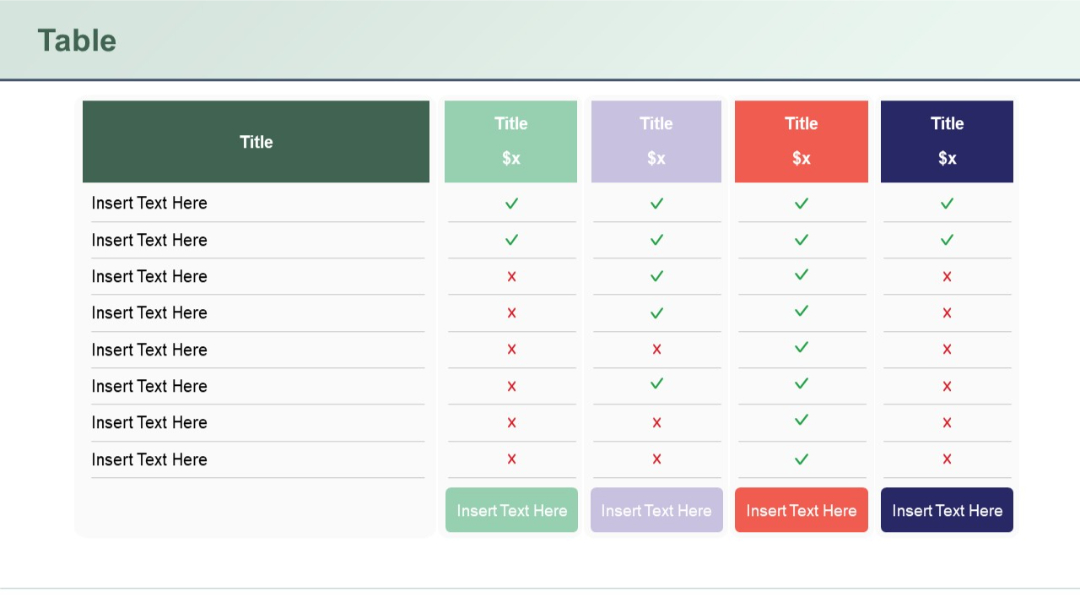
Multi-layered area chart with annotations (percentages inside arrows) pointing to peaks. Uses four series and blue gradient layers.