PRO
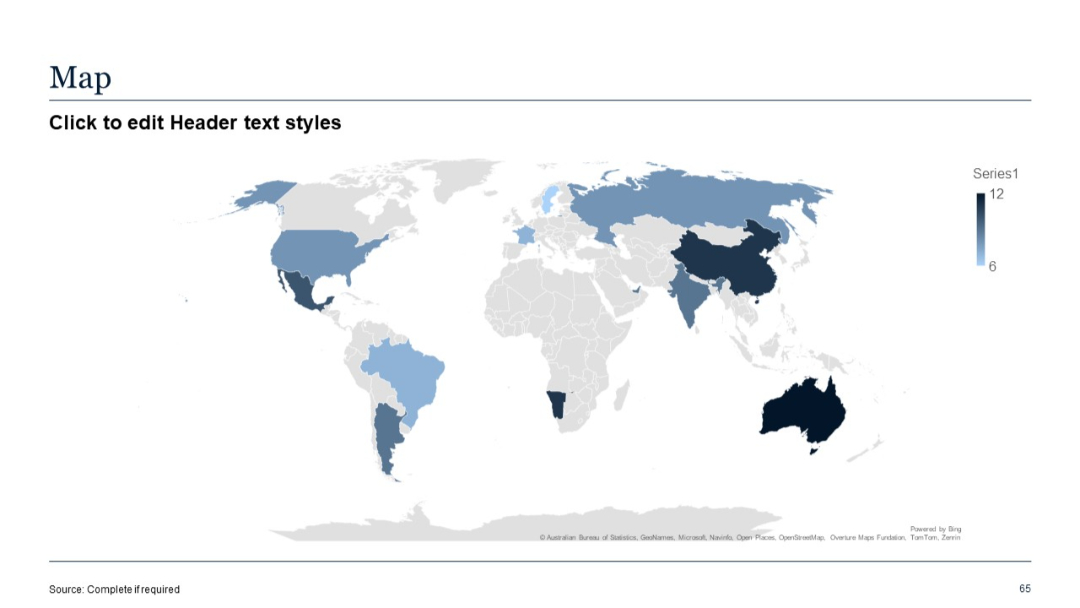
Choropleth world map shaded by data intensity; color gradient legend shown on the right.
PRO
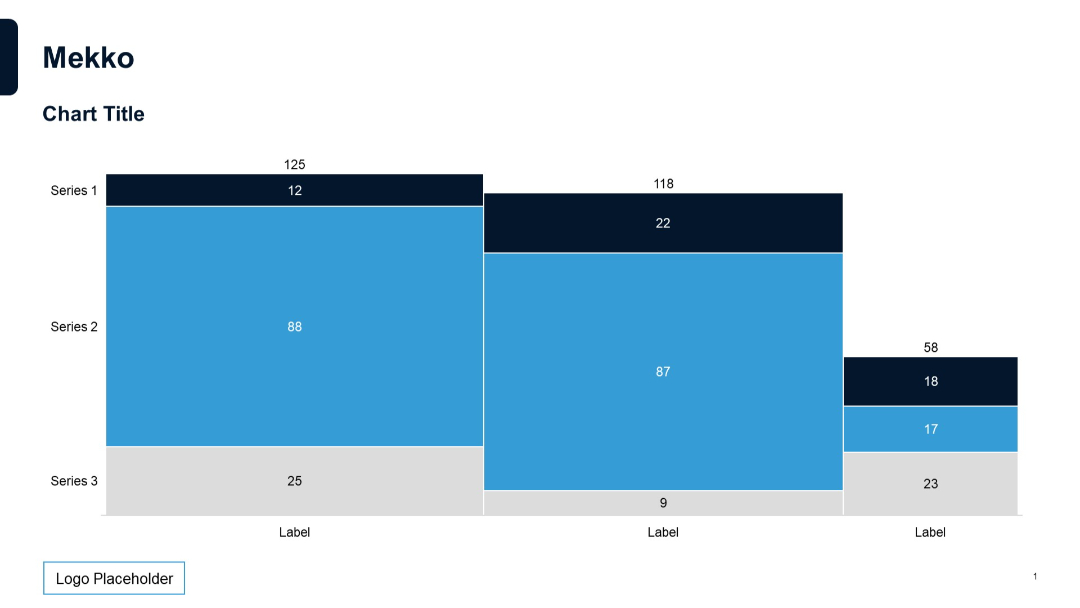
Marimekko chart with variable-width and height blocks, stacked and color-coded series, horizontal layout, minimal labels, and clean visual style.
PRO
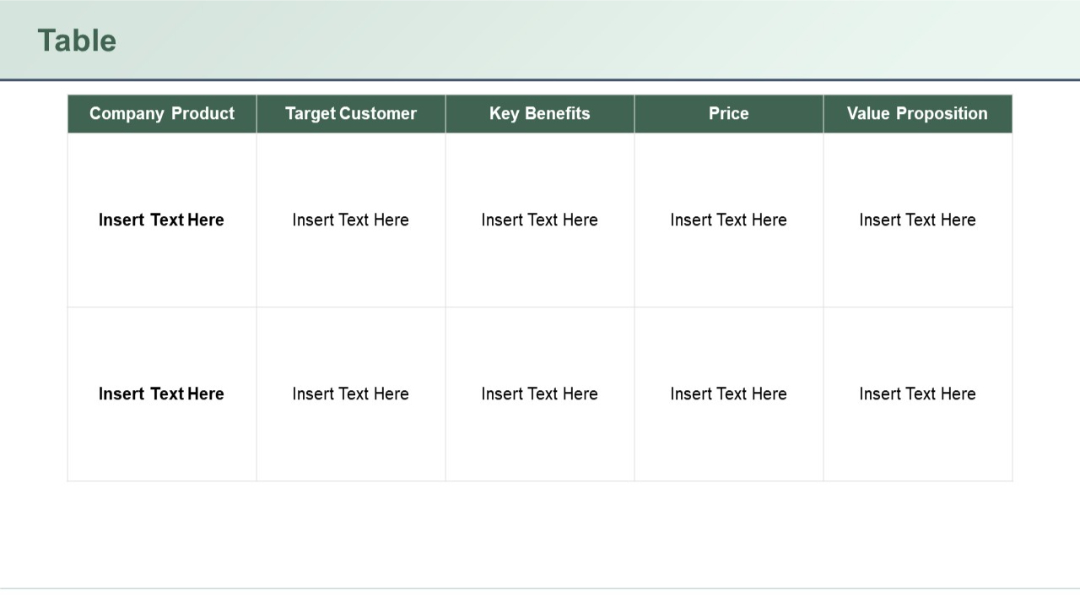
Clean 2x5 grid with bold column headers for product analysis. Uniform rows with white background and green headers.
PRO
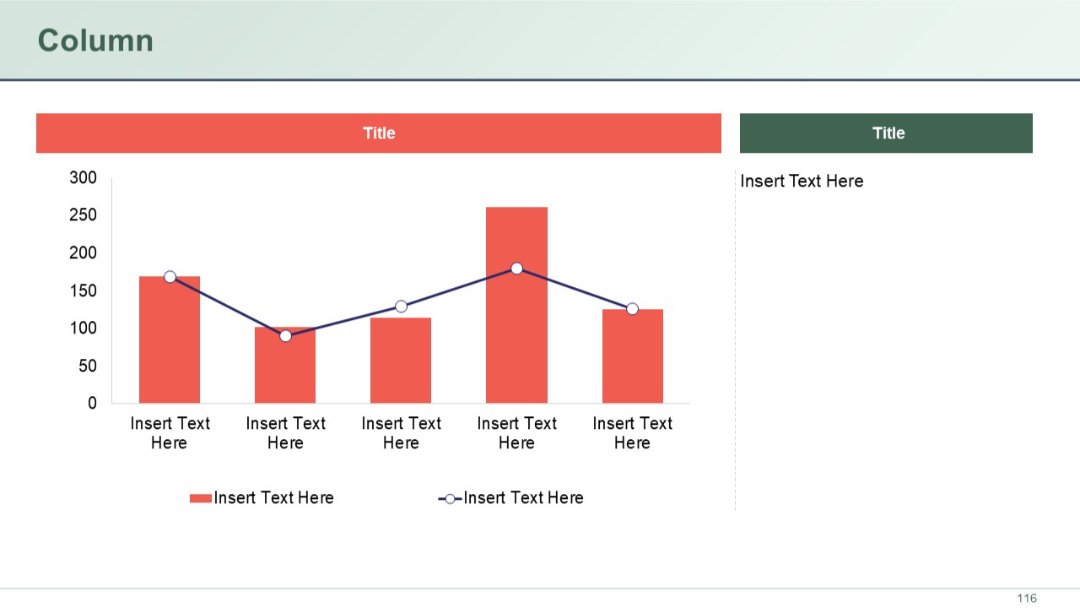
Left-aligned bar chart with red vertical bars and a line graph overlaid, accompanied by a sidebar with a title and placeholder text.
PRO
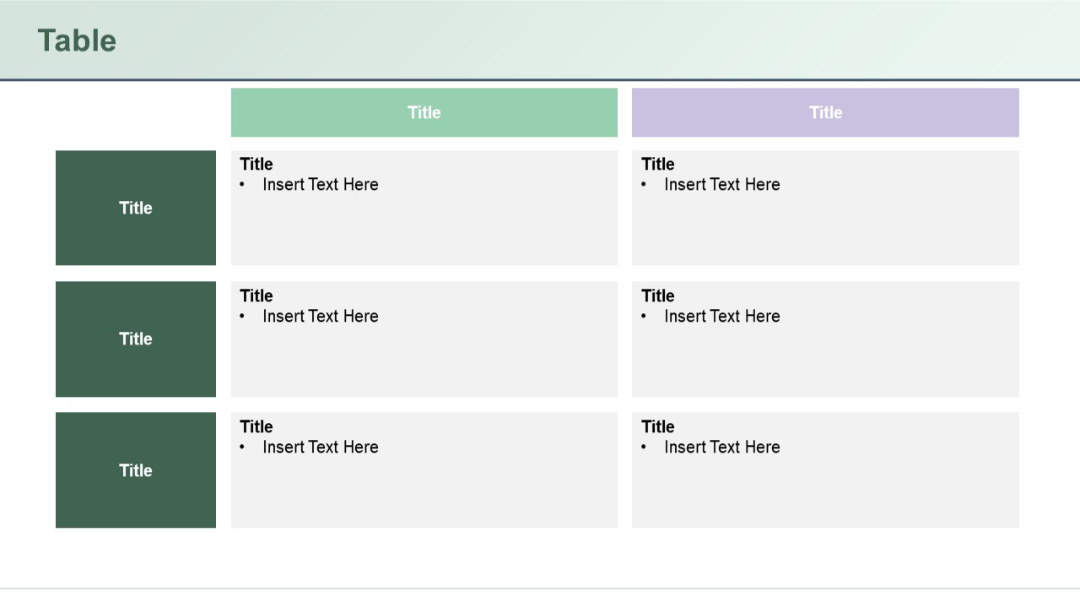
Three-row, three-column table; alternating soft green and purple headers; bullet points and placeholder boxes. Sidebar column in dark green.
PRO
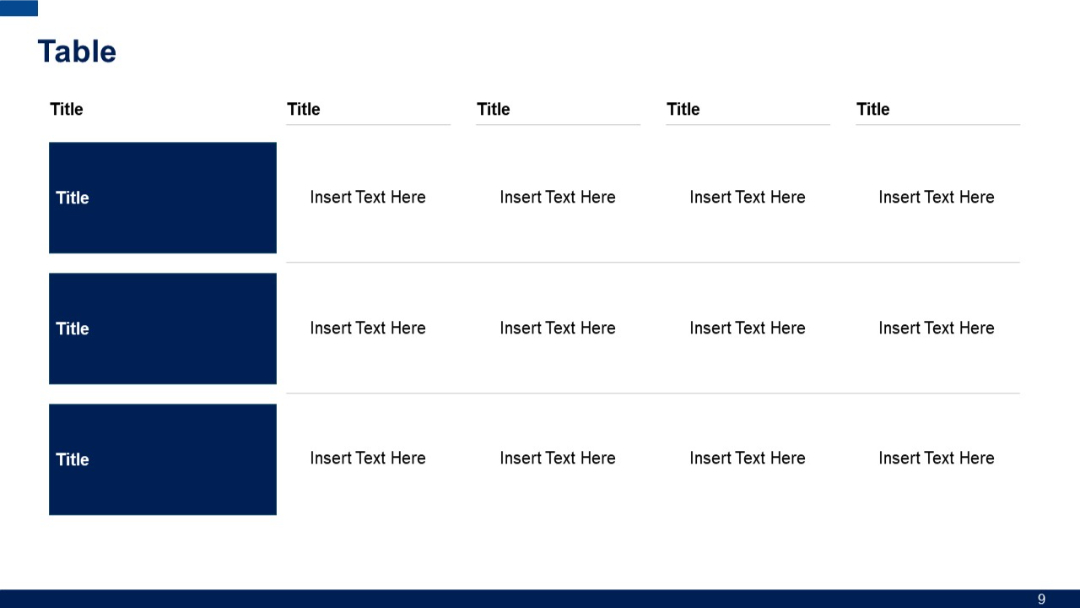
Similar to previous, but includes three title rows on the left; horizontal fields aligned per row, suggesting more grouped data layout.
PRO
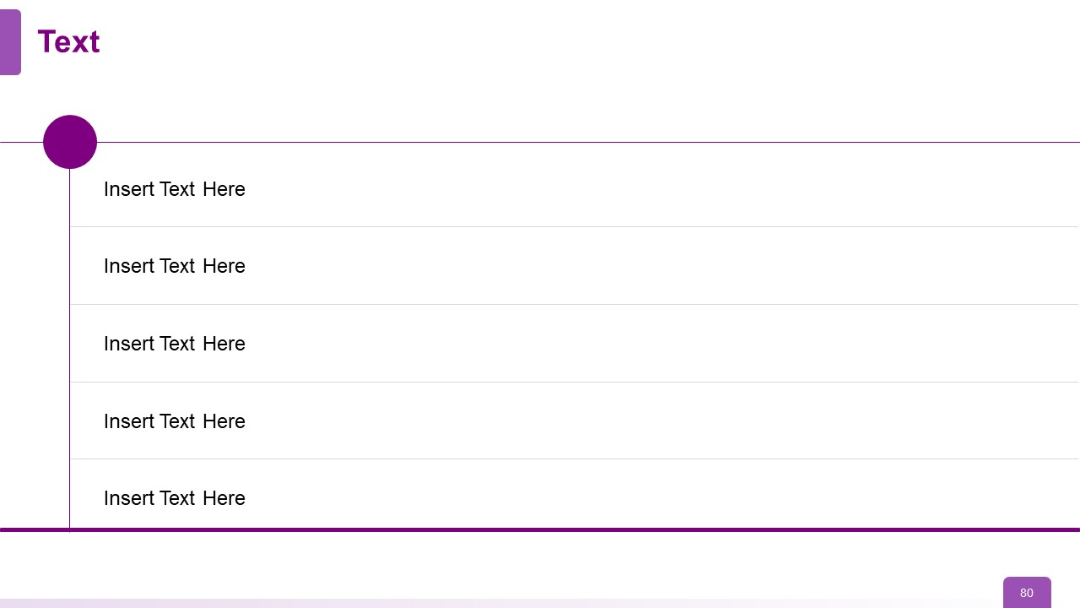
Timeline format with large vertical left marker and five horizontal rows of text entries. Purple highlight accent.
PRO
Two-column layout with rounded-top dark green headers connected by a curved line. White background and minimal placeholder text.

PRO
Four-column layout with blue headers and segmented title blocks beneath. Structured with equal vertical divisions for detailed comparison.

PRO
Five surrounding branches with icons and text stemming from a center ring; symmetrical layout.
PRO
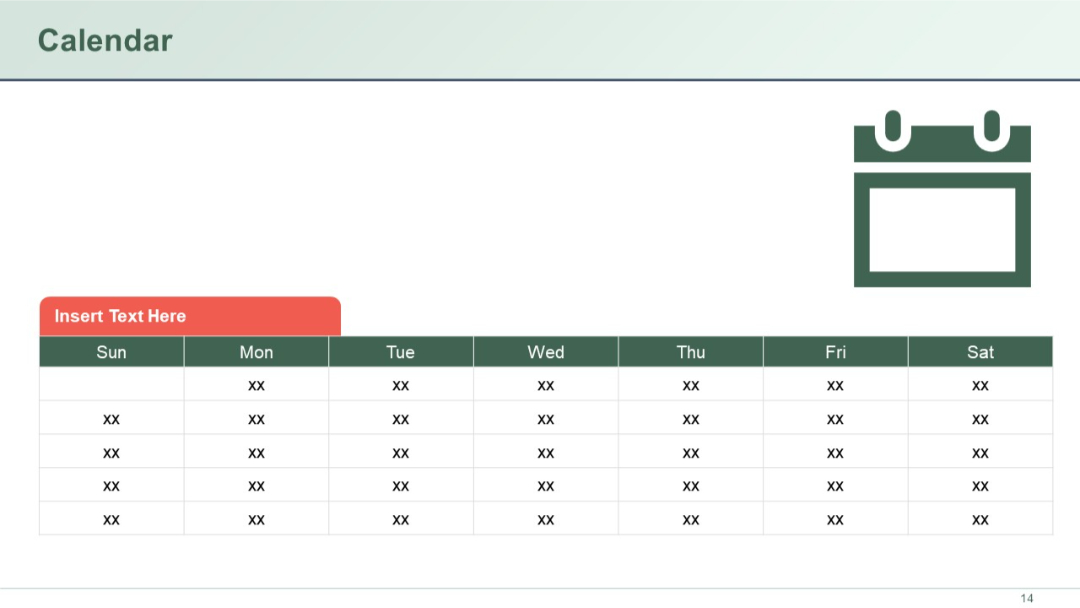
Calendar format similar to Slide 13 but with a heading box on top-left labeled “Insert Text Here” in red; calendar icon moved to top-right.
PRO
Two-section layout with circular photo placeholders under “Founders” (dark blue bar) and “Advisors” (light blue bar); minimalist and clean design.
PRO
Grid layout with six blocks (01–06), each with a number tab and placeholder text, arranged in two rows.

PRO
A three-column layout with a purple left sidebar (icon and text), and two main content areas in white and gray, each containing bulleted list placeholders.
PRO
Four horizontally aligned minimalist blocks with circles on the right numbered 01–04 and text lines extending from the left.
PRO
Three vertically aligned rectangular blocks with icons above each, containing headers and bullets. Balanced and icon-supported design.

PRO
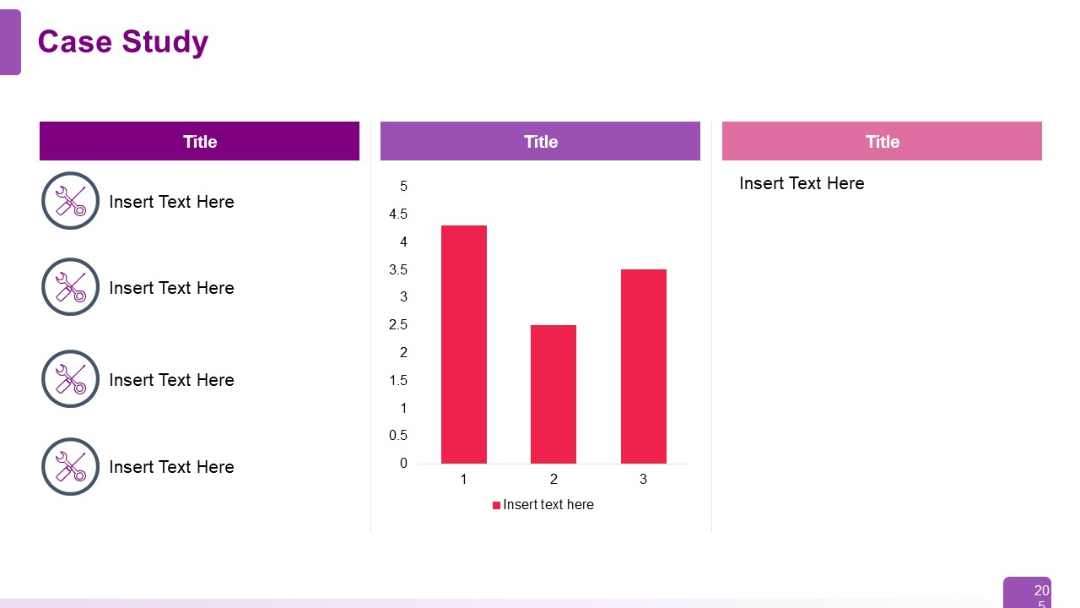
Divided into three vertical columns: left with icons and bullet points, center with a vertical bar chart, right with a title and placeholder text.
PRO
Grid layout with six blocks, each with an icon, title, and placeholder text. Colors alternate per block.
PRO
Left: Doughnut chart evenly divided into three equal segments, each labeled 33%. Right: Three rounded rectangular text boxes with icons.
PRO
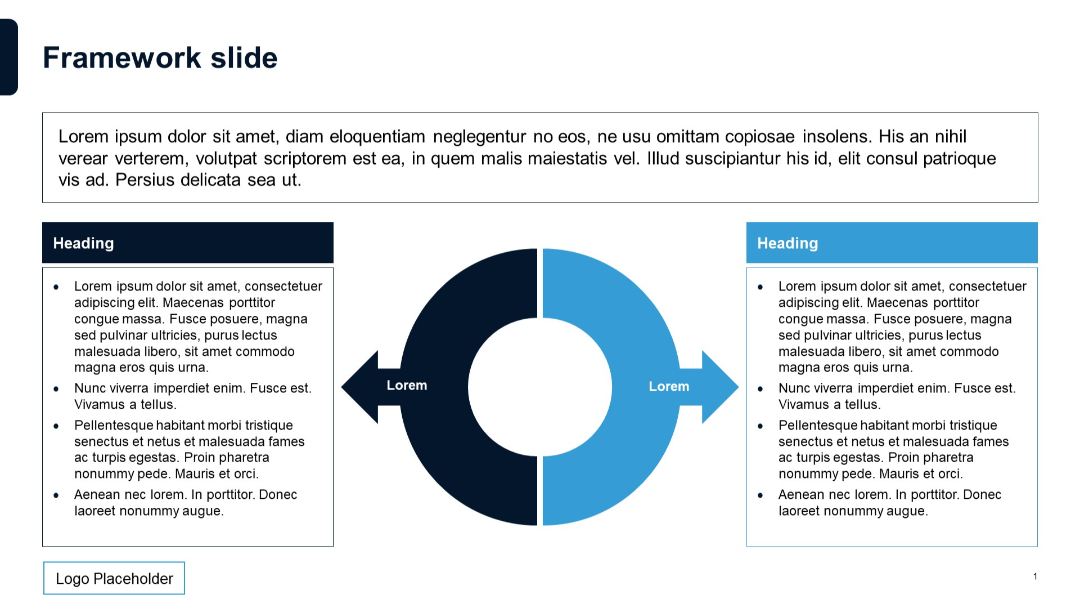
Text block introduction at top, central circular split-arrow diagram, with text boxes on each side.
PRO
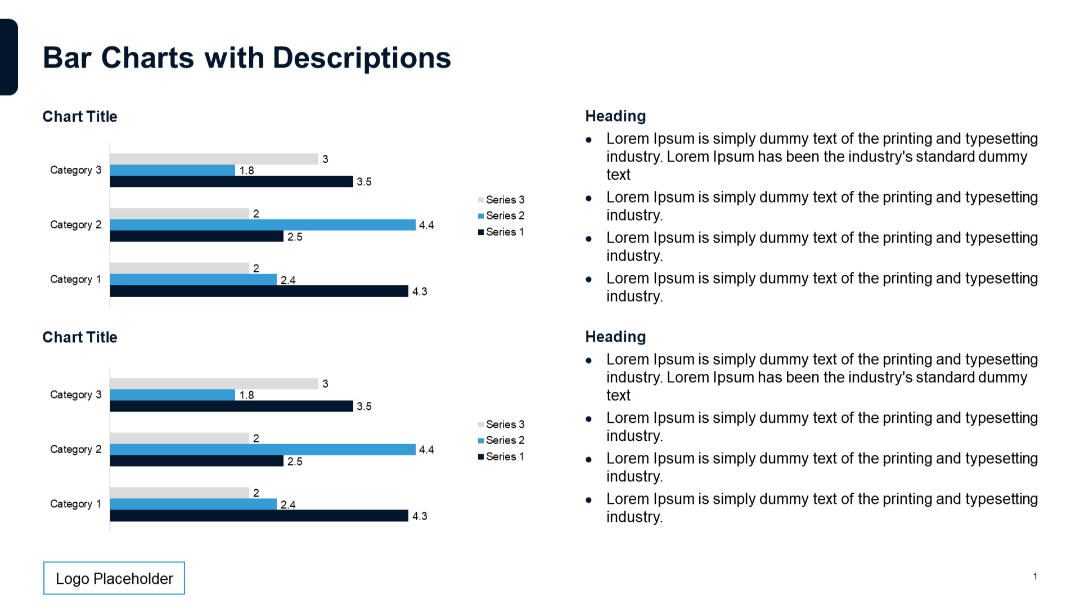
Two bar charts on left with horizontal bars representing three categories. Right side includes grouped bullet point text under section headings.
PRO
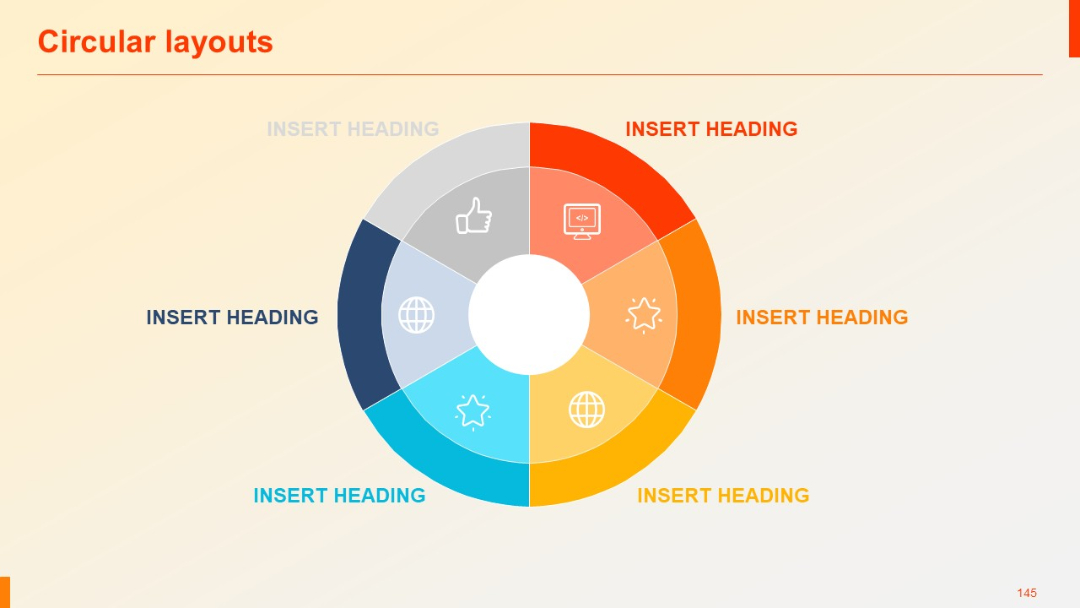
Six-segment concentric ring diagram, colorful layout with icon representation per segment.
PRO
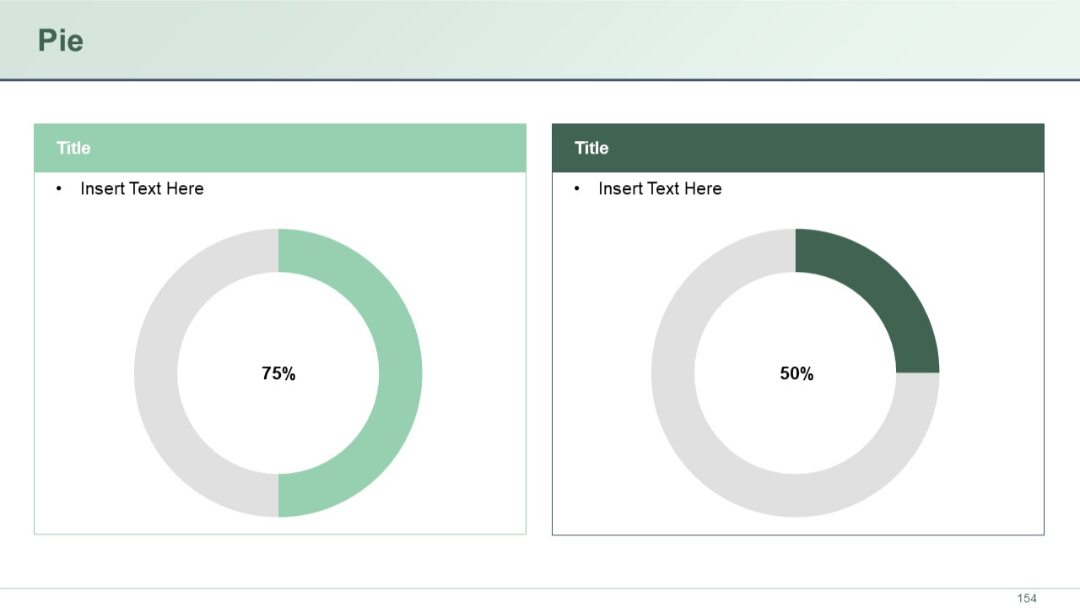
Two large donut charts side by side with corresponding text headers and placeholder bullet points.
PRO
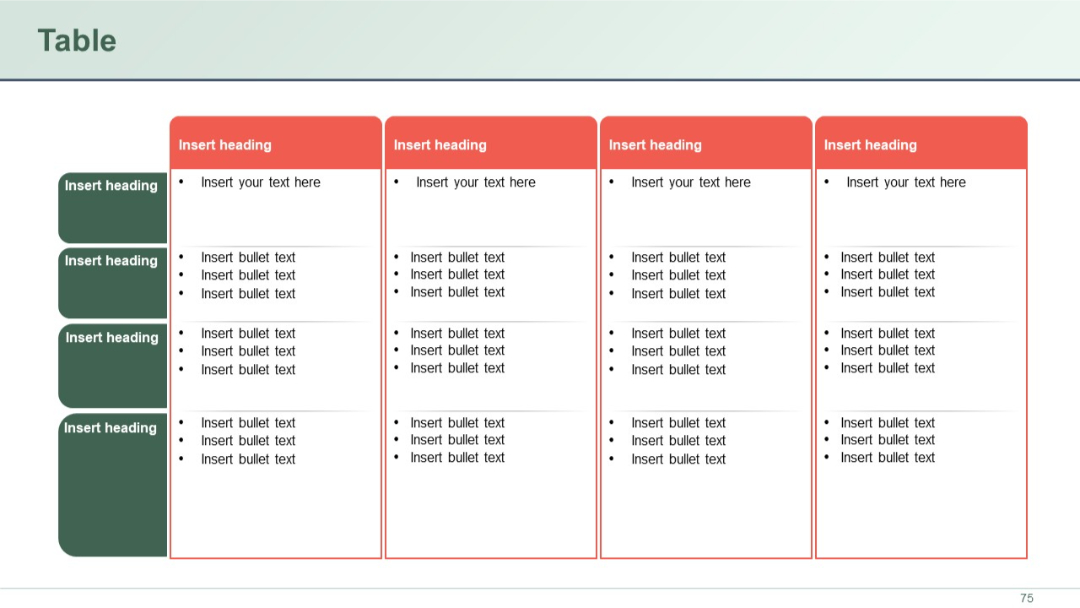
A multi-column and multi-row bullet table. The first column contains rounded headers on a green background; data columns have red borders and white backgrounds.
PRO
Vertical list layout with five sections numbered 1 to 5, each with a bolded title and placeholder text. Color-coded numbering runs alongside the left.
PRO
Vertical list with colorful diamond-shaped icons (red to blue gradient) beside text items. Clean separation between rows.

PRO
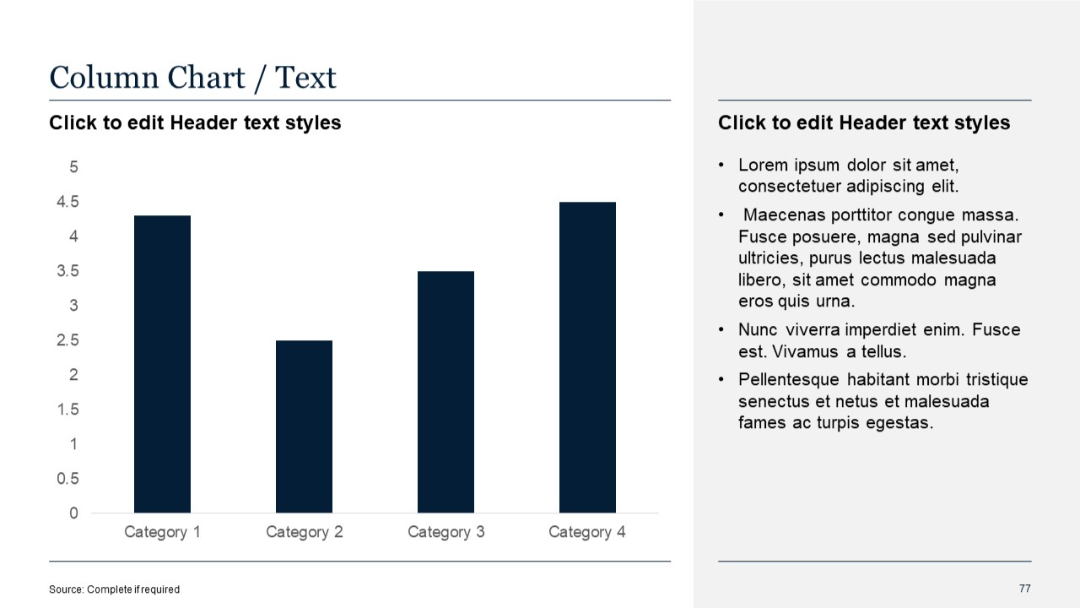
Vertical column chart with four simple bars and consistent color scheme. Bullet points are placed on the right-hand side.
PRO
A clean, evenly spaced grid of business, communication, and digital interaction icons including graphs, magnifiers, chats, and data charts.
PRO
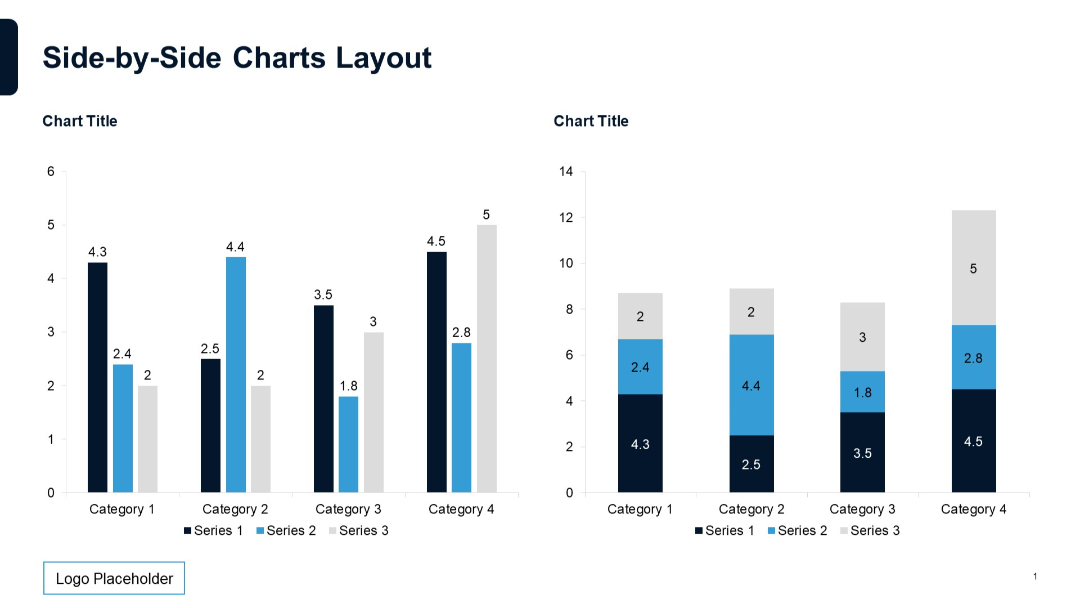
Two column charts: one vertical grouped bar chart and one stacked bar chart. Matching color schemes and categories.
PRO
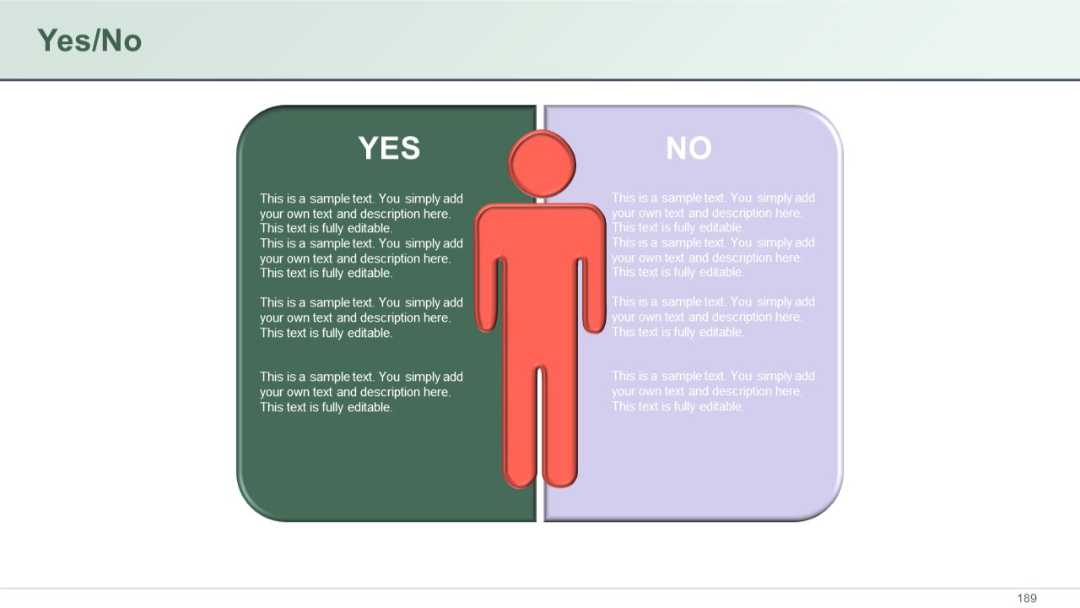
Symmetrical layout split into two panels: YES (green) and NO (purple), with a central red human icon as a visual divider.