PRO
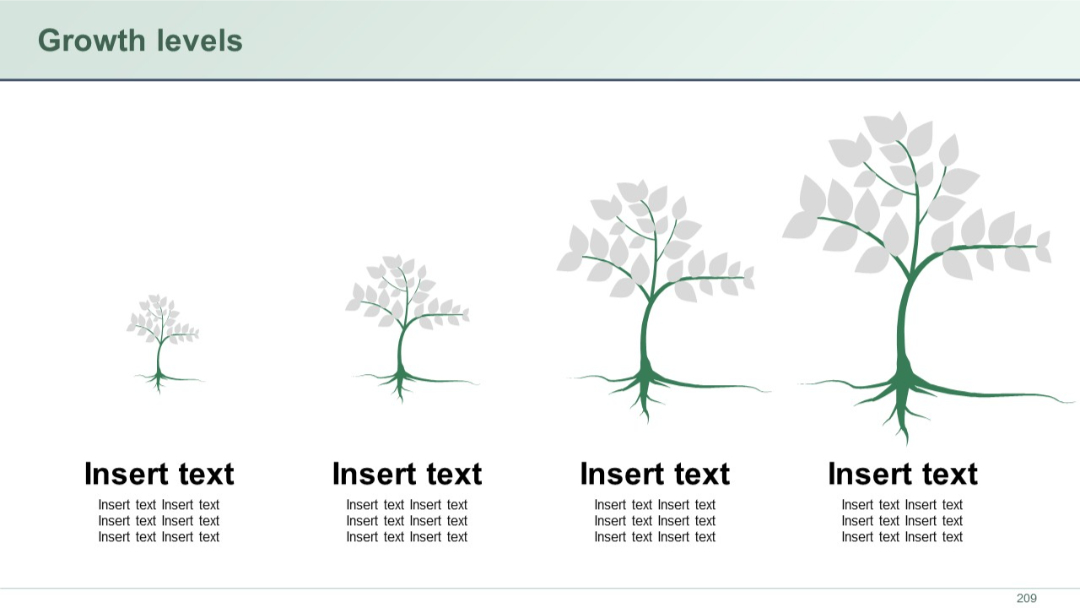
Four tree illustrations growing in size from left to right. Each has space below for descriptive text. Simple and symbolic.
PRO
Horizontal timeline with two vertical branches (left and right), each with four circular icons and placeholder text beside each. Clean and symmetrical.
PRO
Four vertical rounded boxes with S, W, O, T at the top; sections for entering text under each.
PRO
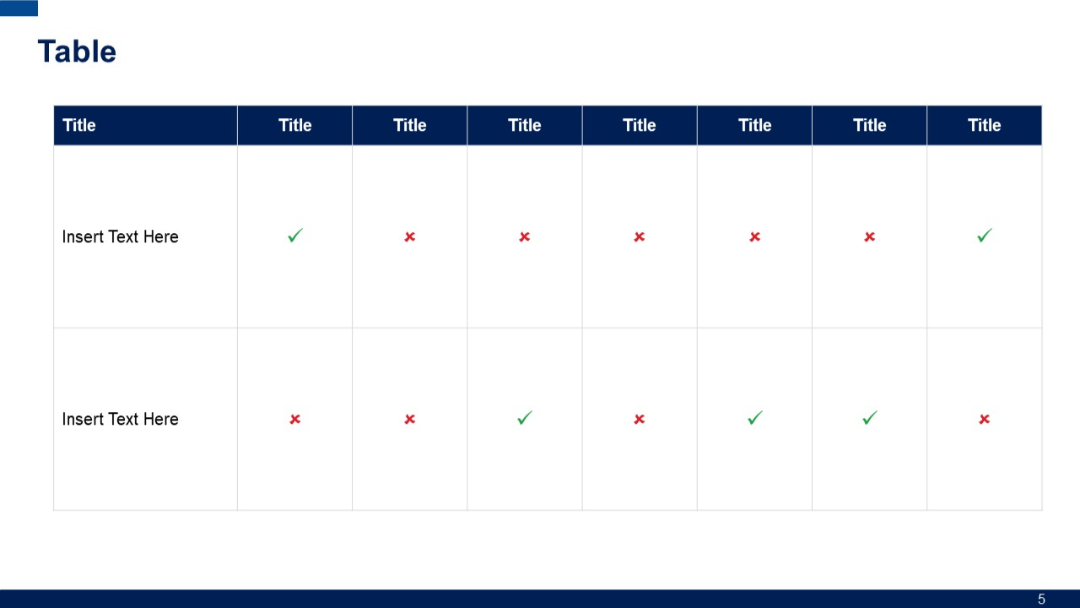
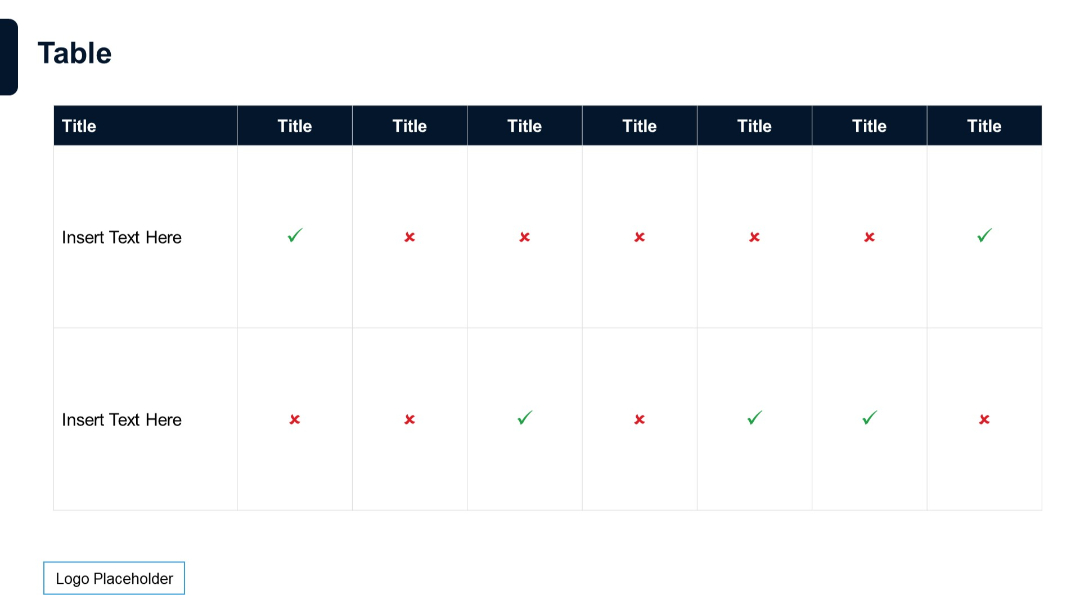
A grid-based table with alternating checkmarks and crosses; top row uses dark blue background for headers; two rows for data input.
PRO
Five-row vertical layout with shaded title blocks on the left, paired with corresponding horizontal rows of four text-entry cells each.
PRO
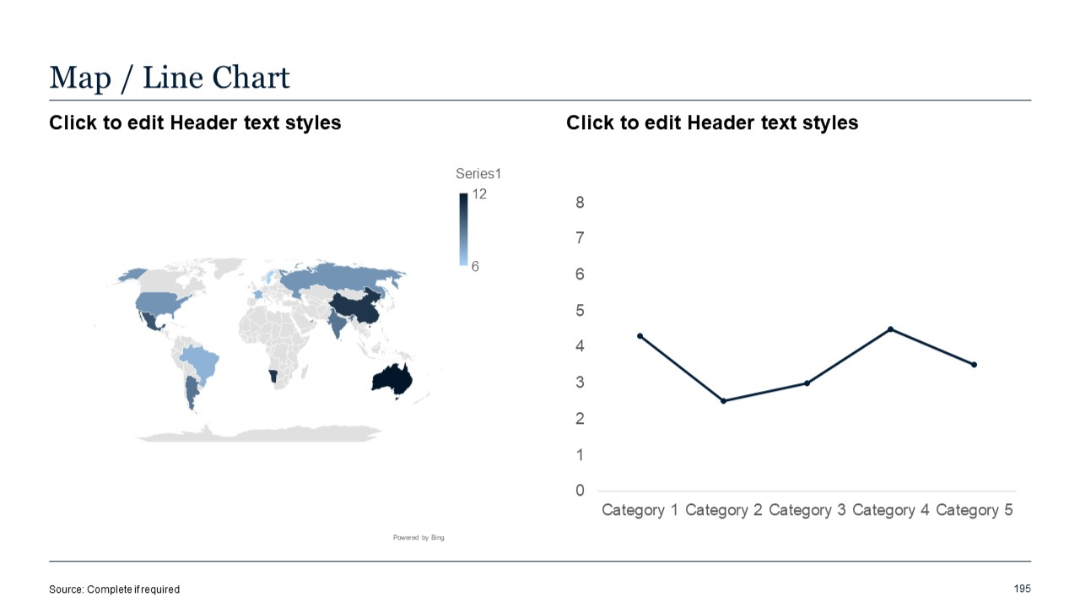
Left: world map heatmap; Right: line chart displaying trends across five categories. Clean layout.
PRO
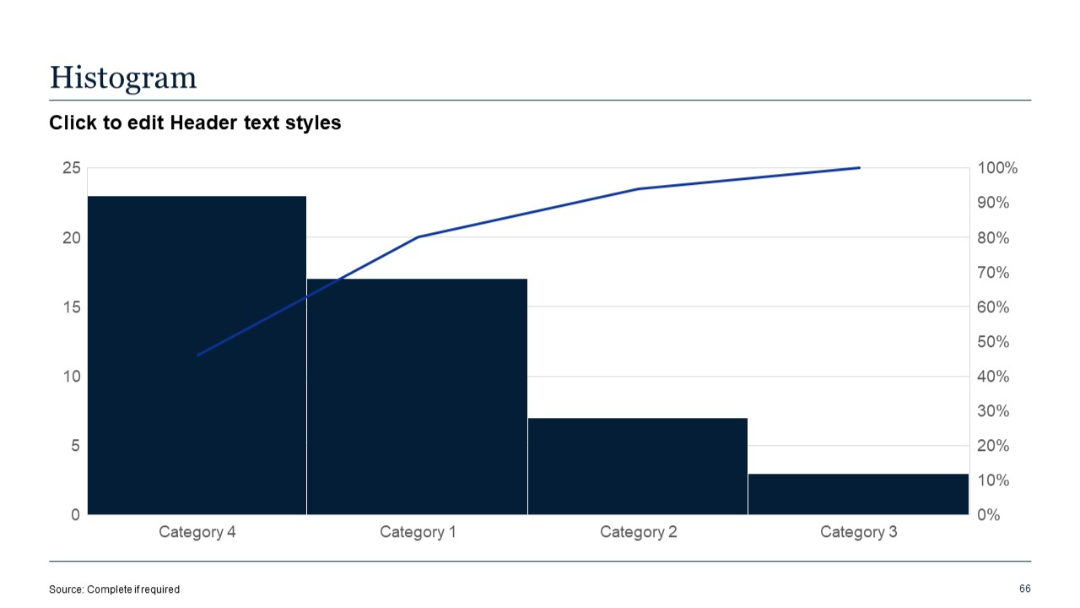
Bar chart with cumulative line overlay; vertical bars sorted by categories on x-axis.
PRO
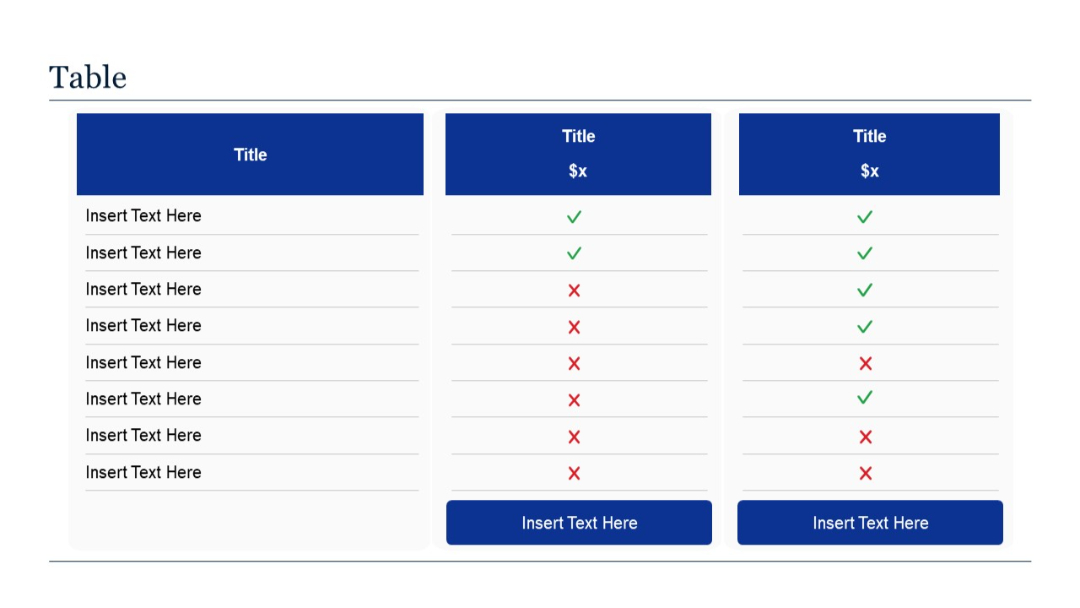
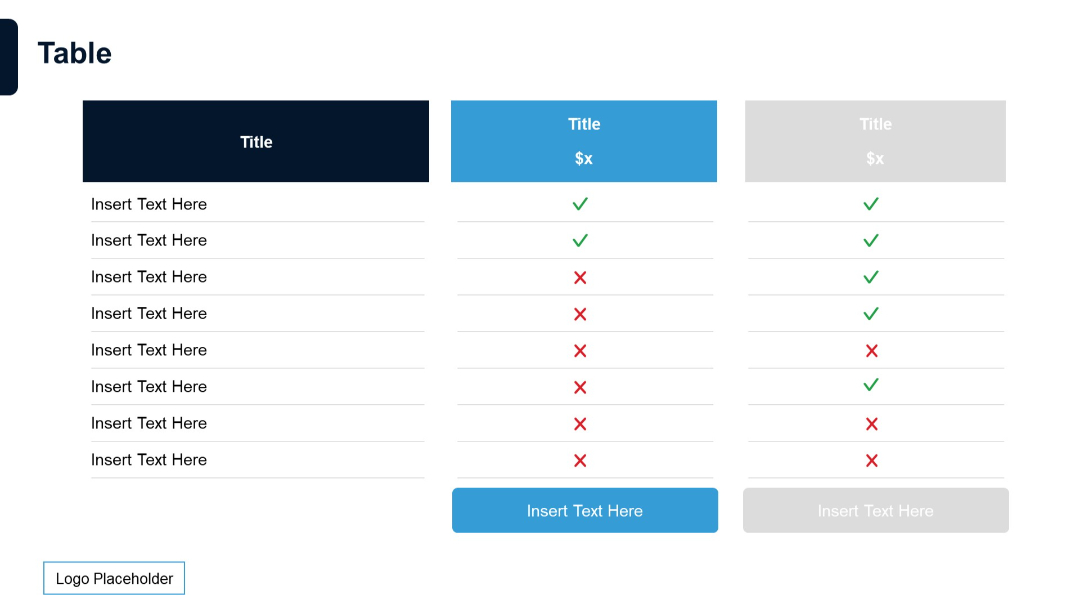
A 3-column vertical comparison table. First column lists features; next two columns use checkmarks (green) and crosses (red) to indicate feature presence.
PRO
Two-column layout with six rectangular numbered blocks, each paired with placeholder text horizontally.
PRO
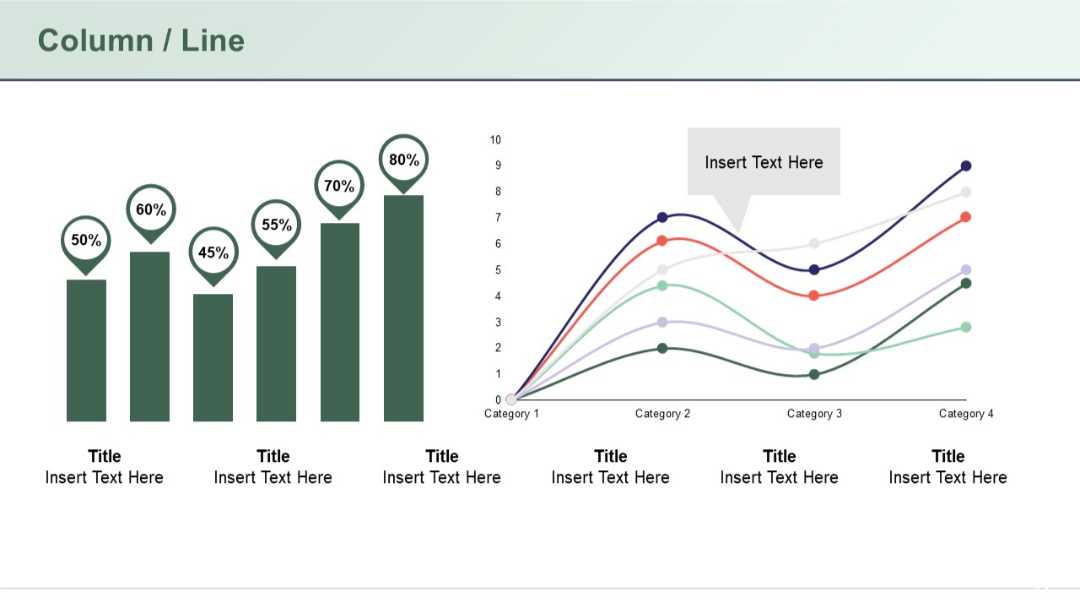
The slide features a bar chart with percentage labels above each bar on the left side, and a multi-line graph on the right with markers and a callout text box.
PRO
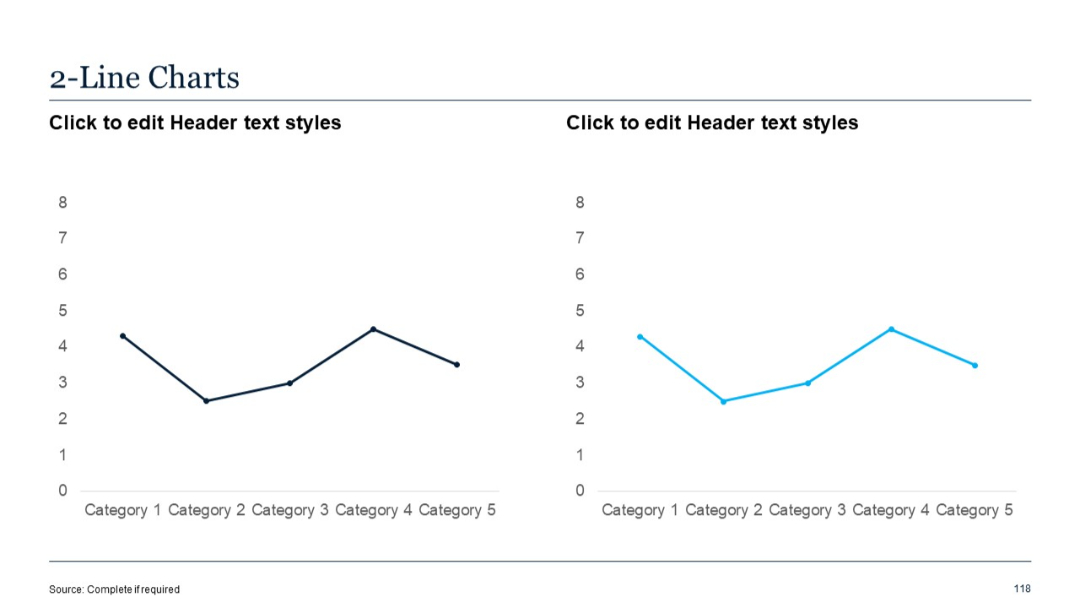
Dual panel line charts, each with one line series, showing category trends; no right-side text panel.
PRO
Table with 2 rows and 8 columns; checkmarks and crosses used as indicators; dark header row; minimalist design.
PRO
Similar format to Slide 178 but with fewer columns and subtle color variation; maintains pricing title and checkmark layout.
PRO
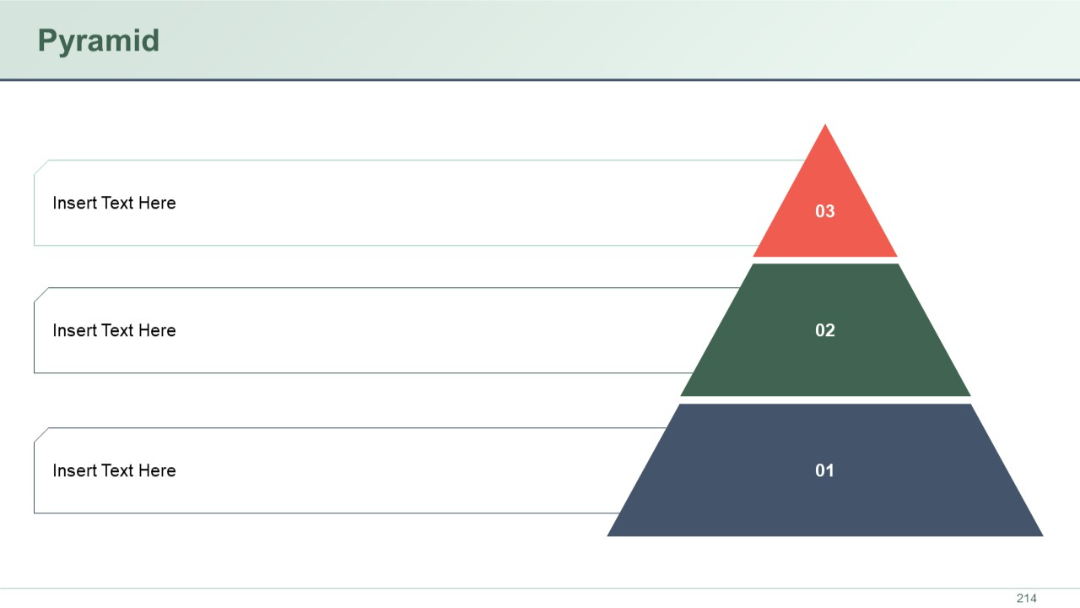
A three-layered right-aligned pyramid with colored blocks labeled 01–03, each level accompanied by aligned text boxes for descriptive content.
PRO
Horizontal funnel with two input paths leading into a shared funnel shape. Input icons and text are on the left; output title and text on the right.

PRO
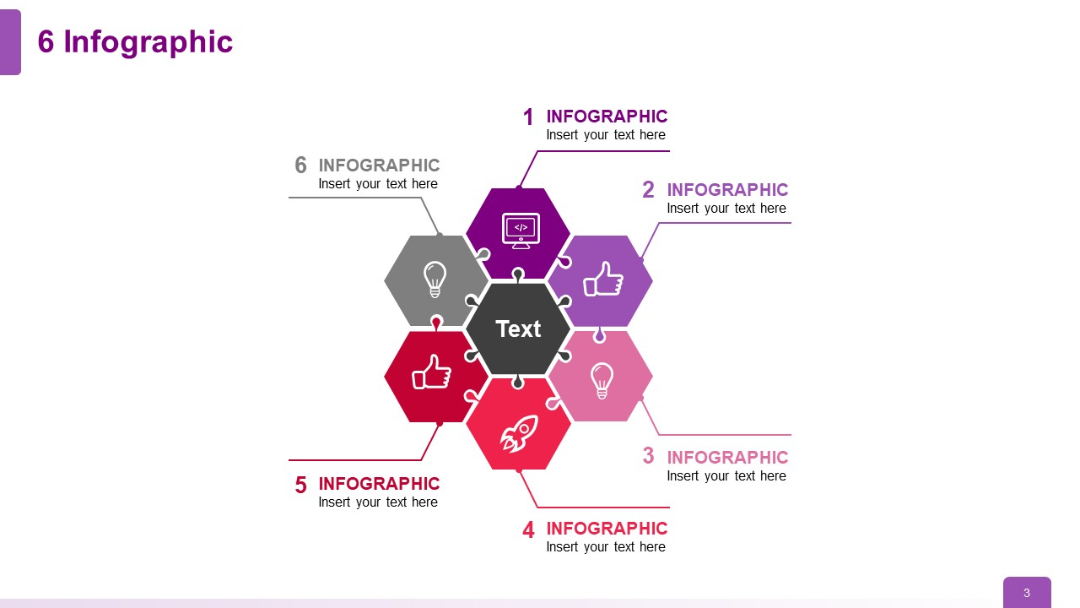
Central hexagon surrounded by six colored hexagons with icons and text, forming a beehive-style layout.
PRO
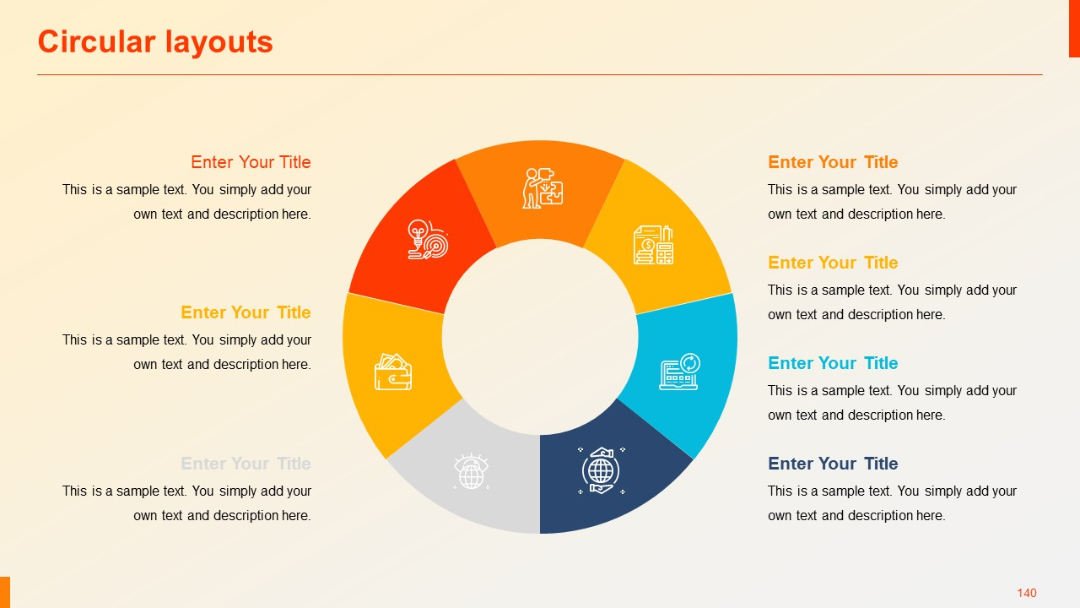
Flat-design circular pie layout with eight even slices and central negative space. All segments have icons and placeholder content next to them.
PRO
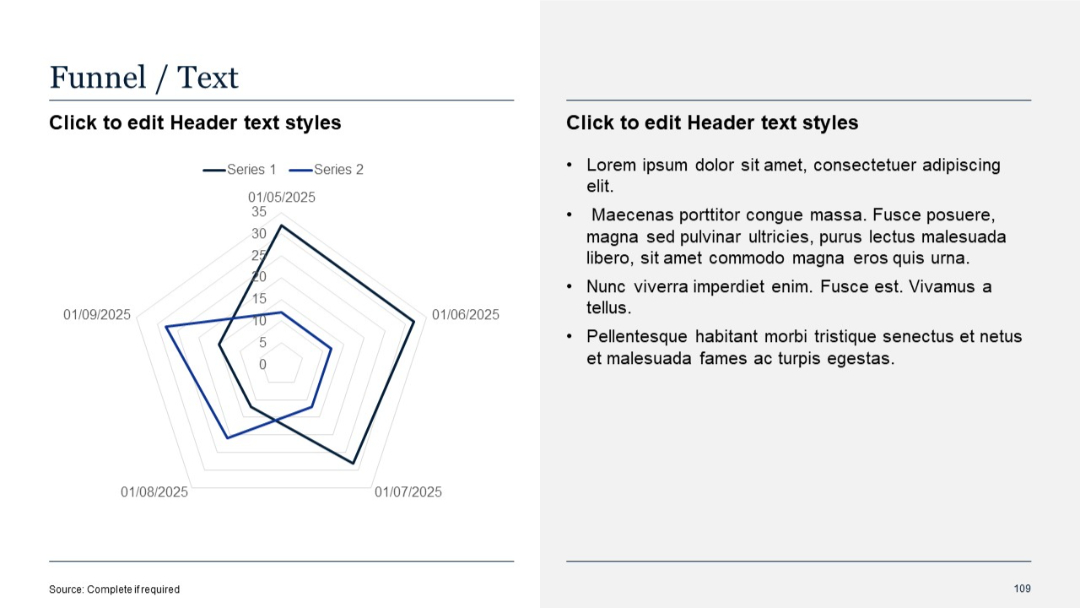
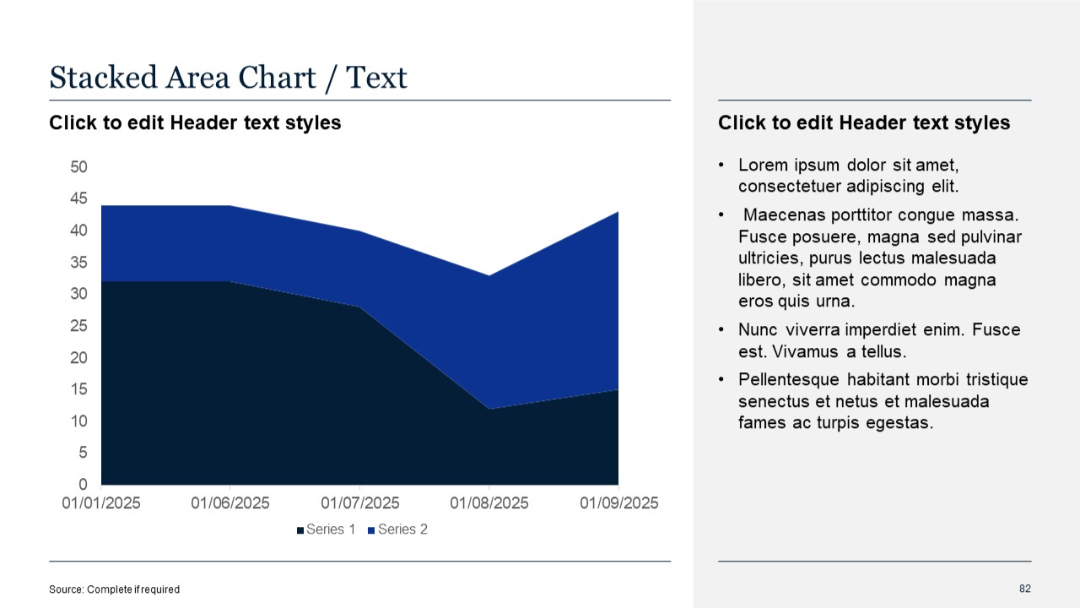
Radar chart/funnel format on the left; bullet point text on the right.
PRO
Grid-based Gantt chart with horizontal bars and milestone numbers. Text placeholders used throughout.

PRO
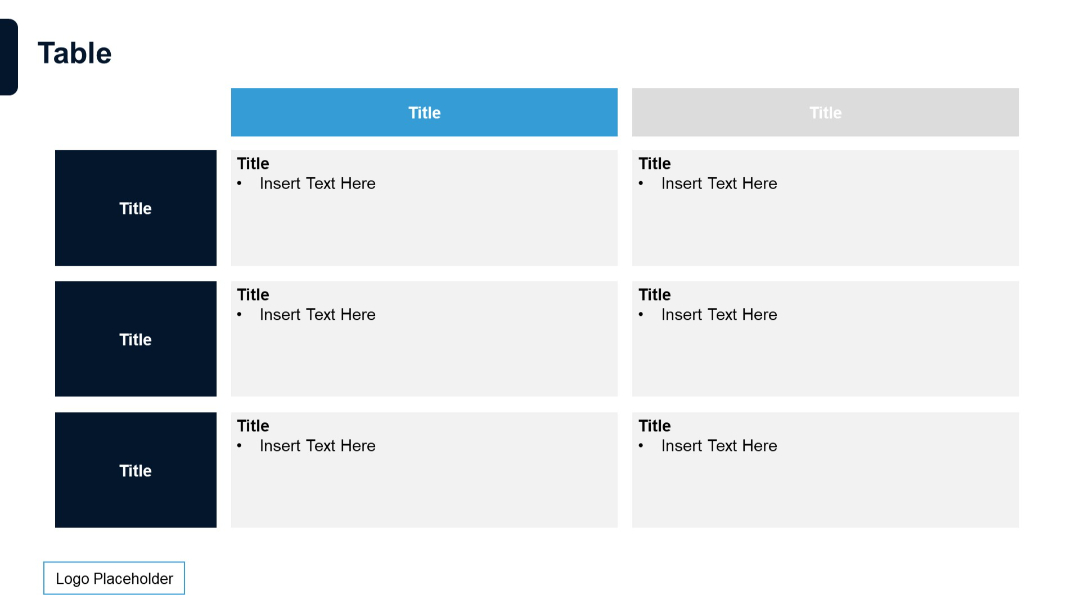
Color-coded table layout with dark blue row headers and blue/grey column headers. Bullet points in cells for emphasis.
PRO
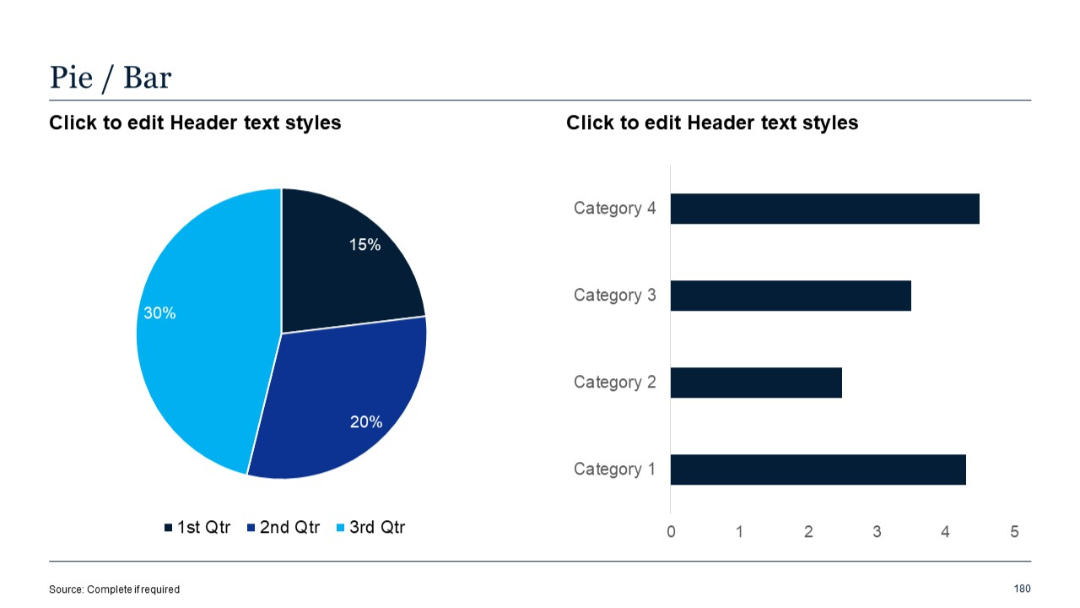
Pie chart on the left and a simple horizontal bar chart on the right.
PRO
Two-column layout with bold headers and color-coded background blocks
PRO
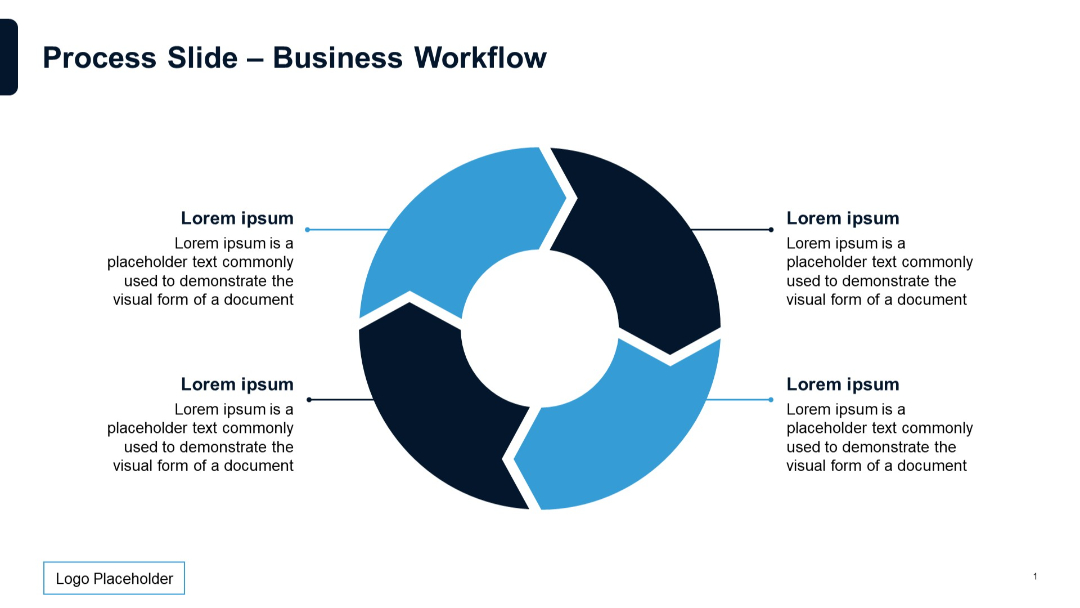
Circular segmented diagram with arrows, surrounded by text and labels.
PRO
Similar layout as Slide 81, with a more pronounced Y-axis scale and denser data visualization
PRO
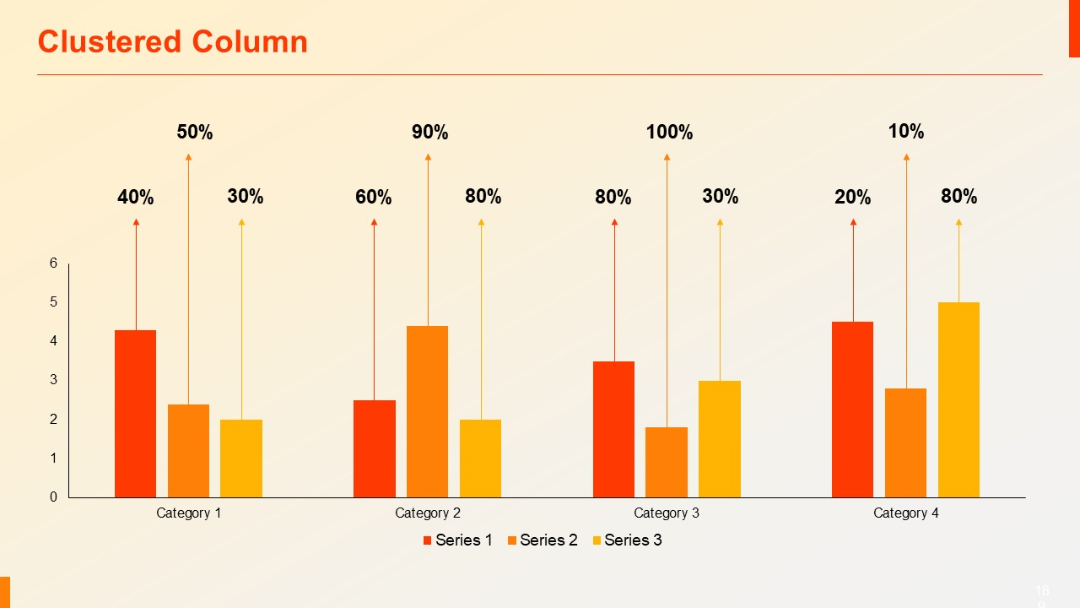
Vertical clustered column chart with four grouped bars per category. Each group has percentages and arrows above. Clean white background.
PRO
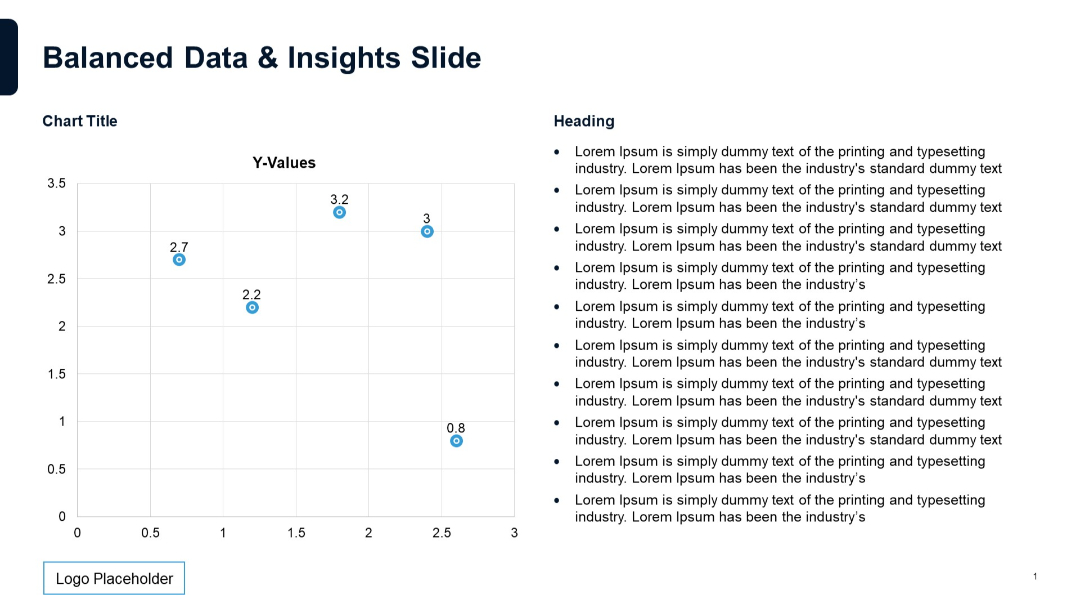
Scatter plot chart on the left labeled with Y-values. Even split between chart and bullet text section.
PRO
Left side has dark triangle overlay with title; right side shows a group photo of professionals in discussion.

PRO
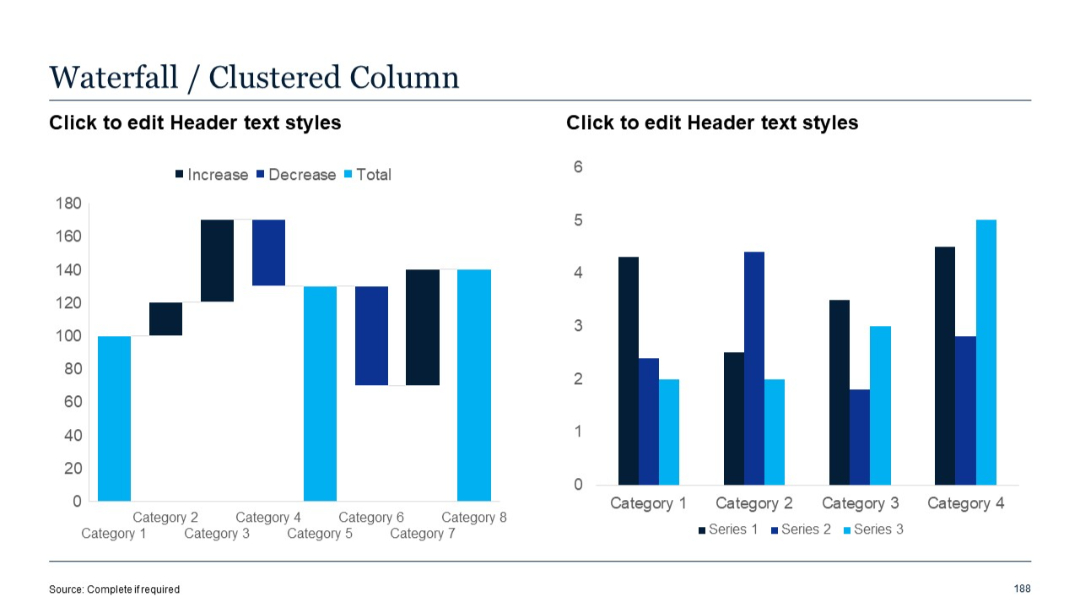
Left chart is a waterfall; right chart is a clustered column bar showing three data series for each category.
PRO
A large central quote block with bold quotation marks and a dark title bar above; ample space for text.

PRO
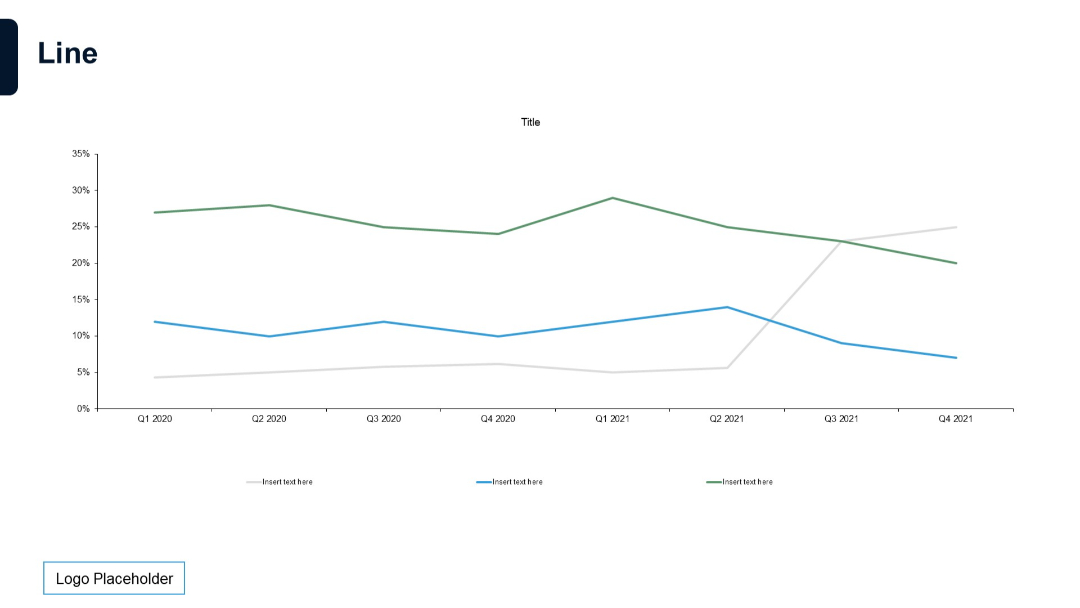
Full-width line chart with four series. Simple grid with quarterly time axis and minimal styling.