My Account
My Slides
Search by Category
Pricing
Templates
View All Templates
Download Template Slides
✦ AI Search
Feedback
Login
Logout
Get Started
Browse all Slides
Browse all Slides
Create a FREE Account
Instant access to 1,000+ real slides from top companies like McKinsey, BCG, Goldman Sachs, Google and many more!
First Name
Last Name
Email
Password
I agree to all
Terms & Privacy Policy
Thank you! Your submission has been received!
Oops! Something went wrong while submitting the form.
Have an account?
Sign in
Saved Slides
Total No. of slides saved
0
↻ Refresh
✖ Clear all
Line chart tracks changes in investors' priorities over time for financially healthy companies, highlighting shifts during and after the COVID-19 pandemic.
Investment Analysis
Financial Services
Highlights the evolving focus of investors on short-term goals versus long-term capabilities, showing how priorities shifted significantly during the pandemic. Useful for understanding investor behavior changes.
investors, focus, short-term, long-term, pandemic
false
Investment Analysis
Financial Services
Single Chart
BCG
Add to my slides
Remove from favorites
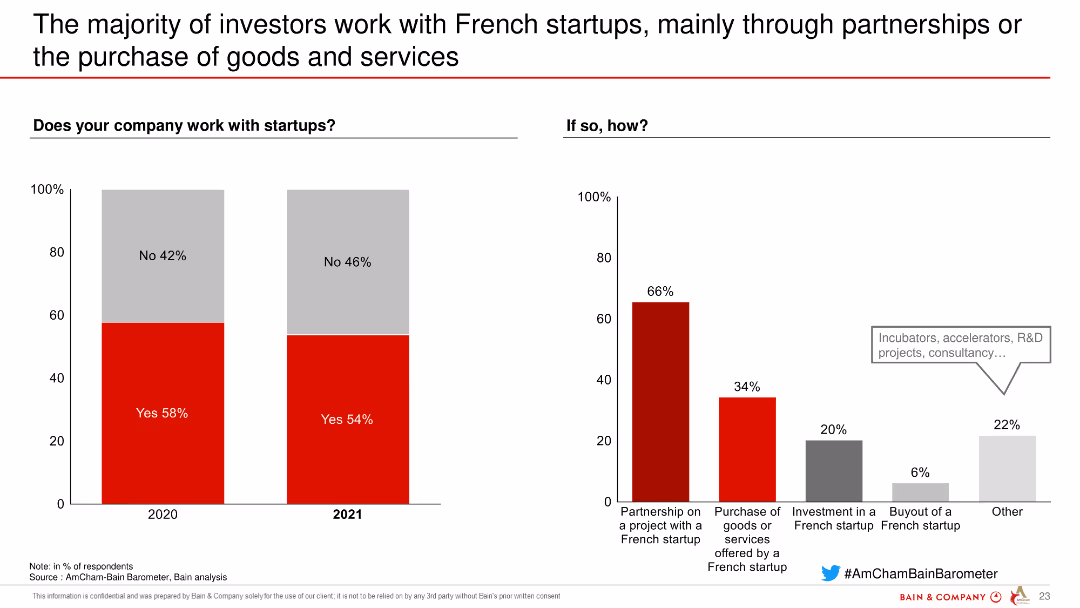
This slide features column charts showing the percentage of companies working with startups and the ways they engage with them, such as partnerships, purchases, and investments.
Market Analysis and Trends
Financial Services
The slide presents data on how investors work with French startups, including partnership projects, purchase of services, investments, and buyouts, highlighting the involvement level.
investors, French startups, partnerships, services, investments, buyouts, financial services
false
Market Analysis and Trends
Financial Services
Multiple Chart
Bain
Add to my slides
Remove from favorites
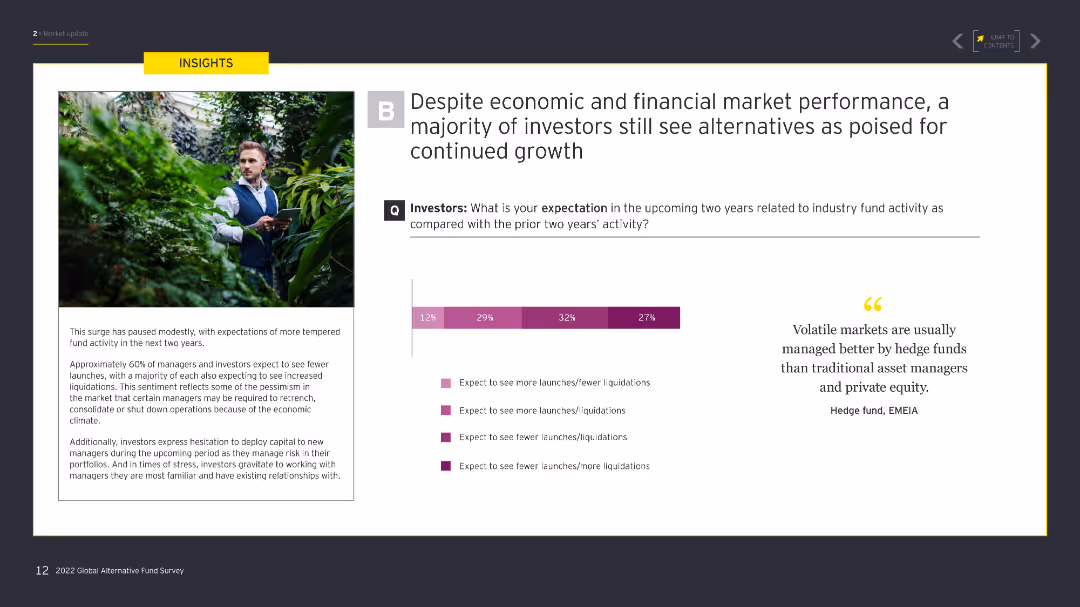
The slide features a large image of a man in a garden on the left, with a column chart on the right showing investor expectations for industry fund activity over the next two years.
Market Analysis and Trends
Financial Services
This slide presents data on investor expectations for industry fund activity in the next two years, comparing anticipated increases or decreases in fund launches and liquidations.
investors, fund activity, expectations, launches, liquidations
false
Market Analysis and Trends
Financial Services
Mixed Chart
EY
Add to my slides
Remove from favorites
This slide includes two line graphs tracking investor focus over time.
Investment Analysis
Financial Services
Depicts how investor priorities between long-term and short-term results fluctuated from 2020 to 2023, reflecting a shift towards long-term investments during COVID-19.
investors, long-term, short-term, focus, trends
false
Investment Analysis
Financial Services
Mixed Chart
BCG
Add to my slides
Remove from favorites
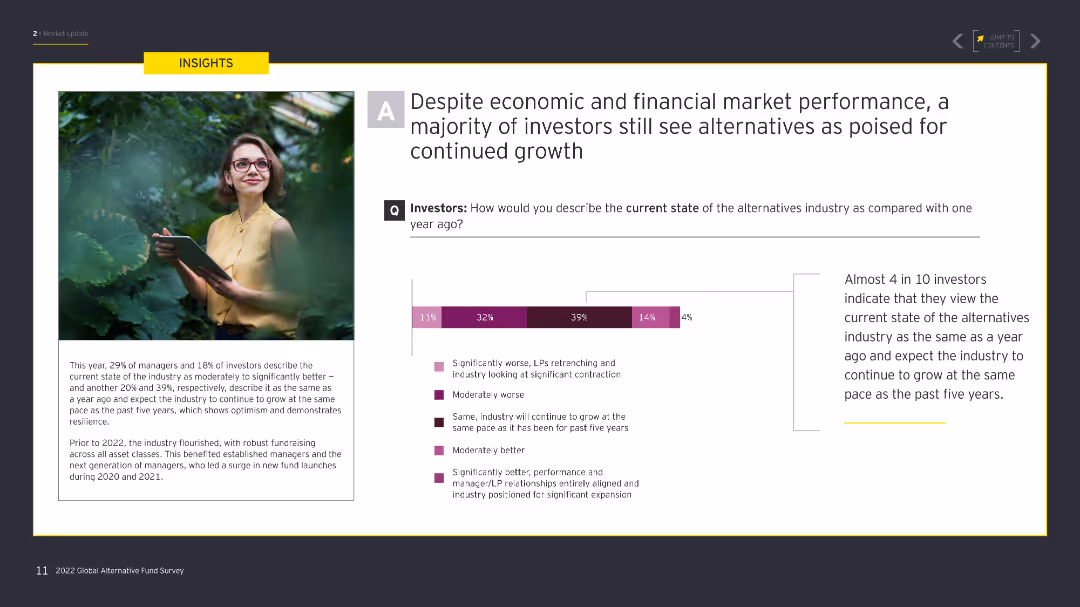
The slide has a large image on the left of a woman reading a report in a green environment, with a column chart on the right showing investor views on the alternative industry state compared to a year ago.
Market Analysis and Trends
Financial Services
This slide analyzes investor perceptions of the current state of the alternative investment industry compared to a year ago, highlighting growth expectations and industry stability.
investors, market performance, growth, stability, alternative industry
false
Market Analysis and Trends
Financial Services
Mixed Chart
EY
Add to my slides
Remove from favorites
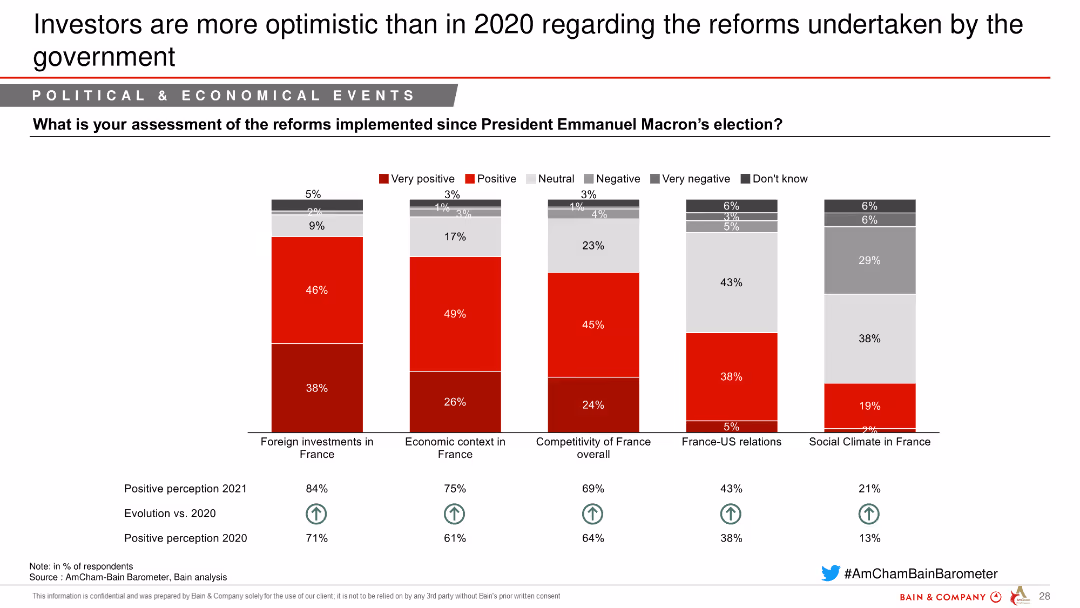
This slide includes column charts that assess investors' perceptions of the reforms in France since President Macron's election, covering foreign investments, economic context, and relations.
Regulatory and Compliance
Government & Public Sector
The slide reviews investors' optimism regarding various reforms in France since President Macron's election, focusing on foreign investments, economic context, and France-US relations.
investors, optimism, reforms, Macron, foreign investments, economic context, France-US relations, government, public sector
false
Regulatory and Compliance
Government & Public Sector
Mixed Chart
Bain
Add to my slides
Remove from favorites
A pie chart on the left showing the proportion of passive and active investors, with another smaller pie chart on the right detailing net buyer, net zero, and net seller percentages.
Market Analysis and Trends
Financial Services
This slide compares passive and active investors during the pandemic, detailing the percentage of net buyers, net zero, and net sellers among active investors.
investors, passive, active, pandemic, comparison
false
Market Analysis and Trends
Financial Services
Multiple Chart
IPSOS
Add to my slides
Remove from favorites
Title slide announcing the BCG Investor Perspectives Series with a backdrop of an architectural image.
Market Analysis and Trends
Financial Services
Introduces a report focusing on investor perspectives, indicating it's a regular series of publications by BCG.
investors, perspectives, pulse check, BCG, economy, stock market
false
Market Analysis and Trends
Financial Services
Title
BCG
Add to my slides
Remove from favorites
The slide features two sections: a column chart showing earnings per share from 2018 to 2022, and a bar chart indicating dividends and share buybacks. The layout is financial-focused and uses clear visualizations for data.
Investment Analysis
Financial Services
The slide highlights Ipsos' financial returns to investors, showing an increase in earnings per share, dividends, and share buybacks, emphasizing the company's commitment to shareholder value.
investors, returns, earnings per share, dividends, buybacks
false
Investment Analysis
Financial Services
Multiple Chart
IPSOS
Add to my slides
Remove from favorites
Slide divided into three sections with bullet points, headers, and check/cross icons representing evaluation of strategic choices.
Strategic Planning
Financial Services
Focuses on investors' evolving criteria, stressing sustainability, essential services, and growth sectors.
investors, selectivity, sustainability, essential services, technology, growth
false
Strategic Planning
Financial Services
Header Vertical
Bain
Add to my slides
Remove from favorites
Column charts comparing the share of deals involving strategic vs. financial investors in the T&L sector.
Investment Analysis
Transportation & Logistics
Analyzes the role of strategic and financial investors in shaping the transportation and logistics market.
Investors, Strategic, Financial, Transportation, Logistics, Deals, Market, Analysis
false
Investment Analysis
Transportation & Logistics
Mixed Chart
PwC/Strategy&
Add to my slides
Remove from favorites
This slide features multiple charts including a pie chart and bar chart, and a text section summarizing the data.
Market Analysis and Trends
Financial Services
The slide presents data from a survey profiling investors by wealth level, generation, region, and gender.
investors, survey, wealth, generation, region, gender, financial services
false
Market Analysis and Trends
Financial Services
Multiple Chart
Deloitte
Add to my slides
Remove from favorites
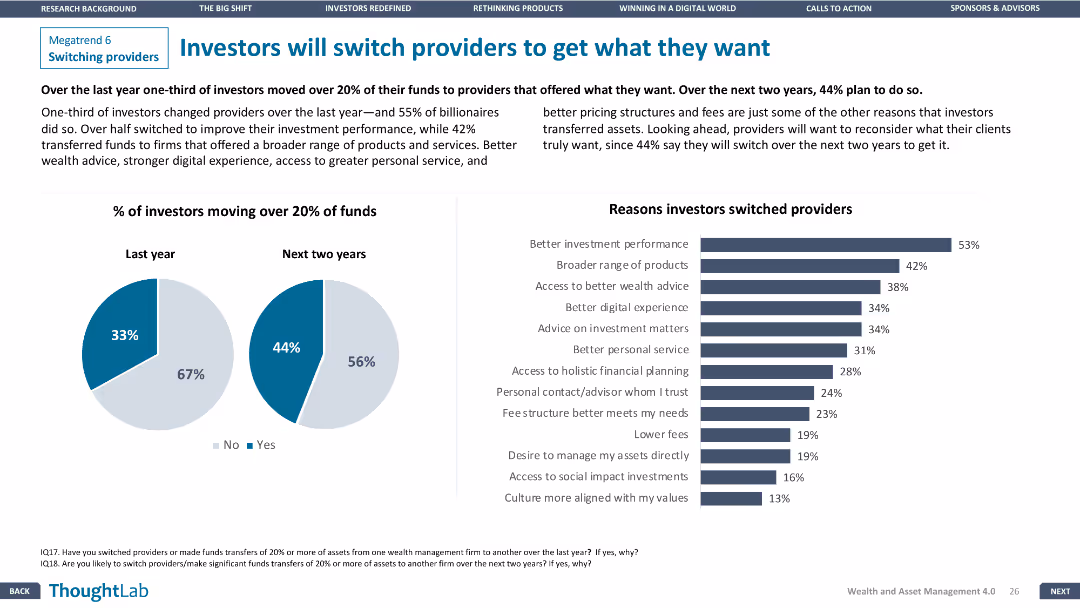
Pie charts and a column chart detailing investor fund movement and reasons for switching providers. Layout is visually clear and informative.
Customer and Market Segmentation
Financial Services
Examines investor behavior regarding switching providers, showing percentages of fund movement and key reasons driving this behavior.
investors, switching, providers, funds, reasons
false
Customer and Market Segmentation
Financial Services
Multiple Chart
Deloitte
Add to my slides
Remove from favorites
The slide shows two businesswomen walking and talking on the left, with a column chart on the right illustrating investor plans to increase, decrease, or maintain target allocations in the next three years.
Investment Analysis
Financial Services
This slide explores investor plans regarding their target allocations in alternative asset classes over the next three years, showing intentions to increase, maintain, or decrease allocations.
investors, target allocations, alternative asset classes, next three years
false
Investment Analysis
Financial Services
Mixed Chart
EY
Add to my slides
Remove from favorites
The slide features three pie charts illustrating the survey results of over 25 local and foreign investors categorized by origin (foreign/local), fund size, and role (investment officer/manager, founder/CEO, partner/director).
Market Analysis and Trends
Financial Services
This slide captures investor outlook and priorities by surveying more than 25 investors, providing insights into their categories, fund sizes, and roles within the investment landscape.
investor survey, outlook, priorities, local, foreign, fund size, investment role
false
Market Analysis and Trends
Financial Services
Multiple Chart
Kearney
Add to my slides
Remove from favorites
Circular diagram with icons and text blocks around pricing, student acquisition, and other factors.
Strategic Planning
Financial Services
This slide highlights key value creation levers for investors in the education sector, such as pricing and linkage with employers.
investors, value creation, education, pricing, strategy
false
Strategic Planning
Financial Services
Framework
LEK
Add to my slides
Remove from favorites
The slide contains two sections: one with a line chart on IOC capital expenditures and another with a line chart comparing confirmed COVID-19 infections and crude oil prices. Supporting text provides additional context for each chart.
Market Analysis and Trends
Energy & Utilities
The slide discusses the muted investment in the IOC for 2022 and the resilience of markets amidst COVID-19. It provides a historical view of capital expenditures and the correlation between COVID-19 cases and crude oil prices.
IOC, capital expenditure, COVID-19, crude oil prices, market resilience
false
Market Analysis and Trends
Energy & Utilities
Multiple Chart
EY
Add to my slides
Remove from favorites
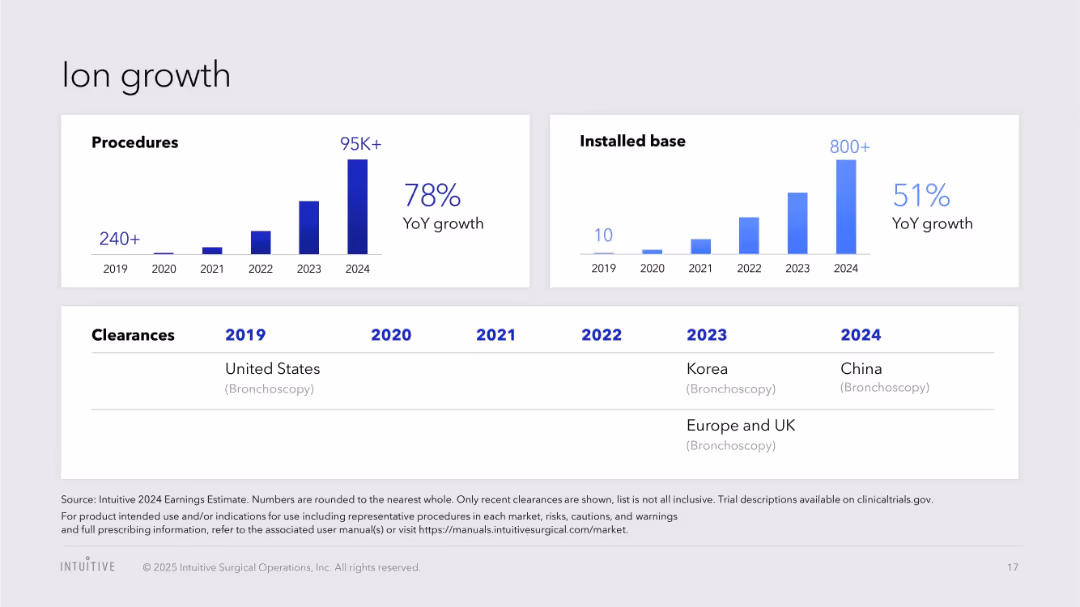
Bar charts of procedure volume and installed base; global clearance timeline
Product and Service Analysis
Healthcare & Pharmaceuticals
Demonstrates rapid growth of Ion system adoption with rising procedures and installations, highlighting international clearances since 2019.
Ion, bronchoscopy, system growth, global market, installations, clearances, robotic surgery
false
Product and Service Analysis
Healthcare & Pharmaceuticals
Multiple Chart
JP Morgan
Add to my slides
Remove from favorites
Three-column layout with images and blue icons; numeric sliders rate tech areas like IoT and ticketing
Technology and Digital Transformation
Transportation & Logistics
Highlights the shift in the rail supply industry toward digitization, focusing on IoT, big data, autonomous trains, and intermodal solutions such as mobility platforms and ticketing apps.
IoT, big data, autonomous trains, intermodality, mobility apps, analytics, ticketing
false
Technology and Digital Transformation
Transportation & Logistics
Single Chart
Roland Berger
Add to my slides
Remove from favorites
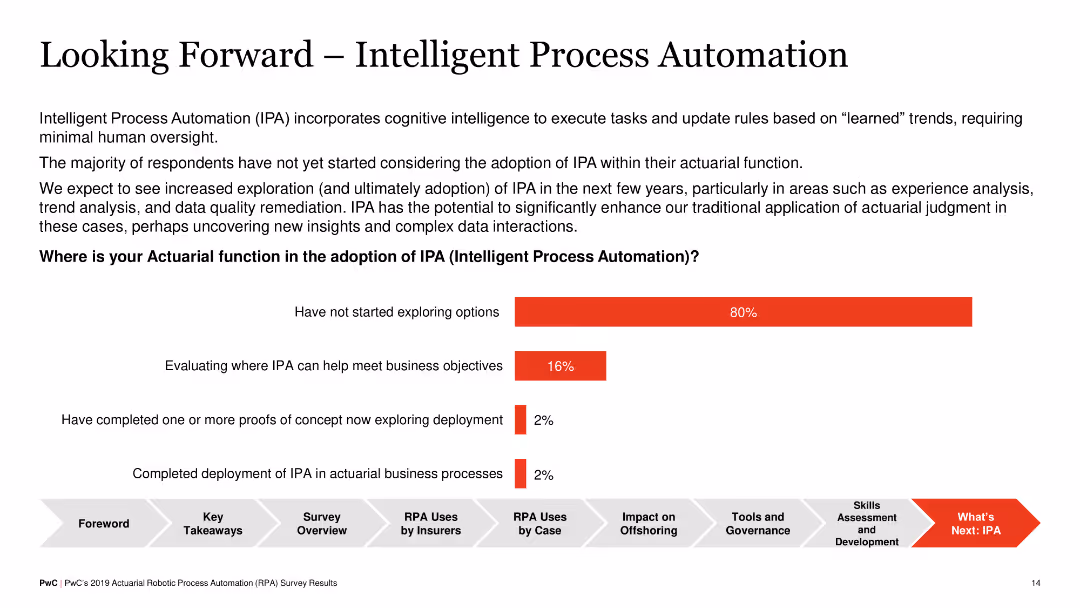
Plain text slide with no visual elements except a horizontal bar chart, outlining stages of adoption of Intelligent Process Automation (IPA) in actuarial functions, such as evaluating options and deploying IPA.
Strategic Planning
Financial Services
The slide discusses future adoption of IPA in actuarial functions, indicating most respondents haven't started exploring IPA options, but some are evaluating its benefits or have started proofs of concept. It emphasizes the potential future impact of IPA.
IPA, Strategic Planning, Actuarial, Adoption, Future
false
Strategic Planning
Financial Services
Mixed Chart
PwC/Strategy&
Add to my slides
Remove from favorites
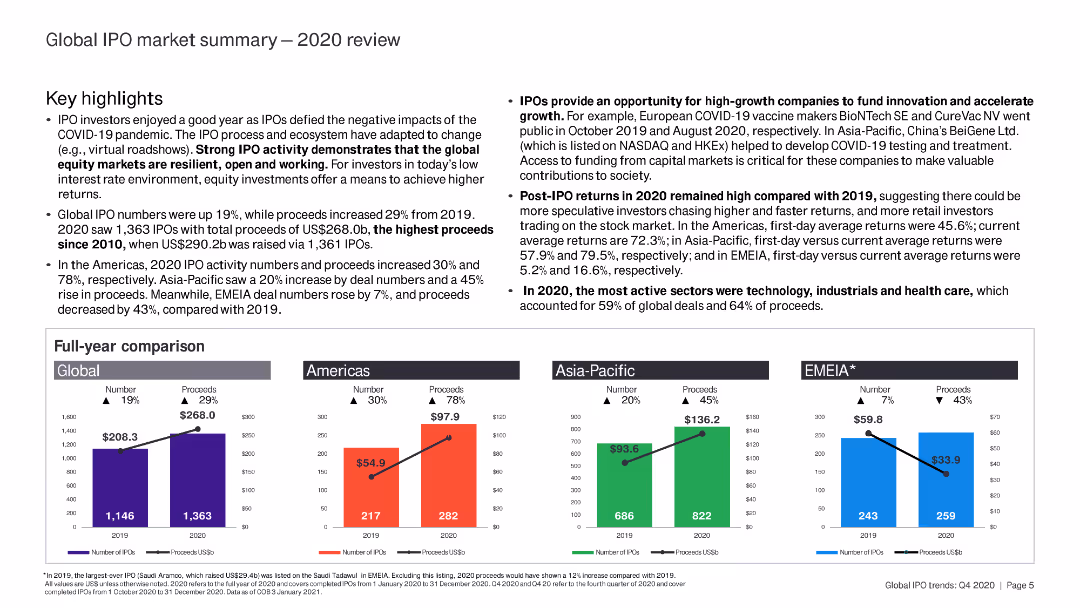
The slide contains detailed text with key highlights and a full-year comparison of IPO activities. It includes small bar charts for regional comparisons.
Market Analysis and Trends
Financial Services
This slide reviews the global IPO market in 2020, summarizing annual performance, key highlights, and regional breakdowns.
IPO, 2020 review, global market, key highlights, annual performance
false
Market Analysis and Trends
Financial Services
Multiple Chart
EY
Add to my slides
Remove from favorites
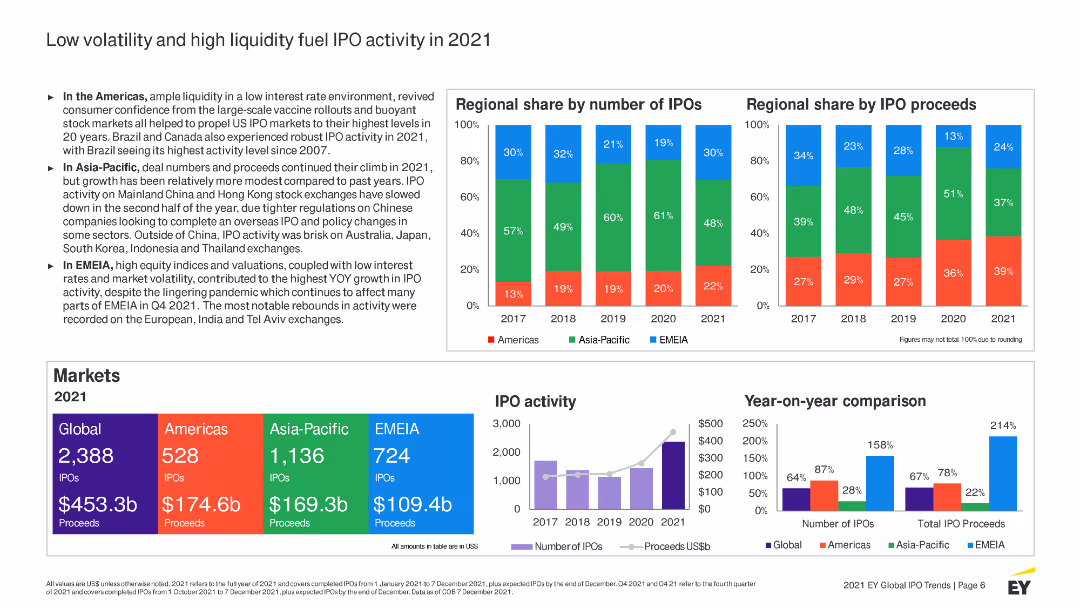
The slide features bar charts showing regional share of IPOs and proceeds from 2017 to 2021, along with a line chart of IPO activity over time. Text sections discuss factors driving IPO activity in 2021.
Market Analysis and Trends
Financial Services
Discusses the impact of low volatility and high liquidity on IPO activity in 2021. Highlights regional differences and key drivers behind the surge in IPOs, including market conditions and investor sentiment.
IPO, 2021, market conditions, volatility, liquidity, regional analysis, financial services
false
Market Analysis and Trends
Financial Services
Multiple Chart
EY
Add to my slides
Remove from favorites
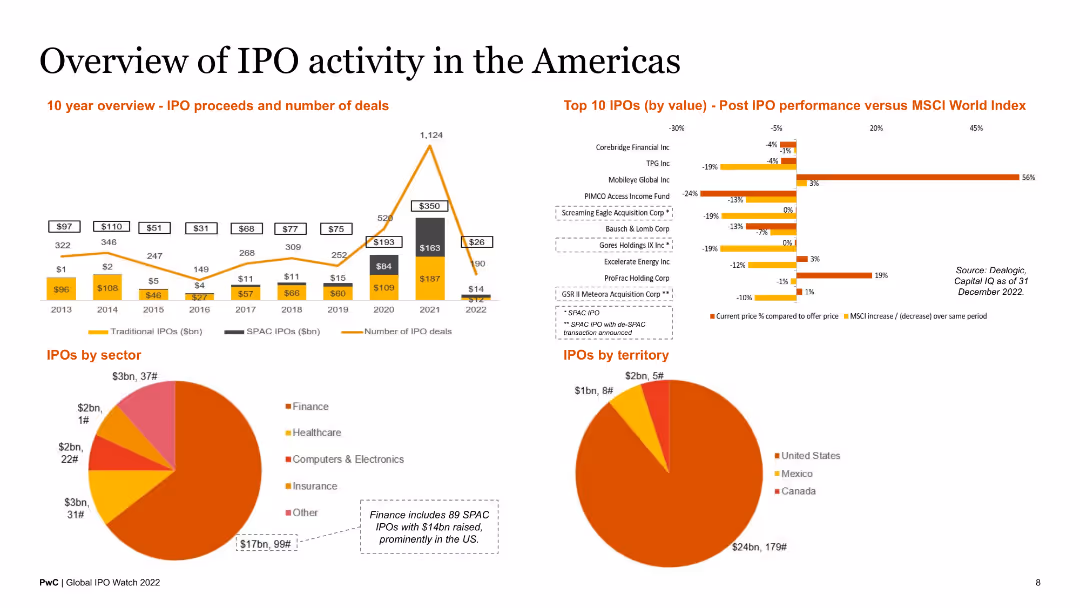
This slide includes a 10-year overview of IPO proceeds and number of deals, a bar chart of top 10 IPOs by value, and pie charts of IPOs by sector and territory. The layout is balanced with a mix of charts and brief text descriptions.
Market Analysis and Trends
Financial Services
The slide provides a comprehensive overview of IPO activity in the Americas, including historical data, top IPOs, and sector and territorial distribution. It is designed for market analysts and investors.
IPO activity, Americas, top IPOs, sector analysis, territorial overview
false
Market Analysis and Trends
Financial Services
Multiple Chart
PwC/Strategy&
Add to my slides
Remove from favorites
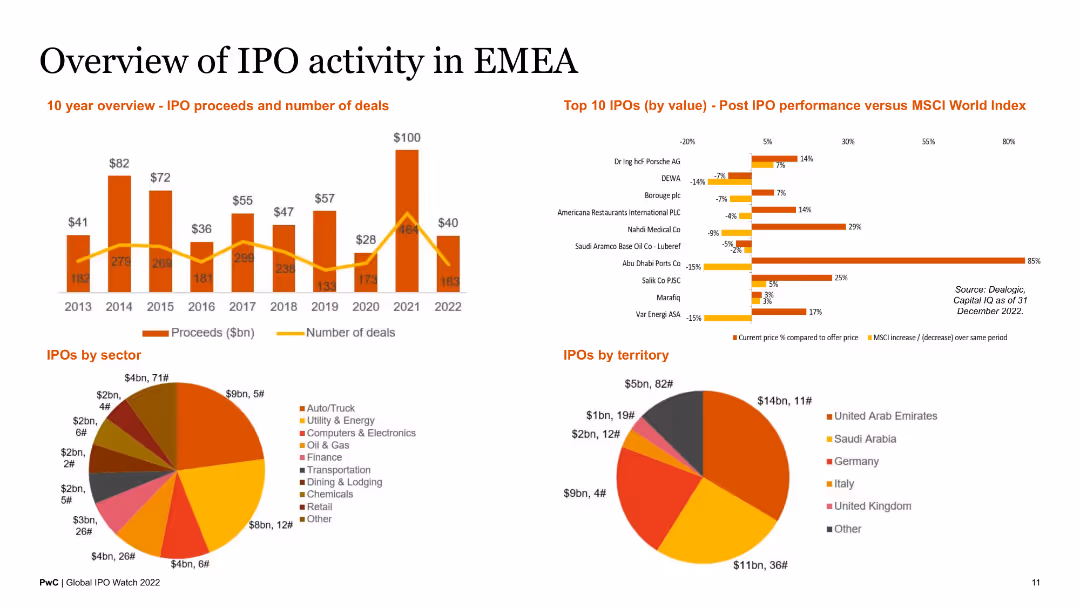
This slide includes a 10-year overview of IPO proceeds and number of deals, a bar chart of top 10 IPOs by value, and pie charts of IPOs by sector and territory. It provides a comprehensive visual and textual analysis.
Market Analysis and Trends
Financial Services
The slide provides an extensive overview of IPO activity in the EMEA region, detailing historical trends, top IPOs, and sectoral and territorial distributions. It is useful for regional market analysts and investors.
IPO activity, EMEA, top IPOs, sector analysis, territorial overview
false
Market Analysis and Trends
Financial Services
Multiple Chart
PwC/Strategy&
Add to my slides
Remove from favorites
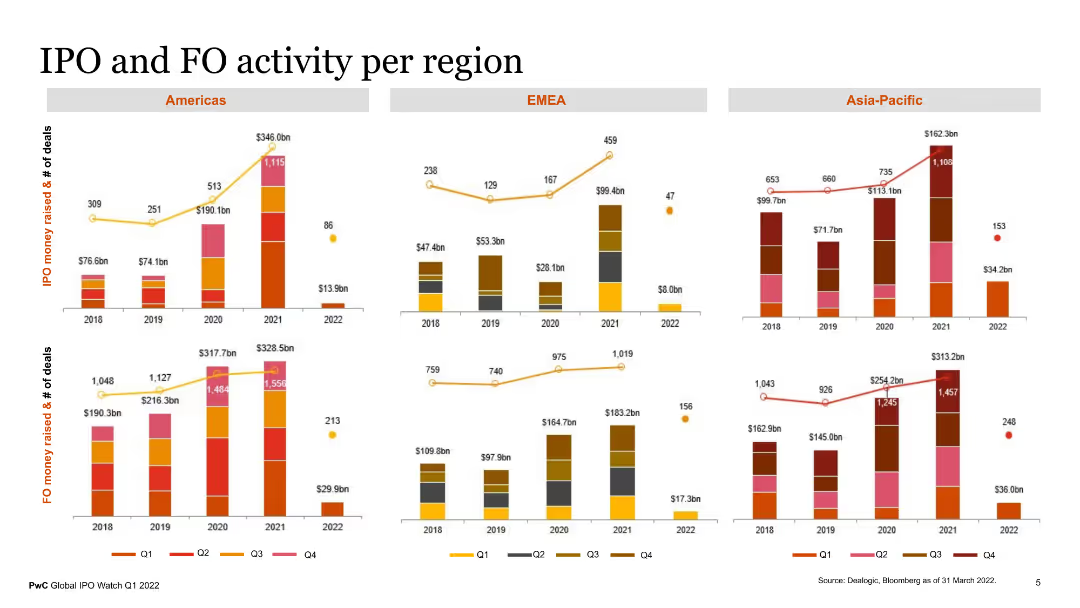
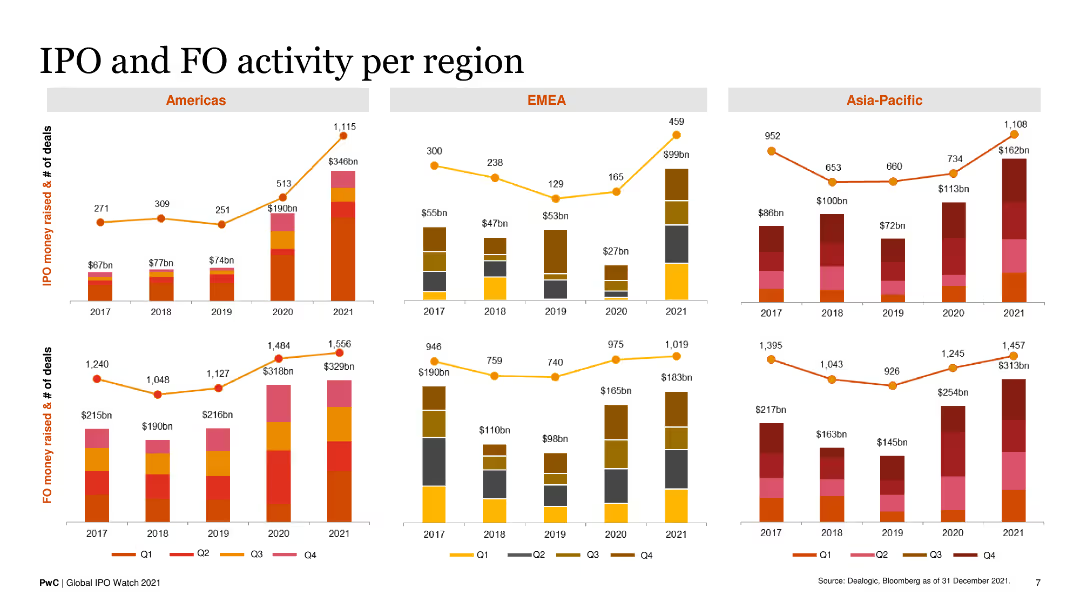
The slide features multiple column charts showing IPO and FO (Follow-on Offering) activity per region (Americas, EMEA, Asia-Pacific). The charts display the number of deals and money raised over multiple years, with different colors representing each quarter. The visual elements are complemented by text descriptions explaining regional performance.
Market Analysis and Trends
Financial Services
This slide presents a comprehensive analysis of IPO and FO activity across different regions, highlighting the number of deals and capital raised over the years. It provides valuable insights into regional market activities and trends, useful for financial market analysts and investors.
IPO activity, FO activity, regional analysis, financial trends, deals
false
Market Analysis and Trends
Financial Services
Multiple Chart
PwC/Strategy&
Add to my slides
Remove from favorites
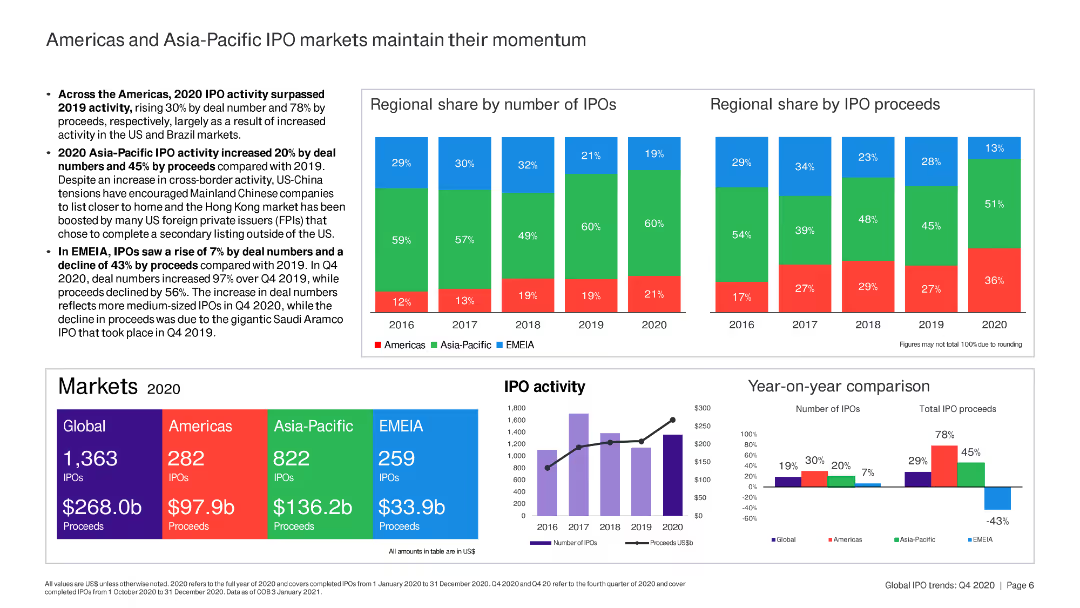
The slide combines text and bar charts to compare IPO market activities and proceeds in the Americas and Asia-Pacific regions.
Market Analysis and Trends
Financial Services
This slide analyzes the momentum of IPO markets in the Americas and Asia-Pacific, comparing deal numbers and proceeds over time.
IPO, Americas, Asia-Pacific, market momentum, deal numbers, proceeds
false
Market Analysis and Trends
Financial Services
Multiple Chart
EY
Add to my slides
Remove from favorites
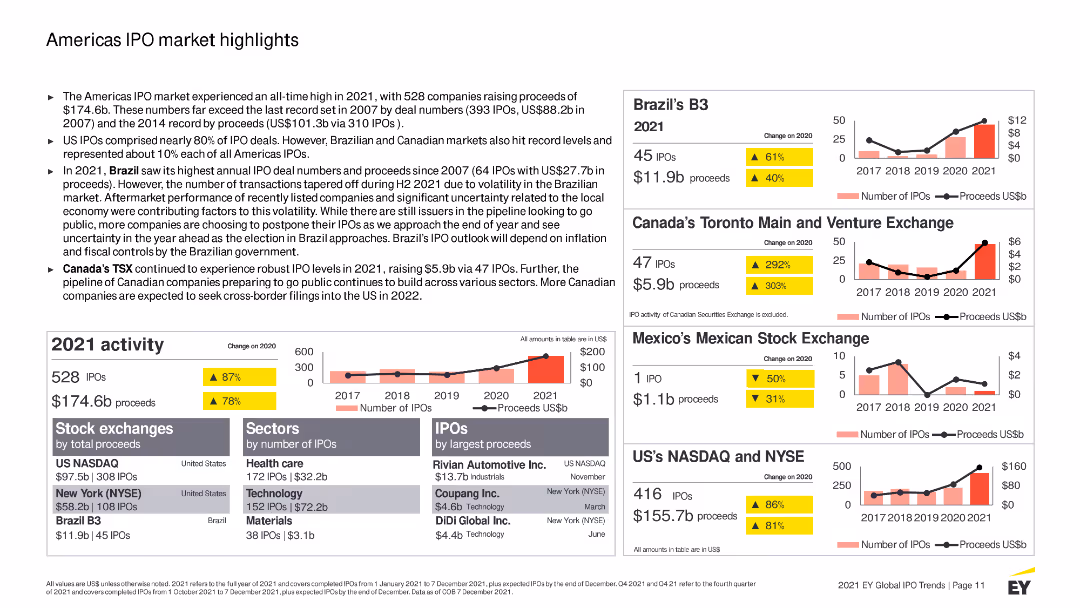
The slide includes a mix of text, column charts, and data tables. It uses color coding to differentiate data across different regions and time periods.
Market Analysis and Trends
Financial Services
Summarizes the 2021 IPO market performance in the Americas, highlighting key statistics and trends across major stock exchanges, sectors, and IPO activity levels.
IPO, Americas, financial performance, trends, sectors, stock exchanges, proceeds, 2021 activity, market highlights, outlook
false
Market Analysis and Trends
Financial Services
Multiple Chart
EY
Add to my slides
Remove from favorites
A detailed slide with charts showing the number and proceeds of IPOs in the Americas, along with sector and exchange breakdowns. The visual complexity is advanced, with multiple data points and comparisons.
Market Analysis and Trends
Financial Services
The slide discusses the resurgence of IPOs in the Americas, driven by bullish equities sentiment. It provides detailed data on the number of IPOs, proceeds, and sector-specific performances, highlighting the strong market activity and the role of major stock exchanges in the US.
IPO, Americas, Resurgence, Market, Equities, Sentiment
false
Market Analysis and Trends
Financial Services
Multiple Chart
EY
Add to my slides
Remove from favorites
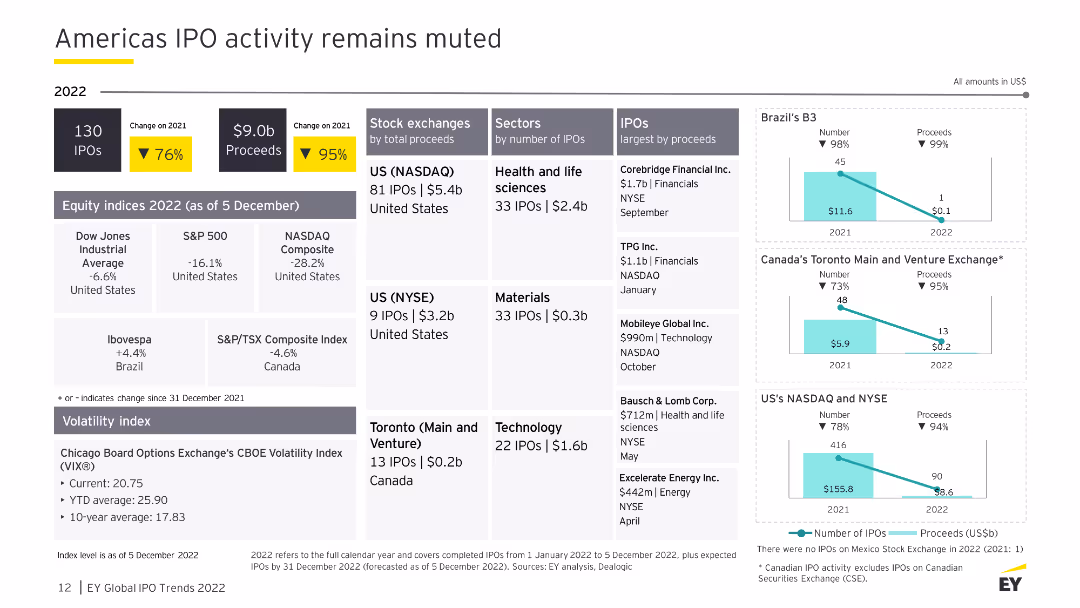
This slide uses multiple data points and small bar charts to summarize IPO activities, proceeds, and sector distributions for the Americas in 2022. The layout is data-heavy but organized clearly.
Market Analysis and Trends
Financial Services
The slide provides an overview of IPO activity in the Americas for 2022, showing a significant decline in the number of IPOs and proceeds compared to 2021. It includes detailed breakdowns by stock exchanges and sectors.
IPO, Americas, stock exchange, proceeds, 2022
false
Market Analysis and Trends
Financial Services
Multiple Chart
EY
Add to my slides
Remove from favorites
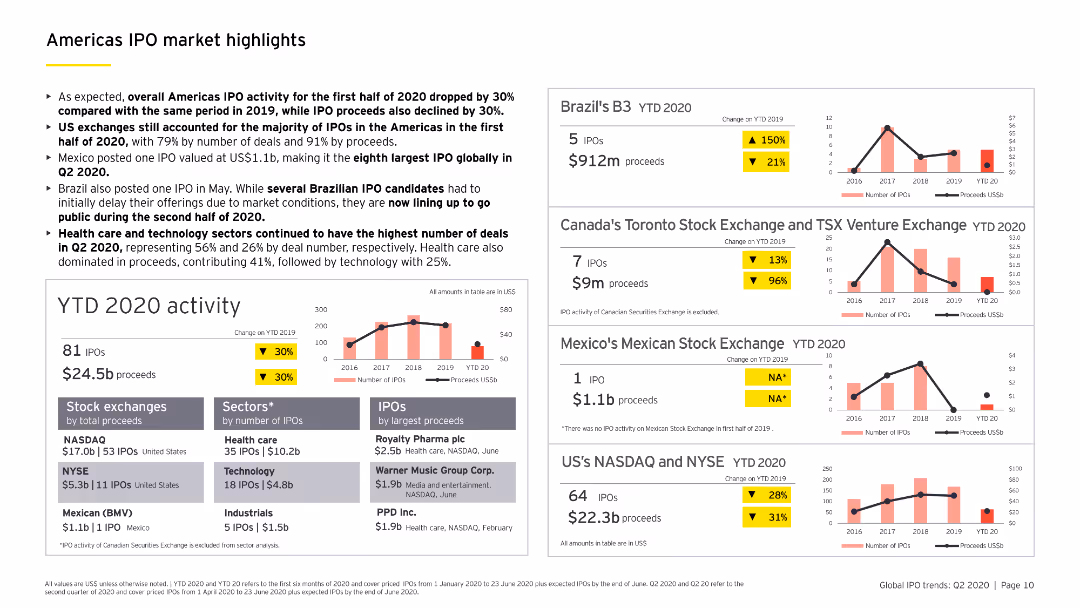
Contains multiple column charts and a bar chart detailing YTD 2020 IPO activity in the Americas, including sector-specific analysis and major stock exchanges.
Market Analysis and Trends
Financial Services
Highlights key IPO market trends in the Americas for the first half of 2020, including a breakdown by sectors, stock exchanges, and notable IPOs.
IPO, Americas, YTD 2020, sector analysis, stock exchanges
false
Market Analysis and Trends
Financial Services
Multiple Chart
EY
Add to my slides
Remove from favorites
Light background with yellow title banner, text-heavy content, and a pie chart and bar chart showing survey results and IPO returns.
Strategic Planning
Financial Services
This slide indicates that CEOs are optimistic about pursuing IPOs in 2024, with a survey showing a significant interest in IPOs, mergers, and acquisitions. The slide includes a pie chart on transaction ambitions and a bar chart comparing YTD 2023 IPO returns vs. benchmark index returns.
IPO appetite, CEOs, 2024, strategic planning, survey results
false
Strategic Planning
Financial Services
Multiple Chart
EY
Add to my slides
Remove from favorites
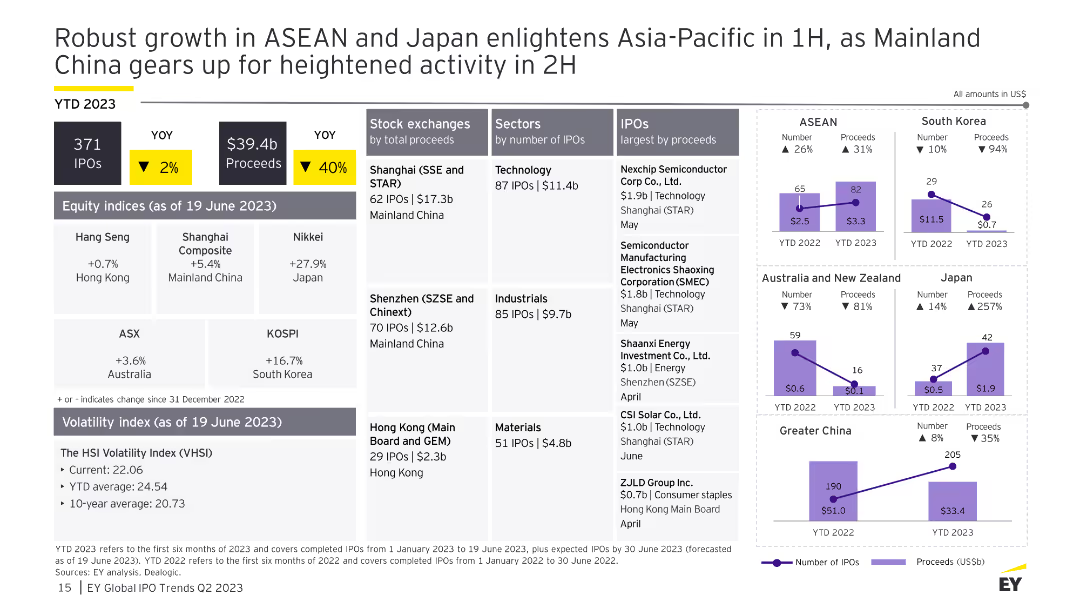
The slide includes multiple charts: a column chart for IPO performance by region, a table for stock exchanges and sectors, and line charts for IPO activity in specific regions.
Market Analysis and Trends
Financial Services
This slide analyzes IPO activities in ASEAN, Japan, and other Asia-Pacific regions, providing detailed statistics on exchanges, sectors, volatility indices, and largest IPOs by proceeds.
IPO, ASEAN, Japan, Asia-Pacific, growth
false
Market Analysis and Trends
Financial Services
Multiple Chart
EY
Add to my slides
Remove from favorites
A slide with multiple charts showing the number and proceeds of IPOs in the Asia-Pacific region, along with exchange and sector breakdowns. The visual complexity is advanced, with detailed financial data and trends.
Market Analysis and Trends
Financial Services
The slide provides an analysis of IPO activity in the Asia-Pacific region, noting a slow start to the year but moderate growth in Japan. It includes detailed charts on the number and proceeds of IPOs by country and sector, highlighting the performance of major exchanges and the overall market trends.
IPO, Asia-Pacific, Japan, Growth, Market, Trends
false
Market Analysis and Trends
Financial Services
Multiple Chart
EY
Add to my slides
Remove from favorites
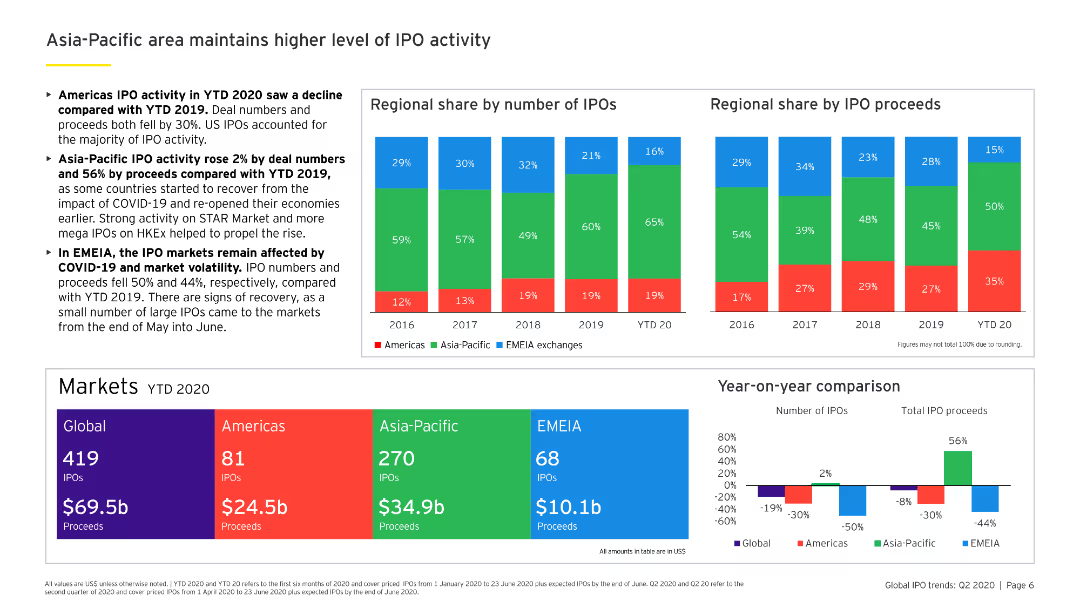
This slide features two bar charts, showing regional share by the number of IPOs and proceeds from 2016 to YTD 2020.
Market Analysis and Trends
Financial Services
Highlights the superior performance of the Asia-Pacific region in IPO activities, with detailed statistics on IPO numbers and proceeds compared to other regions.
IPO, Asia-Pacific, market share, proceeds, regional comparison
false
Market Analysis and Trends
Financial Services
Multiple Chart
EY
Add to my slides
Remove from favorites
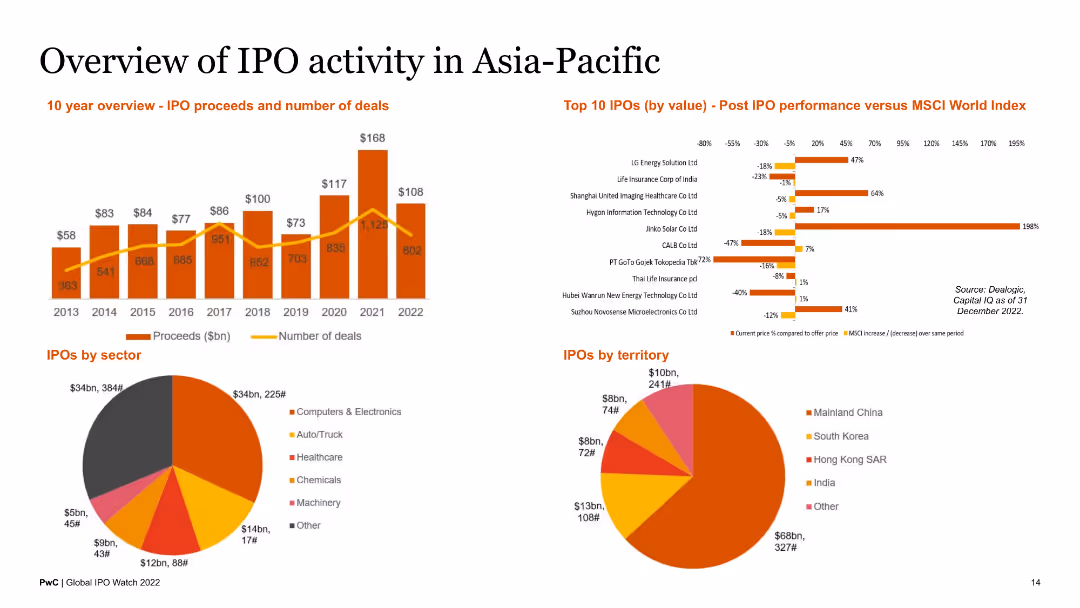
This slide includes a column chart depicting IPO proceeds and number of deals over 10 years, a pie chart for IPOs by sector, another pie chart for IPOs by territory, and a bar chart comparing post IPO performance of top 10 IPOs by value.
Market Analysis and Trends
Financial Services
The slide provides an overview of IPO activities in the Asia-Pacific region, detailing proceeds, number of deals, sector distribution, and geographical distribution. It also highlights post IPO performance.
IPO, Asia-Pacific, proceeds, deals, sector, territory, performance, financial, market
false
Market Analysis and Trends
Financial Services
Multiple Chart
PwC/Strategy&
Add to my slides
Remove from favorites
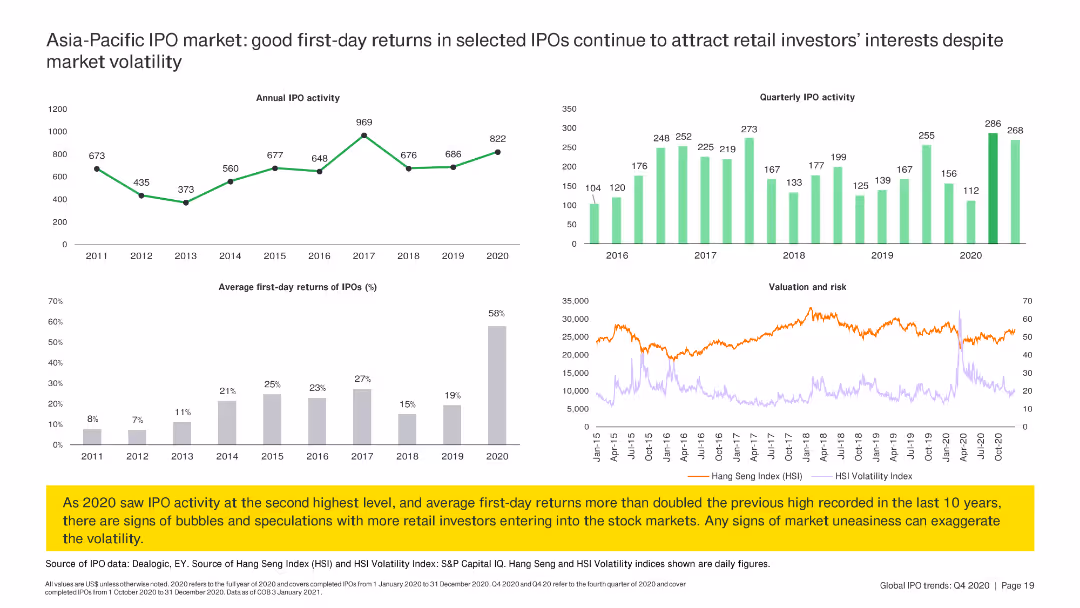
The slide includes line charts and column charts summarizing annual IPO activity, first-day returns, and quarterly IPO activity in the Asia-Pacific region.
Market Analysis and Trends
Financial Services
The slide reviews IPO activity in the Asia-Pacific region, focusing on good first-day returns and quarterly IPO trends, despite market volatility.
IPO, Asia-Pacific, returns, trends, volatility
false
Market Analysis and Trends
Financial Services
Multiple Chart
EY
Add to my slides
Remove from favorites
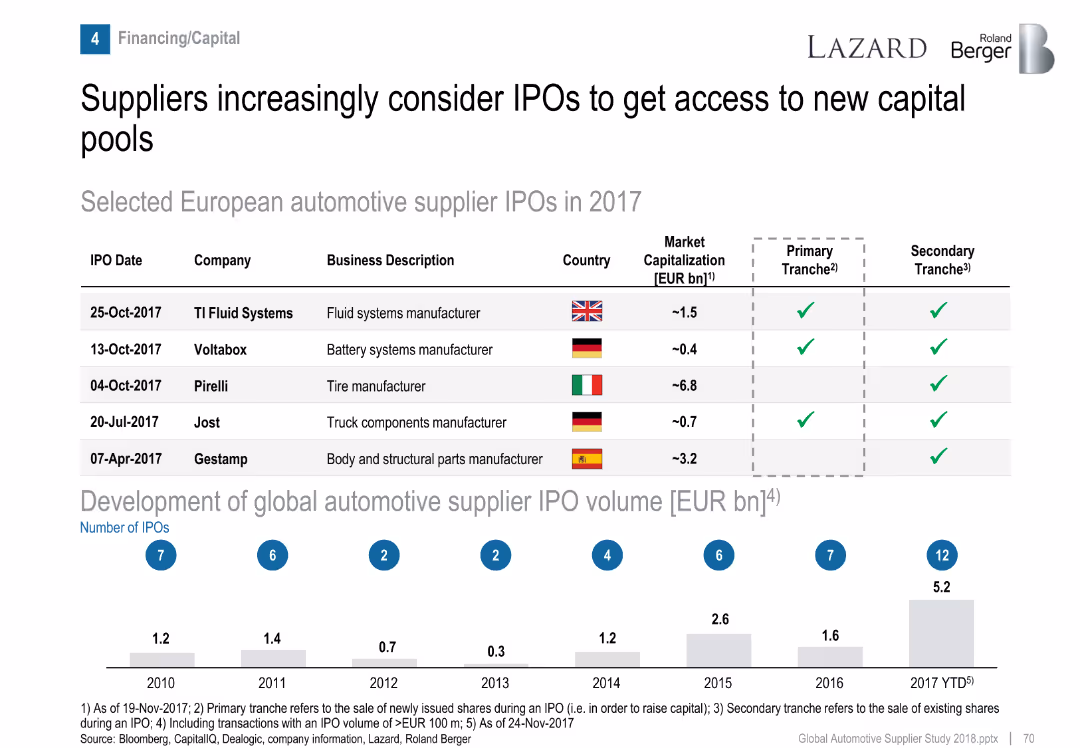
Table of IPOs and bar graph of historical IPO volumes.
Corporate Finance and Valuation
Industrial & Manufacturing
Highlights five European automotive supplier IPOs in 2017 and presents a trend in global IPO volume growth, indicating increased interest in capital markets by suppliers.
IPO, automotive suppliers, capital access, financing, market trends
false
Corporate Finance and Valuation
Industrial & Manufacturing
Mixed Chart
Roland Berger
Add to my slides
Remove from favorites
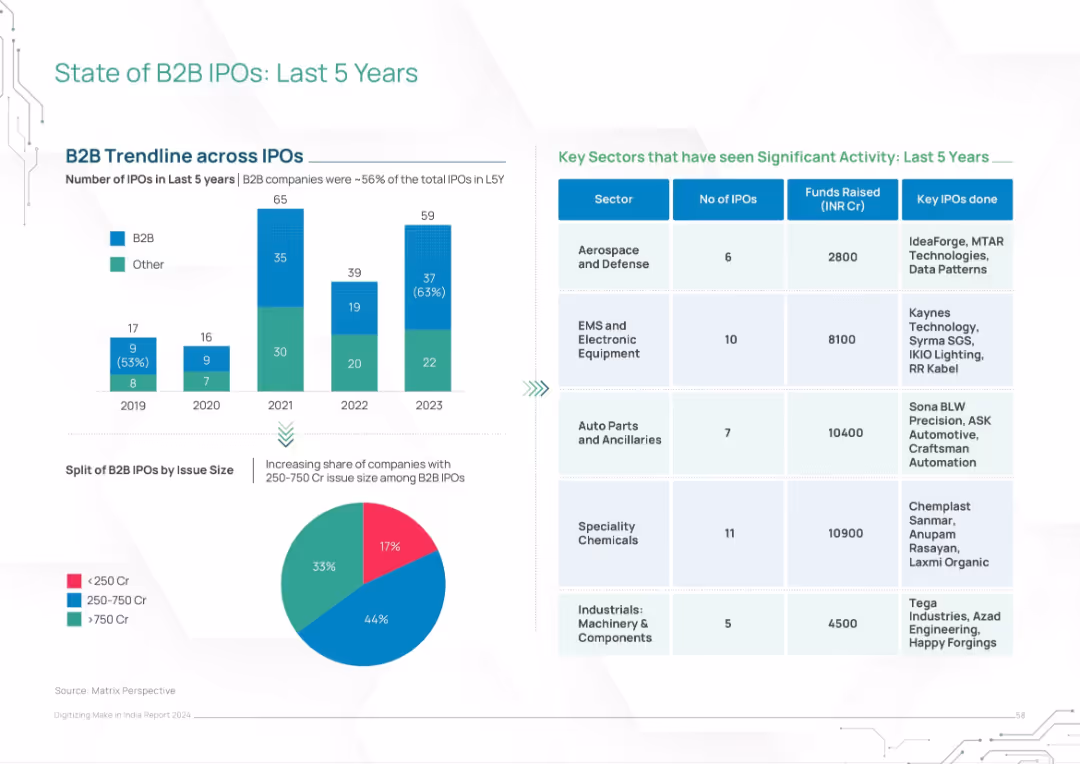
Split layout with bar chart (IPO trends), pie chart (issue size distribution), and table (key sectors)
Financial Performance
Financial Services
This slide reviews the state of B2B IPOs in India over the last five years, showing increasing activity and larger deal sizes. Key sectors and IPO examples are listed, along with funds raised. Visuals show a rising share of mid-to-large IPOs.
IPO, B2B, financial performance, India, sectors, funds raised, capital markets, growth, trends
false
Financial Performance
Financial Services
Multiple Chart
BCG
Add to my slides
Remove from favorites
Light background with yellow title banner, text-heavy content, and a pie chart and line chart showing IPO pipeline and withdrawal trends.
Market Analysis and Trends
Financial Services
The slide highlights the increasing IPO backlogs and deal withdrawals, particularly in China. It includes a pie chart showing the IPO pipeline breakdown by sector and a line chart tracking postponed and withdrawn IPOs as a percentage of total IPO volume from 2014 to 2023.
IPO backlogs, growth sectors, China, 2023, financial trends
false
Market Analysis and Trends
Financial Services
Multiple Chart
EY
Add to my slides
Remove from favorites
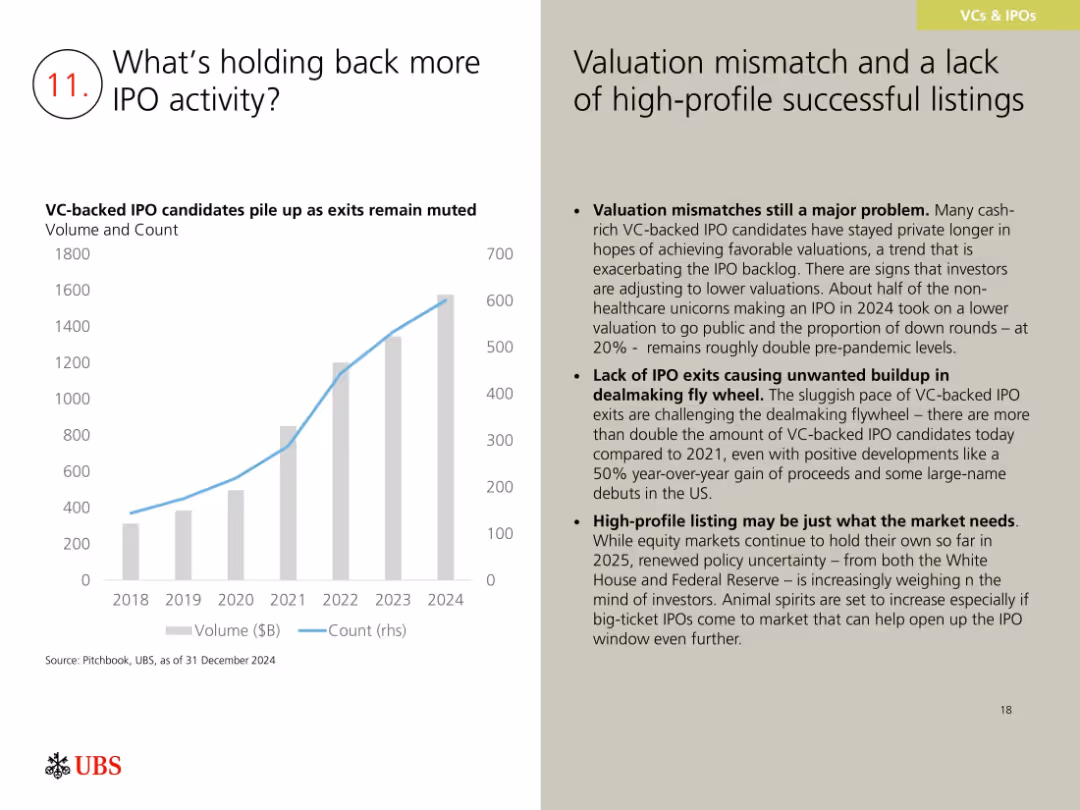
Bar and line chart showing VC-backed IPO candidate volume and count; right side has text on challenges and implications.
Market Analysis and Trends
Financial Services
This slide discusses reasons for a sluggish IPO market, citing valuation mismatches, lack of high-profile listings, and increased VC-backed company volume. While exits are slow, positive 2024 trends and investor anticipation may help re-open the IPO window in 2025.
IPO backlog, valuation mismatch, VC exits, dealmaking, 2024 outlook
false
Market Analysis and Trends
Financial Services
Mixed Chart
UBS
Add to my slides
Remove from favorites
Features a circular diagram with segments highlighting various factors affecting IPO candidates.
Strategic Planning
Financial Services
The slide identifies key factors like market volatility, regulatory changes, and geopolitical tensions that IPO candidates should consider.
IPO candidates, market volatility, regulatory changes, geopolitical tensions, strategic planning
false
Strategic Planning
Financial Services
Diagram
EY
Add to my slides
Remove from favorites
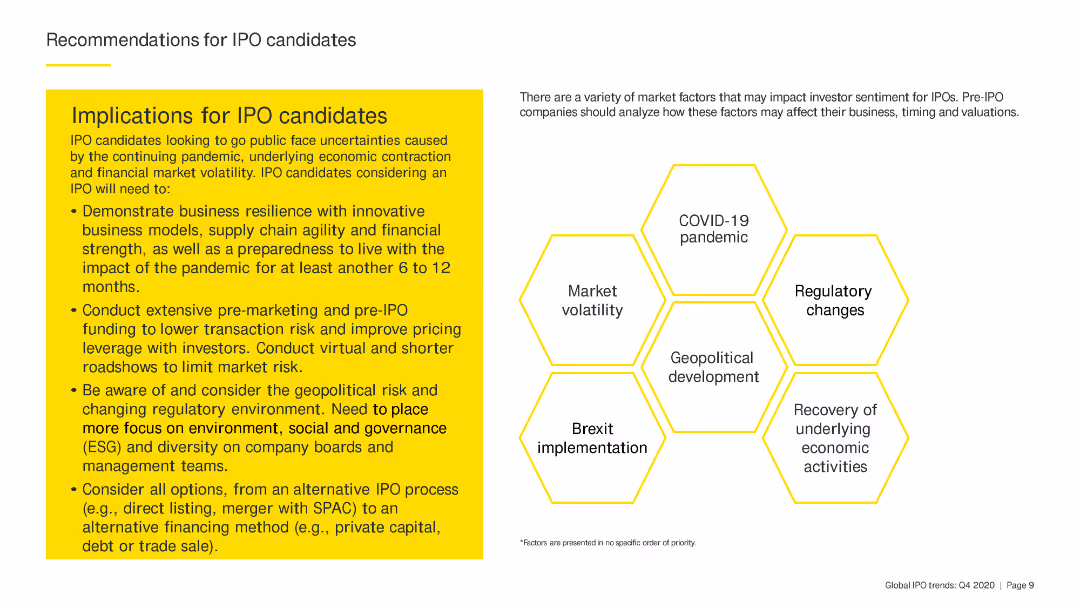
The slide has a yellow text box with bullet points providing recommendations for IPO candidates. There are hexagon shapes with key factors such as COVID-19 pandemic and regulatory changes.
Strategic Planning
Financial Services
The slide gives detailed recommendations for IPO candidates, emphasizing the need for business resilience, pre-marketing efforts, and consideration of geopolitical and regulatory risks.
IPO candidates, resilience, pre-marketing, geopolitical, regulatory
false
Strategic Planning
Financial Services
Header Horizontal
EY
Add to my slides
Remove from favorites
Contains a column chart showing global IPO proceeds from 2018 to 2022 with a focus on the strategic and regulatory factors affecting the market. The slide also features quotes and textual insights on market trends.
Investment Analysis
Financial Services
Discusses the performance and expectations of the global IPO market, noting significant activities such as Porsche's IPO and others, with future projections and strategic considerations.
IPO, capital market, global transactions, 2022, Porsche, regulatory impact, market slowdown, financial trends
false
Investment Analysis
Financial Services
Mixed Chart
PwC/Strategy&
Add to my slides
Remove from favorites
The slide outlines a client case study with sections for opportunity, client, need, offered solutions, and a timeline showing the progression over years.
Client Case Studies
Financial Services
This case study describes a successful IPO leading to repeat business, detailing the client's needs, offered solutions, and the outcomes over a five-year timeline.
IPO, case study, client solutions, succession planning, repeat business
false
Client Case Studies
Financial Services
Linear Flow
Credit Suisse
Add to my slides
Remove from favorites
The slide shows comparative column charts for the Shanghai, Shenzhen, Beijing, and Hong Kong Stock Exchanges, detailing the number of IPOs and proceeds from 2019 to YTD 2023.
Market Analysis and Trends
Financial Services
This slide highlights the IPO market performance of Mainland China and Hong Kong, breaking down the data by stock exchange and sector, including the top sectors by number of IPOs and proceeds.
IPO, China, Hong Kong, stock exchange
false
Market Analysis and Trends
Financial Services
Multiple Chart
EY
Add to my slides
Remove from favorites
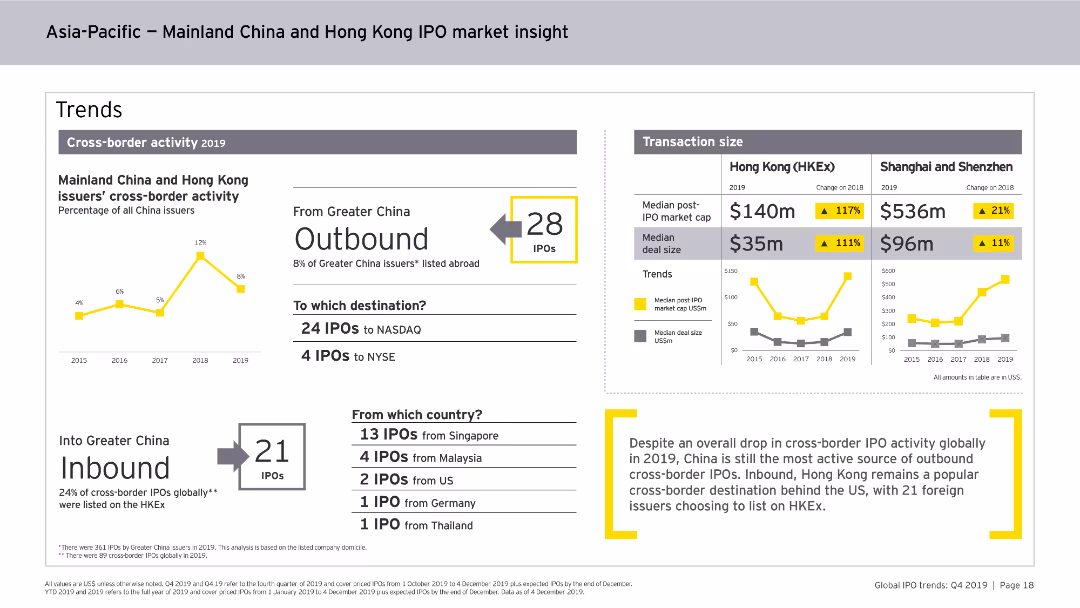
This slide includes line charts, column charts, and numerical data points. It visually represents the trends in cross-border IPO activity from Mainland China and Hong Kong, transaction sizes, and outbound/inbound IPO statistics.
Market Analysis and Trends
Financial Services
The slide provides insights into the cross-border IPO activity of Mainland China and Hong Kong issuers in 2019, highlighting outbound and inbound IPO numbers, transaction sizes, and notable trends in the region's IPO market.
IPO, Cross-border, Mainland China, Hong Kong, Market Trends, Transaction Size, Financial Services, Outbound, Inbound
false
Market Analysis and Trends
Financial Services
Multiple Chart
EY
Add to my slides
Remove from favorites
The slide features a column chart displaying the number of IPOs and proceeds from 2019 to YTD 2023, a table of cross-border IPOs by country, and line charts for percentage trends.
Market Analysis and Trends
Financial Services
This slide presents data on US IPO performance, highlighting cross-border deals, their origin countries, and their percentage of total US IPOs, along with pricing and performance metrics.
IPO, cross-border, US, financial, trends
false
Market Analysis and Trends
Financial Services
Multiple Chart
EY
Add to my slides
Remove from favorites
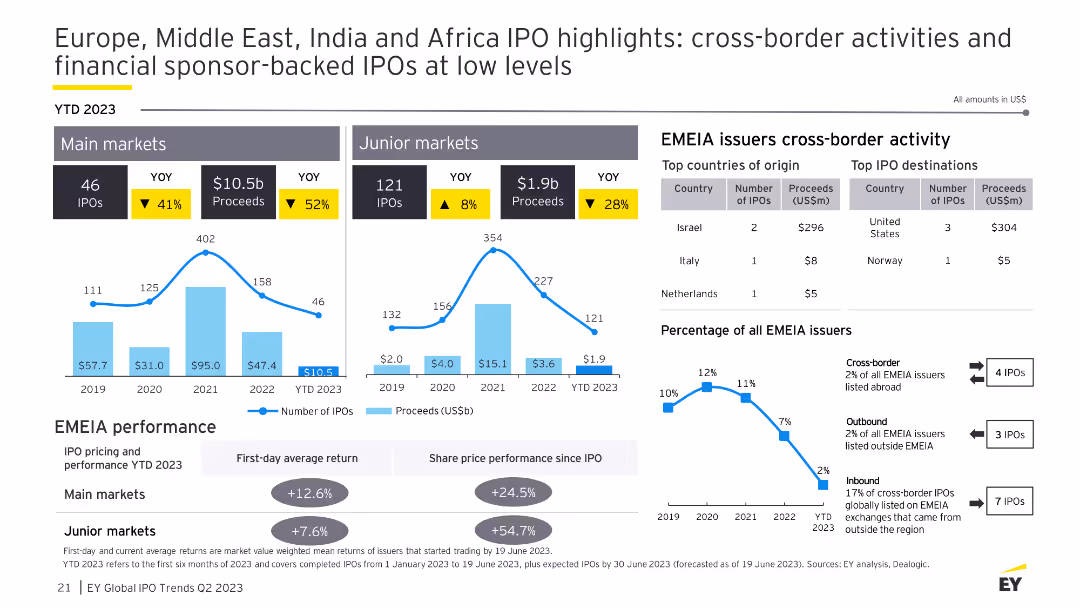
The slide presents column charts for the number of IPOs and proceeds in main and junior markets, a table for cross-border activity by country, and percentage trends.
Market Analysis and Trends
Financial Services
This slide discusses the IPO performance in EMEIA, noting the decline in cross-border activities and highlighting key statistics for main and junior markets, and top countries of origin and destinations.
IPO, EMEIA, cross-border, financial, trends
false
Market Analysis and Trends
Financial Services
Multiple Chart
EY
Add to my slides
Remove from favorites
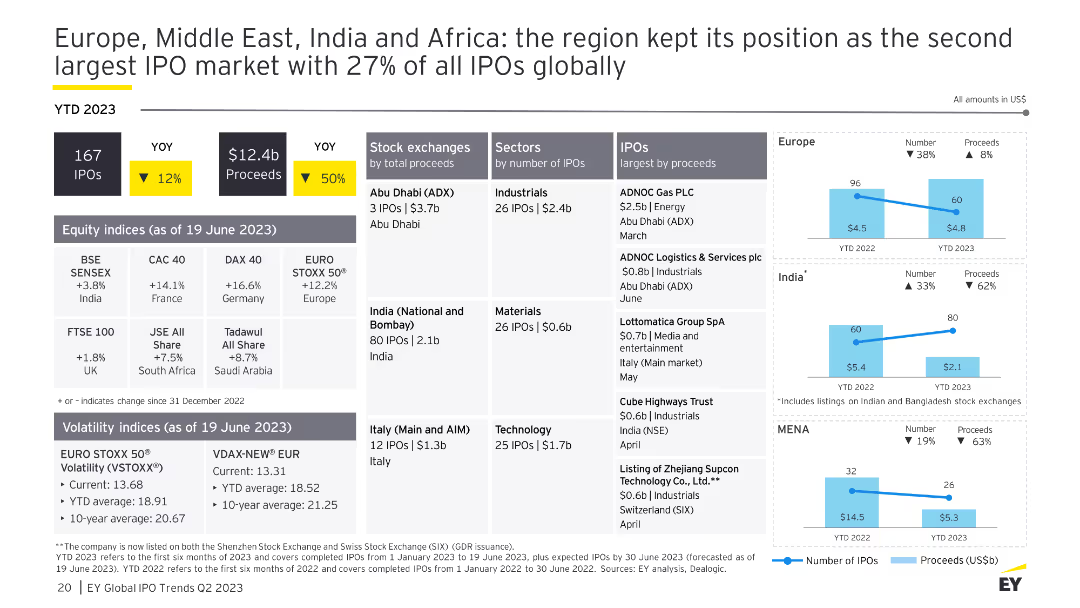
The slide features column charts for the number of IPOs and proceeds, tables for stock exchanges and sectors, and line charts for regional IPO activity in Europe, India, and MENA.
Market Analysis and Trends
Financial Services
This slide provides an overview of IPO activities in Europe, the Middle East, India, and Africa, emphasizing their position as the second-largest IPO market globally with detailed regional breakdowns.
IPO, EMEIA, Europe, Middle East, Africa
false
Market Analysis and Trends
Financial Services
Multiple Chart
EY
Add to my slides
Remove from favorites
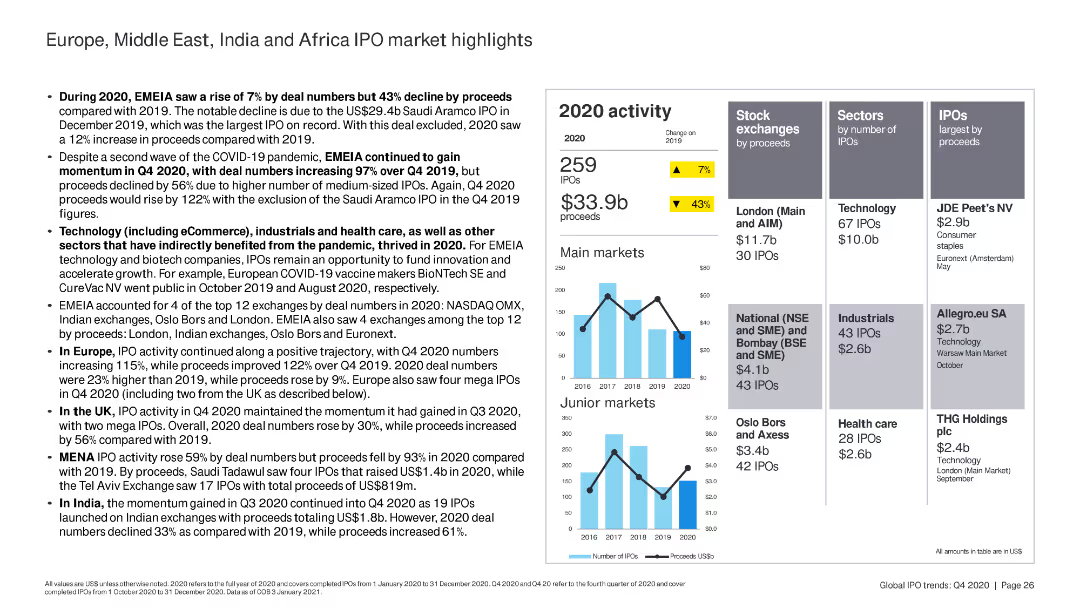
The slide features a column chart with data on 2020 IPO activity in main and junior markets. It also includes a text section summarizing IPO trends across EMEIA regions, with key statistics and sector analysis.
Market Analysis and Trends
Financial Services
Provides an overview of IPO market trends in EMEIA for 2020, noting a decline in proceeds despite an increase in deal numbers. Highlights sector performance and regional market activities.
IPO, EMEIA, market trends, sectors, 2020, financial services, Europe, Middle East, India, Africa
false
Market Analysis and Trends
Financial Services
Multiple Chart
EY
Add to my slides
Remove from favorites
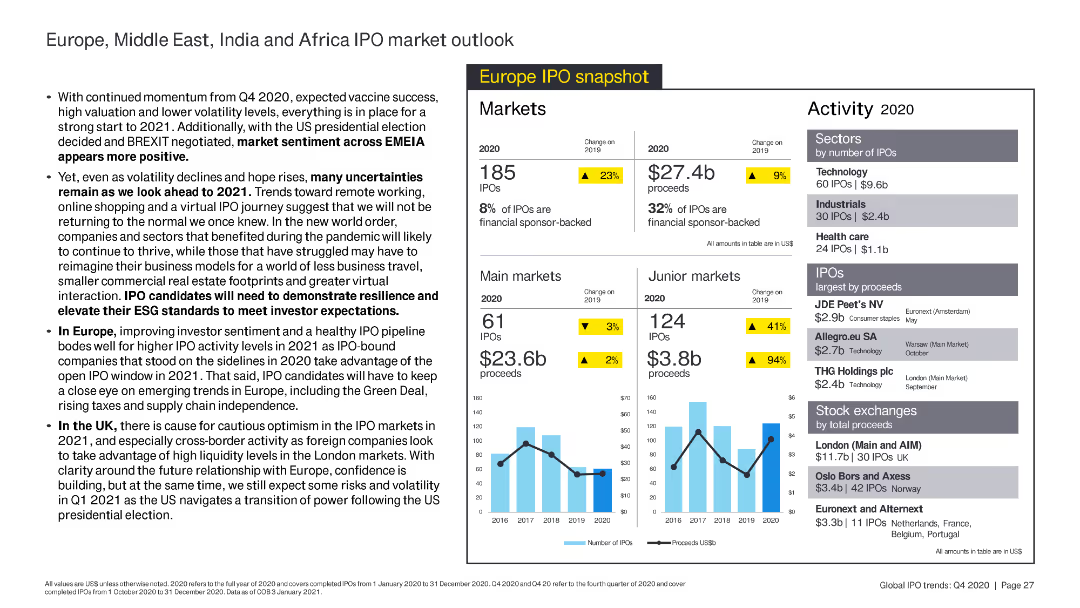
The slide presents a column chart comparing the number and proceeds of IPOs in main and junior markets from 2016 to 2020. It includes a text section discussing the market outlook and expected trends for 2021.
Market Analysis and Trends
Financial Services
Discusses expected market sentiment and IPO activity trends for EMEIA in 2021, with a focus on technology, healthcare, and industrial sectors. Highlights potential risks and opportunities post-Brexit.
IPO, EMEIA, outlook, 2021, market trends, technology, healthcare, industrial, Brexit
false
Market Analysis and Trends
Financial Services
Multiple Chart
EY
Add to my slides
Remove from favorites
This slide presents a central circle diagram surrounded by associated elements in a balanced layout with red and gray color accents.
Market Analysis and Trends
Financial Services
Discusses the importance of a reliable equity story in IPOs, focusing on investor considerations and integrating business strategy with reproducible data and KPIs.
IPO, equity story, investors, KPIs, business strategy, data reliability
false
Market Analysis and Trends
Financial Services
Linear Flow
PwC/Strategy&
Add to my slides
Remove from favorites
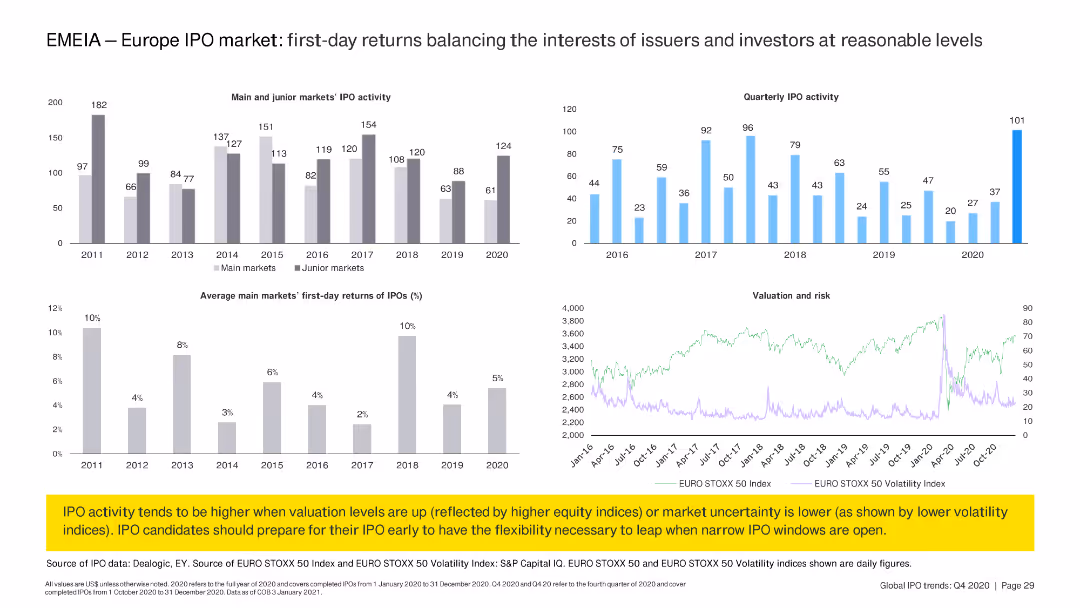
The slide includes two column charts displaying IPO activity and first-day returns in main and junior markets from 2011 to 2020. A line chart shows valuation and risk trends over time.
Market Analysis and Trends
Financial Services
Analyzes first-day returns of IPOs in Europe's main and junior markets, showing trends from 2011 to 2020. Highlights the relationship between IPO activity, valuation, and market risk.
IPO, Europe, first-day returns, market trends, valuation, risk, financial services, EMEIA
false
Market Analysis and Trends
Financial Services
Multiple Chart
EY
Add to my slides
Remove from favorites
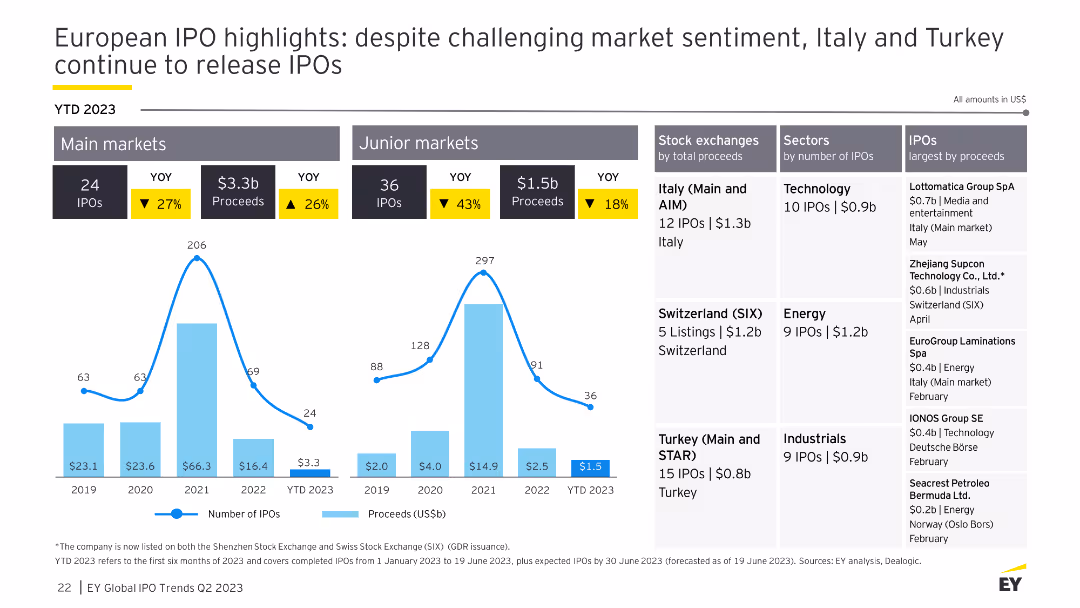
The slide includes column charts for IPO performance in main and junior markets, tables for stock exchanges and sectors, and highlights of the largest IPOs by proceeds.
Market Analysis and Trends
Financial Services
This slide examines the European IPO market, focusing on the challenging market sentiment and the performance of main and junior markets, with details on top exchanges, sectors, and notable IPOs.
IPO, Europe, market sentiment, financial
false
Market Analysis and Trends
Financial Services
Multiple Chart
EY
Add to my slides
Remove from favorites
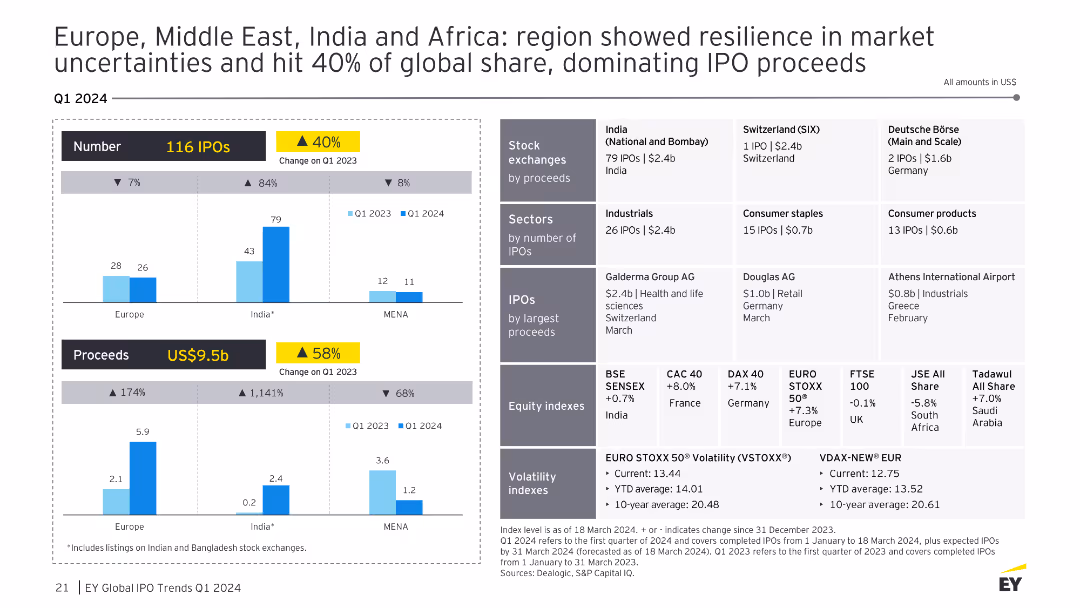
A slide with multiple charts showing the number and proceeds of IPOs in Europe, Middle East, India, and Africa, with detailed exchange and sector breakdowns. The visual complexity is advanced, with comprehensive data.
Market Analysis and Trends
Financial Services
The slide highlights the resilience of the Europe, Middle East, India, and Africa regions in market uncertainties, capturing 40% of the global IPO proceeds. It provides detailed data on the number of IPOs and proceeds by region, along with sector-specific performances and notable IPOs in each region.
IPO, Europe, Middle East, India, Africa, Resilience
false
Market Analysis and Trends
Financial Services
Multiple Chart
EY
Add to my slides
Remove from favorites
Diagram outlining the roles and relationships between different stakeholders in an IPO, including issuers, investment banks, and advisors. The design is structured and uses icons for clarity.
Organizational Structure and Change
Financial Services
This slide elaborates on the various parties involved in an IPO, detailing their responsibilities and interactions to ensure a smooth public offering process.
IPO execution, investment banks, stakeholders, organizational roles, financial services, public offering, strategic planning
false
Organizational Structure and Change
Financial Services
Diagram
PwC/Strategy&
Add to my slides
Remove from favorites
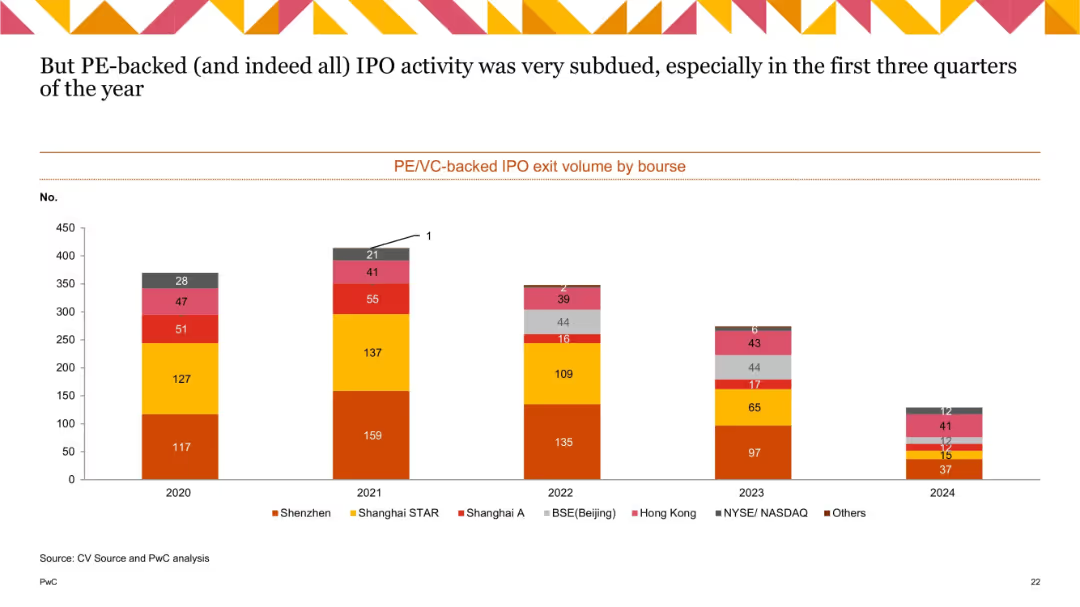
Stacked bar chart showing IPO exit volumes by bourse (2020–2024), categorized by regions like Shenzhen, Hong Kong, NASDAQ, etc.
Mergers and Acquisitions
Financial Services
This slide presents the volume of IPO exits by stock exchange for PE/VC-backed companies. It shows a broad decline over time, particularly notable in 2023–2024, with Shenzhen and Shanghai STAR remaining relatively strong. The subdued IPO activity suggests ongoing market caution and valuation concerns.
IPO exits, PE-backed IPO, VC-backed IPO, bourse, Shenzhen, Hong Kong, NASDAQ, trend
false
Mergers and Acquisitions
Financial Services
Single Chart
PwC/Strategy&
Add to my slides
Remove from favorites
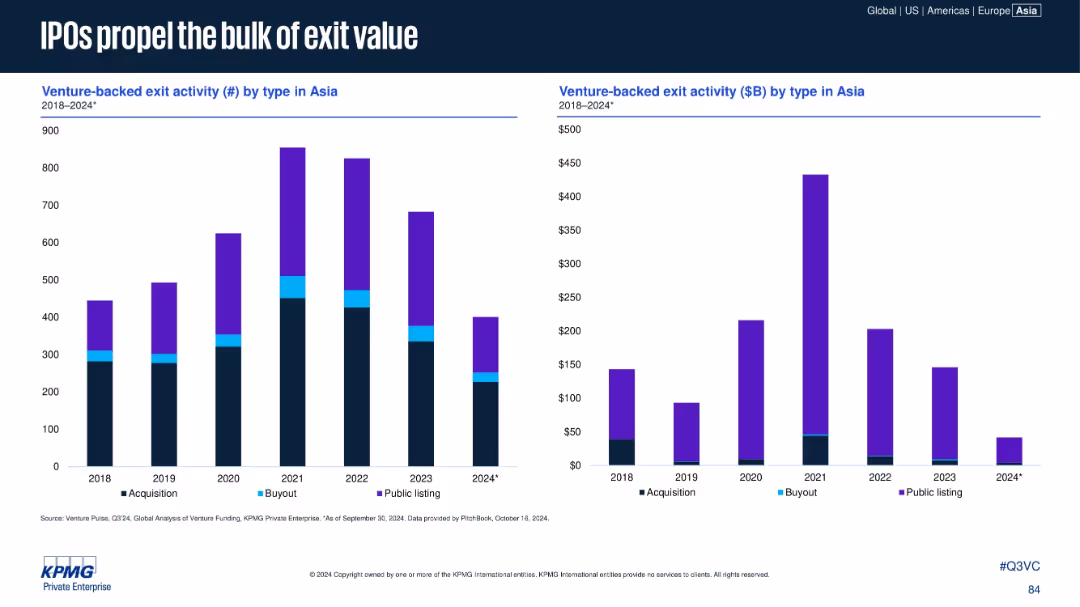
Two side-by-side bar charts comparing venture-backed exit activity in Asia (2018–2024) by type: number of exits and dollar value, color-coded for acquisitions, buyouts, and public listings.
Financial Performance
Financial Services
The slide highlights the dominance of IPOs in exit value among venture-backed companies in Asia, despite fluctuations in exit count. Public listings drive most exit value, peaking in 2021, while acquisitions dominate exit count. 2024 projections show a steep decline across all categories.
IPO, exit value, venture capital, Asia, public listing, acquisition, buyout, KPMG
false
Financial Performance
Financial Services
Multiple Chart
KPMG
Add to my slides
Remove from favorites
Contains multiple sections comparing internal and external factors in IPO setups, using an orange and gray color scheme for clear differentiation.
Risk Assessment and Management
Financial Services
Explores the internal and external factors crucial in the IPO process, like timing, deal size, and choice of listing venue.
IPO, factors, internal, external, timing, deal size, listing venue
false
Risk Assessment and Management
Financial Services
Pillar
PwC/Strategy&
Add to my slides
Remove from favorites
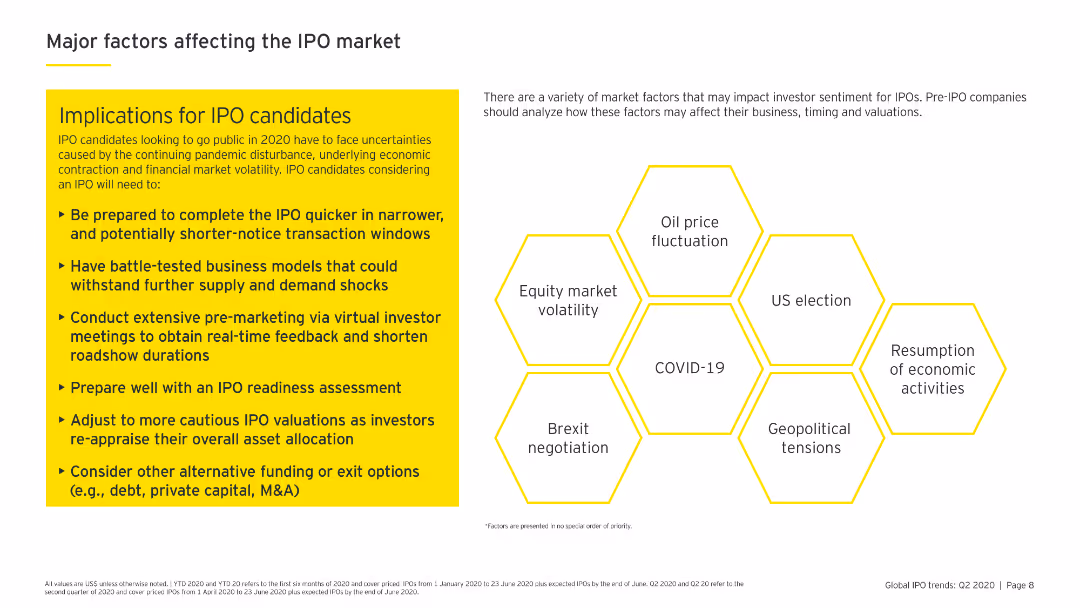
This slide features a text box with a list of implications for IPO candidates, accompanied by a hexagonal diagram highlighting factors affecting the IPO market.
Market Analysis and Trends
Financial Services
Discusses the various market factors impacting IPO candidates, with practical advice on readiness and market conditions, particularly in the context of COVID-19.
IPO factors, market impact, COVID-19, readiness, financial services
false
Market Analysis and Trends
Financial Services
Header Horizontal
EY
Add to my slides
Remove from favorites
Features a combination of column chart, scatter plot chart and a pie chart depicting the relationship between IPO sizes and bank fees in Germany, including individual data points and trends. Text explanations supplement the graphs.
Financial Performance
Financial Services
Analyzes the fee structures associated with German IPOs, providing insights into base fees, incentive fees, and variations based on IPO size, along with strategic implications for financial planning.
IPO fees, financial analysis, German IPOs, fee structure, bank fees, incentive fees, market analysis, regulatory compliance
false
Financial Performance
Financial Services
Multiple Chart
PwC/Strategy&
Add to my slides
Remove from favorites
The slide features multiple pie charts, a stacked bar chart, and a data table. The layout is informative with a red and black color scheme emphasizing key data points.
Industry Overview
Financial Services
The slide provides empirical data on IPO costs from German IPOs, highlighting the major cost components such as bank fees and syndicate fees.
IPO, finance, banking, Germany, costs, empirical data, syndicate fees, bank fees
false
Industry Overview
Financial Services
Multiple Chart
PwC/Strategy&
Add to my slides
Remove from favorites
The slide features column charts comparing the number and proceeds of IPOs from 2018 to 2022 for main and junior markets. Additional tables provide details about stock exchanges, sectors, and notable IPOs.
Market Analysis and Trends
Financial Services
Highlights the significant decline in IPOs and proceeds in 2022 compared to 2021, with detailed data on market performance, stock exchanges, and sector contributions.
IPO, financial markets, Europe, trends, 2022
false
Market Analysis and Trends
Financial Services
Multiple Chart
EY
Add to my slides
Remove from favorites
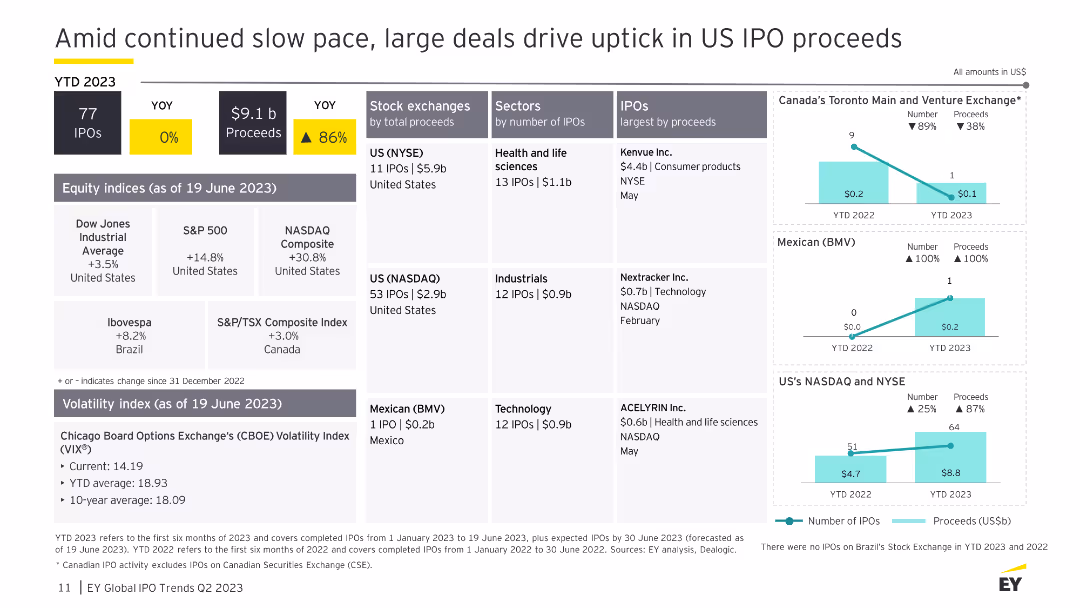
The slide contains a variety of data visualizations, including bar charts and tables, showing IPO activity and proceeds in the US for 2023. It uses yellow and black for highlighting key data points and includes multiple sections with detailed financial data. The layout is advanced, presenting a comprehensive data analysis.
Financial Performance
Financial Services
The slide provides an analysis of US IPO proceeds in 2023, highlighting the impact of large deals amid a slow overall pace. It includes detailed financial data, comparisons with previous years, and insights into various sectors and stock exchanges, offering a thorough review of the financial performance and trends in the IPO market.
IPO, financial performance, US, 2023, analysis
false
Financial Performance
Financial Services
Multiple Chart
EY
Add to my slides
Remove from favorites
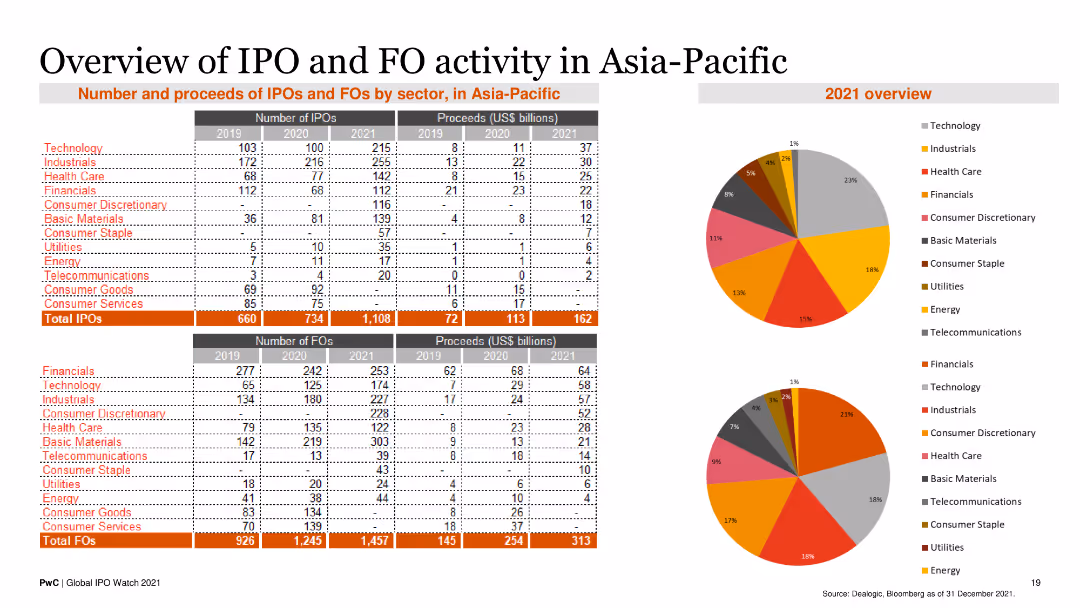
The slide contains two tables displaying the number and proceeds of IPOs and FOs by sector from 2019 to 2021. Two pie charts illustrate the sector distribution for 2021.
Market Analysis and Trends
Financial Services
This slide provides an overview of IPO and FO activities in the Asia-Pacific region, detailing the number and proceeds by sector, and highlighting key trends for 2021.
IPO, FO, Asia-Pacific, Financial Services, Market Trends
false
Market Analysis and Trends
Financial Services
Multiple Chart
PwC/Strategy&
Add to my slides
Remove from favorites
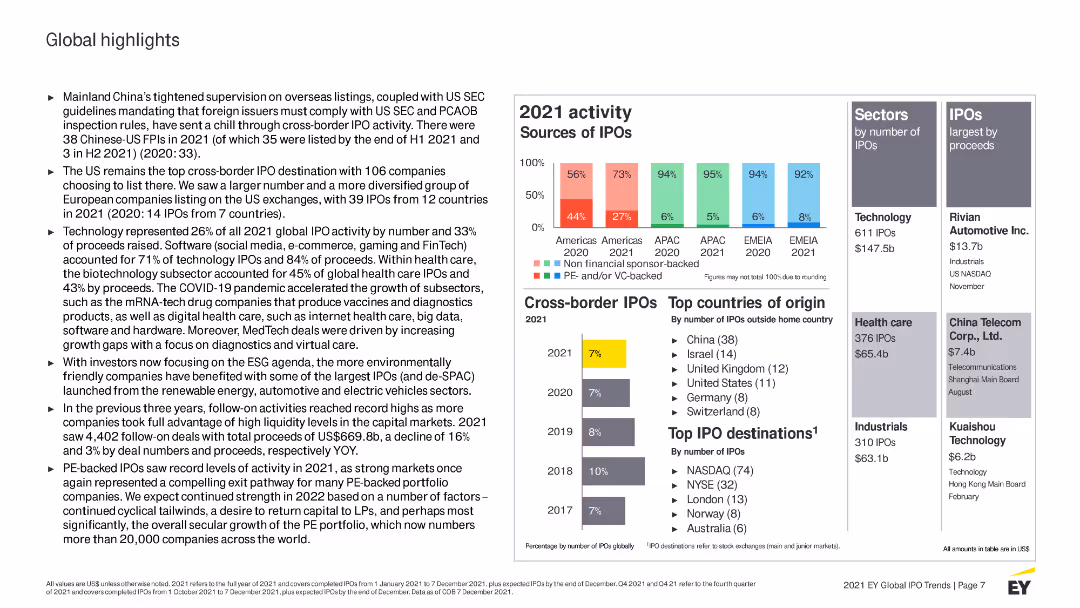
The slide includes bar charts and text sections summarizing key global IPO statistics for 2021, including sources of IPOs and top sectors. Highlights cross-border IPO activity and sector performance.
Market Analysis and Trends
Financial Services
Provides an overview of global IPO highlights in 2021, including major trends, sector performance, and cross-border activity. Emphasizes the role of technology and healthcare in driving market activity.
IPO, global, 2021 highlights, market trends, cross-border, technology, healthcare
false
Market Analysis and Trends
Financial Services
Multiple Chart
EY
Add to my slides
Remove from favorites
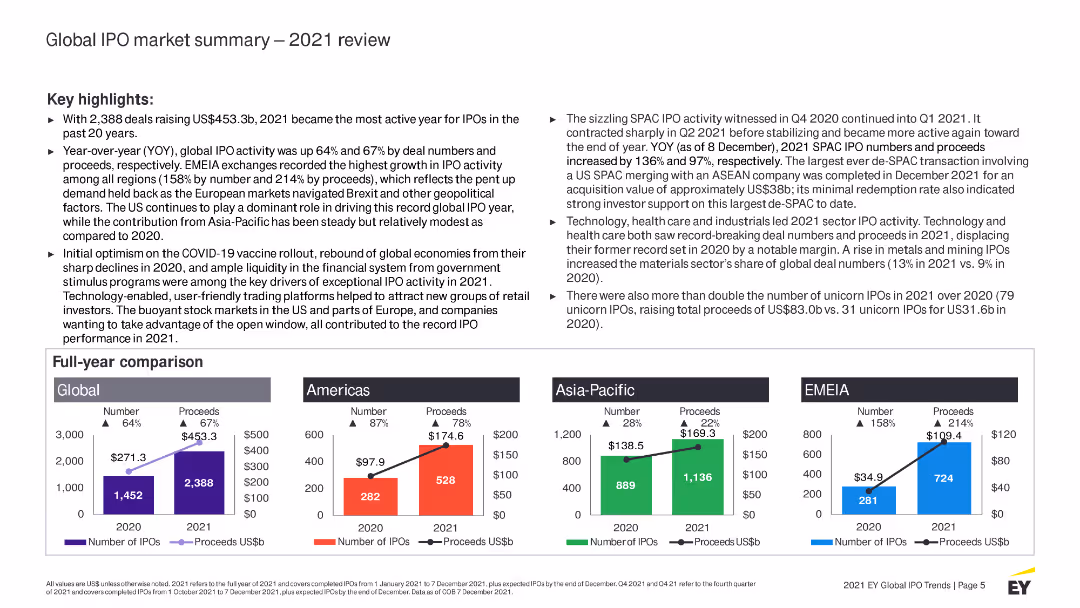
The slide presents a column chart comparing full-year IPO activity in 2020 and 2021 across global, Americas, Asia-Pacific, and EMEIA regions. Text sections review key highlights and sector performance.
Market Analysis and Trends
Financial Services
Reviews global IPO market performance in 2021, noting significant growth compared to 2020. Highlights key trends, sector performance, and the impact of SPACs on the market.
IPO, global, 2021 review, market summary, trends, financial services, SPACs, sector performance
false
Market Analysis and Trends
Financial Services
Multiple Chart
EY
Add to my slides
Remove from favorites
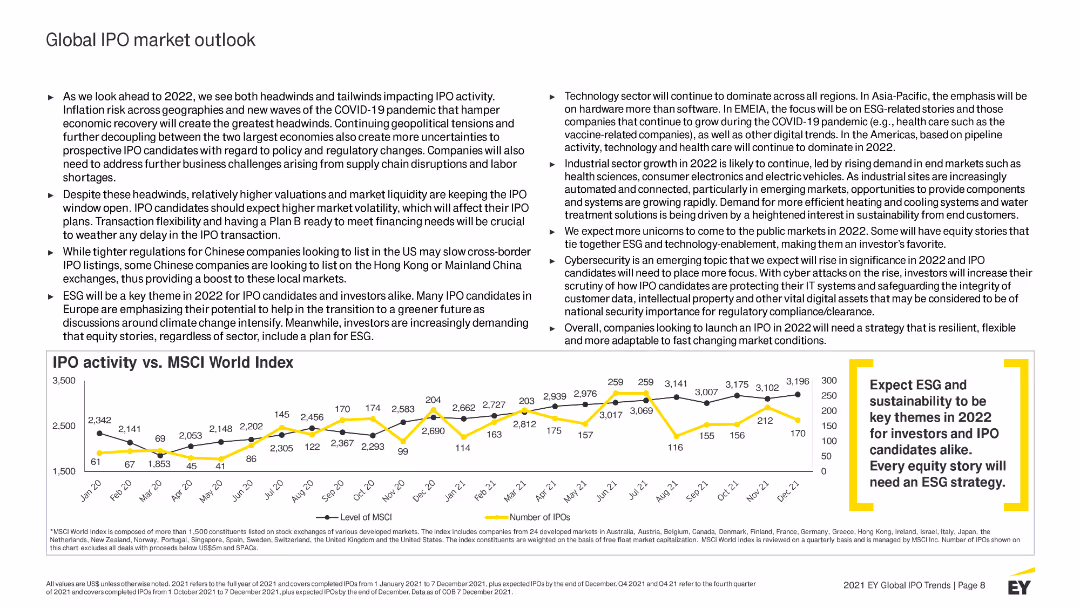
The slide features a line chart comparing IPO activity with the MSCI World Index from 2010 to 2022. Text sections discuss the outlook for global IPO markets, highlighting key trends and expected challenges.
Market Analysis and Trends
Financial Services
Analyzes the outlook for global IPO markets, noting potential headwinds and tailwinds. Discusses the impact of inflation, geopolitical tensions, and ESG considerations on future IPO activity.
IPO, global, market outlook, 2022, trends, challenges, financial services, ESG
false
Market Analysis and Trends
Financial Services
Mixed Chart
EY
Add to my slides
Remove from favorites
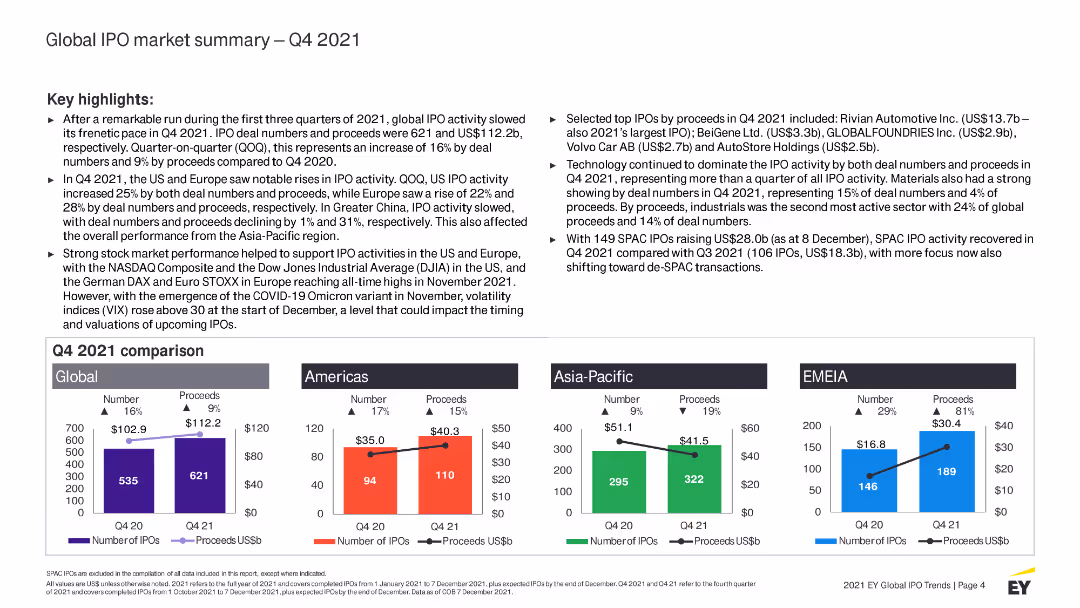
The slide includes a column chart comparing global, Americas, Asia-Pacific, and EMEIA IPO activity in Q4 2021. It also has text sections highlighting key trends and top IPOs by proceeds.
Market Analysis and Trends
Financial Services
Provides a summary of global IPO activity in Q4 2021, comparing regions and highlighting key trends. Discusses notable IPOs and sector performance, including technology and industrial sectors.
IPO, global, Q4 2021, market summary, trends, financial services, technology, industrial
false
Market Analysis and Trends
Financial Services
Multiple Chart
EY
Add to my slides
Remove from favorites
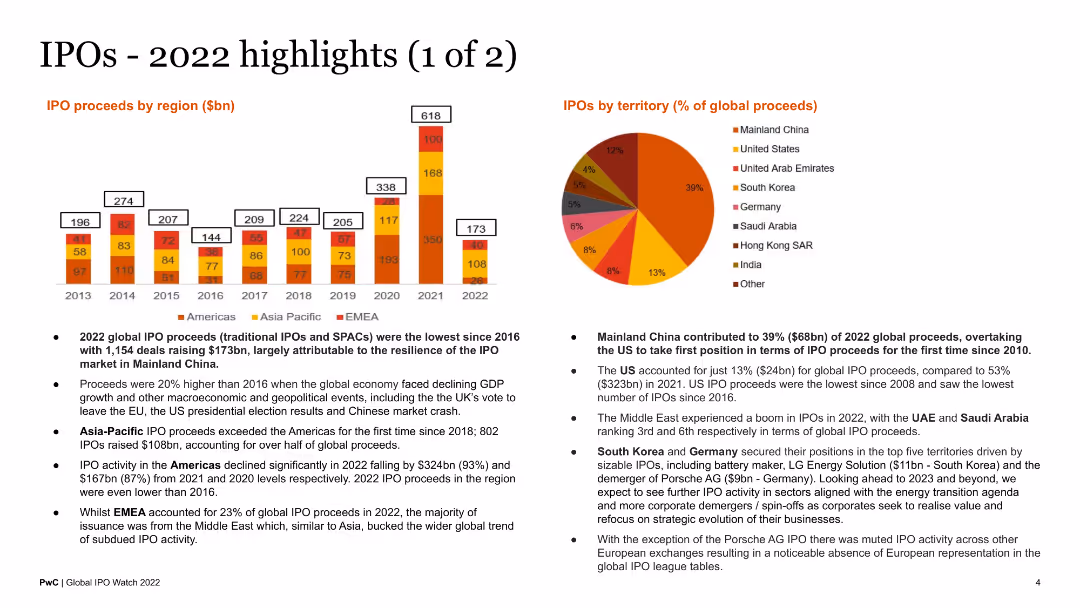
The slide showcases a column chart of IPO proceeds by region from 2013 to 2022 and a pie chart of IPO proceeds by territory for 2022. It is visually dense with a mix of charts and bullet points summarizing the highlights.
Market Analysis and Trends
Financial Services
This slide highlights key data points and trends in global IPO activity for 2022, breaking down proceeds by region and territory. It serves as an informative summary for investors and financial professionals.
IPO highlights, global proceeds, 2022, regional analysis, territory
false
Market Analysis and Trends
Financial Services
Multiple Chart
PwC/Strategy&
Add to my slides
Remove from favorites
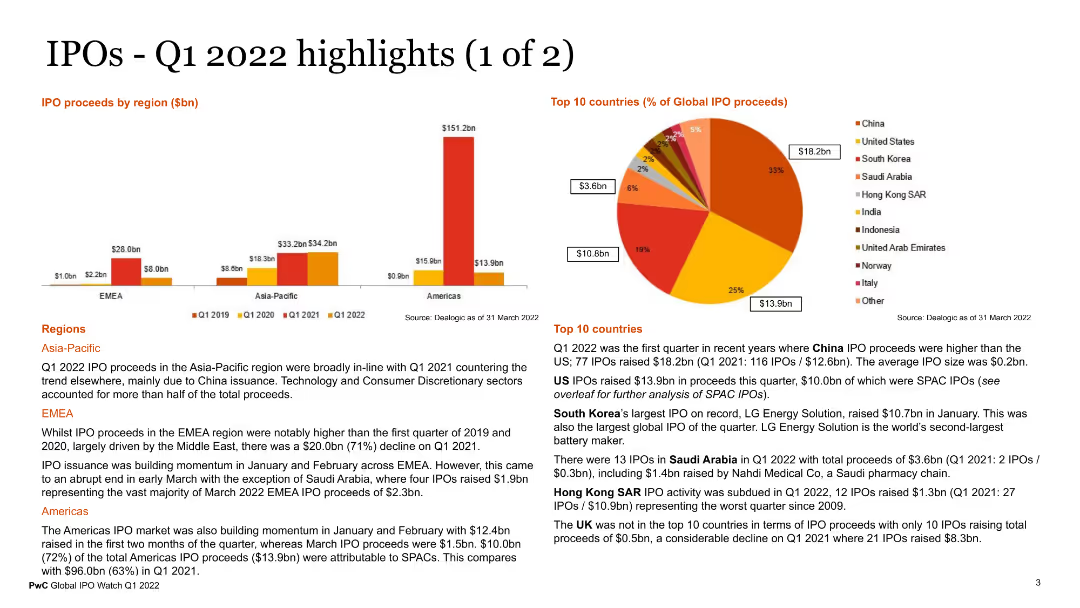
The slide features multiple visual elements, including a column chart for IPO proceeds by region, a pie chart for the top 10 countries by global IPO proceeds, and text sections detailing regional IPO activities in Asia-Pacific, EMEA, and the Americas. The charts use various colors to represent different data points.
Market Analysis and Trends
Financial Services
This slide presents key highlights of IPO activities in Q1 2022, with detailed regional analysis and top countries contributing to IPO proceeds. It provides a clear picture of global IPO trends and regional performance, useful for investors and market analysts.
IPO highlights, Q1 2022, regional analysis, global IPOs, financial trends
false
Market Analysis and Trends
Financial Services
Multiple Chart
PwC/Strategy&
Add to my slides
Remove from favorites
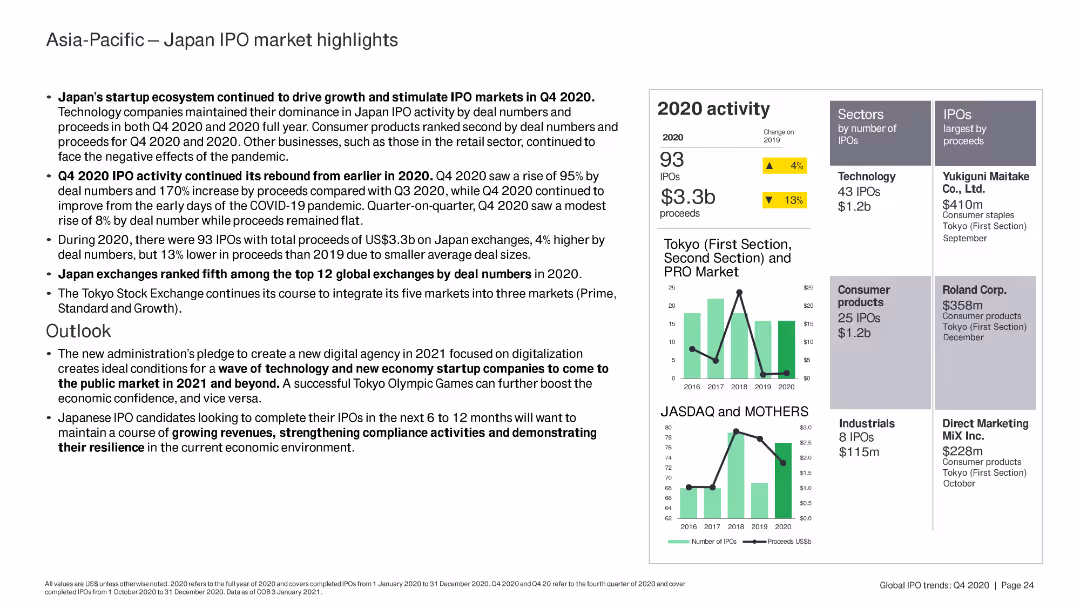
The slide includes multiple sections with text, bullet points, and a right-side panel featuring a column chart comparing Tokyo and JASDAQ/MOTHERS IPO activity from 2016 to 2020. It also has data points on the number of IPOs and proceeds.
Market Analysis and Trends
Financial Services
Discusses Japan's IPO market in Q4 2020, highlighting growth driven by the startup ecosystem, the rebound of IPO activity, and Japan's global ranking. Forecasts technology and digital economy trends for 2021.
IPO, Japan, market, trends, technology, digital economy, startups, Q4 2020, financial services, Asia-Pacific
false
Market Analysis and Trends
Financial Services
Multiple Chart
EY
Add to my slides
Remove from favorites
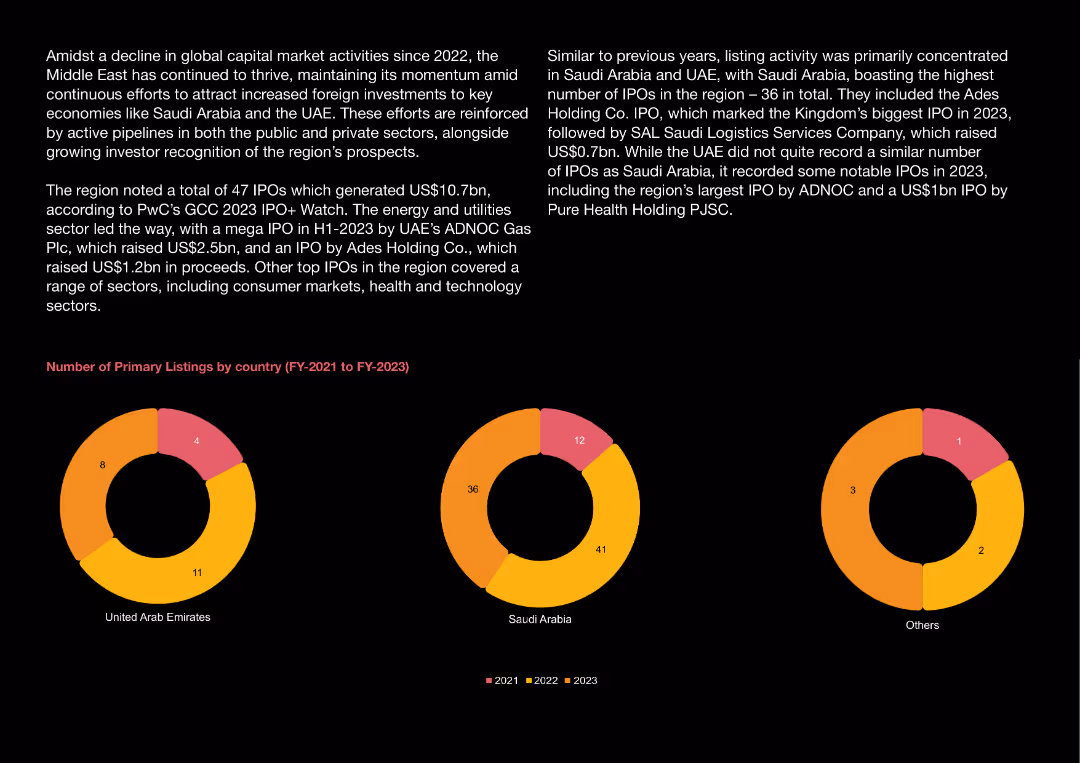
Donut charts showing the number of primary listings in UAE, Saudi Arabia, and Others from FY-2021 to FY-2023, with each year color-coded.
Market Analysis and Trends
Financial Services
Discusses the number of primary listings by country in the Middle East, highlighting key IPOs and their impact on market activity.
IPO, Listings, UAE, Saudi Arabia, Market Activity
false
Market Analysis and Trends
Financial Services
Multiple Chart
PwC/Strategy&
Add to my slides
Remove from favorites
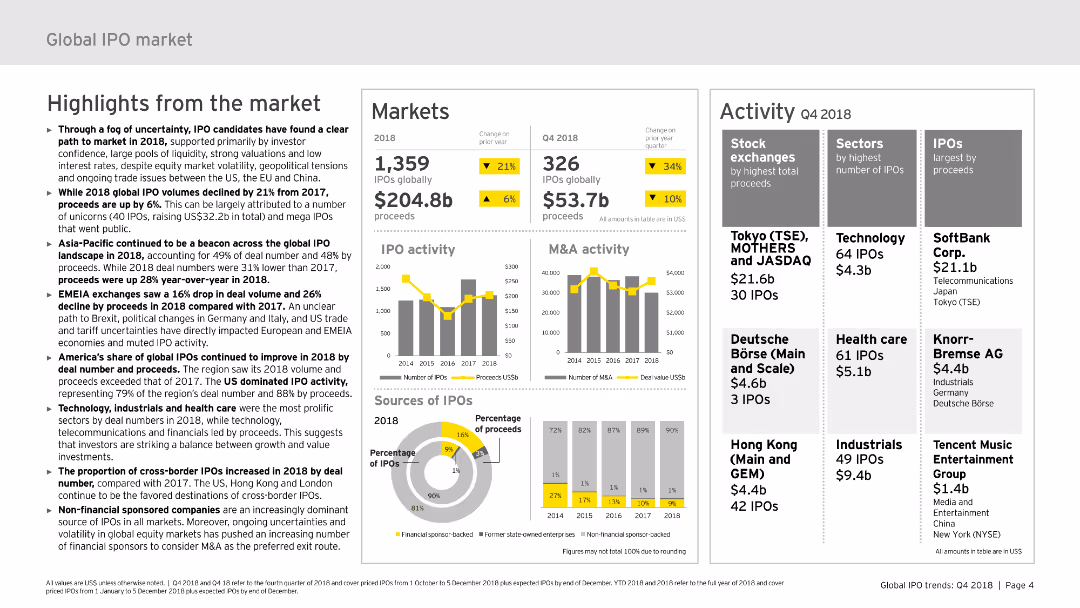
The slide includes text summaries, column charts, and pie charts presenting highlights from the global IPO market, focusing on trends and key metrics for 2018 and Q4 2018.
Market Analysis and Trends
Financial Services
This slide provides an overview of the global IPO market in 2018, discussing key trends, regional performances, and notable IPO activities across various sectors.
IPO market, 2018, trends, highlights, key metrics
false
Market Analysis and Trends
Financial Services
Multiple Chart
EY
Add to my slides
Remove from favorites
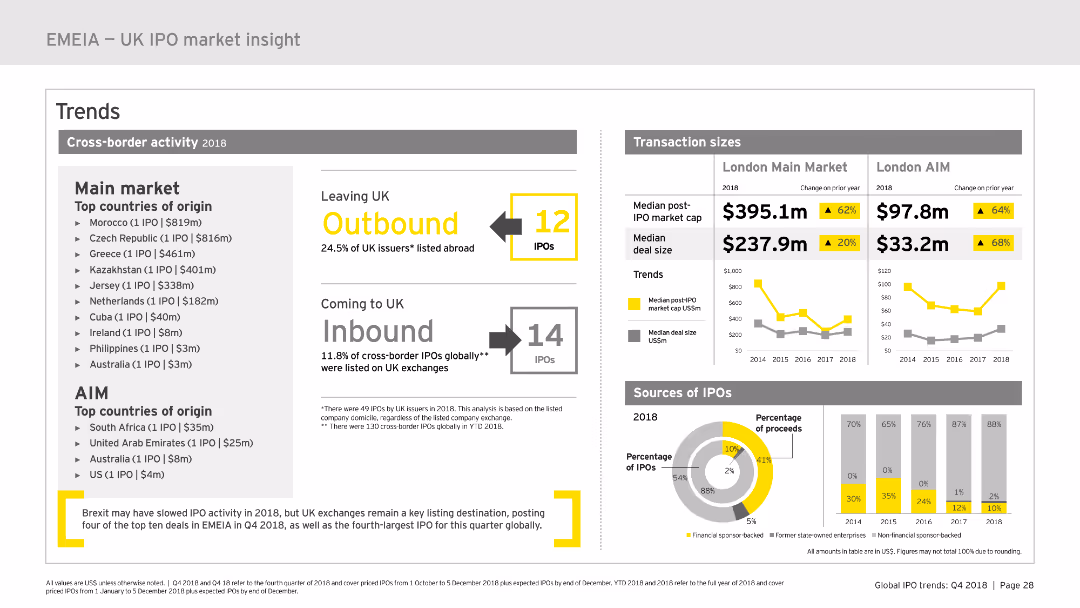
The slide features various charts including a column chart and a pie chart, highlighting cross-border IPO activity, transaction sizes, and sources of IPOs in 2018.
Market Analysis and Trends
Financial Services
Provides insights into cross-border IPO activity in the UK for 2018, highlighting outbound and inbound IPOs, transaction sizes, and IPO sources.
IPO, market cap, outbound, inbound, transaction size, median, deal size, percentage, financial services, 2018
false
Market Analysis and Trends
Financial Services
Multiple Chart
EY
Add to my slides
Remove from favorites
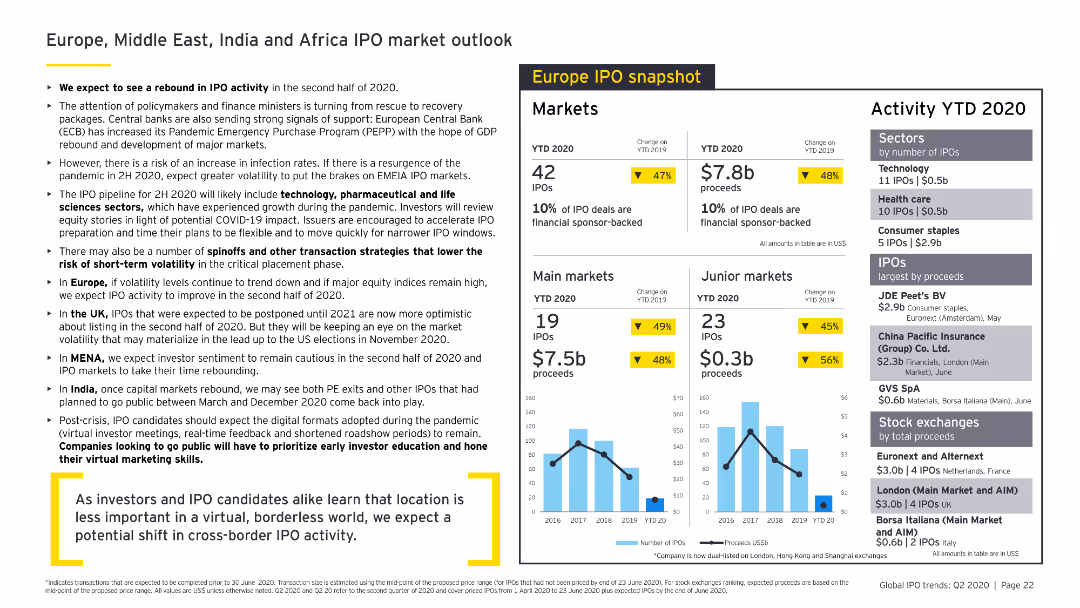
Contains a mix of bullet points, column charts, and data tables. The slide is densely packed with information, featuring various sections for different regions and industries.
Market Analysis and Trends
Financial Services
Provides an outlook on IPO markets in Europe, Middle East, India, and Africa for 2020, highlighting expected trends, market activities, and sector performance in various regions.
IPO, market outlook, Europe, Middle East, India, Africa
false
Market Analysis and Trends
Financial Services
Multiple Chart
EY
Add to my slides
Remove from favorites
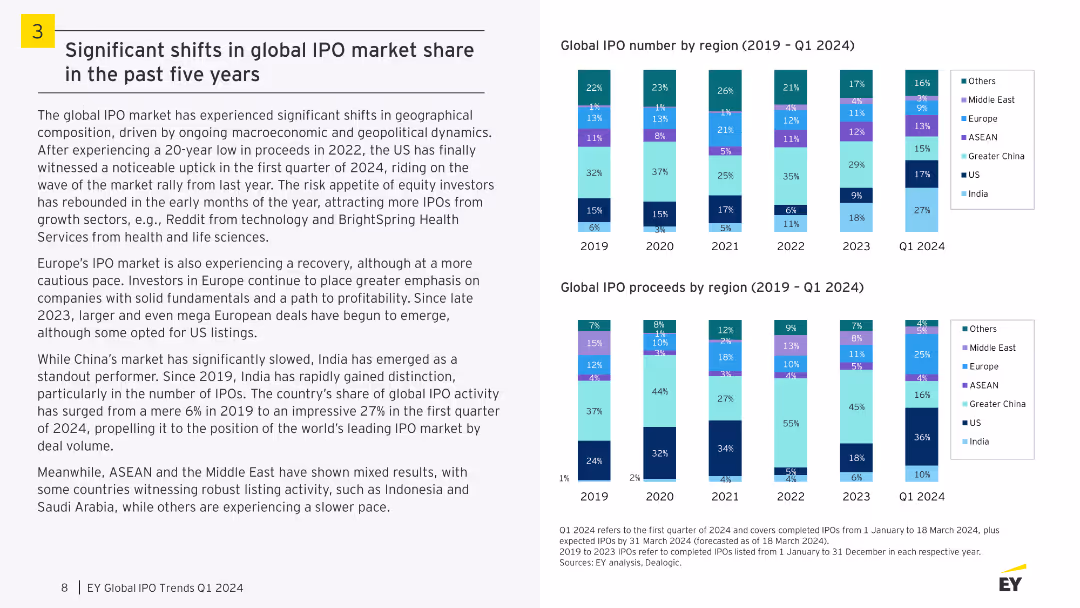
A slide featuring two bar charts showing global IPO numbers and proceeds by region over five years. The visual complexity is moderate, focusing on trends and geographical shifts.
Market Analysis and Trends
Financial Services
The slide analyzes significant geographical shifts in the global IPO market, with detailed statistics on IPO numbers and proceeds by region. It highlights the increasing market share of regions like India and the US, while noting the mixed results in regions like ASEAN and the Middle East.
IPO, Market Share, Global, Trends, Regions, Shifts
false
Market Analysis and Trends
Financial Services
Multiple Chart
EY
Add to my slides
Remove from favorites
Light background with yellow title banner, text-heavy content, and a bubble chart comparing 2023 IPO markets with the 5-year average.
Market Analysis and Trends
Financial Services
This slide examines the rise of new IPO markets like Indonesia, Malaysia, and Turkey, while traditional markets like Hong Kong face challenges. It includes a bubble chart visualizing IPO market performance relative to the 5-year average.
IPO markets, high-growth, traditional markets, performance, 2023
false
Market Analysis and Trends
Financial Services
Mixed Chart
EY
Add to my slides
Remove from favorites
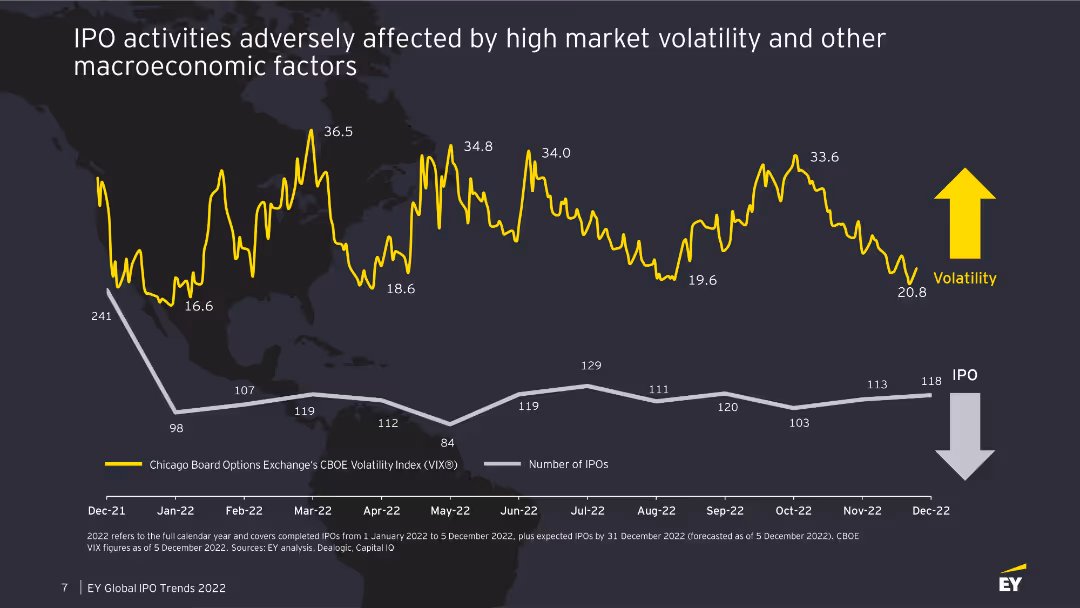
The slide features a line chart tracking the volatility index and the number of IPOs over time, with key data points highlighted. The background is a world map, adding a global context.
Market Analysis and Trends
Financial Services
The slide examines how high market volatility and macroeconomic factors have adversely affected IPO activities, showing a correlation between the volatility index and the number of IPOs from December 2021 to December 2022.
IPO, market volatility, VIX, macroeconomic factors
false
Market Analysis and Trends
Financial Services
Single Chart
EY
Add to my slides
Remove from favorites
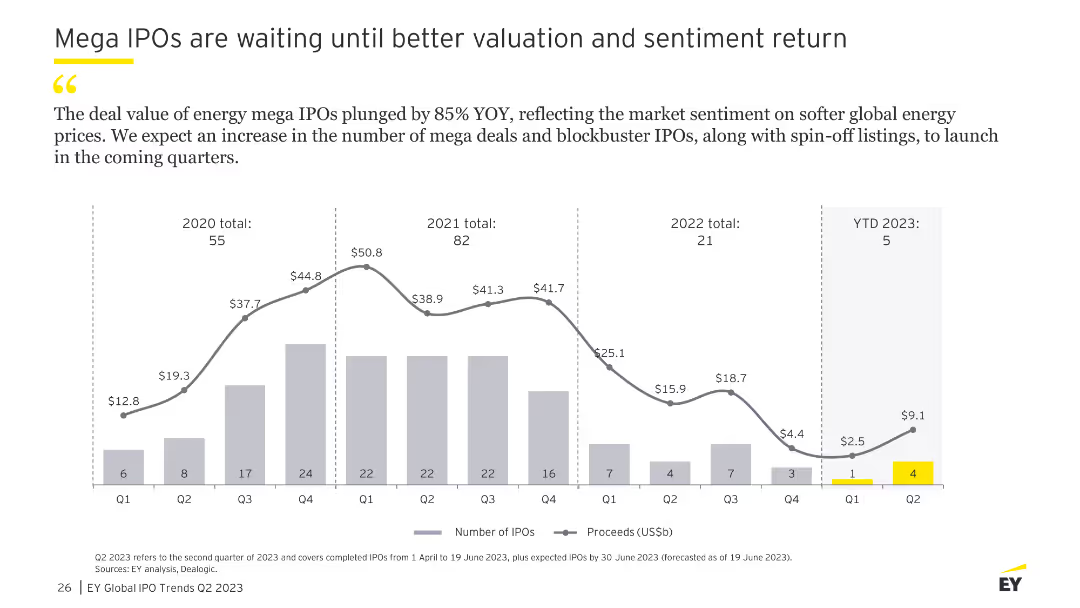
The slide features a column chart showing the number of mega IPOs and their proceeds from Q1 2020 to YTD 2023, with a focus on energy sector IPOs.
Market Analysis and Trends
Financial Services
This slide analyzes the trend of mega IPOs, particularly in the energy sector, noting a significant decline in deal value and an expectation for future increases as market sentiment improves.
IPO, mega deals, valuation, sentiment, energy
false
Market Analysis and Trends
Financial Services
Single Chart
EY
Add to my slides
Remove from favorites
The slide features multiple column charts illustrating MENA IPO activity from Q1 2018 to Q4 2022, GCC IPOs, and non-GCC IPOs. The charts use purple and red to distinguish between proceeds and the number of IPOs.
Market Analysis and Trends
Financial Services
This slide provides a comprehensive snapshot of MENA IPO market activity from Q1 2018 to Q4 2022, including a breakdown of GCC and non-GCC IPOs. It presents trends in the number of IPOs and proceeds, highlighting significant fluctuations and market dynamics over the years.
IPO, MENA markets, financial services, market trends, GCC, non-GCC, market snapshot, financial data, proceeds, number of IPOs
false
Market Analysis and Trends
Financial Services
Multiple Chart
EY
Add to my slides
Remove from favorites
The slide has a detailed summary text on the left, with two small bar charts on the right showing IPO proceeds and activity in Q4 2022. The layout is text-heavy with supporting visuals in grey and red for data highlights.
Market Analysis and Trends
Financial Services
This slide summarizes the record IPO activity in the MENA markets during Q4 2022. It highlights key IPOs, total proceeds, and changes compared to previous quarters. It includes a detailed narrative of notable IPOs and market performance, supported by visual data on proceeds and activity.
IPO, MENA markets, financial services, market trends, quarterly summary, IPO activity, proceeds, financial data, market analysis, investment
false
Market Analysis and Trends
Financial Services
Mixed Chart
EY
Add to my slides
Remove from favorites
Light background with yellow title banner, text-heavy content, and two line charts comparing IPO activity with major indices.
Financial Performance
Financial Services
This slide discusses the underperformance of IPOs in 2023 despite strong equity markets, highlighting various factors such as monetary policies, investor sentiment, and after-market performance. Line charts compare US IPO activity vs. S&P 500 and European IPO activity vs. STOXX Europe 600.
IPO performance, equity markets, 2023, financial trends, monetary policies
false
Financial Performance
Financial Services
Multiple Chart
EY
Add to my slides
Remove from favorites
This slide includes a horizontal bar chart displaying the post-IPO performance of the top 10 global IPOs relative to the MSCI World Index as of December 2021.
Market Analysis and Trends
Financial Services
It highlights the performance of major IPOs, showing the percentage change in value compared to a global market index, useful for investment analysis.
IPO performance, MSCI World Index, investment analysis, top IPOs, post-IPO performance
false
Market Analysis and Trends
Financial Services
Single Chart
PwC/Strategy&
Add to my slides
Remove from favorites
This slide features a horizontal bar chart (EV/EBITDA multiple) and a line chart (IPO performance weeks after IPO). The layout is dense with data visualizations and text sections on both sides.
Financial Performance
Financial Services
The slide analyzes the post-IPO performance and trading multiples of payment providers, highlighting companies like Adyen that are performing well, and discussing issues faced by others like Paysafe and Finablr.
IPO, performance, trading multiples, payment, analysis, Adyen, Paysafe, Finablr, EV/EBITDA, financial
false
Financial Performance
Financial Services
Multiple Chart
Deloitte
Add to my slides
Remove from favorites
The slide includes bar charts showing the percentage of IPOs trading below their offer prices by region and sector, highlighting improvements in post-IPO performance.
Market Analysis and Trends
Financial Services
This slide discusses the year-over-year improvement in post-IPO performance across various regions and sectors, with detailed statistics on trading performance relative to offer prices.
IPO, performance, YOY, financial, regions
false
Market Analysis and Trends
Financial Services
Multiple Chart
EY
Add to my slides
Remove from favorites
This slide includes a bar chart showing IPO proceeds by region and a pie chart for sector-wise proceeds. Text blocks explain key highlights. The layout is colorful and data-centric.
Financial Performance
Financial Services
It highlights the record-breaking IPO activity in 2021 across different regions and sectors, detailing the financial performance and growth trends.
IPO Proceeds, Regional Analysis, Sector Analysis, 2021 Highlights, Financial Trends
false
Financial Performance
Financial Services
Multiple Chart
PwC/Strategy&
Add to my slides
Remove from favorites
This slide includes a detailed process diagram of the IPO stages, with icons and text explaining each phase from pre-kickoff to post-IPO. The layout is clear and structured, enhancing comprehension.
Strategic Planning
Financial Services
Provides a comprehensive overview of the IPO process, detailing each phase including preparation, execution, and post-IPO activities, emphasizing transparency and structural needs of the company.
IPO process, public offering, preparation, execution, post-IPO, company structure, investment, financial planning
false
Strategic Planning
Financial Services
Linear Flow
PwC/Strategy&
Add to my slides
Remove from favorites
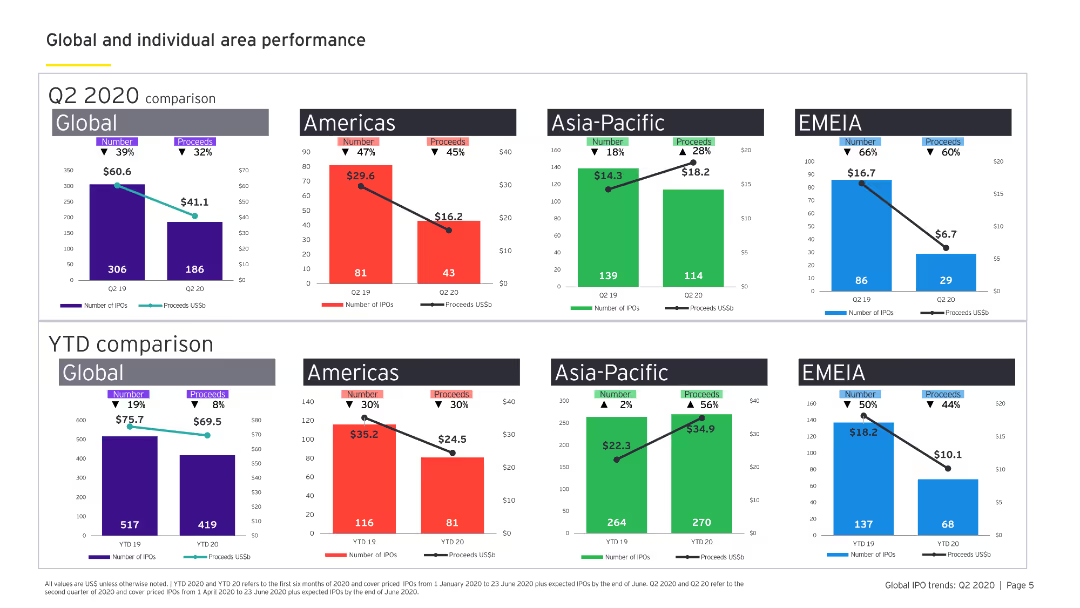
The slide contains two sets of column charts comparing Q2 2020 and YTD performance across Global, Americas, Asia-Pacific, and EMEIA. Each region is color-coded.
Market Analysis and Trends
Financial Services
The slide provides a visual comparison of the number of IPOs and proceeds across different regions globally, comparing the second quarter and year-to-date performance.
IPO, Q2 2020, YTD, global performance, financial services, Americas, Asia-Pacific, EMEIA
false
Market Analysis and Trends
Financial Services
Multiple Chart
EY
Add to my slides
Remove from favorites
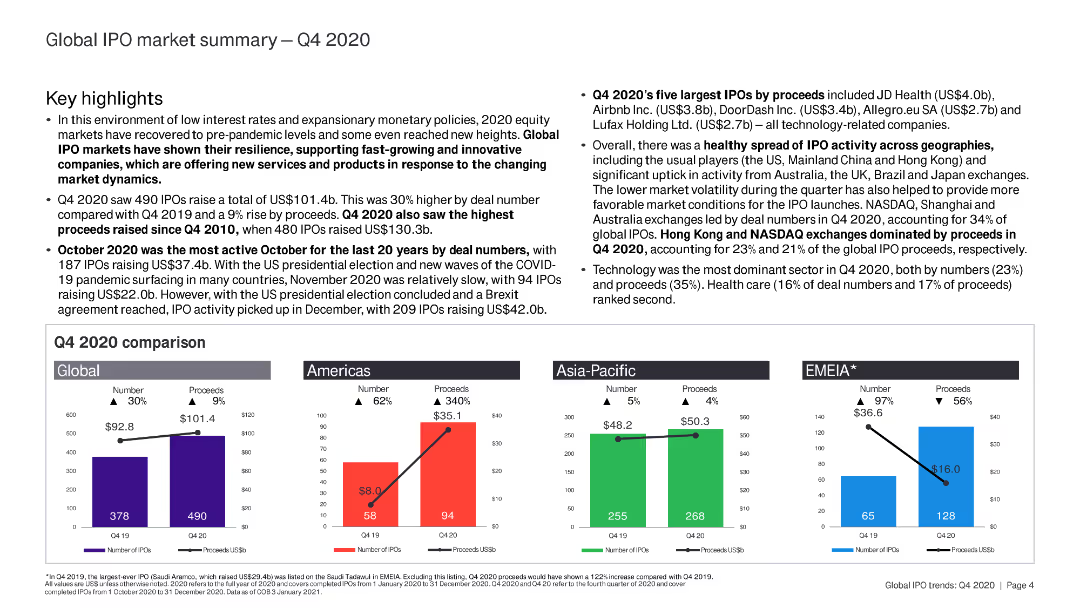
The slide is text-heavy with key highlights and comparative analysis of IPO markets in Q4 2020. It includes small bar charts for regional comparisons.
Market Analysis and Trends
Financial Services
This slide summarizes the global IPO market in Q4 2020, covering key highlights, largest IPOs, and regional analysis.
IPO, Q4 2020, global market, key highlights, regional analysis
false
Market Analysis and Trends
Financial Services
Multiple Chart
EY
Add to my slides
Remove from favorites
The slide features a mix of text boxes and images. It outlines the steps and modules of the EY IPO readiness assessment program. The layout is structured with numbered sections and highlighted key points.
Strategic Planning
Professional Services
This slide explains the EY IPO readiness assessment, detailing the steps and modules involved in preparing companies for an IPO. It includes strategic planning, structure, taxes, financial preparation, and more, providing a comprehensive guide for businesses looking to go public.
IPO readiness, professional services, strategic planning, assessment program, preparation steps, EY, business planning, public listing
false
Strategic Planning
Professional Services
Header Vertical
EY
Add to my slides
Remove from favorites
Light background with yellow title banner, text-heavy content, and a column chart comparing IPO returns vs. offer prices by market cap.
Financial Performance
Financial Services
The slide analyzes how large-cap IPOs have trailed smaller deals in returns within a volatile environment. It includes a column chart showing weighted average IPO returns vs. offer prices by market cap for 2022 and 2023.
IPO returns, large-cap, market volatility, 2023, financial analysis
false
Financial Performance
Financial Services
Multiple Chart
EY
Add to my slides
Remove from favorites
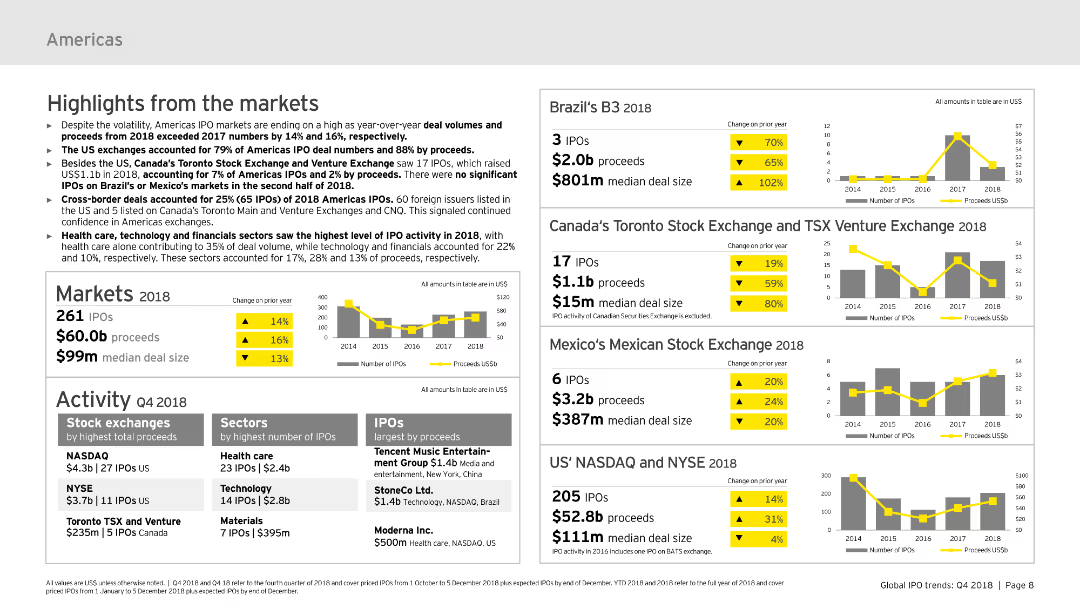
The slide includes text summaries and column charts showing market highlights for the Americas in 2018, focusing on IPO volumes, proceeds, and notable exchanges and sectors.
Market Analysis and Trends
Financial Services
This slide summarizes IPO market highlights for the Americas in 2018, discussing key market metrics, performance by stock exchanges, and sectors with the highest IPO activity.
IPOs, Americas, 2018, market highlights, sectors
false
Market Analysis and Trends
Financial Services
Multiple Chart
EY
Add to my slides
Remove from favorites
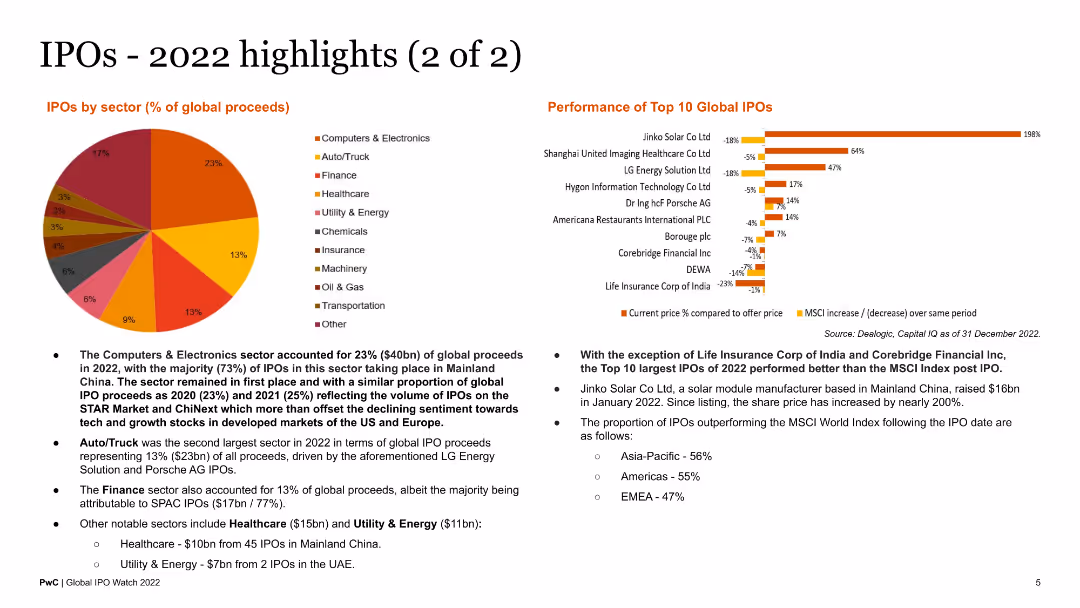
This slide includes a pie chart showing IPOs by sector and a bar chart of the performance of the top 10 global IPOs. Text blocks provide additional context and analysis of the data presented.
Market Analysis and Trends
Financial Services
The slide provides an analysis of IPO activity by sector and evaluates the performance of the top IPOs globally in 2022. It is useful for financial analysts reviewing sector-specific IPO performance and investment opportunities.
IPO sectors, top IPOs, global performance, 2022 analysis
false
Market Analysis and Trends
Financial Services
Multiple Chart
PwC/Strategy&
Add to my slides
Remove from favorites
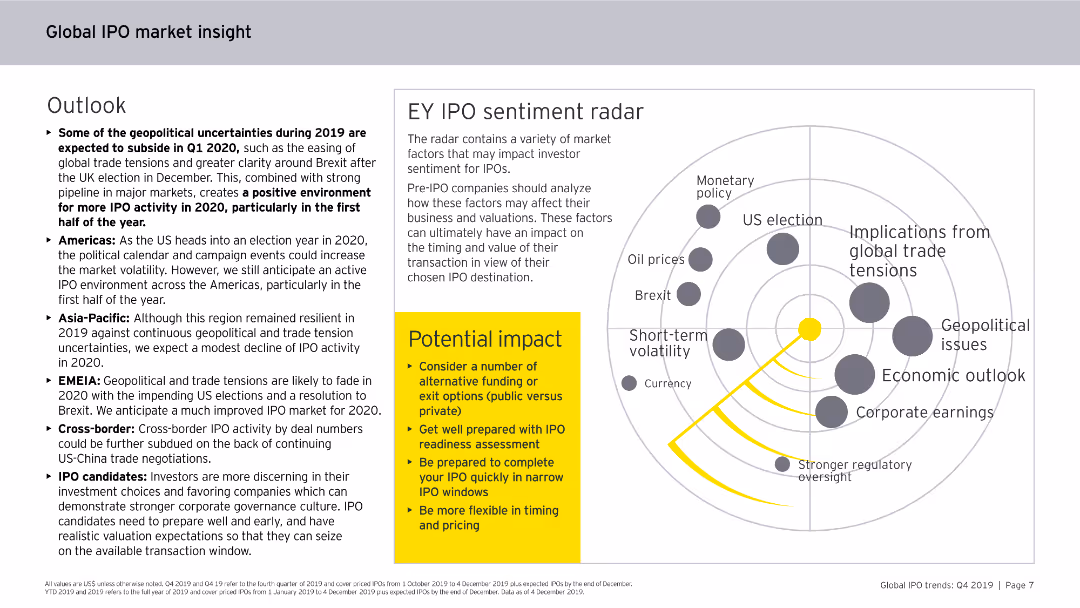
Features a radar chart, bullet points, and a callout box. The slide is visually engaging, focusing on IPO sentiment and potential impacts on the market.
Market Analysis and Trends
Financial Services
Examines the geopolitical uncertainties and their effects on IPO activities, with a detailed sentiment analysis radar chart and strategic insights for IPO candidates.
IPO sentiment, geopolitical, market impact, 2020, trends
false
Market Analysis and Trends
Financial Services
Boxed
EY
Add to my slides
Remove from favorites
Column charts showing financial metrics of companies and a table listing recent investment rounds with details.
Investment Analysis
Financial Services
Highlights recent IPOs and financing rounds in the warehouse automation sector, showing company performance and investment details.
IPOs, financing, warehouse automation, investment, market cap
false
Investment Analysis
Financial Services
Multiple Chart
LEK
Add to my slides
Remove from favorites
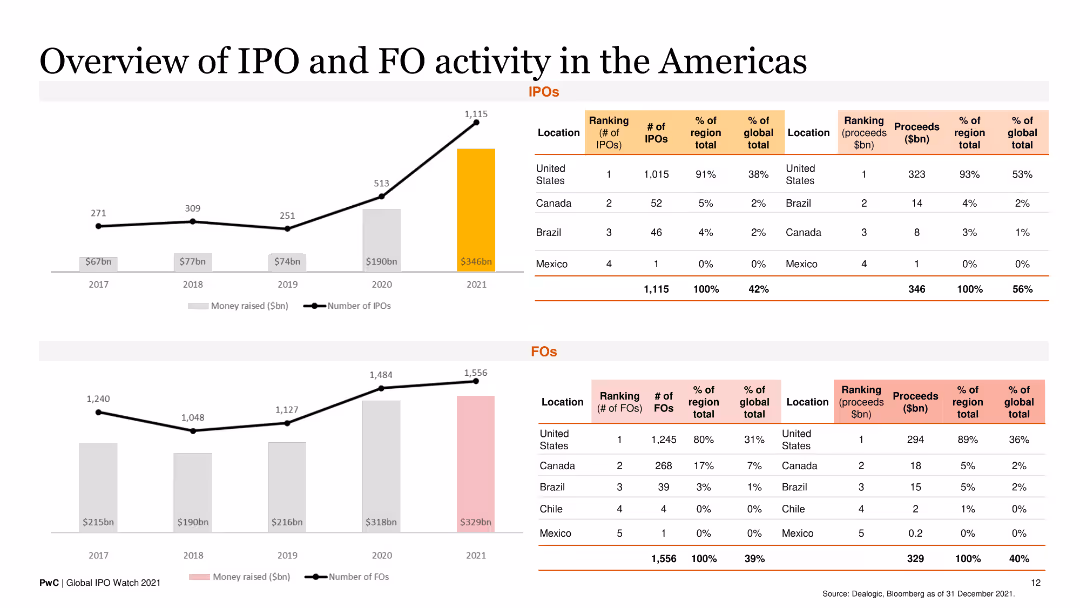
This slide has a combination of line charts and bar charts detailing the number and proceeds of IPOs and FOs in the Americas from 2017 to 2021, with a regional breakdown.
Market Analysis and Trends
Financial Services
It offers insights into the IPO and FO activities specific to the Americas, including regional rankings and proceeds, beneficial for market analysis.
IPOs, FOs, Americas, regional trends, financial analysis
false
Market Analysis and Trends
Financial Services
Multiple Chart
PwC/Strategy&
Add to my slides
Remove from favorites
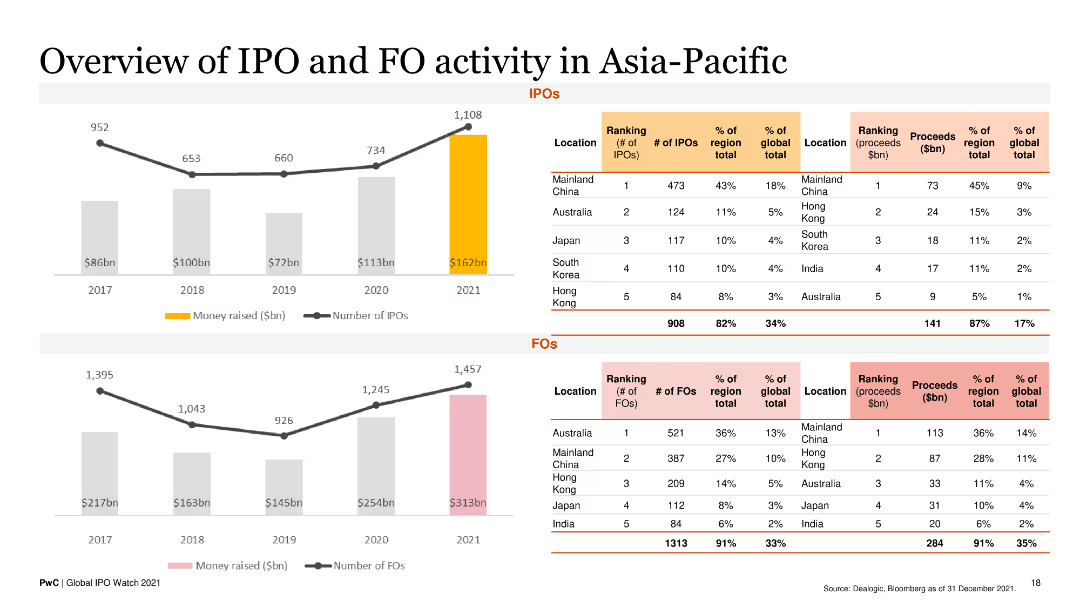
This slide contains line and column charts showing the number and proceeds of IPOs and FOs in the Asia-Pacific region from 2017 to 2021, with a regional breakdown.
Market Analysis and Trends
Financial Services
It offers insights into IPO and FO activities in the Asia-Pacific region, highlighting key countries and financial performance, useful for market analysis.
IPOs, FOs, Asia-Pacific, regional trends, financial analysis
false
Market Analysis and Trends
Financial Services
Multiple Chart
PwC/Strategy&
Add to my slides
Remove from favorites
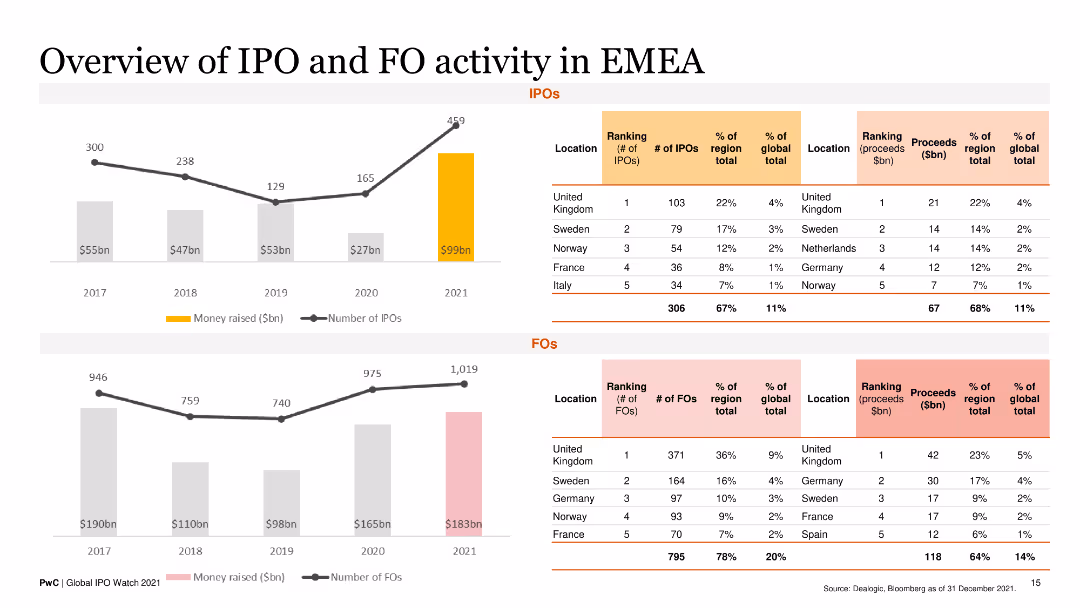
This slide presents line charts and column charts showing the number and proceeds of IPOs and FOs in EMEA from 2017 to 2021, with a regional ranking breakdown.
Market Analysis and Trends
Financial Services
It offers a detailed analysis of IPO and FO activities in the EMEA region, highlighting key countries and financial performance over the years.
IPOs, FOs, EMEA, regional trends, financial analysis
false
Market Analysis and Trends
Financial Services
Multiple Chart
PwC/Strategy&
Add to my slides
Remove from favorites
The slide has three sets of column charts, each representing IPO and FO activities by quarter in the Americas, EMEA, and Asia-Pacific regions from 2017 to 2021.
Market Analysis and Trends
Financial Services
It offers a detailed analysis of IPO and FO trends across three major regions, illustrating money raised and number of deals over the years.
IPOs, FOs, regional trends, financial data, quarterly analysis
false
Market Analysis and Trends
Financial Services
Multiple Chart
PwC/Strategy&
Add to my slides
Remove from favorites
Previous
Next
You don't have any favorites yet.
Please wait loading your favorites slides...
Create a FREE account to continue browsing
Receive Instant Access to 1,000+ slides from companies like McKinsey, Google, and Goldman Sachs
First Name
Last Name
Email
Password
I agree to all
Terms & Privacy Policy
Thank you! Your submission has been received!
Oops! Something went wrong while submitting the form.
Have an account?
Sign in
Upgrade to PRO to Save slides
Advanced Search and Filters
Access to 15,000+ slides
Access to Category Pages
Save/Bookmark Slides
PowerPoint Template Library
Pick a Plan
MONTHLY
$12/month
Billed every month, Cancel anytime.
YEARLY
$9/year
Billed $108 annually, Cancel anytime.
Checkout for $12/month
Checkout for $108/yr
Secured by Stripe | AES-256 bit encryption