My Account
My Slides
Search by Category
Pricing
Templates
View All Templates
Download Template Slides
✦ AI Search
Feedback
Login
Logout
Get Started
Browse all Slides
Browse all Slides
Create a FREE Account
Instant access to 1,000+ real slides from top companies like McKinsey, BCG, Goldman Sachs, Google and many more!
First Name
Last Name
Email
Password
I agree to all
Terms & Privacy Policy
Thank you! Your submission has been received!
Oops! Something went wrong while submitting the form.
Have an account?
Sign in
Saved Slides
Total No. of slides saved
0
↻ Refresh
✖ Clear all
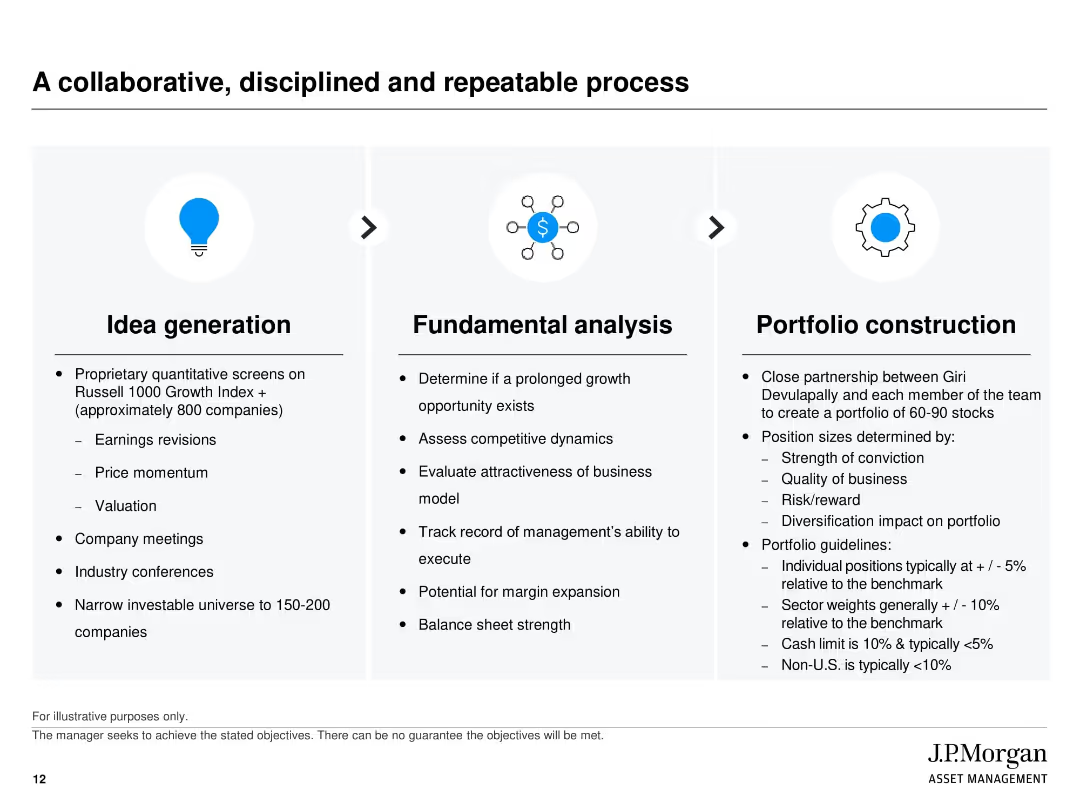
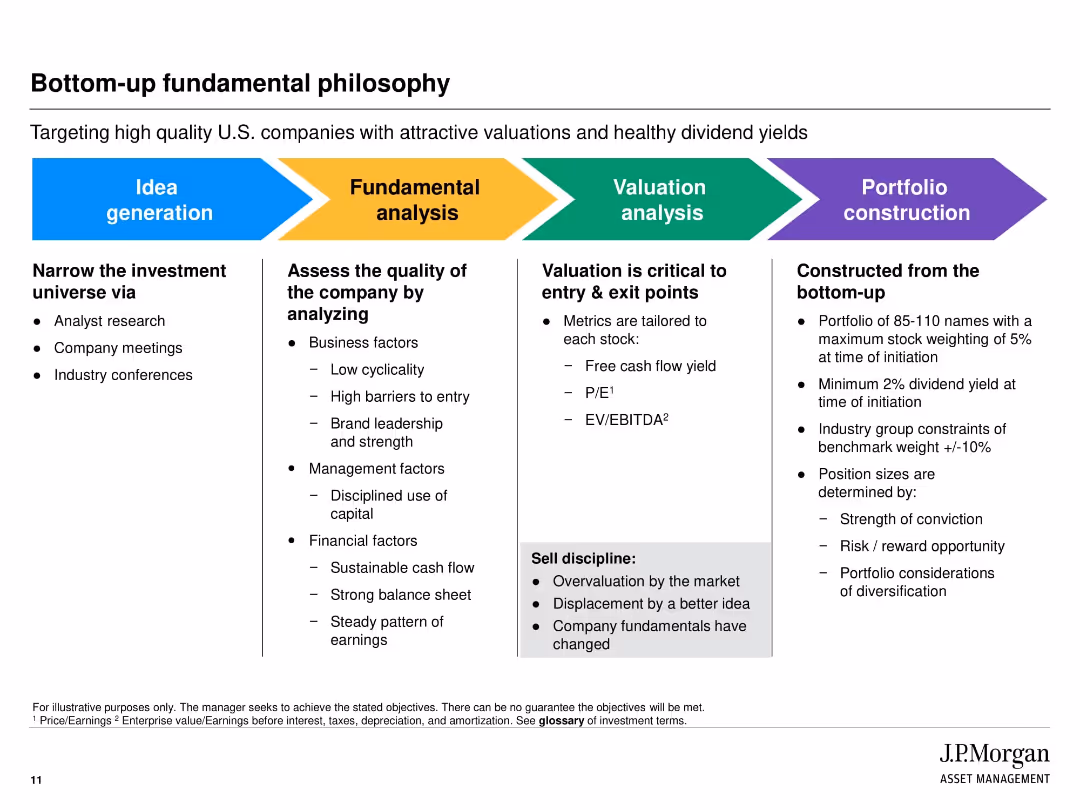
Three-column horizontal flow (Idea generation → Fundamental analysis → Portfolio construction); icons and bullet points for each stage
Technology and Digital Transformation
Financial Services
This slide outlines the investment process used by J.P. Morgan’s Large Cap Growth Strategy team, covering idea generation, analysis, and portfolio construction. It emphasizes discipline, data-driven screening, risk evaluation, and position sizing techniques.
Investment process, portfolio management, stock screening, idea generation, risk management, valuation, fundamentals
false
Technology and Digital Transformation
Financial Services
Linear Flow
JP Morgan
Add to my slides
Remove from favorites
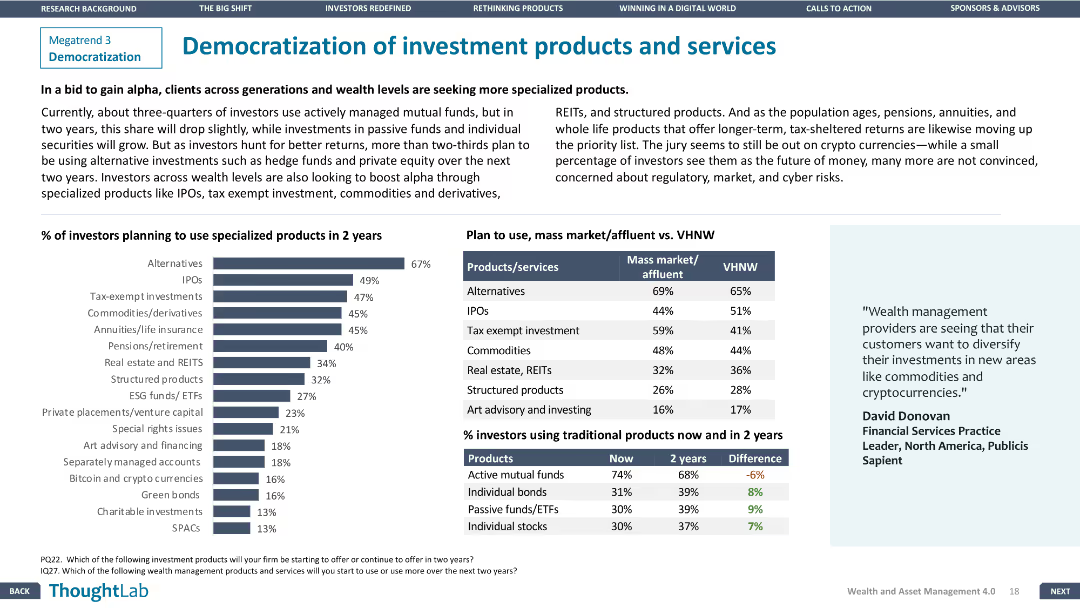
The slide includes a column chart of investor plans for specialized products and a comparison table for mass market vs. VHNW preferences.
Product and Service Analysis
Financial Services
The slide analyzes trends in investment product preferences, focusing on the shift towards specialized products among different investor segments.
Investment products, Democratization, Financial Services, Specialized products, Investor preferences
false
Product and Service Analysis
Financial Services
Mixed Chart
Deloitte
Add to my slides
Remove from favorites
The slide has a bar chart of investment products held and a pie chart of the percentage invested in at least one financial product. Colors are used to distinguish categories.
Market Analysis and Trends
Financial Services
This slide presents data on the types of investment products held by respondents and the percentage of respondents with at least one financial product investment.
investment, products, financial, percentage, crypto
false
Market Analysis and Trends
Financial Services
Multiple Chart
IPSOS
Add to my slides
Remove from favorites
A column chart compares the ownership of various investment products between 2022 and 2023 among Canadians.
Market Analysis and Trends
Financial Services
It lists the most common investment products held by Canadians and compares the ownership rates between 2022 and 2023.
Investment, Products, Ownership, Canadians, 2023, 2022, Column Chart, Financial, Trends
false
Market Analysis and Trends
Financial Services
Mixed Chart
IPSOS
Add to my slides
Remove from favorites
A column chart showing the percentage of respondents owning various investment products, such as mutual funds, pension plans, GICs, stocks, ETFs, and others.
Financial Performance
Financial Services
Details the ownership of different investment products among Canadian investors, highlighting the prevalence of mutual funds, pension plans, GICs, stocks, ETFs, and other securities.
investment products, ownership, mutual funds, stocks
false
Financial Performance
Financial Services
Single Chart
IPSOS
Add to my slides
Remove from favorites
The slide presents a horizontal bar chart listing various investment products owned by respondents.
Market Analysis and Trends
Financial Services
The slide details the ownership distribution of various investment products such as mutual funds, stocks, and bonds.
Investment, Products, Ownership, Mutual Funds, Stocks
false
Market Analysis and Trends
Financial Services
Single Chart
IPSOS
Add to my slides
Remove from favorites
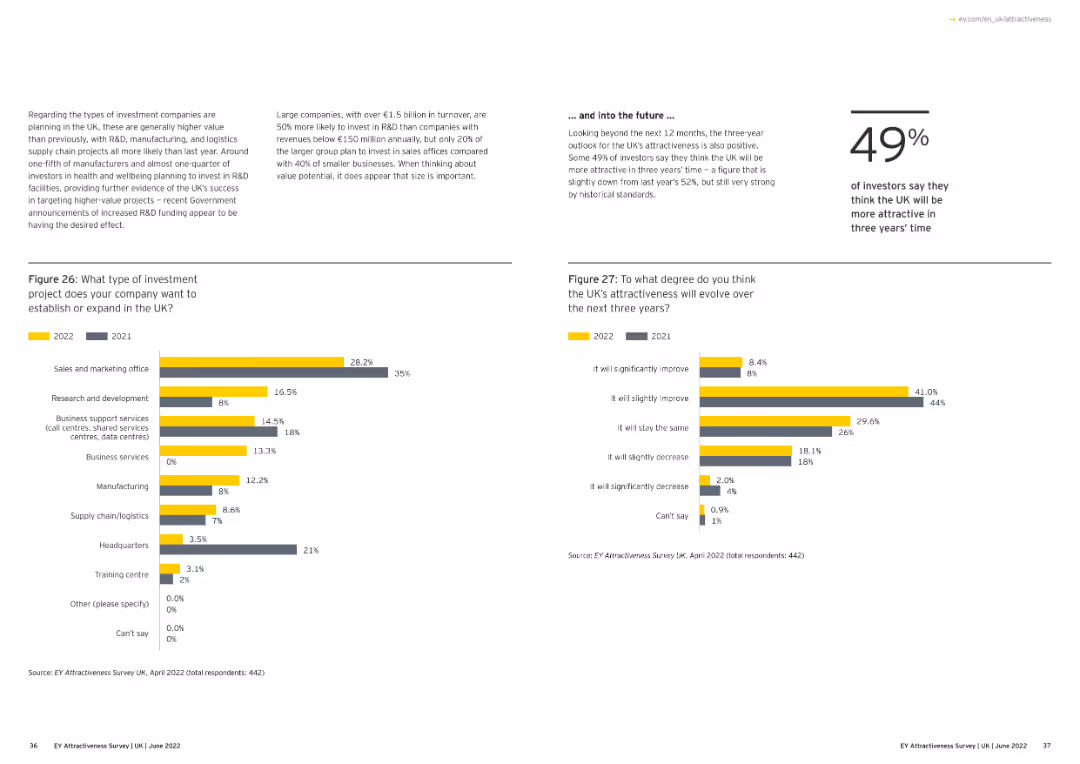
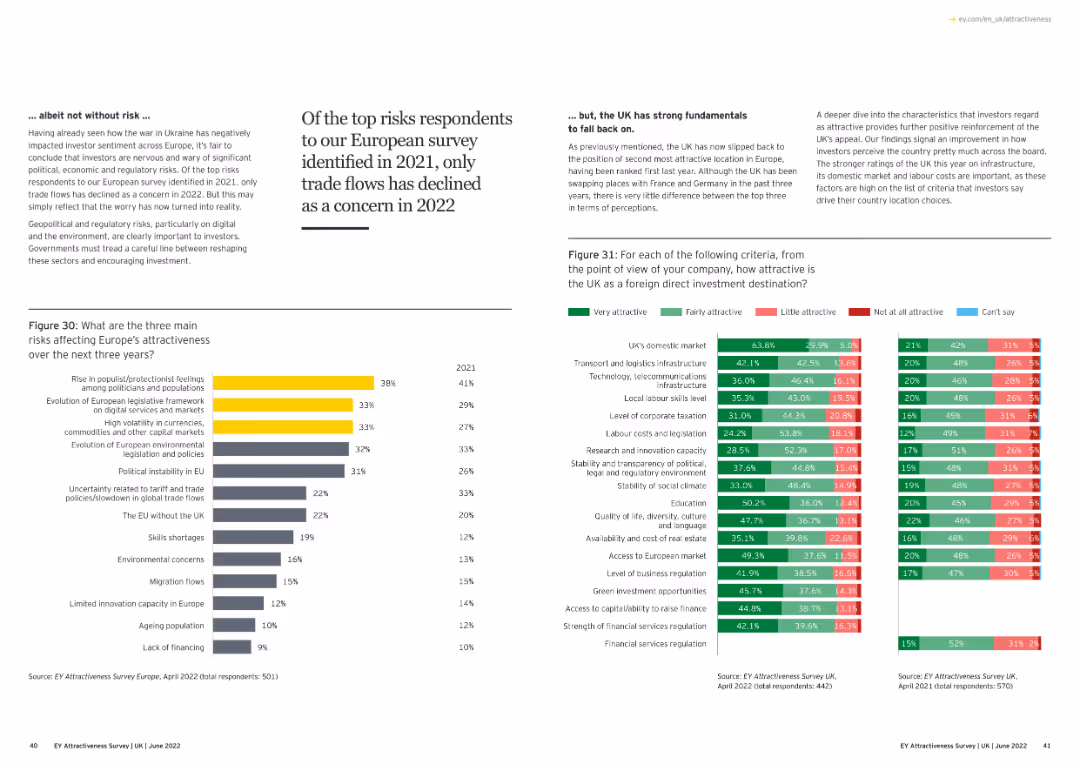
The slide features a combination of column charts and text blocks. On the left, a column chart shows investment project types in 2022 and 2021, with different colored bars. On the right, another column chart shows the projected attractiveness of the UK over three years.
Market Analysis and Trends
Financial Services
This slide shows survey data on the types of investment projects companies plan to establish or expand in the UK and their views on the UK's attractiveness over the next three years.
Investment projects, UK attractiveness, column charts, financial services, market analysis
false
Market Analysis and Trends
Financial Services
Multiple Chart
EY
Add to my slides
Remove from favorites
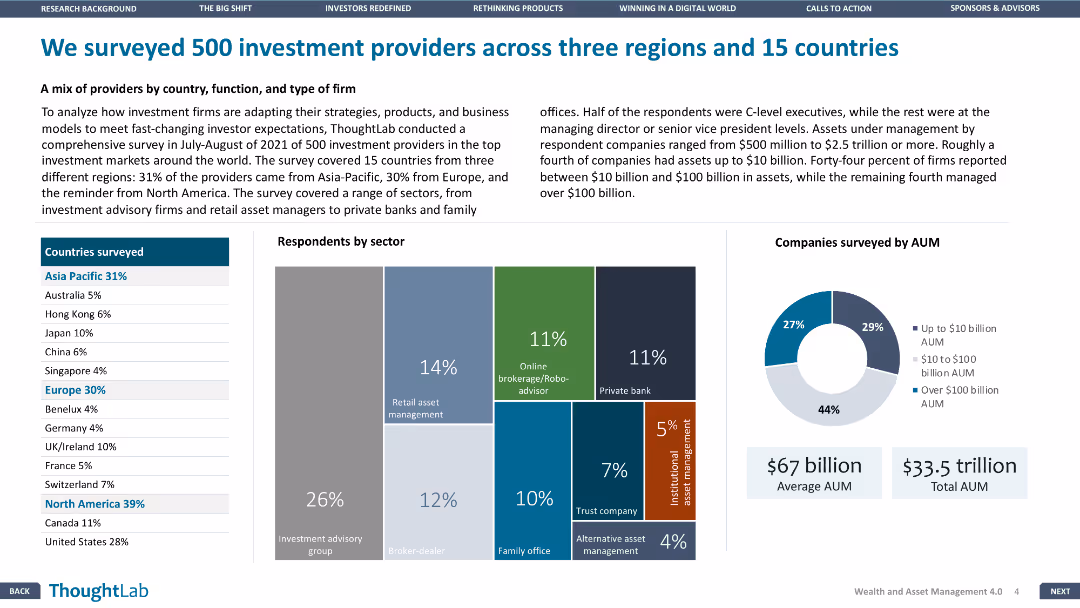
The slide features various data visualizations, including a world map, column chart, and pie charts, presenting the survey demographics of investment providers across different regions, functions, and firm types.
Market Analysis and Trends
Financial Services
Analyzes the survey results of 500 investment providers, highlighting their geographical distribution, sector segmentation, and asset management under management, providing a comprehensive market overview.
investment providers, survey, geographical distribution, sector segmentation, asset management
false
Market Analysis and Trends
Financial Services
Multiple Chart
Deloitte
Add to my slides
Remove from favorites
The slide features a line chart showing the volume of raised investment in QT start-ups from 2001 to 2022, with a spike around 2022. Includes text highlighting $2.35B and 75% investment in quantum computing players.
Investment Analysis
Financial Services
This slide discusses the record high of QT start-up investments in 2022, which grew only 1% year-over-year, highlighting the dominance of quantum computing players in investment.
investment, quantum computing, start-ups, annual growth, financial trends
false
Investment Analysis
Financial Services
Mixed Chart
McKinsey
Add to my slides
Remove from favorites
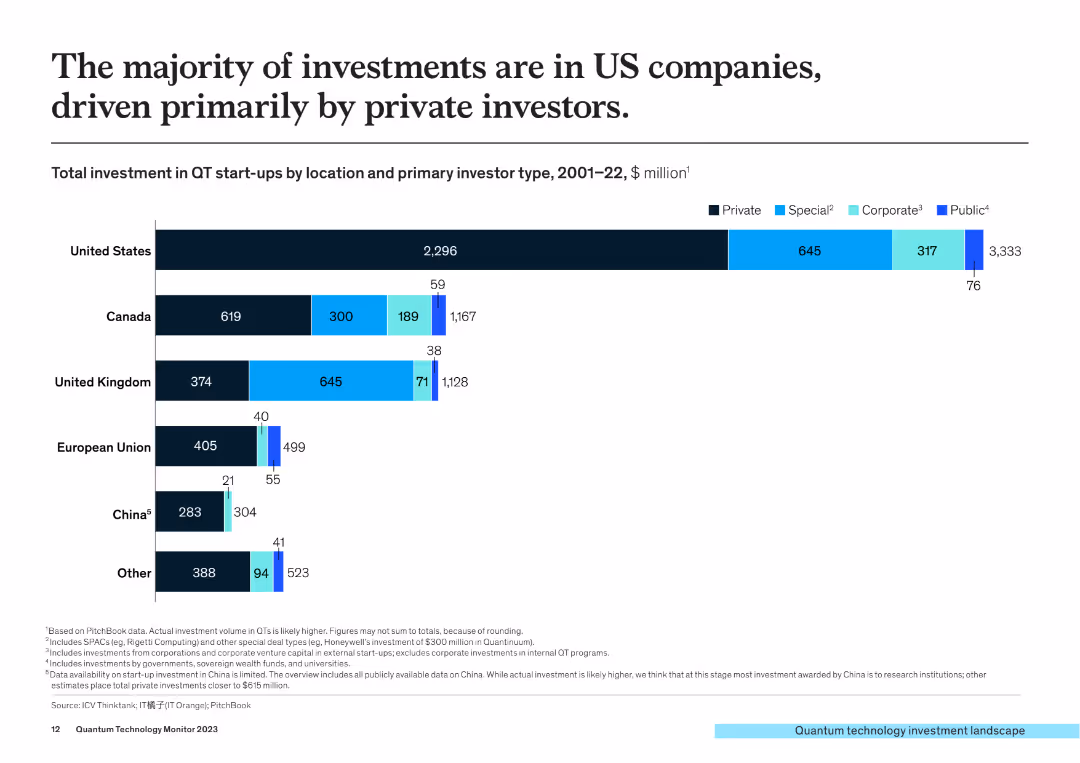
The slide presents a column chart showing total investment in QT start-ups by location (US, Canada, UK, EU, China, Other) and primary investor type (Private, Special, Corporate, Public) from 2001-2022.
Market Analysis and Trends
Financial Services
This slide shows that the majority of QT investments are in US companies, driven by private investors, with a detailed breakdown of investment types across different regions.
investment, quantum technology, US companies, private investors, regional analysis
false
Market Analysis and Trends
Financial Services
Single Chart
McKinsey
Add to my slides
Remove from favorites
The slide has a bar chart of reasons for investing, such as better long-term returns and low-interest rates, with a text box summarizing insights by age group.
Market Analysis and Trends
Financial Services
The slide shows survey data on the reasons why respondents invest, focusing on long-term returns, interest rates, and enjoyment of investing.
investment, reasons, returns, interest, enjoyment
false
Market Analysis and Trends
Financial Services
Mixed Chart
IPSOS
Add to my slides
Remove from favorites
Contains mekko charts detailing investment flows in Indonesia with a focus on renewable energy, mobility, and other sectors. The design uses contrasting colors for clarity.
Investment Analysis
Energy & Utilities
Analyzes investment trends in Indonesia's renewable energy sector, highlighting major investors and financial flows within the private sector focused on sustainable initiatives.
investment, renewable energy, Indonesia, private sector, sustainability
false
Investment Analysis
Energy & Utilities
Single Chart
Bain
Add to my slides
Remove from favorites
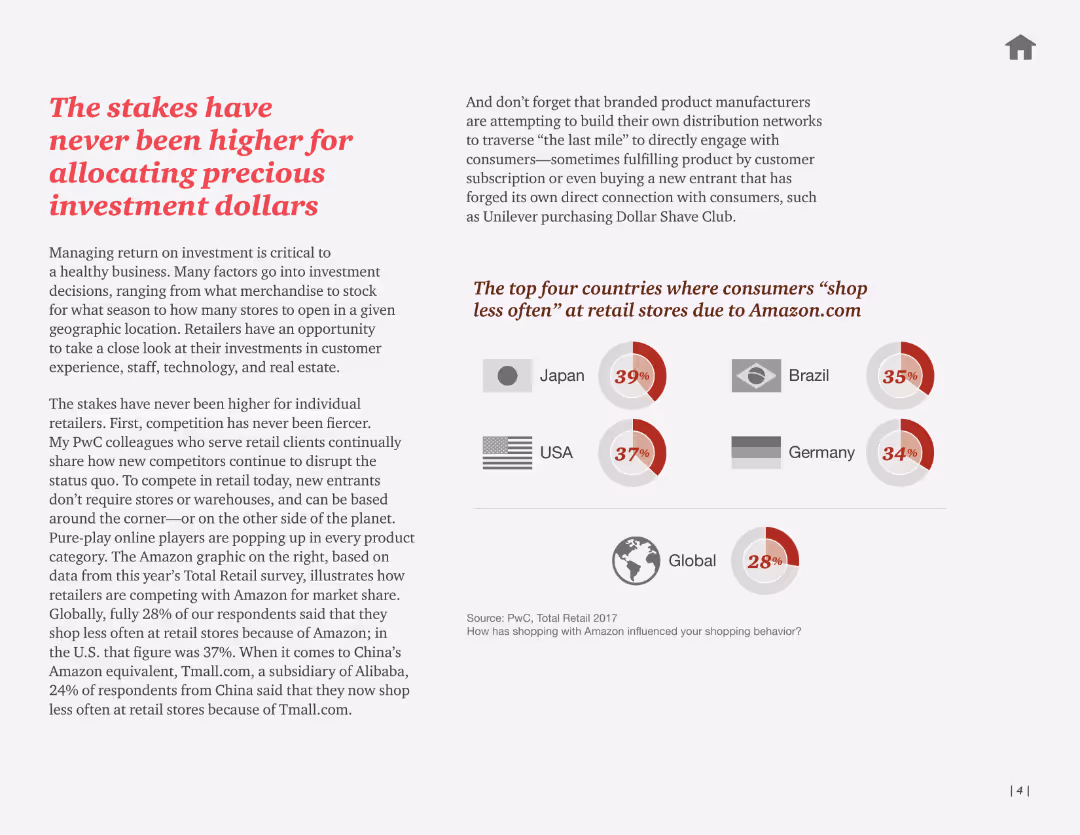
Text-heavy slide with bullet points detailing investment considerations in retail. Includes a pie chart showing countries where consumers shop less due to Amazon.
Strategic Planning
Retail & E-commerce
This slide discusses the high stakes in retail investment, highlighting the impact of Amazon on shopping behavior across different countries. Useful for strategic planning in retail.
investment, retail, strategy, Amazon, shopping
false
Strategic Planning
Retail & E-commerce
Multiple Chart
PwC/Strategy&
Add to my slides
Remove from favorites
Consists of column charts showing investment return metrics for corporate equity and real estate credit, with clear distinction between post-crisis and since inception data.
Investment Analysis
Financial Services
Presents a detailed analysis of investment returns for alternative strategies, emphasizing performance metrics like IRR.
Investment Returns, Alternatives, Corporate Equity, Real Estate Credit, IRR, Post-Crisis
false
Investment Analysis
Financial Services
Multiple Chart
Goldman Sachs
Add to my slides
Remove from favorites
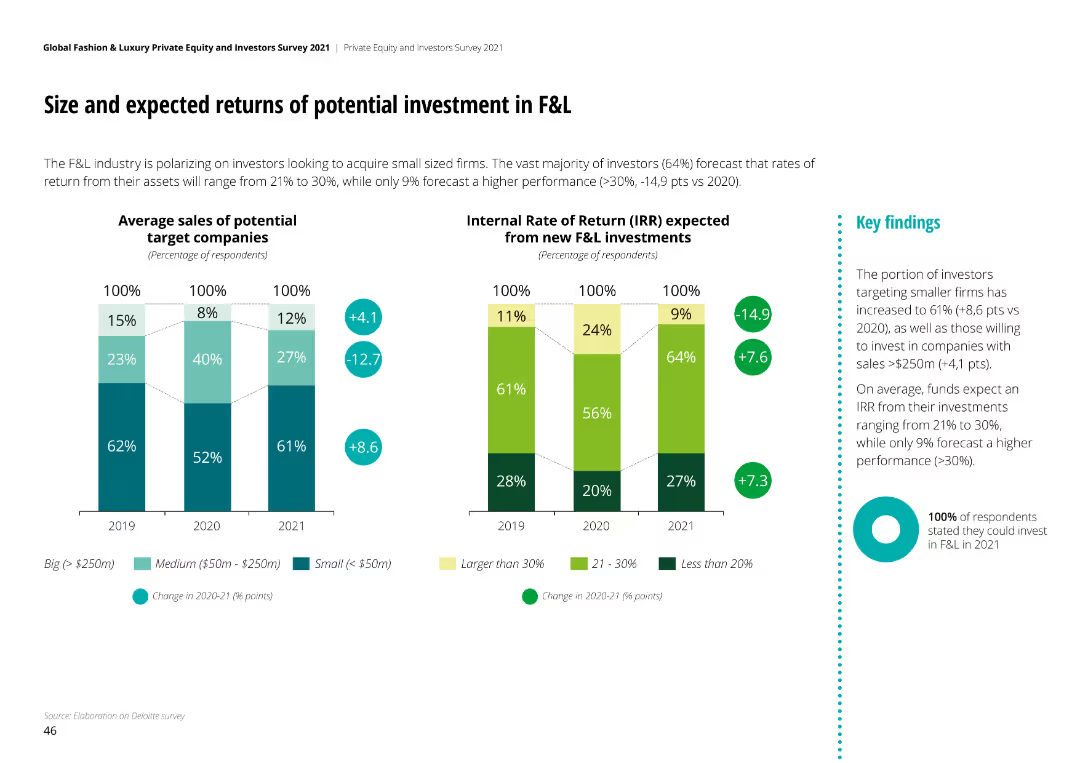
The slide contains two column charts comparing average sales of potential target companies and expected IRR from new investments. Key findings are listed.
Investment Analysis
Financial Services
The slide analyzes the potential investment size and expected returns in the fashion and luxury industry, highlighting key findings and trends.
investment, returns, fashion, luxury, analysis
false
Investment Analysis
Financial Services
Multiple Chart
Deloitte
Add to my slides
Remove from favorites
Column charts showing trends in investment returns by asset type at Lloyd's from 2008 to 2018.
Investment Analysis
Financial Services
Provides an analysis of Lloyd's investment returns over the years, noting significant reductions and discussing the factors contributing to these trends, such as market volatility.
Investment, Returns, Trends, Analysis, Lloyd's
false
Investment Analysis
Financial Services
Multiple Chart
PwC/Strategy&
Add to my slides
Remove from favorites
The slide features a column chart depicting a reduction in investment bank RWA and LE. It also includes labeled segments showing various market and business adjustments.
Risk Assessment and Management
Financial Services
The slide illustrates the strategy for reducing risk-weighted assets and leverage exposure by about 40% through various strategic initiatives within the investment bank.
investment, risk, RWA, LE, reduction
false
Risk Assessment and Management
Financial Services
Single Chart
Credit Suisse
Add to my slides
Remove from favorites
The slide shows a woman using a laptop on the left and detailed bullet points on the right. It uses a simple two-column layout with clear headers and a balanced design.
Investment Analysis
Financial Services
Focuses on investment strategies, including high ROE growth and share repurchase programs, and is appropriate for investor presentations.
Investment, ROE, Share Repurchase, Dividend, Capital Allocation
false
Investment Analysis
Financial Services
Header Vertical
Morgan Stanley
Add to my slides
Remove from favorites
The slide includes a pie chart showing reasons for selling investments and a horizontal bar chart detailing primary reasons for sales. Clean white background.
Market Analysis and Trends
Financial Services
This slide explains the primary reasons Canadian investors sold their investments during the pandemic, including the need for cash, minimizing losses, and realizing profits from market price increases.
investment sales, rationale, pandemic, Canadian investors, market price
false
Market Analysis and Trends
Financial Services
Multiple Chart
IPSOS
Add to my slides
Remove from favorites
The slide features a column chart showing percentages of investments bought during the pandemic, with text describing the data. Clean white background.
Market Analysis and Trends
Financial Services
This slide presents data on the percentage of investments bought by Canadian investors during the pandemic, showing that a significant number of investors were buying rather than selling.
investments bought, pandemic, Canadian investors, data analysis, COVID-19
false
Market Analysis and Trends
Financial Services
Mixed Chart
IPSOS
Add to my slides
Remove from favorites
Title at the top, three-column format with text and checkmarks. The first column lists monetary targets, the second lists client propositions with checkmarks, and the third outlines progress with investment platforms.
Investment Analysis
Financial Services
Highlights the 5-year opportunity and strong client value propositions in third-party alternative investments, including capital reduction, franchise development, and capital efficiency optimization.
Investments, Capital, Alternatives, Efficiency, Multi-Asset Class
false
Investment Analysis
Financial Services
Table
Goldman Sachs
Add to my slides
Remove from favorites
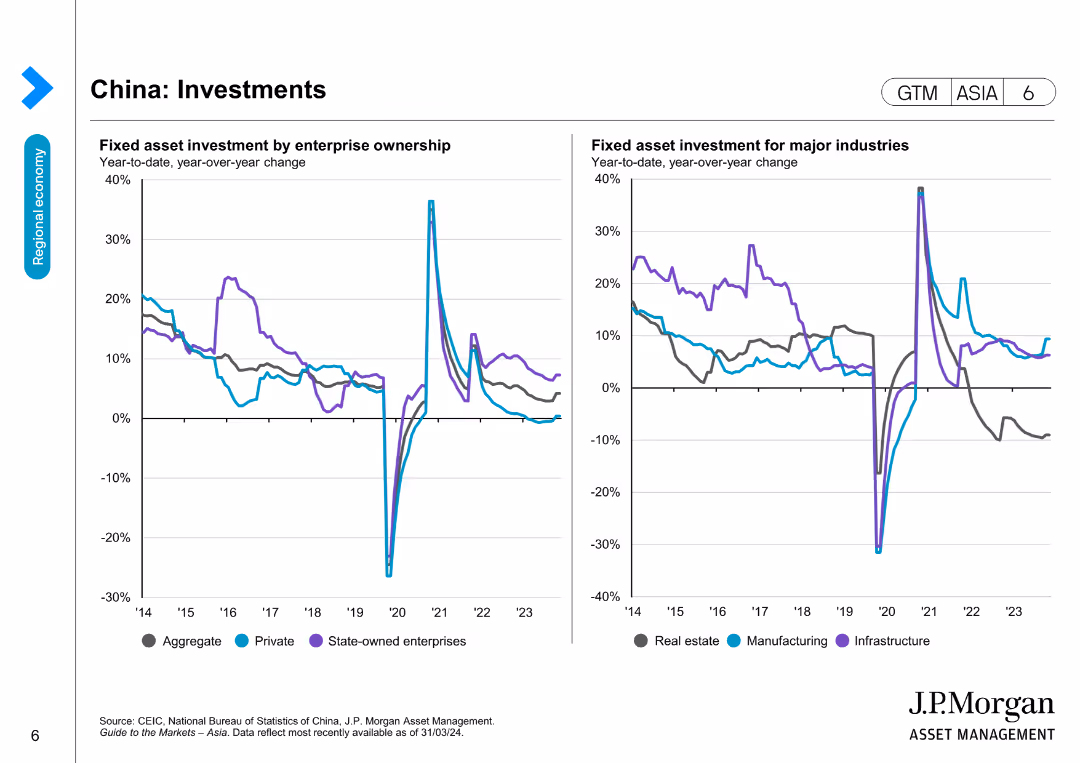
This slide features two line charts displaying fixed asset investment by enterprise ownership and for major industries, with a comparison over several years.
Investment Analysis
Financial Services
Highlights fixed asset investments in China by different ownerships and industries, indicating investment trends and potential opportunities.
Investments, China, Fixed asset, Industries, Ownership, Financial trends, Market analysis, Economic data
false
Investment Analysis
Financial Services
Multiple Chart
JP Morgan
Add to my slides
Remove from favorites
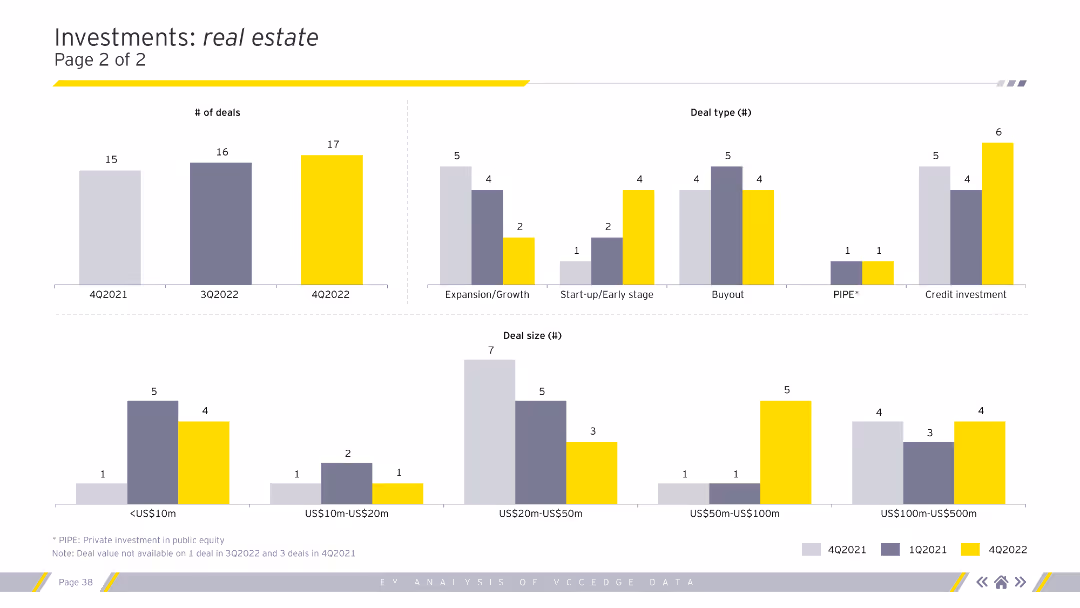
Contains several column charts displaying the number of deals, deal types, and deal sizes across different quarters. Uses grey, purple, and yellow for differentiation. Visual complexity is moderate.
Investment Analysis
Real Estate & Construction
Analyzes investment trends in real estate, including the number of deals, deal types (expansion/growth, buyout), and deal sizes over time. Useful for investors and analysts.
investments, deals, real estate, trends, analysis
false
Investment Analysis
Real Estate & Construction
Multiple Chart
EY
Add to my slides
Remove from favorites
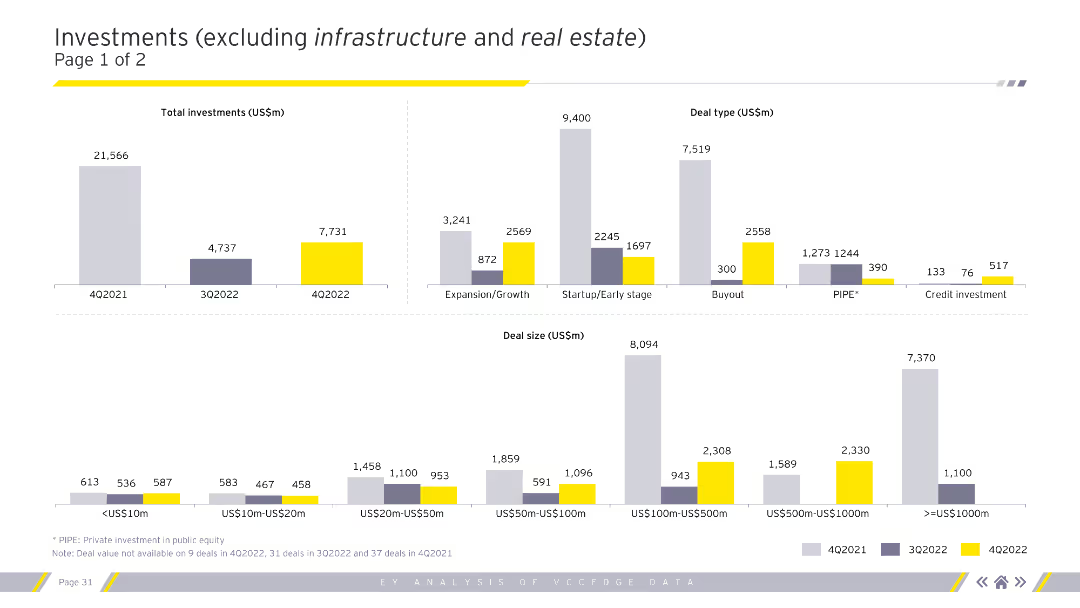
The slide features multiple column charts displaying total investments, deal types, and deal sizes for various quarters. The charts are color-coded to represent different time periods.
Market Analysis and Trends
Financial Services
This slide focuses on investments excluding infrastructure and real estate, showing detailed breakdowns by deal type and size, aiding in understanding specific investment trends.
Investments, deal types, deal sizes, quarterly data
false
Market Analysis and Trends
Financial Services
Multiple Chart
EY
Add to my slides
Remove from favorites
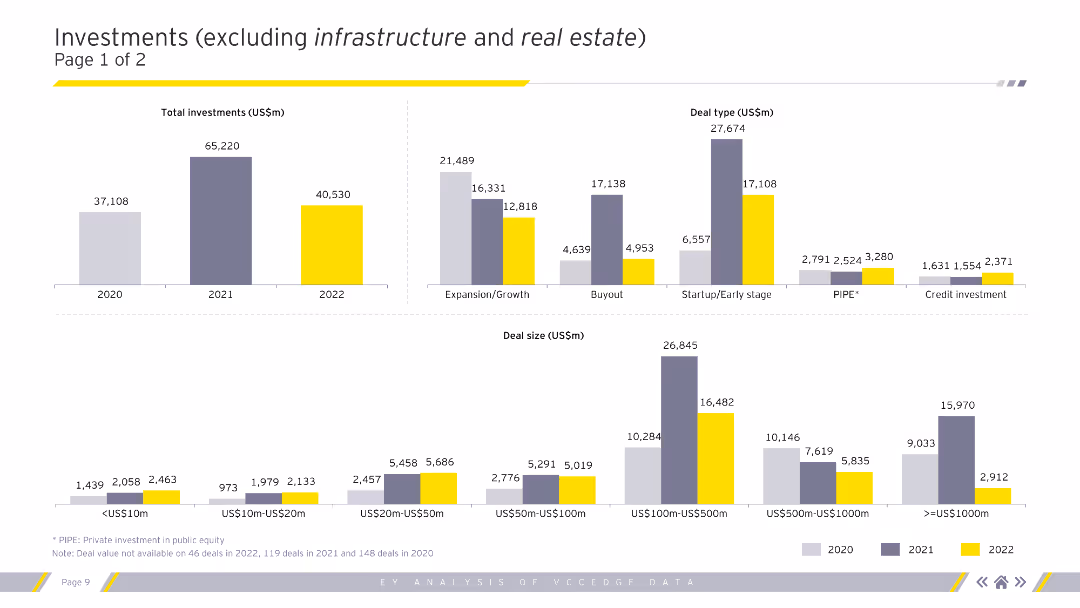
Column charts depicting total investments, deal types, and deal sizes in various segments excluding infrastructure and real estate for 2020-2022.
Market Analysis and Trends
Financial Services
Detailed analysis of investment types, sizes, and segments, excluding infrastructure and real estate.
investments, deal types, deal sizes, trends, analysis
false
Market Analysis and Trends
Financial Services
Multiple Chart
EY
Add to my slides
Remove from favorites
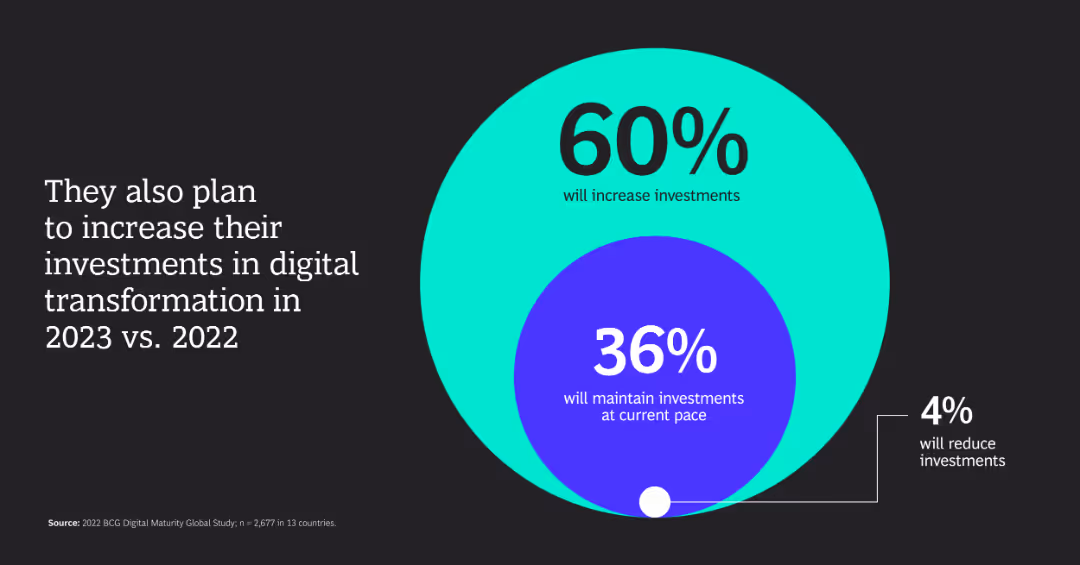
The slide features a large circle chart with segmented percentages indicating plans to increase, maintain, or reduce investments.
Investment Analysis
Financial Services
The slide shows that 60% of companies plan to increase their investments in digital transformation in 2023 compared to 2022.
investments, digital transformation, percentage, 2023, 2022
false
Investment Analysis
Financial Services
Diagram
BCG
Add to my slides
Remove from favorites
Three overlapping dark triangles each with graphs and data points. Icons of tree landscapes are used as background images for visual emphasis.
Market Analysis and Trends
Energy & Utilities
Displays projections of investments required in SEA, contrasting current green investments against the needed $3 trillion by 2030 for climate goals.
Investment, SEA, green economy, fossil fuels, renewables
false
Market Analysis and Trends
Energy & Utilities
Header Horizontal
Bain
Add to my slides
Remove from favorites
This slide compares investment trends across early-stage, growth-stage, and late-stage companies, using overlapping area charts for each stage to represent the private funding value from H1 2019 to H1 2022. Text annotations summarize the trend insights for each stage, such as growing early-stage investments and late-stage downturns.
Investment Analysis
Financial Services
An analysis of investment patterns, contrasting early, growth, and late-stage investments over time, with an emphasis on the flourishing early-stage sector and the challenges faced by late-stage investments due to diminished IPO prospects.
investments, early-stage, growth-stage, late-stage, IPO, trends, private funding
false
Investment Analysis
Financial Services
Multiple Chart
Bain
Add to my slides
Remove from favorites
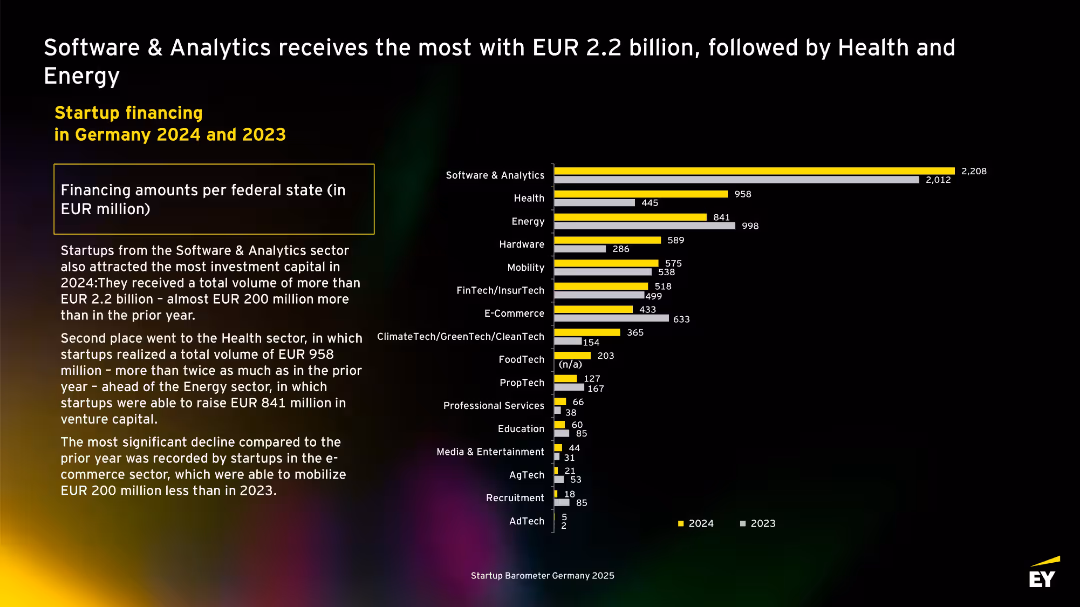
Horizontal bar chart with EUR million values for each sector in 2023 and 2024. Software & Analytics tops the chart with €2.2B. Side text explains sectoral trends and highlights the sharp decline in e-commerce funding.
Investment Analysis
Technology & Software
Tracks investment volumes by startup sector. Software & Analytics leads with €2.2B raised in 2024. Health and Energy follow. The slide notes year-over-year sectoral growth and decline, especially a notable drop in E-Commerce sector investments.
investment, sector funding, analytics, health, energy, e-commerce, Germany, startups
false
Investment Analysis
Technology & Software
Mixed Chart
EY
Add to my slides
Remove from favorites
Slide contains data boxes, a pie chart and a table with key metrics highlighted.
Industry Overview
Financial Services
Overview of investment provider sectors by type and assets under management globally.
investment, sectors, assets, global, financial services
false
Industry Overview
Financial Services
Multiple Chart
Deloitte
Add to my slides
Remove from favorites
The slide contains a line chart displaying the leading sectors for investment in Europe from 2012 to 2021, with multiple colored lines representing sectors.
Market Analysis and Trends
Financial Services
It shows the trends in investment across various sectors in Europe over the years, indicating the rise and fall in investment preferences.
investment, sectors, Europe, trends, 2012-21
false
Market Analysis and Trends
Financial Services
Multiple Chart
EY
Add to my slides
Remove from favorites
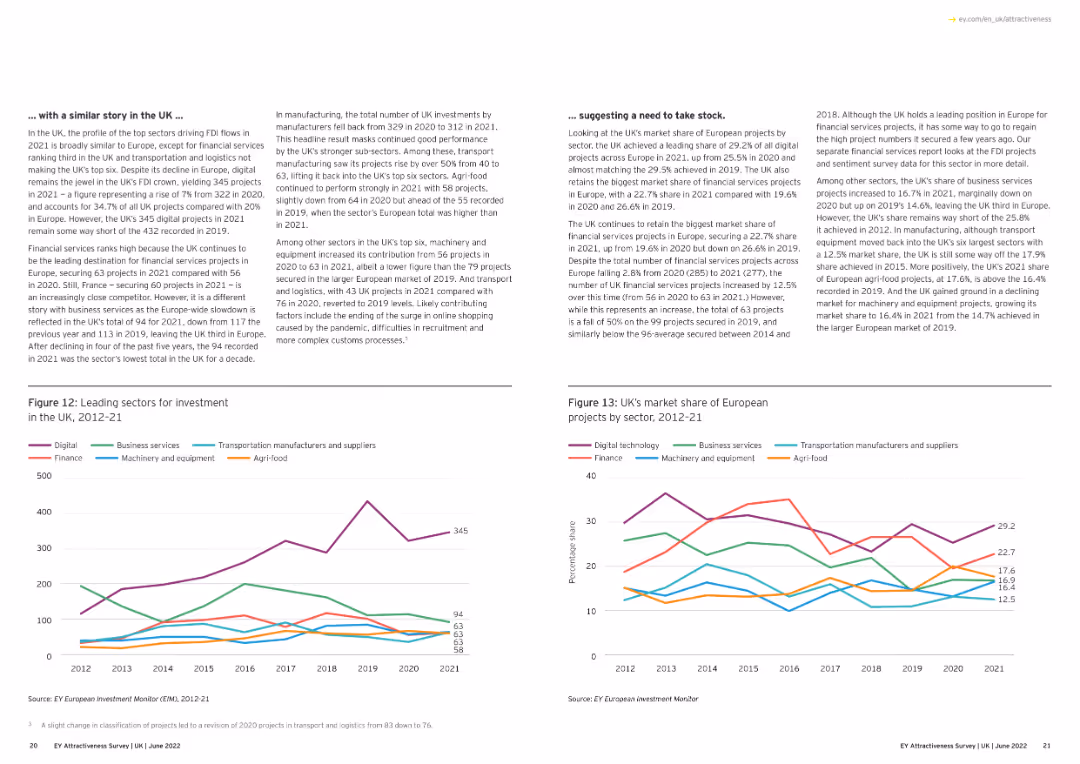
The slide features a line chart showing the leading sectors for investment in the UK from 2012 to 2021, with lines representing different sectors.
Market Analysis and Trends
Financial Services
This slide highlights the top sectors attracting investment in the UK over the years, providing insight into economic focus areas.
investment, sectors, UK, trends, 2012-21
false
Market Analysis and Trends
Financial Services
Mixed Chart
EY
Add to my slides
Remove from favorites
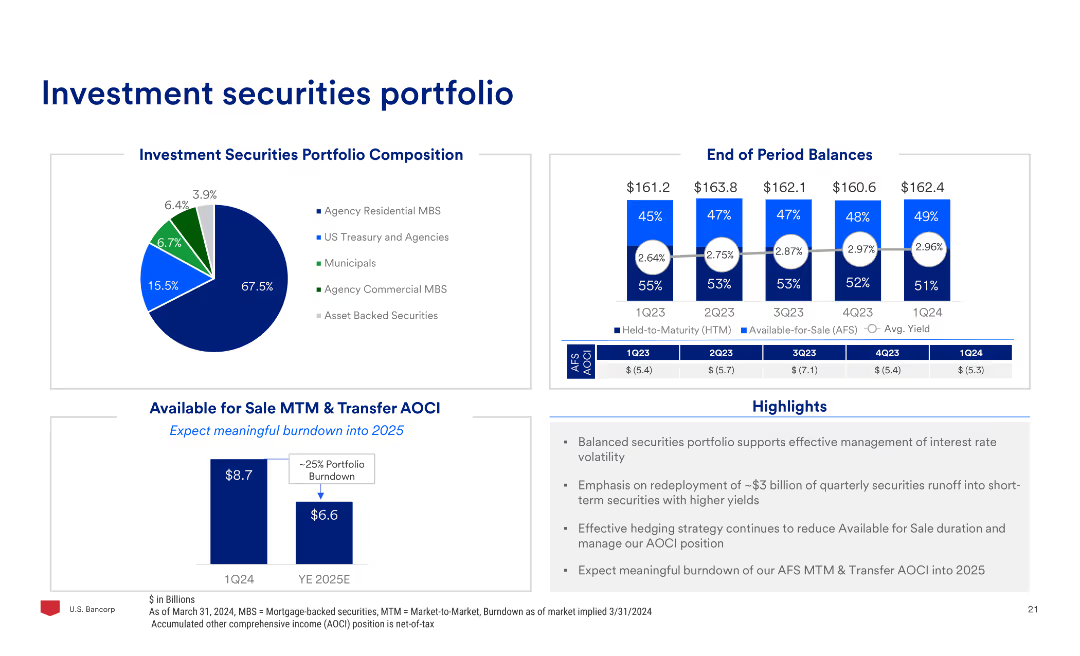
The slide contains a pie chart of the investment securities portfolio composition, column charts of end of period balances, and highlights on the portfolio management and market volatility.
Investment Analysis
Financial Services
The slide reviews the investment securities portfolio, focusing on composition, end-of-period balances, and strategies for managing interest rate volatility and portfolio runoff.
Investment, Securities, Portfolio, Composition, Management, Volatility
false
Investment Analysis
Financial Services
Multiple Chart
Barclays
Add to my slides
Remove from favorites
This slide has two main sections: each with left-hand column with icons and text, a central section with bullet points and icons filled with key metrics for ETFs, Alternatives, and Data Solutions.
Operational Efficiency
Financial Services
It illustrates the scale and efficiency of investment services, outlining the core business functions, key metrics, and enhancements in capabilities that promote growth and benefit clients.
Investments, Efficiency, Growth, Metrics
false
Operational Efficiency
Financial Services
Table
JP Morgan
Add to my slides
Remove from favorites
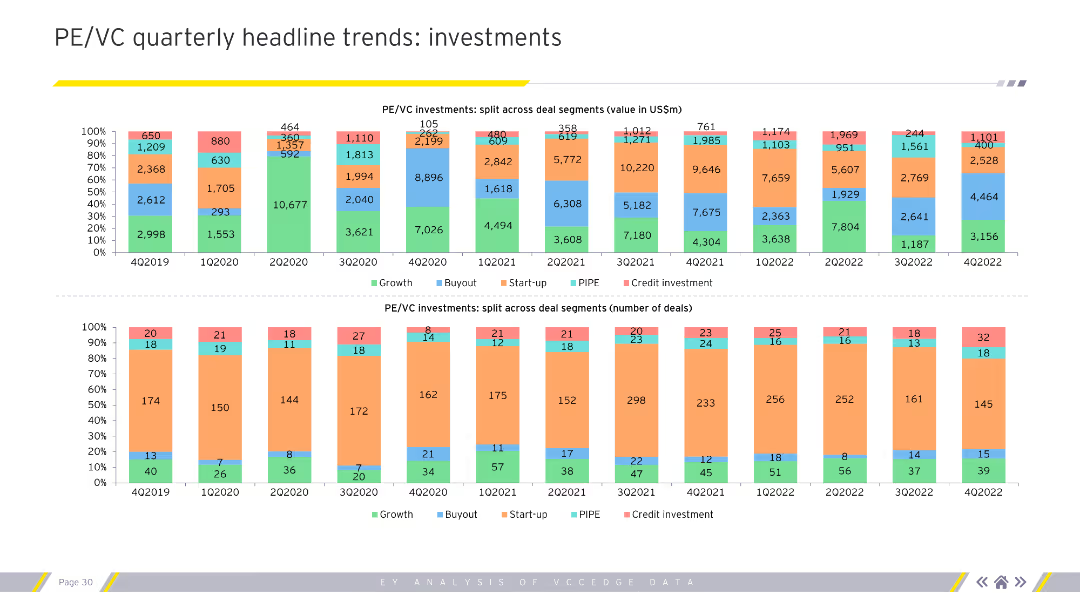
The slide contains two stacked bar charts. The top chart shows PE/VC investments split across deal segments by value, while the bottom chart shows the split by number of deals.
Market Analysis and Trends
Financial Services
This slide provides a detailed view of PE/VC investments, comparing the value and number of deals across different segments, which helps in understanding investment distribution.
Investment segments, deal value, deal count, PE/VC
false
Market Analysis and Trends
Financial Services
Multiple Chart
EY
Add to my slides
Remove from favorites
Side-by-side comparison of full-service and self-directed investment services, with icons and key metrics.
Financial Performance
Financial Services
Highlights the foundation and growth of investment services, presenting opportunities in the context of client assets and digital engagement.
Investment Services, Client Assets, Digital Engagement, Financial Growth, Wealth Management, Market Opportunity
false
Financial Performance
Financial Services
Boxed
JP Morgan
Add to my slides
Remove from favorites
The slide features a bar chart representing investment values across sectors with a key data point highlighted in green. It maintains visual simplicity while conveying quantitative information.
Investment Analysis
Financial Services
An analysis of Q1 2020 investments into emerging internet and tech firms, beneficial for financial and investment strategy discussions, especially within the tech industry.
investments, financial strategy, tech industry, Q1 2020, emerging firms
false
Investment Analysis
Financial Services
Single Chart
Bain
Add to my slides
Remove from favorites
This slide includes two sets of column charts comparing the impact of energy prices and macroeconomic factors on investments in France versus other European countries, with executive commentary on energy costs and economic policies.
Investment Analysis
Financial Services
Discusses the economic influences affecting business investments in France, highlighting the adverse impacts of energy prices and macroeconomic factors like inflation and interest rates from 2022 to 2023.
investments, France, energy costs, inflation, interest rates, economic impact, business environment, European comparison, macroeconomic factors, corporate investment
false
Investment Analysis
Financial Services
Multiple Chart
Bain
Add to my slides
Remove from favorites
It features a comparative column chart of year-over-year investments in various business areas for CCB.
Strategic Planning
Financial Services
Details the strategic investment plans for 2022-2023 to grow the Consumer and Community Banking franchise with expected ROI.
investments, franchise growth, CCB, ROI, strategic planning, JPMorgan Chase & Co, financial services
false
Strategic Planning
Financial Services
Mixed Chart
JP Morgan
Add to my slides
Remove from favorites
Five icons with descriptions for leading countries' investments in frontier technologies. Countries include the US, EU, France, Germany, and China, with respective investment plans in technologies.
Technology and Digital Transformation
Technology & Software
The slide highlights significant investments in frontier technologies by leading countries, including the US, EU, France, Germany, and China. It showcases various initiatives, such as the US investment in EV infrastructure and China's commitment to AI and 5G development, emphasizing the centrality of technology to their economic strategies.
Investments, Frontier Technologies, Leading Countries
false
Technology and Digital Transformation
Technology & Software
Pillar
Roland Berger
Add to my slides
Remove from favorites
Four sets of column charts with various shades of blue and brown illustrate total investment expenses, technology investments, and marketing expenditures from 2021 to 2022.
Investment Analysis
Financial Services
Showcasing investment growth across different business areas, this slide aims to inform stakeholders about the firm's investment strategies and future focus areas.
investments, growth, technology, marketing, column charts, strategy, JPMorgan
false
Investment Analysis
Financial Services
Multiple Chart
JP Morgan
Add to my slides
Remove from favorites
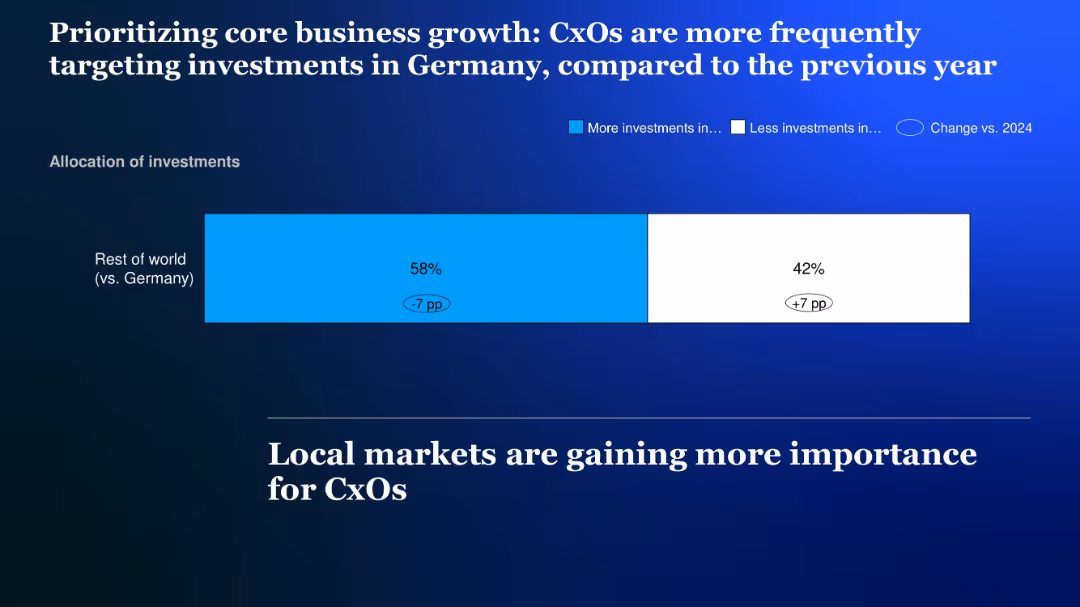
Horizontal stacked bar chart showing investment shifts between Germany and the rest of the world; color-coded bars on a blue gradient background
Strategic Planning
Financial Services
The slide shows that CxOs are increasingly prioritizing investments in Germany over international markets, reflecting a +7 percentage point increase in domestic investment focus.
Investment shift, Germany, local market, core business, allocation, CxOs, prioritization
false
Strategic Planning
Financial Services
Single Chart
McKinsey
Add to my slides
Remove from favorites
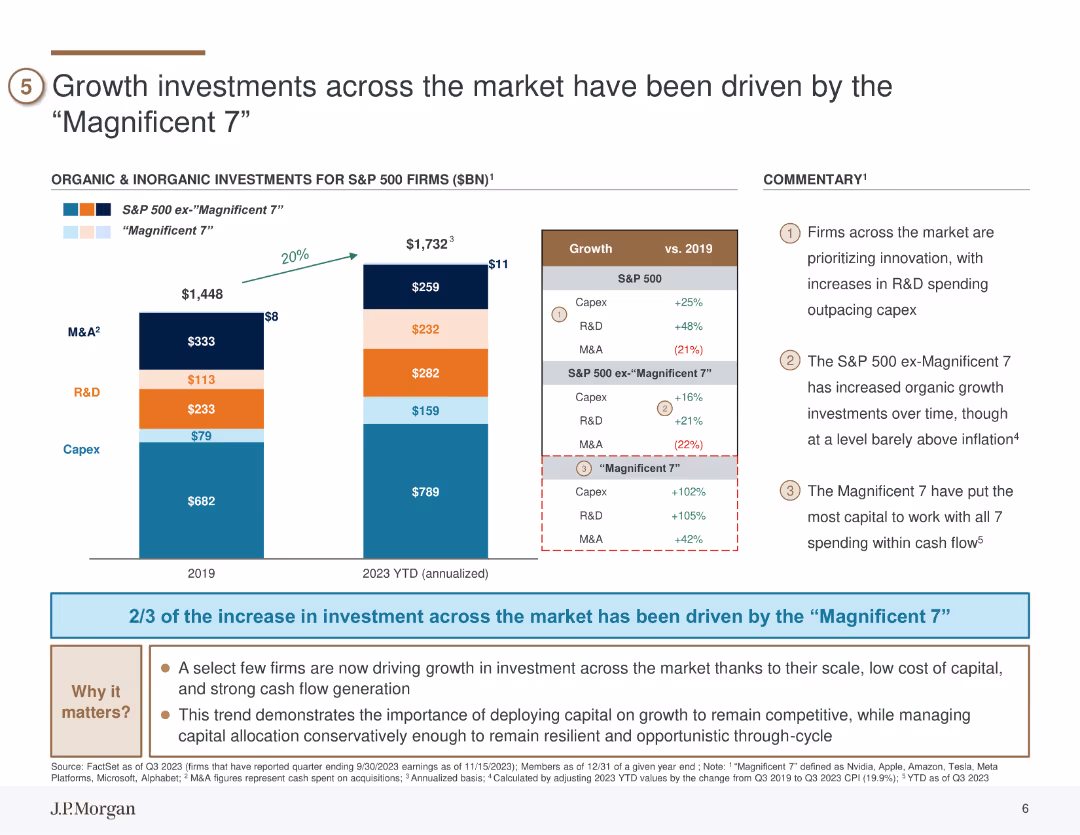
The slide features column charts comparing organic and inorganic investments in S&P 500 firms, highlighting differences between the "Magnificent 7" and the rest of the market.
Investment Analysis
Financial Services
The slide details the significant growth investments made by the top seven firms in the S&P 500, noting their dominant role in driving overall market growth. It highlights increased spending in R&D, capex, and M&A activities, underscoring the strategic importance of these investments. The slide can be used to analyze investment trends and capital allocation strategies.
investments, Magnificent 7, R&D, capex, M&A
false
Investment Analysis
Financial Services
Mixed Chart
JP Morgan
Add to my slides
Remove from favorites
This slide features images of credit cards, bullet points, and a column chart. The design includes icons and is partitioned into sections for clarity.
Strategic Planning
Financial Services
It discusses strategic investments in card products, market share, and product launches. Suitable for strategy meetings or product development discussions.
investments, market share, card products, strategy, launches
false
Strategic Planning
Financial Services
Graphic
JP Morgan
Add to my slides
Remove from favorites
The slide displays a balance of text and graphical elements, highlighting targeted investments and outcomes in sectors and regions.
Strategic Planning
Financial Services
Focuses on strategic investment planning and the outcomes in various sectors and regions, reflecting market share gains.
Investments, Market Share, Sectors, Regions, Strategic Planning, Outcomes, Text, Graphics
false
Strategic Planning
Financial Services
Linear Flow
JP Morgan
Add to my slides
Remove from favorites
Pie chart showing the proportion of respondents who have sold or are considering selling investments to cover monthly expenses. Text provides additional context and insights.
Risk Assessment and Management
Financial Services
The slide presents data on the percentage of Canadian investors who sold or considered selling investments to cover monthly expenses due to financial strain during COVID-19. It highlights demographic differences and the factors influencing these decisions.
Investments, Monthly Expenses, COVID-19, Canadian, Selling
false
Risk Assessment and Management
Financial Services
Mixed Chart
IPSOS
Add to my slides
Remove from favorites
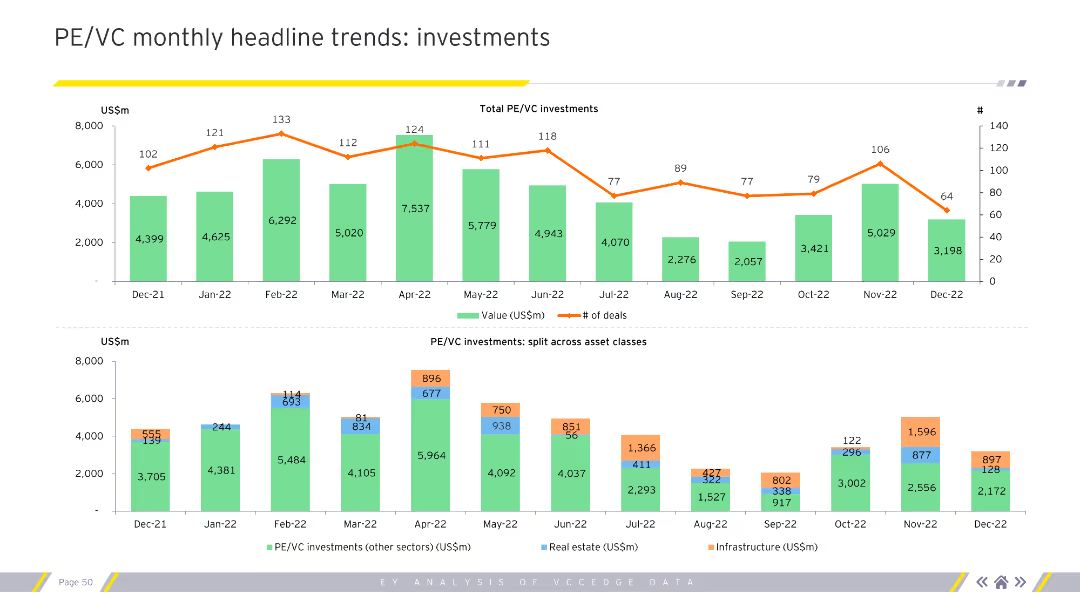
Shows column charts for total PE/VC investments and investments split across asset classes monthly. Includes an investment trend line. Visual complexity is moderate.
Market Analysis and Trends
Financial Services
Tracks monthly investment trends in private equity and venture capital, detailing total investments and splits across asset classes. Important for financial analysts and investors.
investments, monthly, PE, VC, trends, analysis
false
Market Analysis and Trends
Financial Services
Multiple Chart
EY
Add to my slides
Remove from favorites
This slide includes a comprehensive column chart detailing the sources and amounts of investment in the Nigerian PV sector from 2015 to 2020, colored by type of funding (grant, mixed, equity, debt). Clear labels and segmentation facilitate understanding of investment flows.
Investment Analysis
Energy & Utilities
Analyzes the investment trends in the Nigerian solar market, pointing out the contributions from various sources like the CBN and World Bank, which are crucial for understanding market growth and investment strategies.
investment, solar market, Nigeria, PV sector, funding sources
false
Investment Analysis
Energy & Utilities
Multiple Chart
BCG
Add to my slides
Remove from favorites
A slide with a diamond-shaped diagram, showing the integration of different business divisions with labeled segments.
Strategic Planning
Financial Services
It is designed to explain the strategic integration of various business units within a firm to optimize investment sourcing.
Investment Sourcing, Strategic Integration, Business Divisions, Goldman Sachs, Capital, Intellectual Capital
false
Strategic Planning
Financial Services
Table
Goldman Sachs
Add to my slides
Remove from favorites
A column chart showing reasons for buying investments during the pandemic. There is a large 40% graphic to the left indicating the percentage of buyers, and a list of reasons with bars on the right.
Market Analysis and Trends
Financial Services
The slide explains why Canadian investors bought investments during the pandemic, highlighting regular contributions, undervalued assets, high returns, guarantees, lower risks, and other reasons.
investments, pandemic, buying, Canadian, reasons
false
Market Analysis and Trends
Financial Services
Multiple Chart
IPSOS
Add to my slides
Remove from favorites
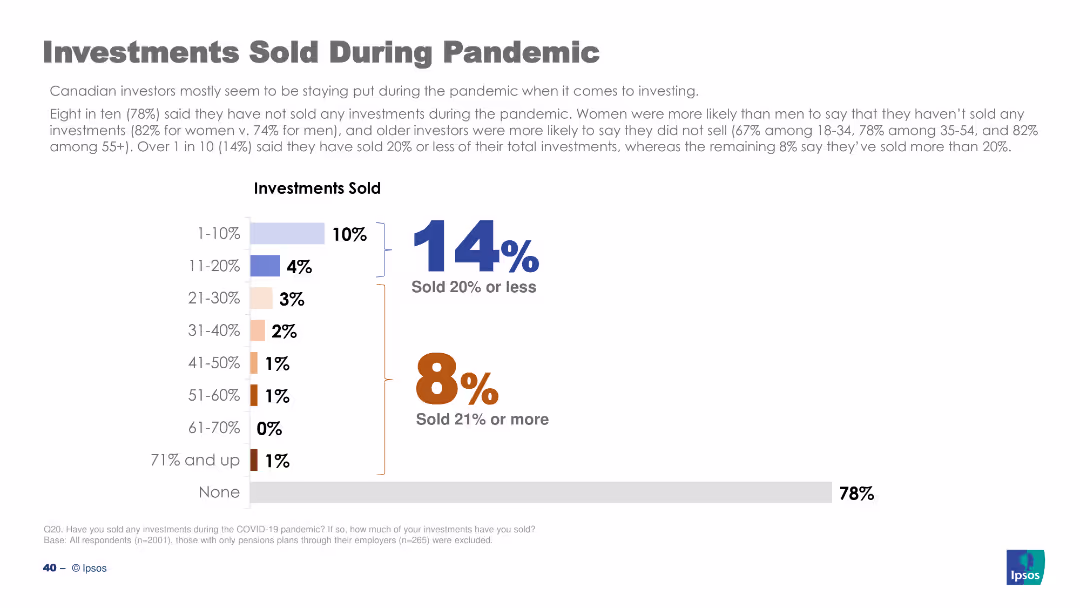
The slide features a column chart showing percentages of investments sold during the pandemic, with text describing the data. Clean white background.
Market Analysis and Trends
Financial Services
This slide presents data on the percentage of investments sold by Canadian investors during the pandemic, highlighting that most investors did not sell their investments.
investments sold, pandemic, Canadian investors, data analysis, COVID-19
false
Market Analysis and Trends
Financial Services
Mixed Chart
IPSOS
Add to my slides
Remove from favorites
The slide includes column charts illustrating investment in business divisions over time with projected future growth.
Strategic Planning
Financial Services
Discusses the strategic investment across various business divisions aiming to drive future financial returns and operational efficiency.
investments, strategy, growth, divisions, returns
false
Strategic Planning
Financial Services
Mixed Chart
Barclays
Add to my slides
Remove from favorites
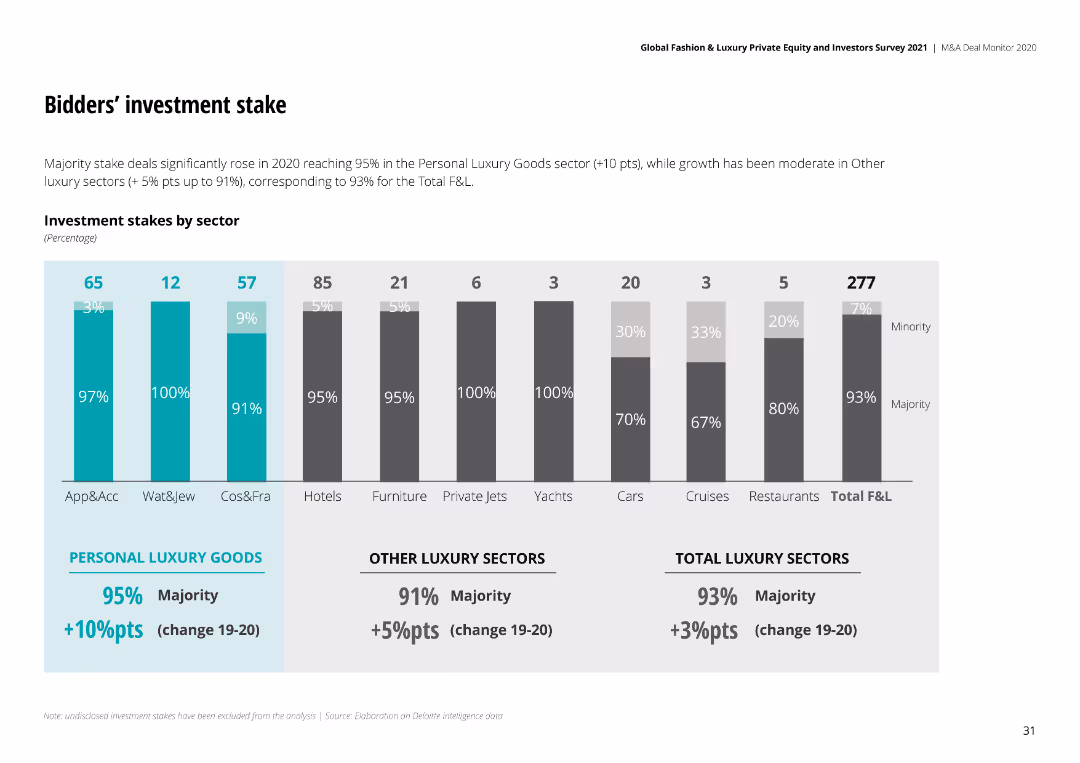
The slide shows a bar chart of investment stakes by sector, comparing personal luxury goods with other luxury sectors.
Investment Analysis
Consumer Goods
It details the investment stakes in various sectors, highlighting the majority stake increases in personal luxury goods and other sectors.
Investment Stake, Sector, Personal Luxury, M&A, 2020
false
Investment Analysis
Consumer Goods
Single Chart
Deloitte
Add to my slides
Remove from favorites
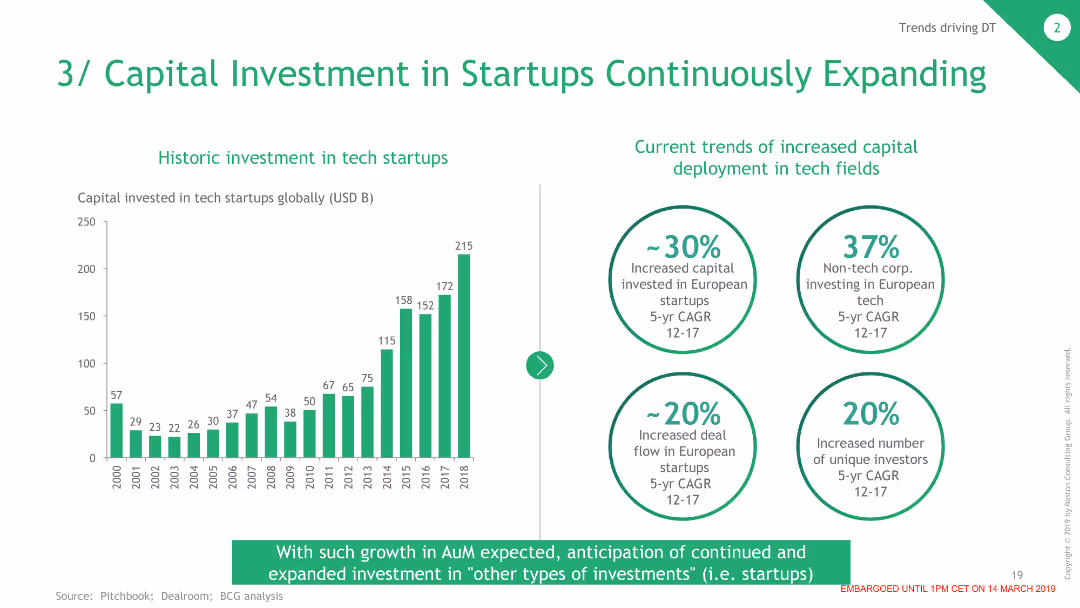
The slide contains a column chart on the left showing historic investments in tech startups and four circular data points on the right summarizing current trends in capital investment.
Investment Analysis
Financial Services
This slide shows the growth in capital investment in tech startups over time and highlights significant trends in increased investment and deal flow in European startups.
Investment, Startups, Capital, Trends, Financial
false
Investment Analysis
Financial Services
Mixed Chart
BCG
Add to my slides
Remove from favorites
The slide presents a column chart comparing technology and product investments in dollars over years 2019 and 2022 Outlook. There's a side section listing impacts of technology investments with corresponding percentage values and brief descriptions. Colors differentiate categories and investments over time.
Market Analysis and Trends
Technology & Software
This slide is likely used for presenting financial investment growth in technology over time, highlighting areas of tech impact, and business strategy alignment. It visualizes investment data to demonstrate strategic focus and outcomes.
investments, technology, growth, impact, strategy, finance, data visualization, business, planning, analytics
false
Market Analysis and Trends
Technology & Software
Mixed Chart
JP Morgan
Add to my slides
Remove from favorites
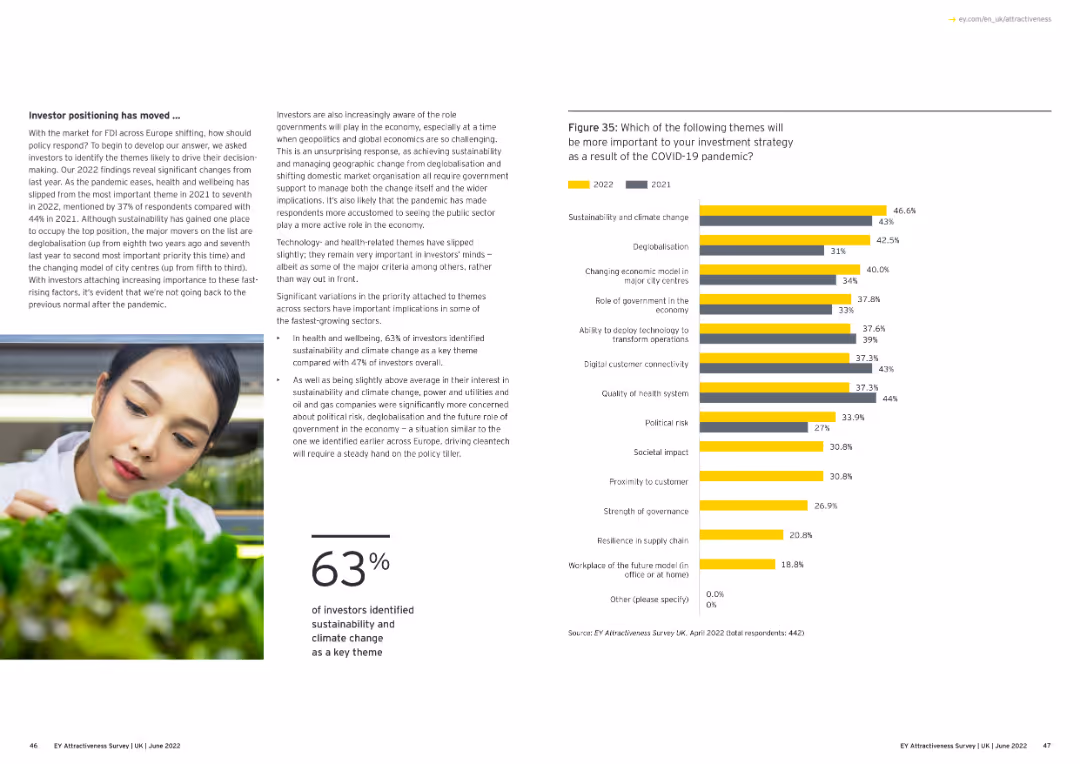
The slide has text, a bar chart, and an image. The column chart shows various investment strategy themes post-COVID.
Risk Assessment and Management
Financial Services
The slide highlights investment strategies important post-COVID, focusing on sustainability, digital transformation, and other key themes.
investment strategies, COVID-19, sustainability, digital transformation, column chart
false
Risk Assessment and Management
Financial Services
Mixed Chart
EY
Add to my slides
Remove from favorites
Slide displays two 2D scatter plots comparing 'Leaders' and 'Laggards' in strategic investments across various business areas. Color-coded dots represent different strategies such as M&A, digital capabilities, and ESG practices.
Competitive Landscape
Retail & E-commerce
This slide illustrates the strategic investment differences between industry leaders and laggards in areas like digital expansion and sustainability, emphasizing the gap in competitive strategy.
investment, strategy, digital, sustainability, leaders, laggards, competitive, business, ESG, M&A
false
Competitive Landscape
Retail & E-commerce
Multiple Chart
Deloitte
Add to my slides
Remove from favorites
Text-heavy slide with purple highlights and four numbered sections providing details of the company’s investment thesis, including visual emphasis on key points.
Strategic Planning
Financial Services
Describes the company's strategic advantages and goals, used to build trust with investors and stakeholders by outlining a roadmap for future growth and stability.
investment, strategy, growth, performance, trust
false
Strategic Planning
Financial Services
Linear Flow
Goldman Sachs
Add to my slides
Remove from favorites
Comprised of three sectioned column charts detailing investment expenses in different areas. The design is structured with color coding for ease of comparison and interpretation.
Investment Analysis
Financial Services
JPMorgan Chase's slide presents a multi-year investment strategy across business sectors, technology, and marketing. It demonstrates the firm's commitment to growth and adaptation in response to evolving market needs.
Investment Strategy, Long-term Success, Business Growth, Technology, JPMorgan Chase
false
Investment Analysis
Financial Services
Multiple Chart
JP Morgan
Add to my slides
Remove from favorites
This slide displays a large, central pie chart with vibrant colors, surrounded by smaller high-quality images of buildings. The chart highlights the proportion of companies planning to invest in real estate despite market volatility, which is visually emphasized by the use of contrasting colors.
Investment Analysis
Real Estate & Construction
It captures the strategic decisions companies are making regarding real estate investments in light of inflation and interest rate changes. The chart is used to represent the distribution of different strategic choices, indicating a significant tilt towards investment, and is useful for discussions on market responses.
Investment Strategy, Real Estate, Inflation, Interest Rates, Market Trends
false
Investment Analysis
Real Estate & Construction
Single Chart
EY
Add to my slides
Remove from favorites
A complex visual with text blocks and a large pie chart detailing the distribution of investments in resiliency across sectors like automation and digitization.
Strategic Planning
Industrial & Manufacturing
The slide provides an analysis of the overall investment strategy by companies to enhance resilience, highlighting how funds are allocated across various activities such as resourcing, industrial automation, and digitization.
investment, strategy, resilience, automation, business analysis
false
Strategic Planning
Industrial & Manufacturing
Mixed Chart
Accenture
Add to my slides
Remove from favorites
Horizontal multi-section layout with colored blocks representing process steps from idea generation to portfolio construction.
Strategic Planning
Financial Services
Outlines the step-by-step bottom-up investment process at JPMorgan. Focuses on narrowing the investment universe, analyzing company fundamentals, conducting valuations, and finalizing portfolio construction based on risk, conviction, and diversification.
investment strategy, valuation, bottom-up, stock selection, due diligence, portfolio construction, analysis
false
Strategic Planning
Financial Services
Linear Flow
JP Morgan
Add to my slides
Remove from favorites
The slide features a column chart displaying the private funding value from 2019 to H1 2022 alongside an orange line graph for the average 10-year US treasury rate. Annotations provide additional context about market trends, including recent changes affecting investments.
Investment Analysis
Financial Services
Highlights investment trends in the first half of 2022, comparing private funding values with the average 10-year US treasury rate, contextualized with annotations on SEA’s deal landscape, showing how rising interest rates affect investments.
investments, trends, H1 2022, private funding, treasury rates, SEA, market
false
Investment Analysis
Financial Services
Mixed Chart
Bain
Add to my slides
Remove from favorites
Contains a single horizontal bar graph in purple, outlining various investment areas within underwriting over time.
Strategic Planning
Financial Services
The slide shows current and planned investments in underwriting technology and processes for the next three years.
investments, underwriting, strategic planning, bar graph
false
Strategic Planning
Financial Services
Mixed Chart
Accenture
Add to my slides
Remove from favorites
A pie chart displaying percentages of respondents who agree, disagree, or don't know if there's sufficient independent investment information available. The chart is accompanied by a text box with additional demographic breakdown information.
Market Analysis and Trends
Financial Services
This slide presents survey results showing that 58% of respondents feel there is sufficient independent investment information, while 38% disagree and 4% don't know. It highlights the age disparity in the responses.
Investment, Survey, Information, Respondents, Independent
false
Market Analysis and Trends
Financial Services
Mixed Chart
IPSOS
Add to my slides
Remove from favorites
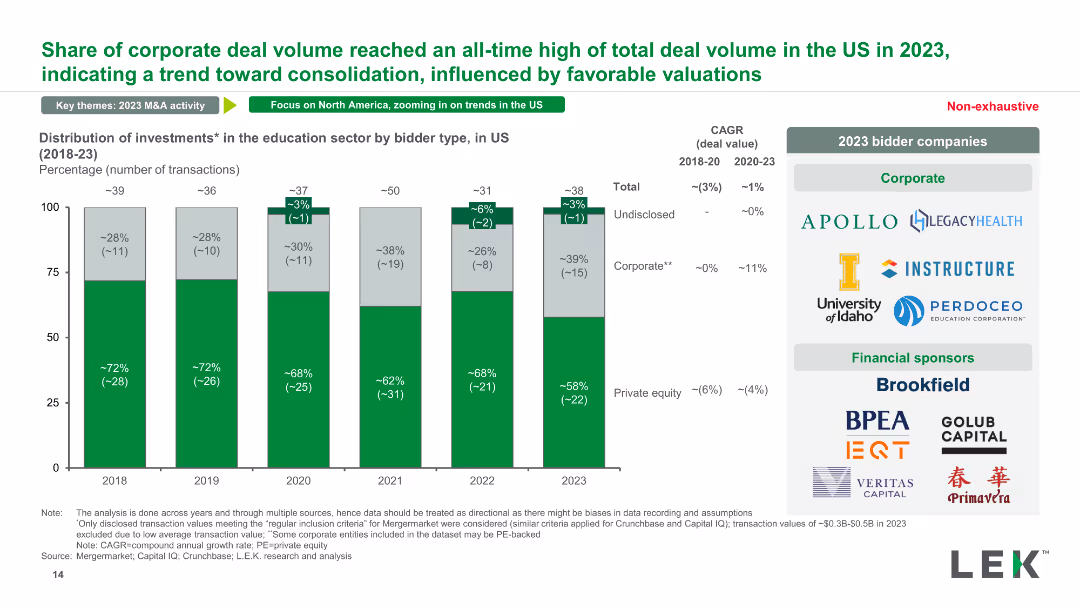
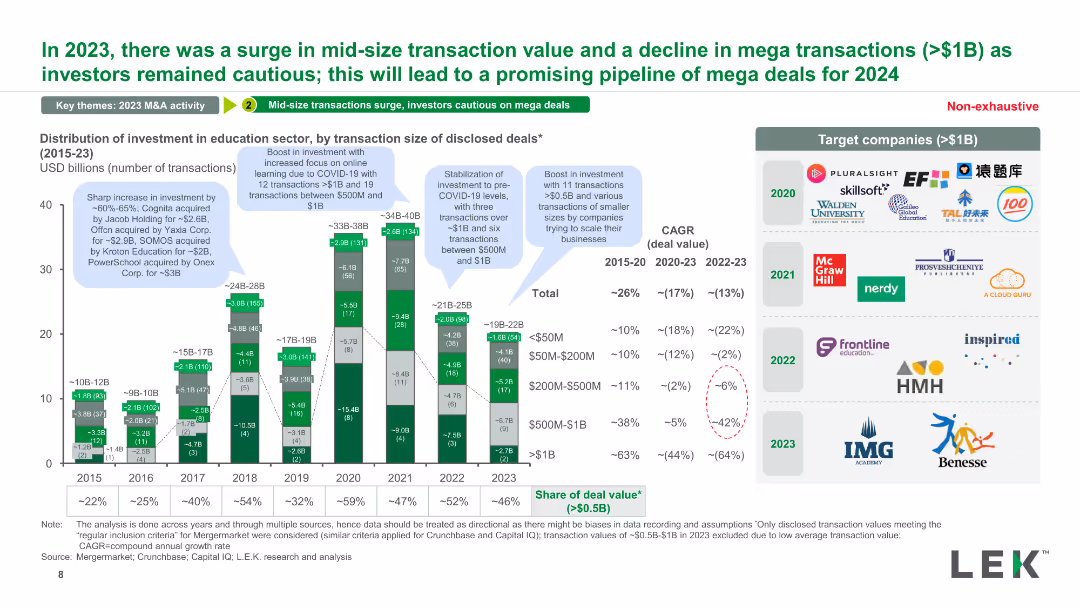
A stacked column chart illustrating the distribution of investments in the US education sector by bidder type (corporate, private equity, undisclosed) from 2018 to 2023.
Market Analysis and Trends
Education & Training
This slide categorizes investments in the US education sector by bidder type, showing trends in corporate versus private equity participation and their respective transaction volumes.
investments, US education, bidder type, corporate, private equity
false
Market Analysis and Trends
Education & Training
Mixed Chart
LEK
Add to my slides
Remove from favorites
Features multiple infographics including images and data points highlighting sectors like forest conservation, sustainable farming, and solar energy.
Investment Analysis
Energy & Utilities
Evaluates sectors within Indonesia that present significant investment opportunities, focusing on sustainability and growth potential in the environmental context.
investment, sustainability, Indonesia, forest conservation, solar energy
false
Investment Analysis
Energy & Utilities
Header Horizontal
Bain
Add to my slides
Remove from favorites
Combines text with circular icons representing various strategic strengths such as experienced management, market growth, and sustainability. The design is clean, utilizing a balanced mix of visuals and text to enhance comprehension and retention of the information presented.
Market Analysis and Trends
Industrial & Manufacturing
Summarizes the core strengths and market advantages of TI Fluid Systems, focusing on its leadership in automotive fluid systems with emphasis on sustainable practices and strong market positioning. Highlights key aspects such as above-market growth, alignment with electrification trends, and recognition for environmental contributions.
investment, sustainability, market growth, automotive, leadership
false
Market Analysis and Trends
Industrial & Manufacturing
Pillar
Deutsche Bank
Add to my slides
Remove from favorites
Slide contains three column charts showing growth in wealth management relationships, travel sales volume, and business banking clients from 2019 to 2022. The graphics are highlighted with arrows and percentage increase markers. The layout is clean and uses a blue color scheme to convey financial stability and trust.
Financial Performance
Financial Services
Analyzes investments across different business lines, showing growth in client relationships and sales volumes. It's likely used for illustrating the company's investment strategies' effectiveness and identifying areas of successful expansion and opportunities for further growth.
Investments, Wealth Management, Commerce, Business Banking, Client Relationships, Sales Volume
false
Financial Performance
Financial Services
Multiple Chart
JP Morgan
Add to my slides
Remove from favorites
Contains a diagram with icons and bullet points, detailing technological improvements in investment governance, apps, and infrastructure.
Operational Efficiency
Financial Services
The slide outlines initiatives for enhancing productivity and quality of services, including investment governance, standardizing software practices, and embracing new technologies.
Investment, Technology, Infrastructure, Governance
false
Operational Efficiency
Financial Services
Diagram
JP Morgan
Add to my slides
Remove from favorites
Contains a combination of column charts and statistical data that detail equity investment trends in Edinburgh's tech sector over a decade. Highlights major investment milestones.
Investment Analysis
Technology & Software
Discusses the equity investment landscape in Edinburgh's tech sector from 2010 to 2020, showcasing key investments and their impacts on the local tech ecosystem.
Investment, tech sector, Edinburgh
false
Investment Analysis
Technology & Software
Mixed Chart
Barclays
Add to my slides
Remove from favorites
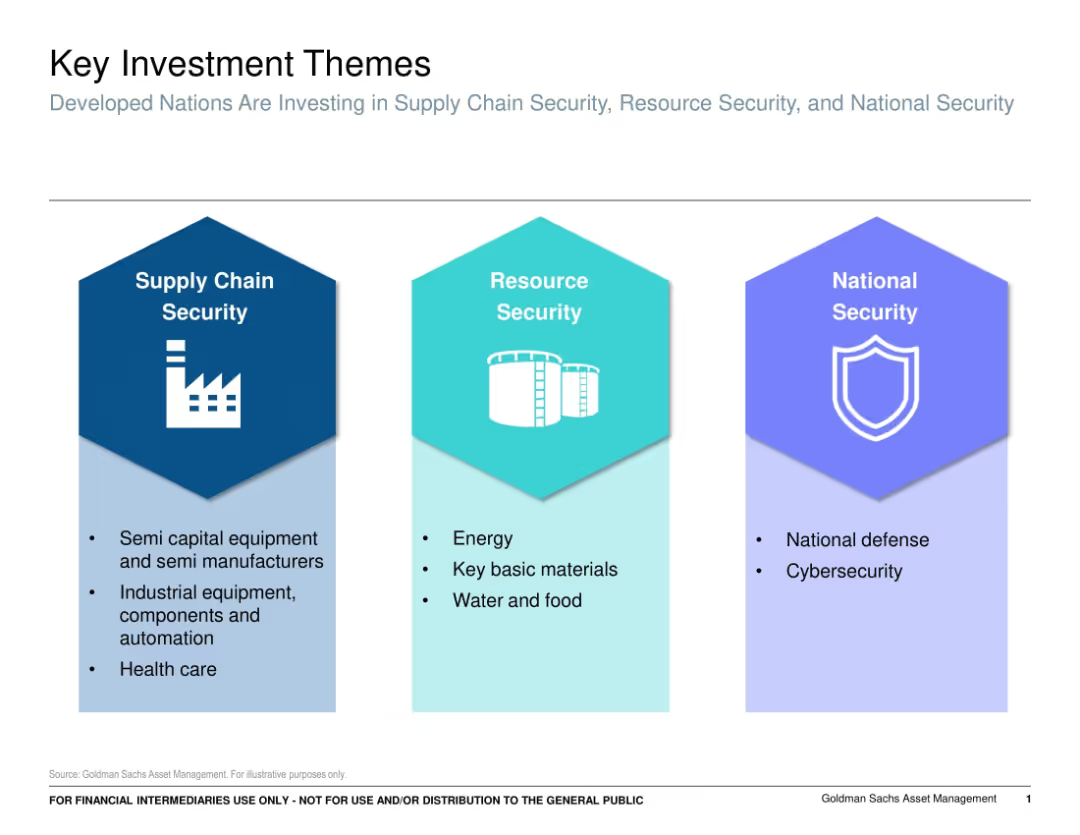
Three-column layout with icons: Supply Chain Security, Resource Security, and National Security; color-coded and simplified graphics.
Strategic Planning
Financial Services
Highlights three macro investment themes driving developed nations: supply chain security (e.g., automation, healthcare), resource security (e.g., energy, water), and national security (e.g., defense, cybersecurity). The design is thematic and policy-driven.
investment themes, security, supply chain, national defense, cybersecurity, energy, resources, macro trends
false
Strategic Planning
Financial Services
Pillar
Goldman Sachs
Add to my slides
Remove from favorites
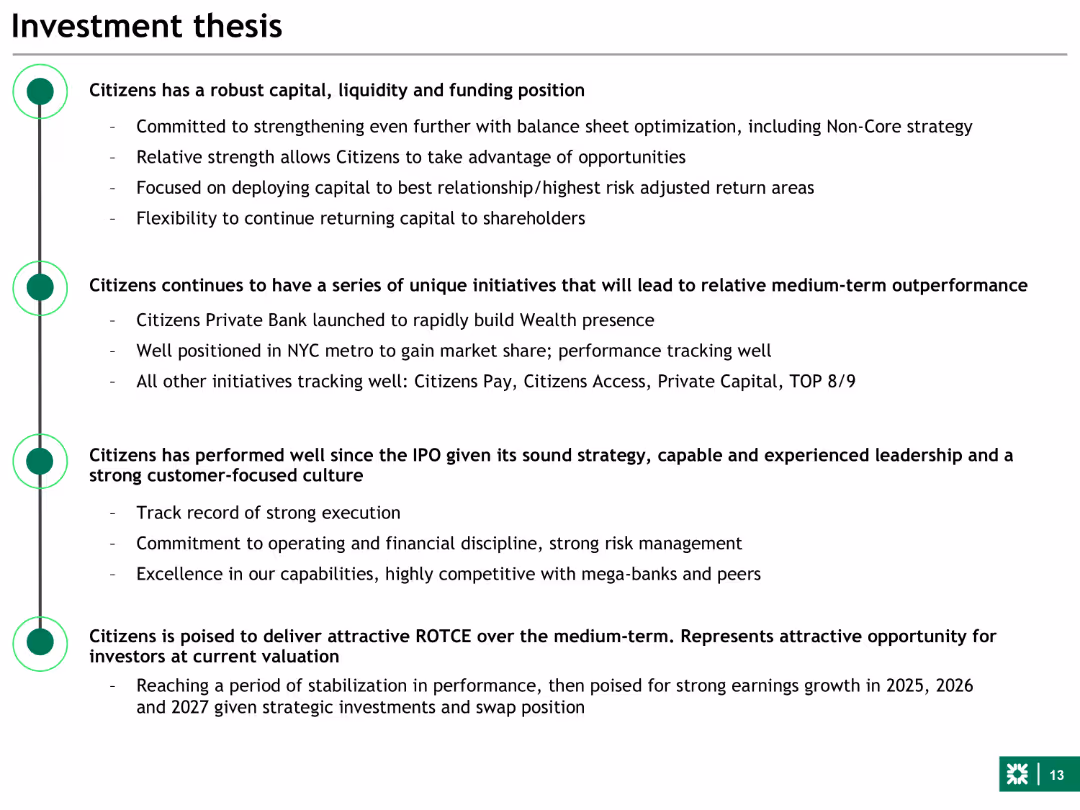
Simple layout with bullet points detailing the investment thesis for Citizens, organized around key pillars of capital, initiatives, performance, and future outlook.
Investment Analysis
Financial Services
Outlines the investment thesis for Citizens, focusing on robust capital, strategic initiatives, performance since IPO, and medium-term outlook, aiming to attract potential investors.
investment, thesis, Citizens, capital, initiatives, performance, IPO, outlook, investors
false
Investment Analysis
Financial Services
Vertical Flow
Goldman Sachs
Add to my slides
Remove from favorites
The slide has a list format with color-coded sections, each providing key points about the investment thesis, and a company logo in the top right corner.
Strategic Planning
Financial Services
The slide articulates a financial institution's investment thesis, highlighting the pillars of earnings, risk management, and capital allocation. It's useful for communicating the company's strategic positioning and investment potential to stakeholders or potential investors.
Investment Thesis, Earnings, Risk Management, Capital Allocation, Strategic Position, Financial Institution
false
Strategic Planning
Financial Services
Table
Morgan Stanley
Add to my slides
Remove from favorites
A stacked column chart depicting the distribution of investment in the education sector by transaction size of disclosed deals from 2015 to 2023. Highlights include significant transactions and their values.
Financial Performance
Education & Training
The slide details how investment in the education sector is distributed by transaction size, indicating trends in mid-size and mega transactions and their impact on the overall investment landscape.
investment, transaction size, disclosed deals, education sector, distribution
false
Financial Performance
Education & Training
Mixed Chart
LEK
Add to my slides
Remove from favorites
This slide features multiple column charts displaying percentages of companies investing in areas like talent retention and digital transformation, with emphasis on climate and sustainability investments.
Market Analysis and Trends
Financial Services
Highlights current investment trends across sectors focusing on digital, climate, and sustainability initiatives. It indicates strong corporate investment in innovation and talent development as strategic responses to current market challenges.
investment trends, digital transformation, sustainability, innovation, talent retention
false
Market Analysis and Trends
Financial Services
Multiple Chart
BCG
Add to my slides
Remove from favorites
A slide with a night traffic long exposure image, bar graphs, and detailed text analysis of investment trends.
Investment Analysis
Technology & Software
Reviews significant investment trends in Southeast Asia's technology sector, with a focus on venture capital and private equity.
Investment Trends, Southeast Asia, Venture Capital, Private Equity, Technology Sector, Market Growth
false
Investment Analysis
Technology & Software
Mixed Chart
Bain
Add to my slides
Remove from favorites
Slide features a column chart comparing factors driving investment in underwriting by line of business. Different colors represent personal, commercial lines, and more.
Investment Analysis
Financial Services
Analyzes how different lines of business in the insurance sector prioritize their investment in underwriting, focusing on areas like expense reduction and talent development.
investment, underwriting, business lines, expense reduction, talent development
false
Investment Analysis
Financial Services
Mixed Chart
Accenture
Add to my slides
Remove from favorites
The slide has a column chart showing investors' preferences for external providers performing valuations of private equity/venture capital investments. An image of a business meeting is on the left.
Investment Analysis
Financial Services
Analyzes investors' preferences regarding external providers performing valuations for private equity and venture capital investments, detailing different levels of preference.
investment, valuation, external providers, investors, preferences, private equity, venture capital, analysis, business meeting
false
Investment Analysis
Financial Services
Mixed Chart
EY
Add to my slides
Remove from favorites
The slide includes two column charts comparing managers' and investors' preferences for the frequency of private investment valuations. The left side features an image of professionals discussing work.
Investment Analysis
Financial Services
Discusses differences between managers and investors on how often private investment valuations should be performed, highlighting monthly, quarterly, semiannual, and annual preferences.
investment, valuation, managers, investors, frequency, private equity, venture capital, preferences, hedge funds, analysis
false
Investment Analysis
Financial Services
Mixed Chart
EY
Add to my slides
Remove from favorites
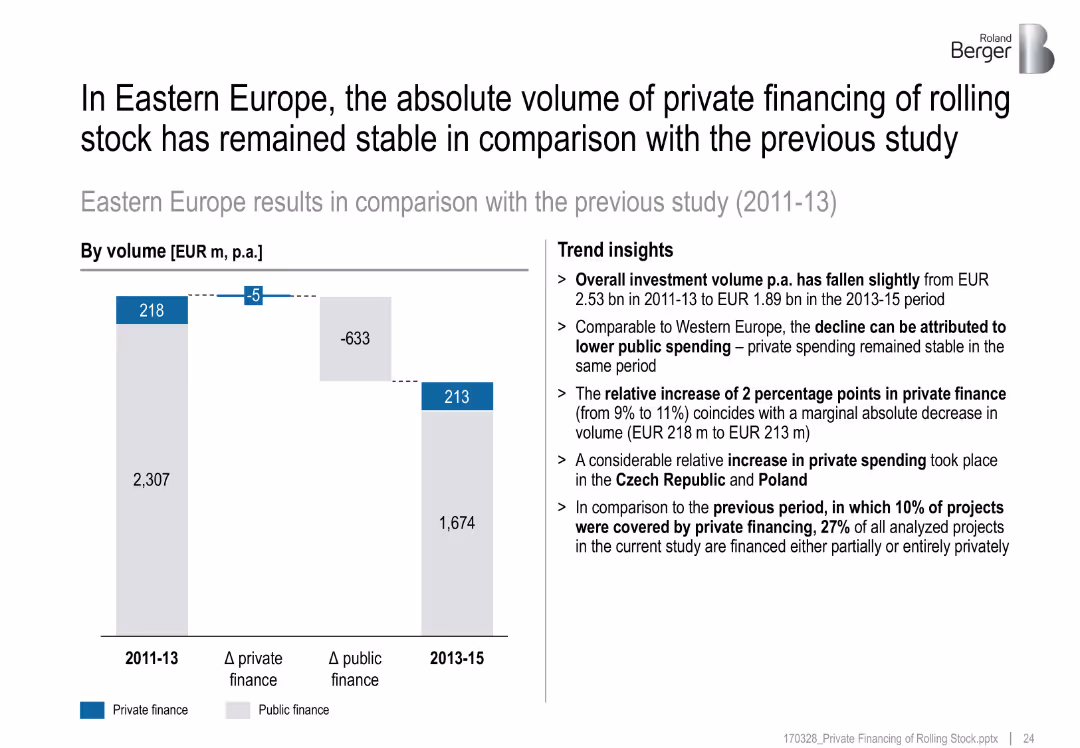
Bar comparison chart, trend insights on right, color-coded bars
Financial Performance
Transportation & Logistics
Private financing in Eastern Europe remained stable (EUR 213M), while public spending dropped. Overall investment volume declined. Czech Republic and Poland contributed to a relative increase in private share.
investment volume, Eastern Europe, stable financing, public vs private, comparison, Czech, Poland
false
Financial Performance
Transportation & Logistics
Mixed Chart
Roland Berger
Add to my slides
Remove from favorites
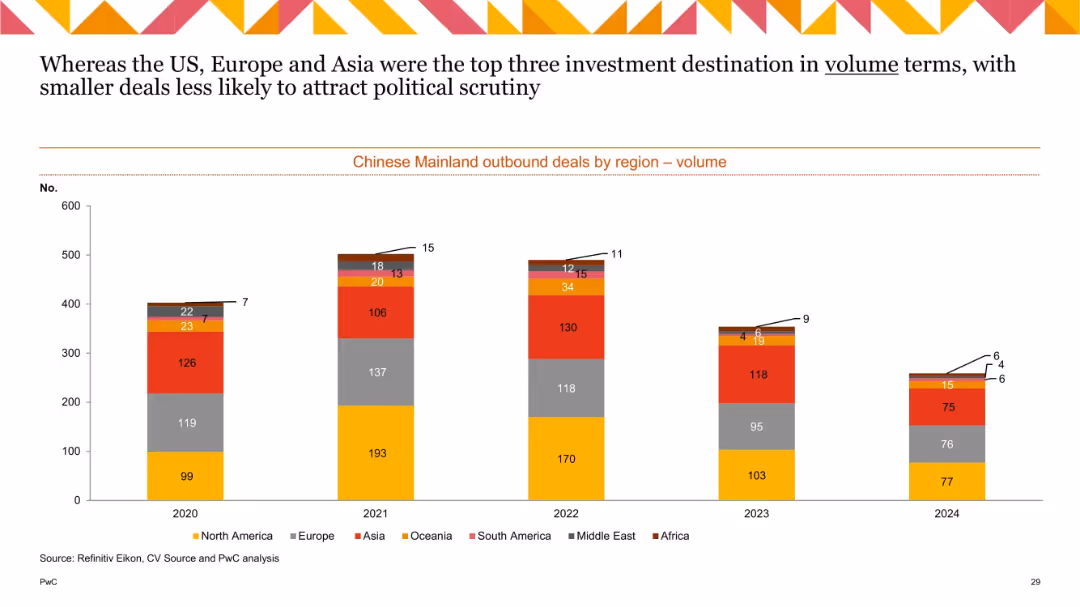
Bar chart with stacked color segments by region across five years (2020–2024); minimalist layout with vertical bars
Market Analysis and Trends
Financial Services
This slide presents a multi-year comparison of outbound investment deal volumes from China by region. It emphasizes that smaller deals draw less scrutiny, and US, Europe, and Asia dominate as destinations.
investment volume, outbound deals, regions, China, trends, 2020–2024, North America, Europe, Asia, PwC
false
Market Analysis and Trends
Financial Services
Single Chart
PwC/Strategy&
Add to my slides
Remove from favorites
Features a series of bar charts illustrating investor attitudes toward debt and leverage in companies. Colors such as teal and green highlight different responses, emphasizing preferences for different debt levels.
Risk Assessment and Management
Financial Services
Explores investor attitudes towards company debt, particularly focusing on the importance of interest coverage ratios and rollover risks, essential for assessing investment viability in volatile markets.
investor attitudes, company debt, interest coverage ratios, leverage
false
Risk Assessment and Management
Financial Services
Single Chart
BCG
Add to my slides
Remove from favorites
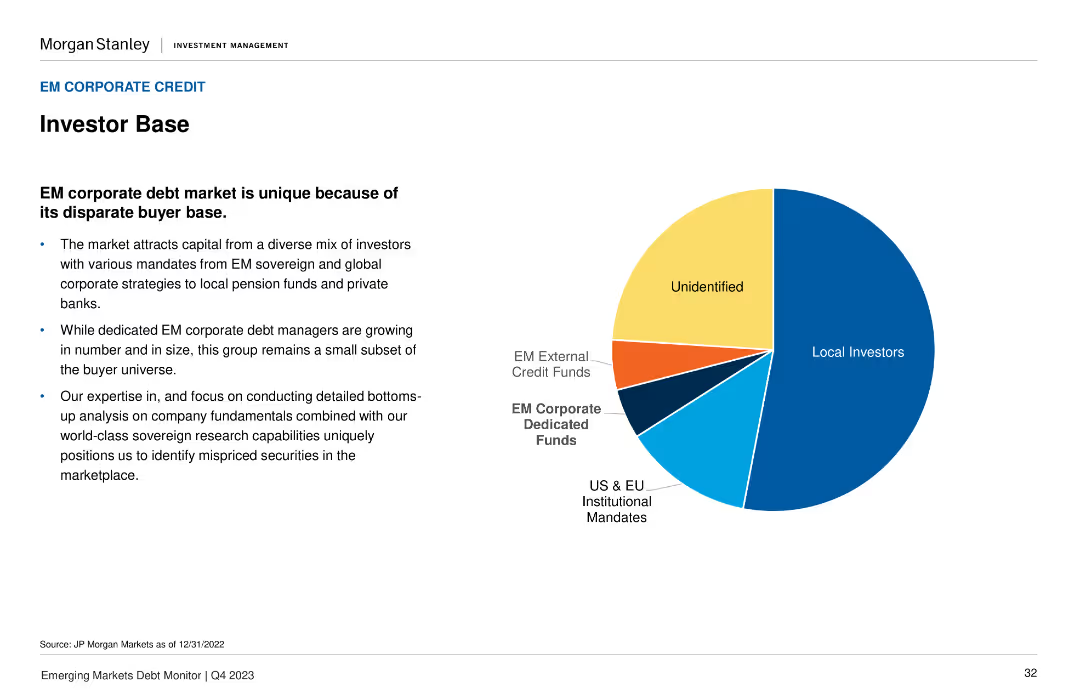
The slide features a pie chart displaying the composition of the EM corporate debt market investor base, with segments for Local Investors, US & EU Institutional, and others.
Market Analysis and Trends
Financial Services
It describes the diverse mix of investors in the EM corporate debt market and emphasizes the unique buyer base. Useful for understanding the investor landscape in emerging markets.
investor base, corporate debt, EM, market composition, analysis
false
Market Analysis and Trends
Financial Services
Mixed Chart
Morgan Stanley
Add to my slides
Remove from favorites
A bar graph with a horizontal layout shows the percentage of investors' change in risk preference due to increased inflation. It includes a sidebar with notable changes in investing practices. The visual elements are detailed, utilizing contrasting colors to highlight changes over time.
Market Analysis and Trends
Financial Services
Illustrates a shift in investors' risk preferences in response to inflation, highlighting an increase in risk aversion and changes in investment practices. Can be used to discuss investment strategies and market behavior.
Investor Behavior, Risk Aversion, Inflation Impact, Investment Strategies, Market Trends, Risk Management, Cash Holdings, Asset Classes, Portfolio Management, Value Investing
false
Market Analysis and Trends
Financial Services
Multiple Chart
BCG
Add to my slides
Remove from favorites
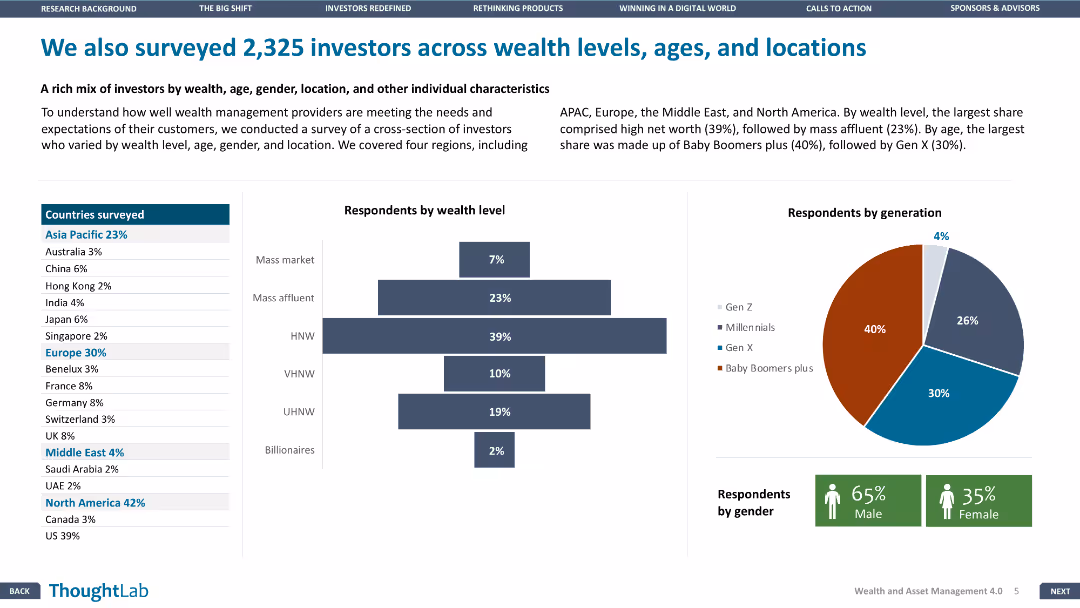
This slide contains multiple data visualizations, including a map, bar chart, and pie chart, illustrating the demographics of 2,325 investors by wealth level, age, gender, and location, across various regions.
Market Analysis and Trends
Financial Services
Presents survey data of 2,325 investors, analyzing their wealth levels, age groups, gender distribution, and geographical locations, offering insights into investor demographics and preferences.
investor demographics, survey, wealth levels, age groups, gender distribution, geographical locations, market insights
false
Market Analysis and Trends
Financial Services
Multiple Chart
Deloitte
Add to my slides
Remove from favorites
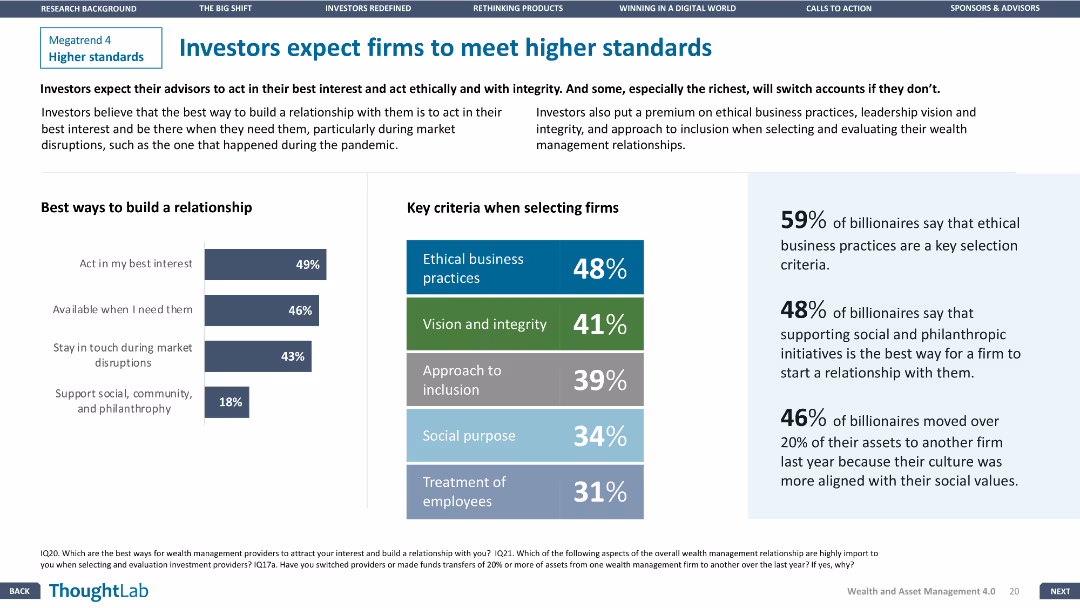
The slide has two sections: best ways to build a relationship and key criteria when selecting firms, supported by column charts.
Risk Assessment and Management
Financial Services
The slide discusses the high standards investors expect from wealth management firms, emphasizing ethical practices, vision, and integrity.
Investor expectations, Higher standards, Financial Services, Relationship building, Ethical practices
false
Risk Assessment and Management
Financial Services
Mixed Chart
Deloitte
Add to my slides
Remove from favorites
Text and stacked column charts detailing fee preferences among different age groups of investors
Technology and Digital Transformation
Financial Services
Discusses fee preferences among young and older investors, focusing on performance-based fees and the shift in pricing structures.
investor fees, performance-based, age differences, financial services
false
Technology and Digital Transformation
Financial Services
Mixed Chart
Deloitte
Add to my slides
Remove from favorites
With a blend of column charts and textual data, this slide compares investor funding across different sectors, highlighting the rise of Web3.
Investment Analysis
Financial Services
The slide underscores the significant investor interest in DFS and Web3, signaling market shifts and new investment frontiers.
investor funding, DFS, Web3, market shift, investment frontiers, sector analysis
false
Investment Analysis
Financial Services
Single Chart
Bain
Add to my slides
Remove from favorites
Features a complex assortment of column charts detailing private funding distribution by sector, with a legend and percentages. Rich in data and color contrast.
Investment Analysis
Financial Services
A strategic slide depicting investor funding distribution in Indonesia, focusing on sectors such as e-commerce and digital media, crucial for discussions on investment allocation and sector performance.
investor funding, distribution, Indonesia, sector analysis, digital economy
false
Investment Analysis
Financial Services
Single Chart
Bain
Add to my slides
Remove from favorites
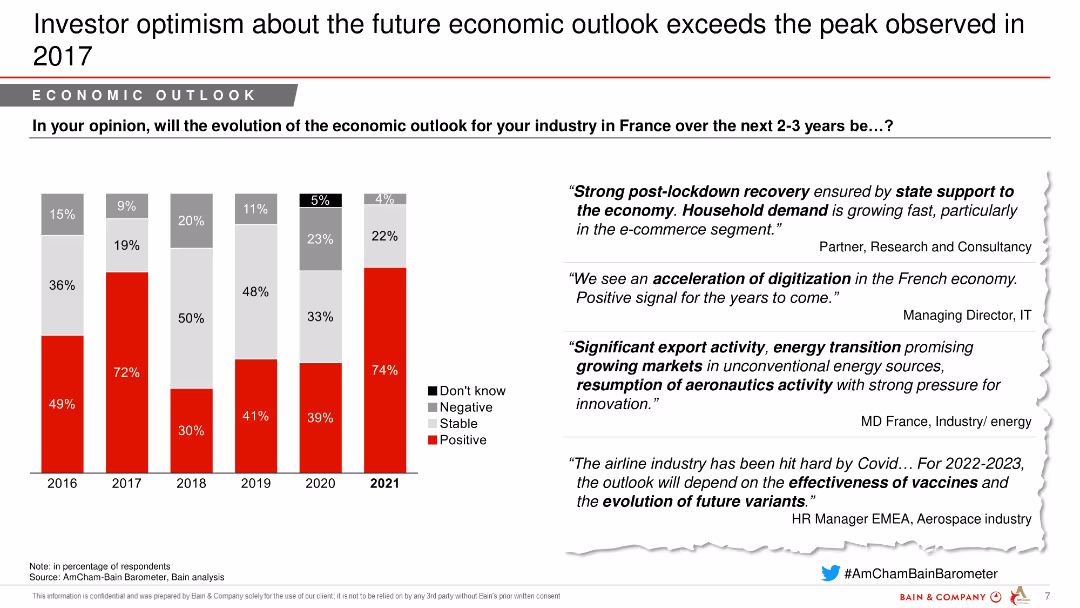
The slide features a column chart showing changes in investor optimism about the economic outlook from 2016 to 2021, with positive expectations peaking in 2021.
Market Analysis and Trends
Financial Services
The slide indicates increasing investor optimism about the future economic outlook in France, surpassing previous years' peaks, especially following the post-lockdown recovery.
investor optimism, economic outlook, future expectations, France, survey, 2021
false
Market Analysis and Trends
Financial Services
Mixed Chart
Bain
Add to my slides
Remove from favorites
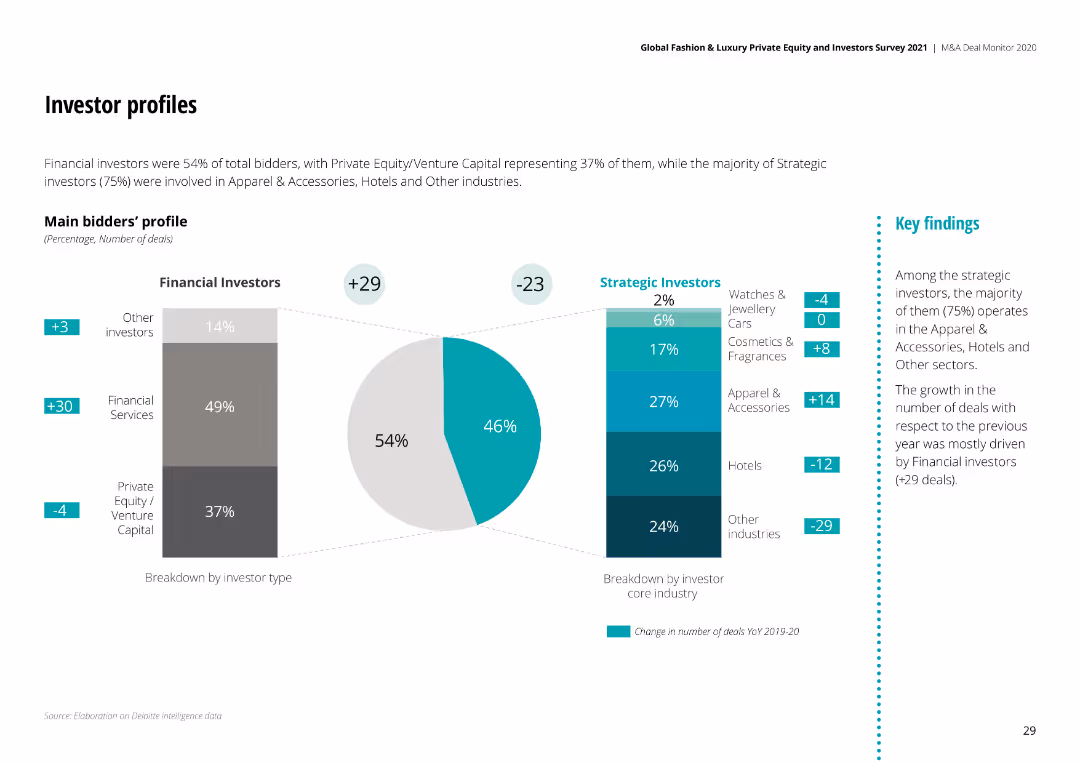
The slide contains pie charts and a bar chart showing the profiles of financial and strategic investors in M&A deals, with changes from 2019-2020.
Investment Analysis
Consumer Goods
It profiles investors in M&A deals, distinguishing between financial and strategic investors, and highlights changes in their involvement.
Investor Profiles, Financial, Strategic, M&A, 2020
false
Investment Analysis
Consumer Goods
Multiple Chart
Deloitte
Add to my slides
Remove from favorites
Text-heavy slide with a bar chart. The chart shows various risks with color-coded bars indicating levels of concern from 2021 and 2022.
Risk Assessment and Management
Financial Services
The slide identifies key risks affecting Europe's attractiveness and the strengths of the UK's fundamentals for investors.
investor risks, Europe, UK's strengths, column chart, risk management
false
Risk Assessment and Management
Financial Services
Multiple Chart
EY
Add to my slides
Remove from favorites
The slide includes an image of two people discussing on the left, with a column chart on the right showing the proportion of AUM allocated to various alternative asset classes in 2022 versus 2019.
Investment Analysis
Financial Services
This slide examines investors' intentions to hold or increase their allocations in alternative asset classes, comparing data from 2019 and 2022.
investors, allocations, AUM, alternative asset classes, 2022, 2019
false
Investment Analysis
Financial Services
Mixed Chart
EY
Add to my slides
Remove from favorites
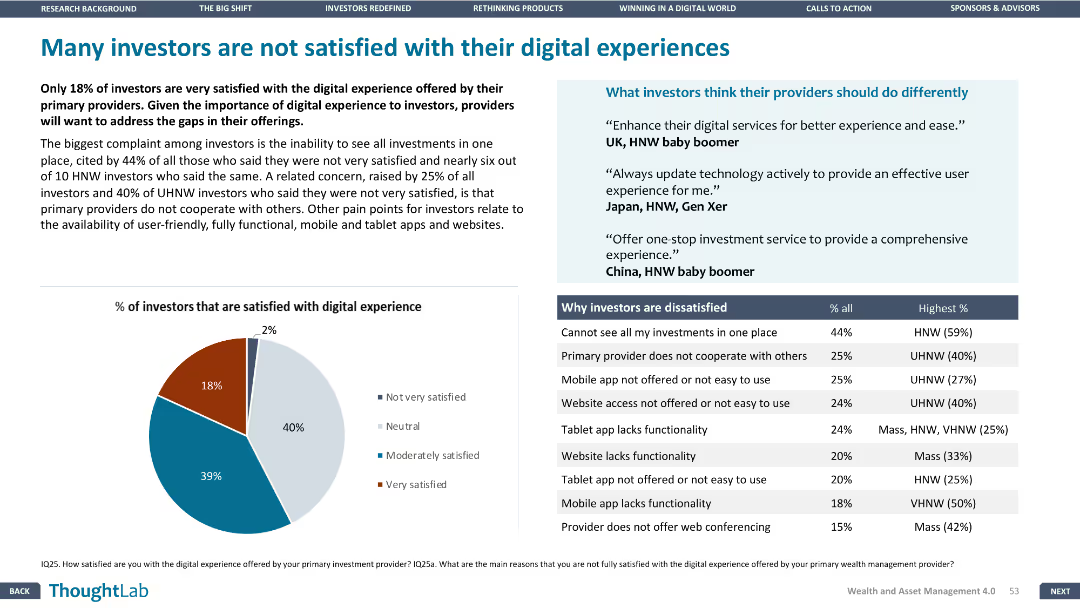
The slide includes a pie chart and a table, with a layout that balances text and visual elements. The focus is on investor satisfaction with digital experiences.
Customer and Market Segmentation
Financial Services
The slide addresses the dissatisfaction among investors with their digital experiences, listing the main reasons for dissatisfaction and what investors think providers should do differently.
Investor satisfaction, digital experience, dissatisfaction reasons, improvement
false
Customer and Market Segmentation
Financial Services
Mixed Chart
Deloitte
Add to my slides
Remove from favorites
The slide features a large image of a cargo ship loaded with containers, with text blocks overlaying the image and a column chart below. The column chart has six categories with different colors.
Market Analysis and Trends
Transportation & Logistics
The slide discusses the focus of investors on business services and logistics in Greece, providing survey data on expected investment changes in various sectors over the next three years.
investors, business services, logistics, Greece, investment
false
Market Analysis and Trends
Transportation & Logistics
Mixed Chart
EY
Add to my slides
Remove from favorites
Slide with a blue and white color scheme, containing a title, a column chart of SEA-based funds' dry powder, and a sidebar with bullet points.
Market Analysis and Trends
Financial Services
Discusses investors' caution, the significance of dry powder, and the potential for investment opportunities.
investors, dry powder, SEA, capital, funds, caution, activity, opportunities
false
Market Analysis and Trends
Financial Services
Mixed Chart
Bain
Add to my slides
Remove from favorites
The slide includes a line graph tracking investor sentiment over time. It contrasts views on the stock market and the economy, with textual annotations explaining key trends and dates.
Market Analysis and Trends
Financial Services
Analyzes investor sentiment shifts regarding the stock market and economy, noting particularly low bullishness. Useful for market trend analysis and investment strategy planning.
Investor Sentiment, Bearish Trends, Bullish Sentiment, Stock Market, Economy, Market Analysis, Investment Strategy, Trend Tracking, Economic Outlook, Sentiment Change
true
Market Analysis and Trends
Financial Services
Single Chart
BCG
Add to my slides
Remove from favorites
Includes bar charts showing investor sentiment and economic optimism by region.
Market Analysis and Trends
Financial Services
Presents findings from the UBS Investor Sentiment Survey, showing a drop in short-term optimism but long-term positivity.
investor sentiment, economic optimism, survey, long-term positivity, short-term drop
false
Market Analysis and Trends
Financial Services
Multiple Chart
UBS
Add to my slides
Remove from favorites
A bar chart displays the percentage of investors' expectations for the duration of the shift from growth to value investing. Text boxes and a source citation are included.
Market Analysis and Trends
Financial Services
This slide visualizes investors' expectations for the shift from growth to value investing over various time periods. It is useful for analyzing investment trends and strategizing.
investors, expectations, growth, value, trends
false
Market Analysis and Trends
Financial Services
Single Chart
BCG
Add to my slides
Remove from favorites
Previous
Next
You don't have any favorites yet.
Please wait loading your favorites slides...
Create a FREE account to continue browsing
Receive Instant Access to 1,000+ slides from companies like McKinsey, Google, and Goldman Sachs
First Name
Last Name
Email
Password
I agree to all
Terms & Privacy Policy
Thank you! Your submission has been received!
Oops! Something went wrong while submitting the form.
Have an account?
Sign in
Upgrade to PRO to Save slides
Advanced Search and Filters
Access to 15,000+ slides
Access to Category Pages
Save/Bookmark Slides
PowerPoint Template Library
Pick a Plan
MONTHLY
$12/month
Billed every month, Cancel anytime.
YEARLY
$9/year
Billed $108 annually, Cancel anytime.
Checkout for $12/month
Checkout for $108/yr
Secured by Stripe | AES-256 bit encryption