My Account
My Slides
Search by Category
Pricing
Templates
View All Templates
Download Template Slides
✦ AI Search
Feedback
Login
Logout
Get Started
Browse all Slides
Browse all Slides
Create a FREE Account
Instant access to 1,000+ real slides from top companies like McKinsey, BCG, Goldman Sachs, Google and many more!
First Name
Last Name
Email
Password
I agree to all
Terms & Privacy Policy
Thank you! Your submission has been received!
Oops! Something went wrong while submitting the form.
Have an account?
Sign in
Saved Slides
Total No. of slides saved
0
↻ Refresh
✖ Clear all
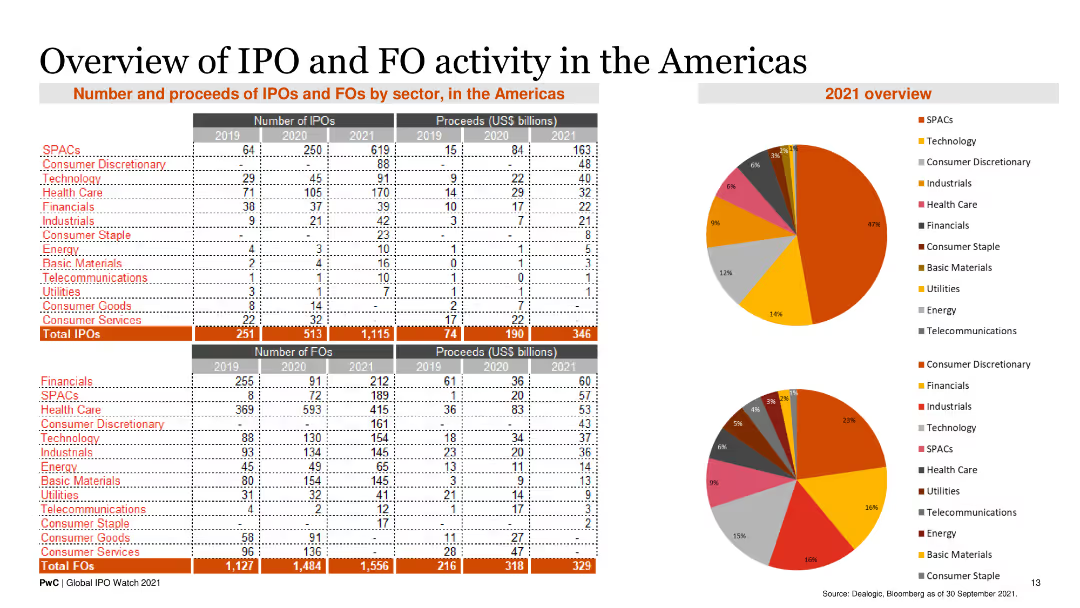
The slide includes tables and pie charts detailing the number and proceeds of IPOs and FOs by sector in the Americas for 2019, 2020, and 2021, along with sector breakdowns.
Market Analysis and Trends
Financial Services
It provides detailed data on IPO and FO activities in the Americas, broken down by sector, helping to understand market dynamics and sector performance.
IPOs, FOs, sector analysis, Americas, financial data
false
Market Analysis and Trends
Financial Services
Multiple Chart
PwC/Strategy&
Add to my slides
Remove from favorites
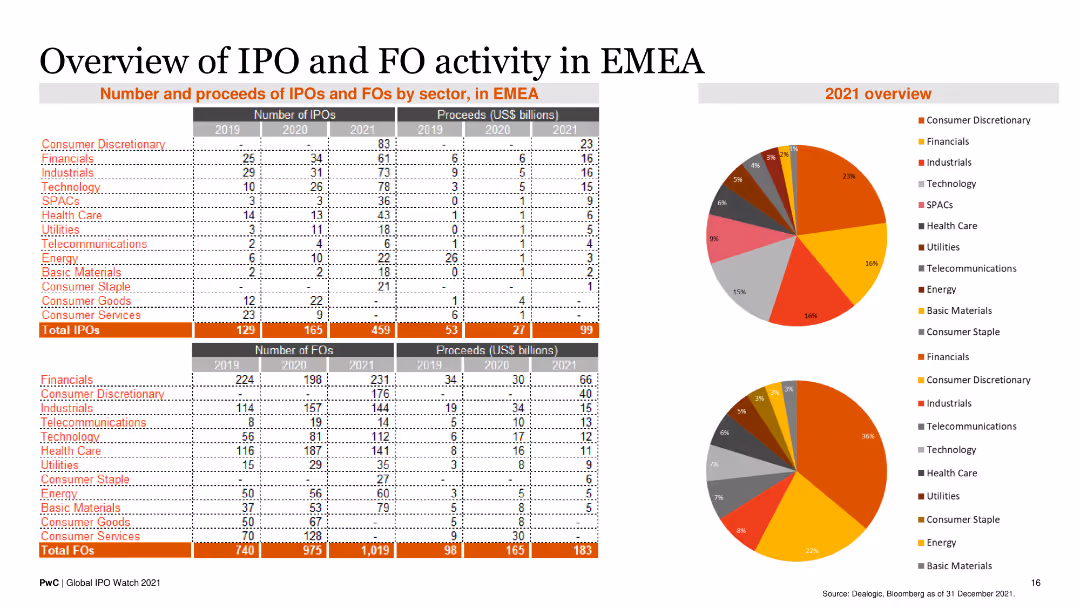
The slide includes tables and pie charts displaying the number and proceeds of IPOs and FOs by sector in the EMEA region for 2019, 2020, and 2021, along with sector breakdowns.
Market Analysis and Trends
Financial Services
It provides a comprehensive overview of IPO and FO activities in EMEA by sector, useful for understanding market trends and sector-specific performance.
IPOs, FOs, sector analysis, EMEA, financial data
false
Market Analysis and Trends
Financial Services
Multiple Chart
PwC/Strategy&
Add to my slides
Remove from favorites
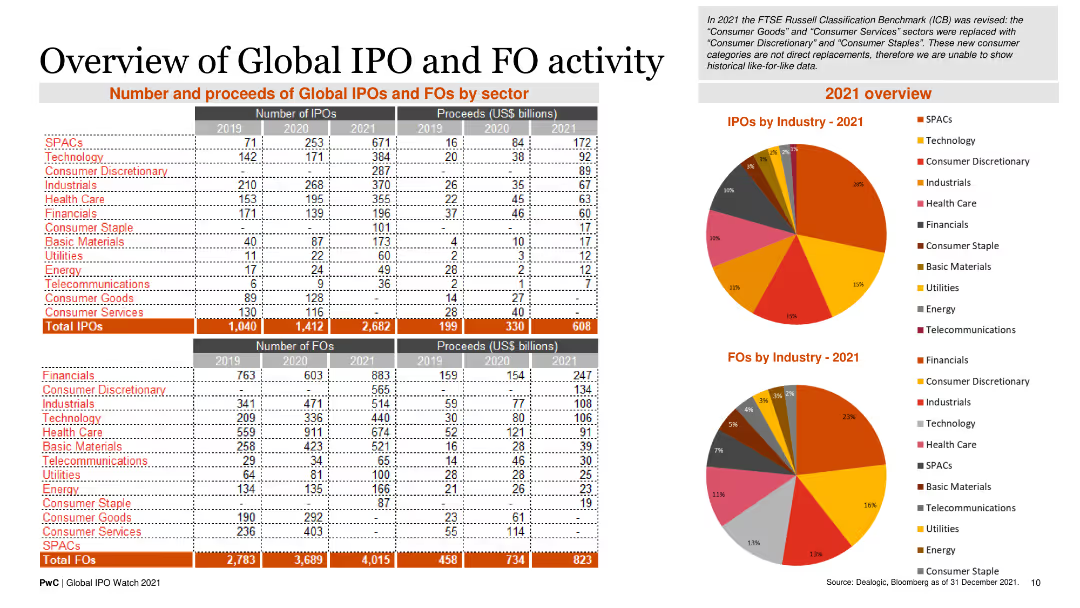
The slide comprises tables and pie charts showing the number and proceeds of global IPOs and FOs by sector for the years 2019, 2020, and 2021, along with sector breakdowns.
Market Analysis and Trends
Financial Services
It provides a comprehensive overview of IPO and FO activities by sector, including total numbers and proceeds, along with sector-specific insights.
IPOs, FOs, sector analysis, global trends, financial data
false
Market Analysis and Trends
Financial Services
Multiple Chart
PwC/Strategy&
Add to my slides
Remove from favorites
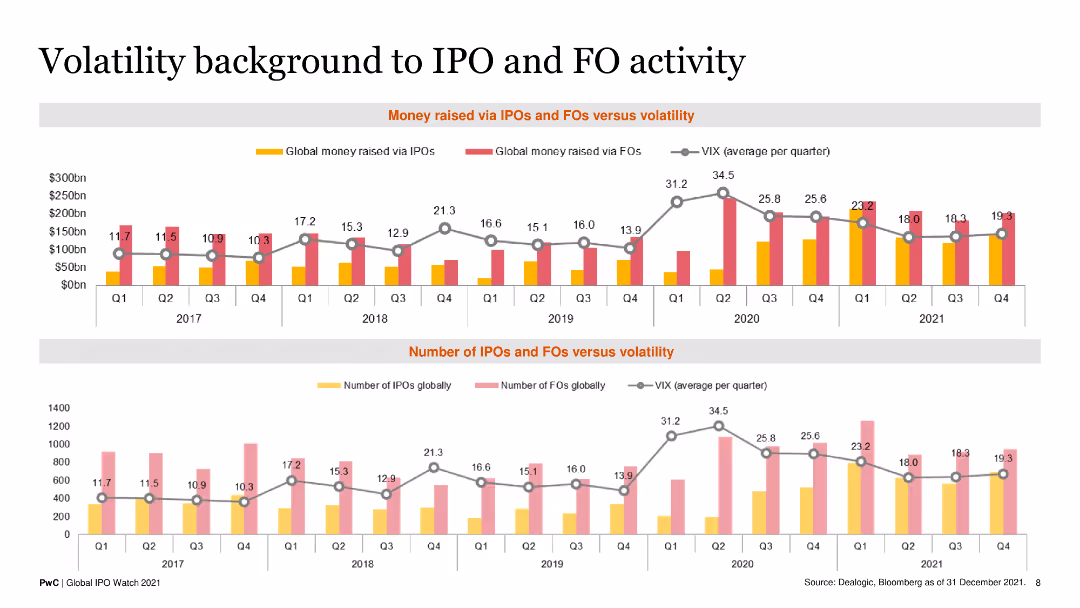
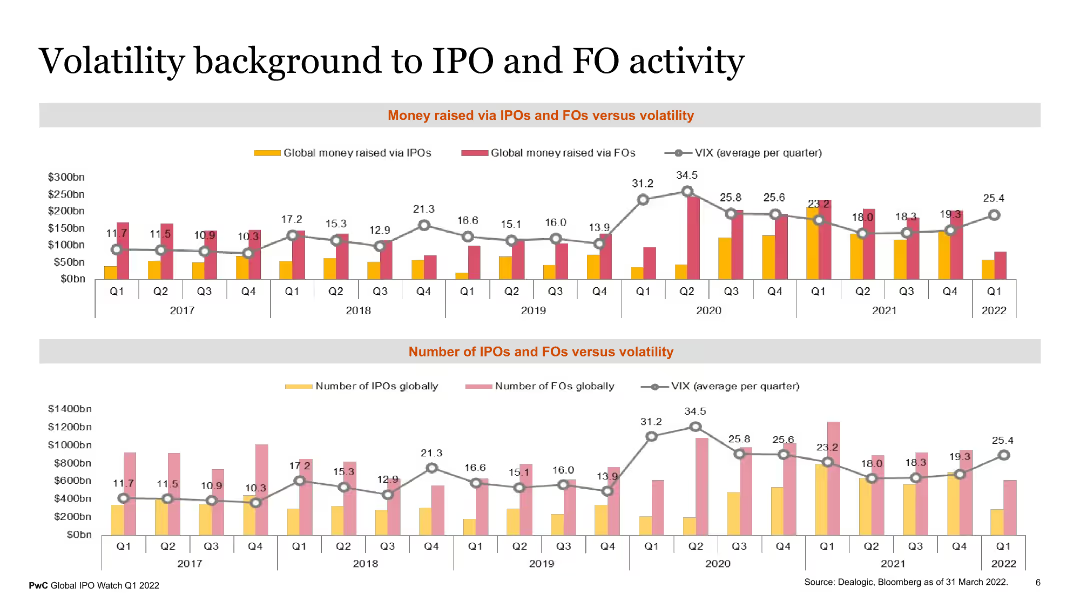
The slide features two line and column combination charts showing global money raised via IPOs and FOs against the VIX index from Q1 2017 to Q4 2021.
Risk Assessment and Management
Financial Services
This slide correlates the volatility index (VIX) with the number of IPOs and FOs, providing insights into market stability and investment trends.
IPOs, FOs, VIX index, market volatility, financial performance
false
Risk Assessment and Management
Financial Services
Multiple Chart
PwC/Strategy&
Add to my slides
Remove from favorites
The slide features two column charts comparing money raised via IPOs and FOs versus volatility and the number of IPOs and FOs versus volatility from 2017 to Q1 2022. Each chart uses colored bars and a line graph to depict data points.
Market Analysis and Trends
Financial Services
This slide shows the relationship between market volatility and the financial activities of IPOs and FOs over several years. It highlights trends in capital raised and number of deals, providing insights for financial analysts and investors.
IPOs, FOs, volatility, financial trends, capital raised
false
Market Analysis and Trends
Financial Services
Multiple Chart
PwC/Strategy&
Add to my slides
Remove from favorites
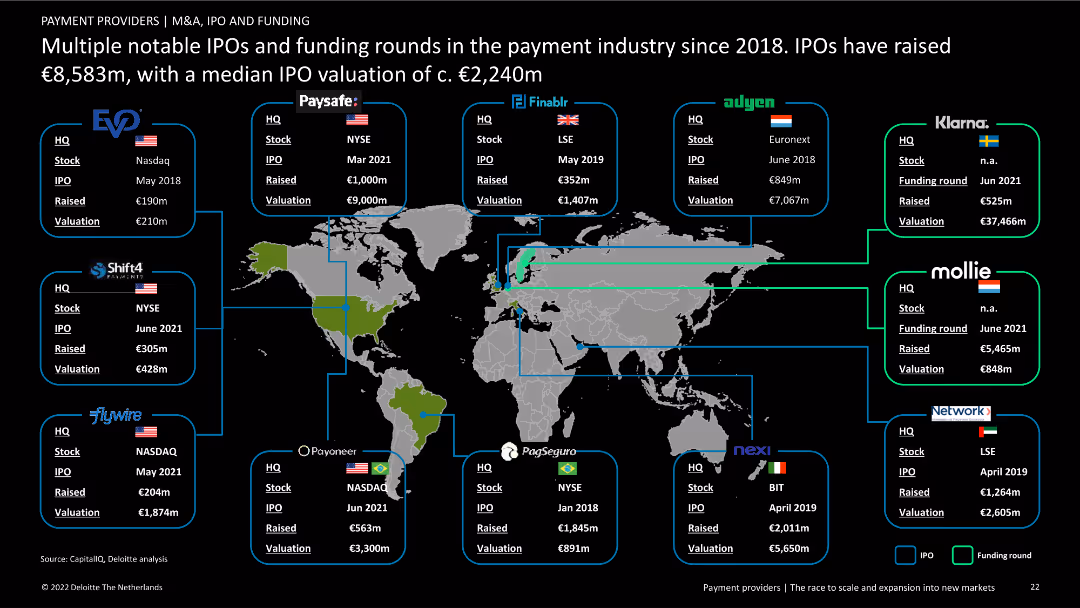
Contains a world map highlighting notable IPOs and funding rounds by company and region. Includes text boxes with details of the IPOs and funding amounts.
Investment Analysis
Financial Services
Overview of significant IPOs and funding rounds in the payment industry from 2018 onwards, providing insights into company valuations and geographical distribution of investments.
IPOs, funding rounds, payment industry, investment analysis, financial services, market analysis, company valuations, global distribution
false
Investment Analysis
Financial Services
Graphic
Deloitte
Add to my slides
Remove from favorites
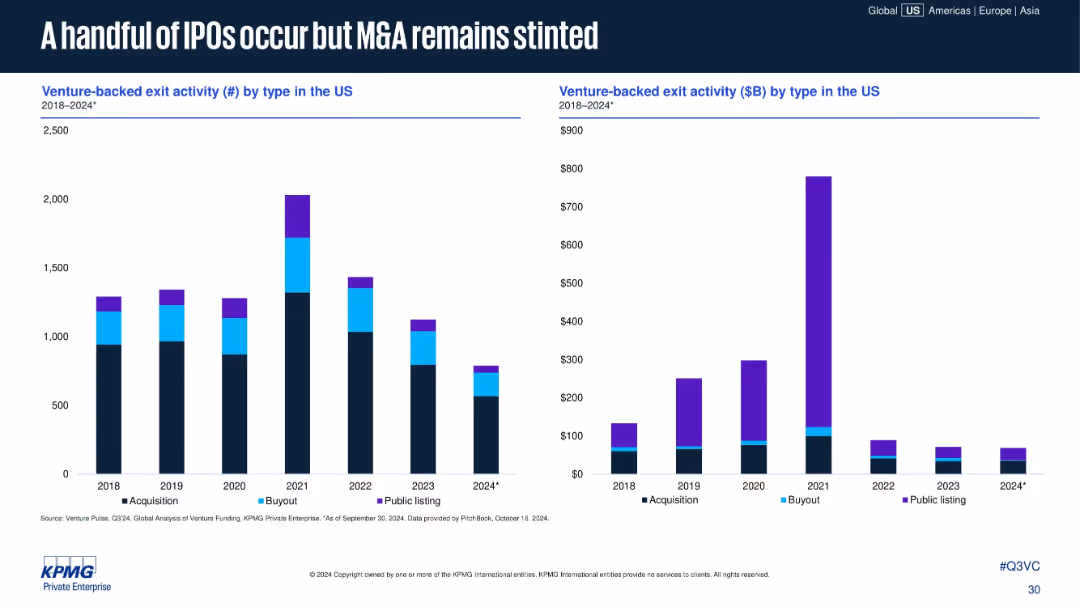
Two vertical bar charts: left shows number of exits by type; right shows exit value ($B) by type. Color-coded by acquisition, buyout, and public listing.
Mergers and Acquisitions
Financial Services
Public listings have dropped significantly since 2021, with M&A dominating exit types. Total exit values are down across the board, showing limited liquidity events and a slowdown in large-scale buyouts and IPOs.
IPOs, M&A, buyouts, exit activity, venture exits, liquidity events, public listing decline, 2024 exits
false
Mergers and Acquisitions
Financial Services
Multiple Chart
KPMG
Add to my slides
Remove from favorites
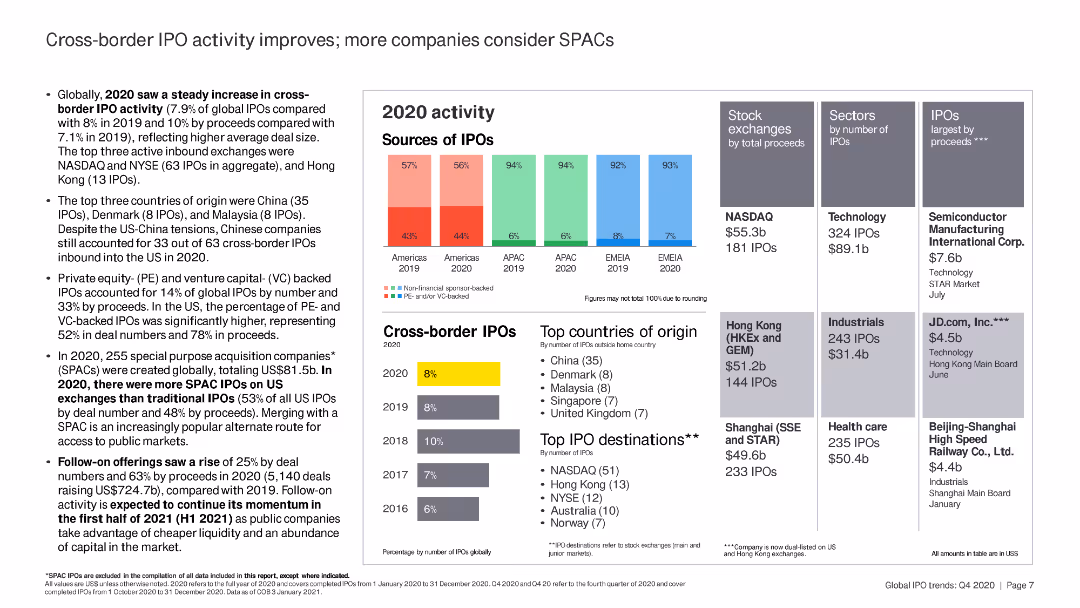
This slide includes column charts and bar charts detailing 2020 IPO activity by region and stock exchange. There are several highlighted text boxes summarizing key figures and top companies by IPO proceeds.
Market Analysis and Trends
Financial Services
The slide provides an overview of cross-border IPO activity in 2020, with a focus on the increasing popularity of SPACs. Key statistics on IPO numbers, proceeds, and top stock exchanges are presented.
IPO, SPAC, stock exchange, proceeds, 2020
false
Market Analysis and Trends
Financial Services
Multiple Chart
EY
Add to my slides
Remove from favorites
Contains a comparative analysis layout, contrasting traditional IPO processes with SPAC merger processes using a timeline format.
Strategic Planning
Financial Services
Compares traditional IPO and SPAC timelines, highlighting the efficiencies and shorter timelines associated with SPACs.
IPO, SPAC, timeline, traditional, comparison, process, planning
false
Strategic Planning
Financial Services
Linear Flow
PwC/Strategy&
Add to my slides
Remove from favorites
The slide features two column charts comparing the number and proceeds of IPOs across various sectors for Q1 2023 and Q1 2022. Colors differentiate the years, with specific focus on technology and energy sectors.
Market Analysis and Trends
Financial Services
The slide presents a comparison of IPO activities across different sectors in Q1 2023 versus Q1 2022, highlighting the dominance of the energy sector in proceeds despite fewer deals.
IPOs, sectors, technology, energy, Q1 2023, column charts, market trends, financial services, comparison, proceeds
false
Market Analysis and Trends
Financial Services
Multiple Chart
EY
Add to my slides
Remove from favorites
The slide features a combination of column charts and a table. It showcases data on the number of IPOs and proceeds in the Americas for 2023, compared to 2022. Additional tables provide details on stock exchanges, sectors, and notable IPOs.
Market Analysis and Trends
Financial Services
The slide analyzes the revival of the IPO market in the Americas, highlighting an increase in both the number of IPOs and proceeds. It provides a detailed breakdown by stock exchanges, sectors, and largest IPOs, with data supporting bullish equities sentiment.
IPOs, stock exchanges, financial trends, market revival, sector analysis
false
Market Analysis and Trends
Financial Services
Multiple Chart
EY
Add to my slides
Remove from favorites
Features column chart comparing the number of IPOs on Brazilian vs. American stock exchanges over two years
Investment Analysis
Financial Services
Examines the trend in tech IPOs, highlighting the activity in Brazil relative to the U.S. for 2018 and 2019
IPOs, tech, Brazil, US, stock exchanges
false
Investment Analysis
Financial Services
Single Chart
McKinsey
Add to my slides
Remove from favorites
The slide features bar charts ranking stock exchanges by the number of IPOs and proceeds for YTD 2023, with a focus on Mainland China and India leading in global fundraising.
Market Analysis and Trends
Financial Services
This slide provides a comparative analysis of global stock exchanges, highlighting Mainland China's dominance in fundraising and India's leading position in deal count for YTD 2023.
IPO, stock exchange, China, India, fundraising
false
Market Analysis and Trends
Financial Services
Multiple Chart
EY
Add to my slides
Remove from favorites
This slide uses a combination of column charts, tables, and text boxes. It includes financial data and visual representations of IPO trends.
Market Analysis and Trends
Financial Services
The slide shows the decline in IPOs and proceeds in the US and Canada, highlighting key stock exchanges, sectors, and notable IPOs.
IPOs, US NASDAQ, NYSE, stock exchanges, sectors
false
Market Analysis and Trends
Financial Services
Multiple Chart
EY
Add to my slides
Remove from favorites
The slide presents column charts comparing the number and proceeds of IPOs by sector for YTD 2023 and YTD 2022, emphasizing technology and energy sectors.
Market Analysis and Trends
Financial Services
This slide highlights the leading role of technology companies in global IPO activities, while also noting a decline in energy sector deals due to softer global energy prices.
IPO, technology, global, energy, trends
false
Market Analysis and Trends
Financial Services
Multiple Chart
EY
Add to my slides
Remove from favorites
This slide shows a detailed timeline with various phases of the IPO process, highlighted in orange and red, making significant milestones clear.
Strategic Planning
Financial Services
Provides a detailed IPO timeline, marking key activities and workstreams from preparation to the public phase, emphasizing the structured timeline of events.
IPO, timeline, activities, preparation, public phase
false
Strategic Planning
Financial Services
Table
PwC/Strategy&
Add to my slides
Remove from favorites
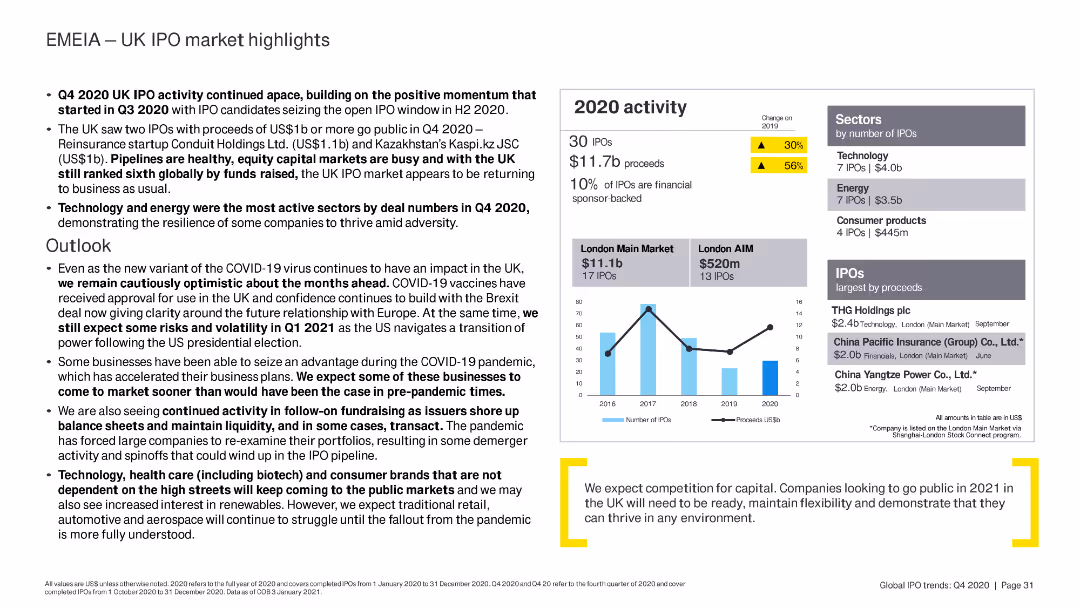
The slide features a column chart comparing the number and proceeds of IPOs in the London Main Market and AIM from 2016 to 2020. Text sections provide highlights of the UK IPO market in Q4 2020.
Market Analysis and Trends
Financial Services
Summarizes the UK IPO market's performance in Q4 2020, noting significant deals, sector activity, and market trends. Discusses outlook and expected competition for capital in 2021.
IPO, UK, market highlights, Q4 2020, financial services, London Main Market, AIM
false
Market Analysis and Trends
Financial Services
Mixed Chart
EY
Add to my slides
Remove from favorites
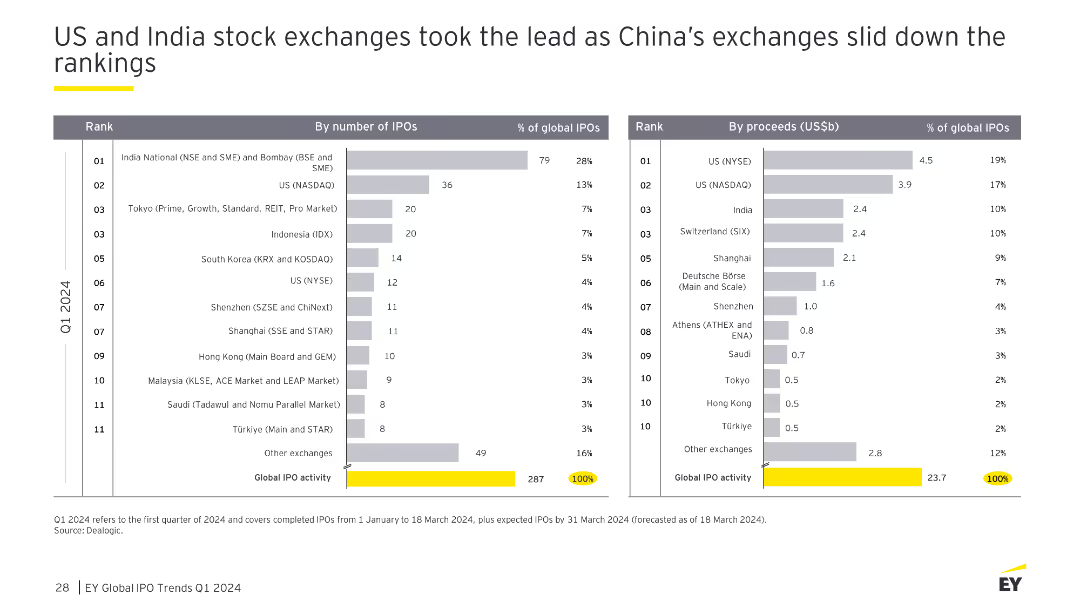
A slide with two comparative column charts showing the number and proceeds of IPOs by stock exchange in the first quarter of 2024. The visual complexity is moderate, focusing on comparative data across major exchanges.
Market Analysis and Trends
Financial Services
The slide analyzes the performance of global stock exchanges in the first quarter of 2024, noting the lead taken by US and India exchanges while China's exchanges experienced a decline. It provides comparative data on the number and proceeds of IPOs, highlighting the top-performing exchanges and their market shares.
IPO, US, India, China, Stock Exchanges, Rankings
false
Market Analysis and Trends
Financial Services
Multiple Chart
EY
Add to my slides
Remove from favorites
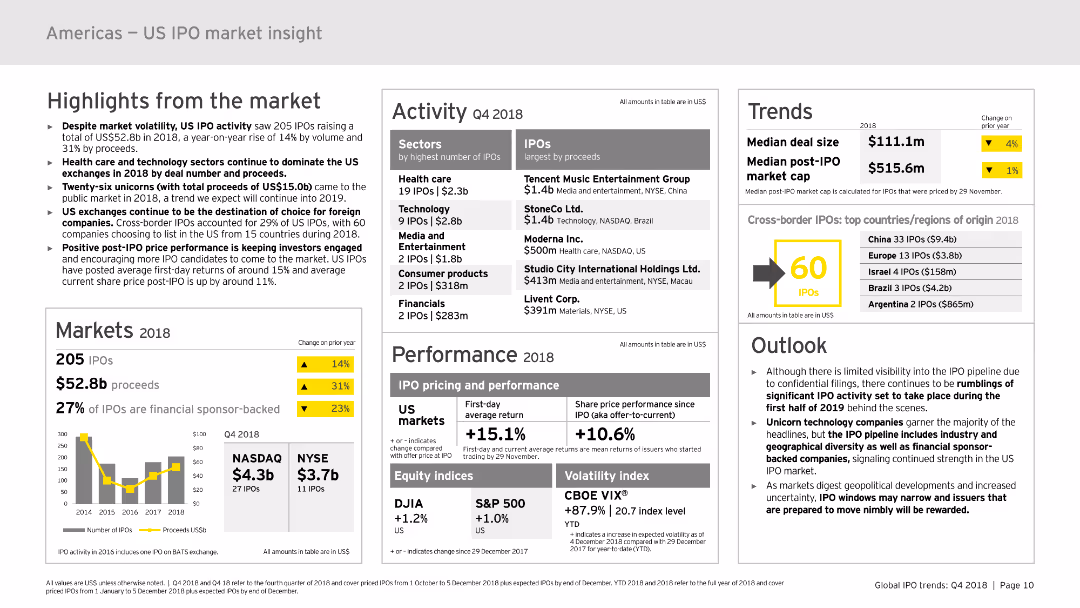
The slide contains multiple sections with various charts and graphs, including column charts, data tables, and infographic elements. Key areas include highlights, markets, activity, performance, trends, and outlook. The layout is dense, presenting a comprehensive overview of the US IPO market in 2018.
Market Analysis and Trends
Financial Services
Provides an in-depth analysis of the US IPO market in 2018, highlighting market volatility, activity, performance, and trends. It includes detailed statistics and predictions for future trends, making it suitable for financial analysis and strategic planning.
IPO, US market, trends, performance, 2018, financial analysis
false
Market Analysis and Trends
Financial Services
Mixed Chart
EY
Add to my slides
Remove from favorites
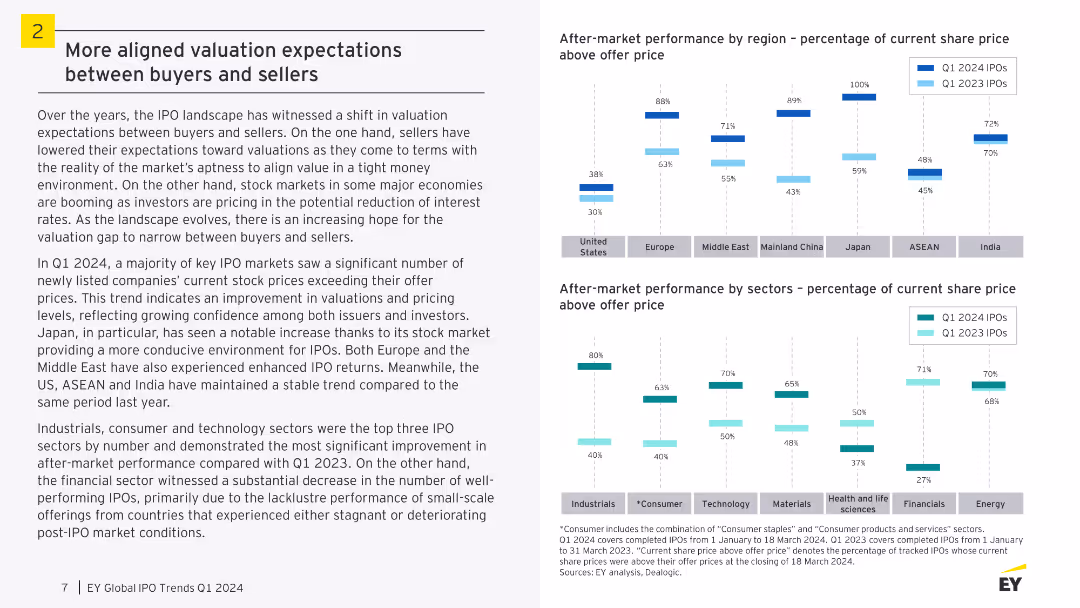
A slide with two column charts comparing after-market performance by region and sectors. The visual complexity is moderate, focusing on column charts with comparative data.
Market Analysis and Trends
Financial Services
The slide discusses the shift in valuation expectations in the IPO landscape, with improved confidence among issuers and investors. It highlights the after-market performance of IPOs in different regions and sectors, showing significant improvements in specific areas.
IPO, Valuation, Buyers, Sellers, Performance, Market
false
Market Analysis and Trends
Financial Services
Multiple Chart
EY
Add to my slides
Remove from favorites
The slide utilizes a clean layout with icons and text to discuss key factors like Equity Story and Financial Reporting in IPO processes.
Strategic Planning
Financial Services
This slide discusses the key elements that maximize value in an IPO, including equity stories, financial reporting, and the importance of internal setup and partners.
IPO, value, equity, financial reporting, partners, transparency, control
false
Strategic Planning
Financial Services
Pillar
PwC/Strategy&
Add to my slides
Remove from favorites
Features box plots comparing returns of different half-year venture-backed IPO cohorts, and a multi-line chart for EV/forward revenue multiple trends. Accompanied by textual analysis on trends and implications.
Investment Analysis
Financial Services
It evaluates the performance of venture-backed IPOs relative to established companies, signifying a trend of underperformance and potential repercussions on investment decisions.
IPO, Venture-Backed, Market Analysis, Performance
false
Investment Analysis
Financial Services
Multiple Chart
JP Morgan
Add to my slides
Remove from favorites
The slide contains a line chart tracking IPO activity and volatility from July 2021 to June 2022, with annotations highlighting key trends.
Market Analysis and Trends
Financial Services
This slide analyzes the impact of rising volatility on IPO activity, showing a correlation between increased market volatility and a decline in the number of IPOs over the specified period.
IPO, Volatility, Market trends, Financial services, Analysis
false
Market Analysis and Trends
Financial Services
Single Chart
EY
Add to my slides
Remove from favorites
The slide contains three column charts comparing IPO volumes, cash on the sidelines, and higher loan paydowns, showing changes from past averages to current levels.
Market Analysis and Trends
Financial Services
The slide indicates that key financial metrics are at cyclical lows, suggesting potential for future upside, with comparisons of IPO volumes, cash reserves, and loan paydowns.
IPO Volumes, Cash Reserves, Loan Paydowns, Financial Metrics, Cyclical Lows, Upside Potential, Column Charts, Analysis
false
Market Analysis and Trends
Financial Services
Multiple Chart
Morgan Stanley
Add to my slides
Remove from favorites
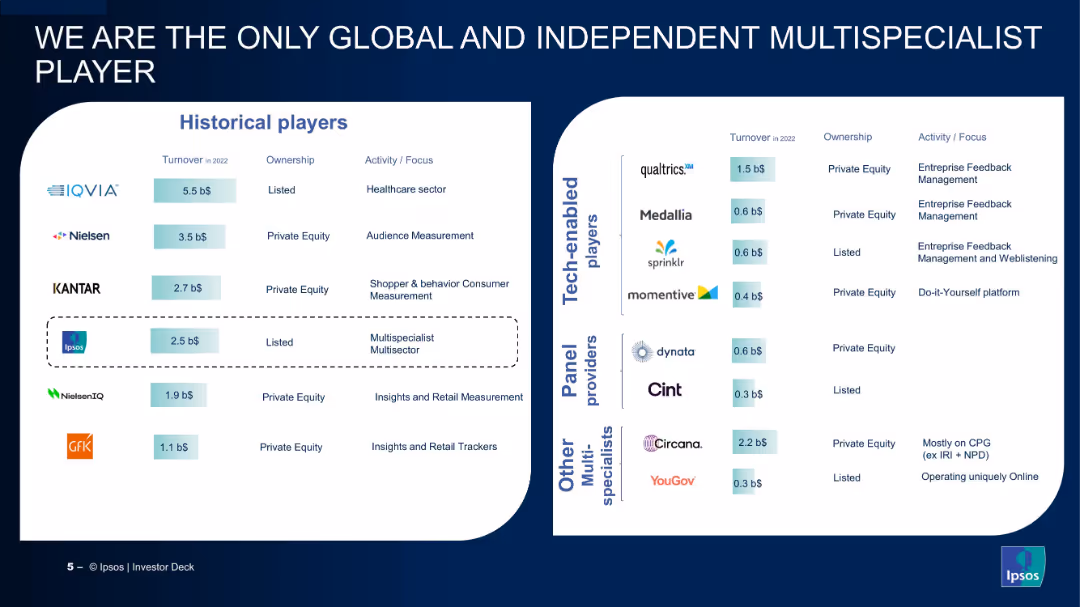
Two-section matrix comparing Ipsos with competitors based on turnover, ownership, and activity/focus.
Competitive Landscape
Professional Services
The slide compares Ipsos to its main competitors in terms of financial size and specialization. Ipsos positions itself as the only listed, global, independent multispecialist among historical and tech players.
Ipsos, competitive analysis, multispecialist, global, listed company, turnover, market positioning, competitors, tech-enabled players
false
Competitive Landscape
Professional Services
Single Chart
IPSOS
Add to my slides
Remove from favorites
The slide features a diamond-shaped diagram with AI at the center, surrounded by four quadrants labeled Social & Search Data, Consumer Needs, Expressions & Trends, Survey Data, and Digital Behavioral Data.
Market Analysis and Trends
Technology & Software
The slide outlines how IPSOS will leverage unique, high-quality data from various sources like social and search data, consumer trends, and survey data to gain a competitive advantage.
IPSOS, data, quality, AI, social, search, consumer trends, survey, behavioral, alternative
false
Market Analysis and Trends
Technology & Software
Diagram
IPSOS
Add to my slides
Remove from favorites
The slide features a column chart with data on the share of Ipsos interviews conducted offline in 2022.
Operational Efficiency
Professional Services
The slide details the percentage of Ipsos interviews conducted face-to-face or via telephone in various countries.
Ipsos, interviews, offline, 2022, countries, face-to-face, telephone
false
Operational Efficiency
Professional Services
Single Chart
IPSOS
Add to my slides
Remove from favorites
The slide features an introductory layout with company highlights, market presence, and key figures.
Strategic Planning
Professional Services
The slide introduces Ipsos, highlighting its market position, employee count, client base, and 2023 turnover.
Ipsos, Market Research, Industry, Leadership, Turnover
false
Strategic Planning
Professional Services
Boxed
IPSOS
Add to my slides
Remove from favorites
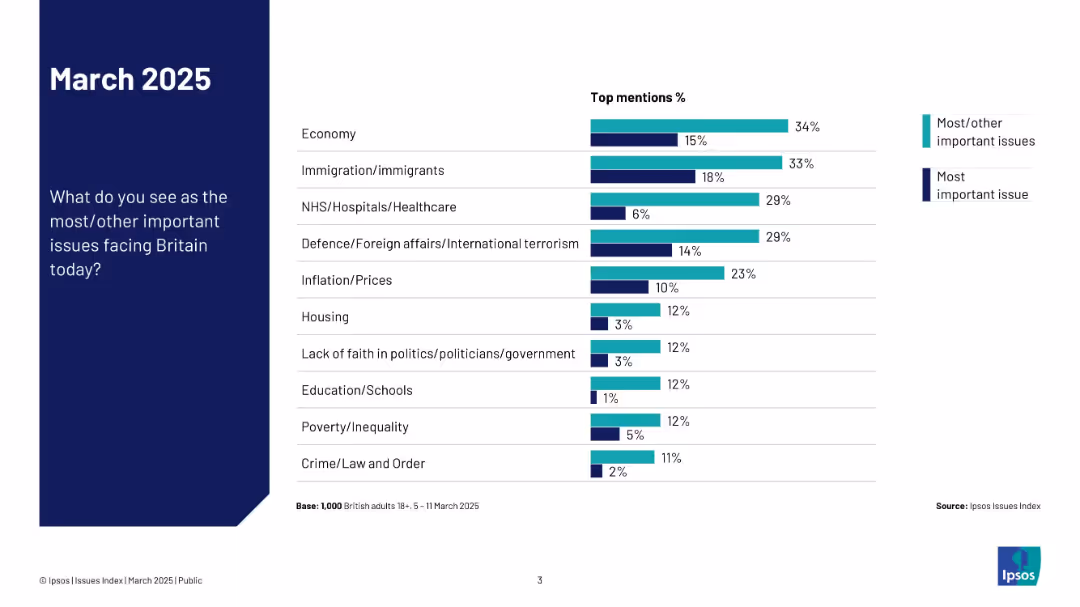
Left-aligned title and question text on a navy-blue background; right side contains a horizontal bar chart comparing "Most important issue" vs "Most/other".
Market Analysis and Trends
Government & Public Sector
This slide presents survey results on what British adults see as the most or other important issues facing the UK in March 2025. The economy, immigration, and healthcare top the list.
Ipsos, public opinion, UK, March 2025, economy, immigration, healthcare, issues, survey, bar chart
false
Market Analysis and Trends
Government & Public Sector
Mixed Chart
IPSOS
Add to my slides
Remove from favorites
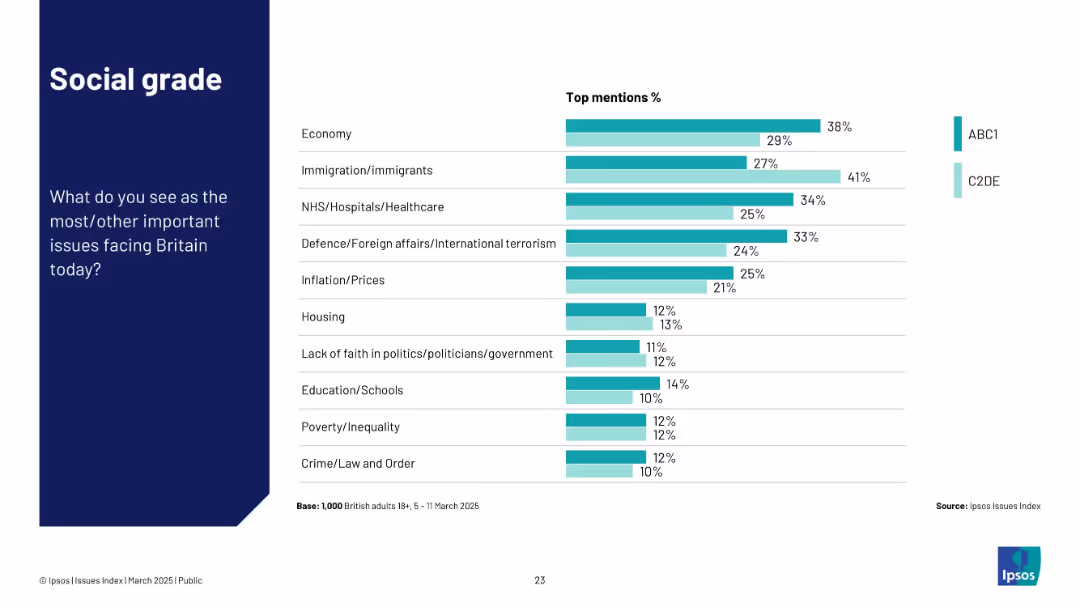
Split screen layout with dark blue left panel showing the question, and right side with bar chart data. Two color-coded bars compare responses from ABC1 and C2DE groups.
Customer and Market Segmentation
Government & Public Sector
Compares perceived national issues in Britain by social grade. Economy, healthcare, immigration, and inflation are highlighted. ABC1 and C2DE groups diverge most in NHS and immigration concerns.
Ipsos, social class, issues, Britain, ABC1, C2DE, economy, healthcare, immigration
false
Customer and Market Segmentation
Government & Public Sector
Mixed Chart
IPSOS
Add to my slides
Remove from favorites
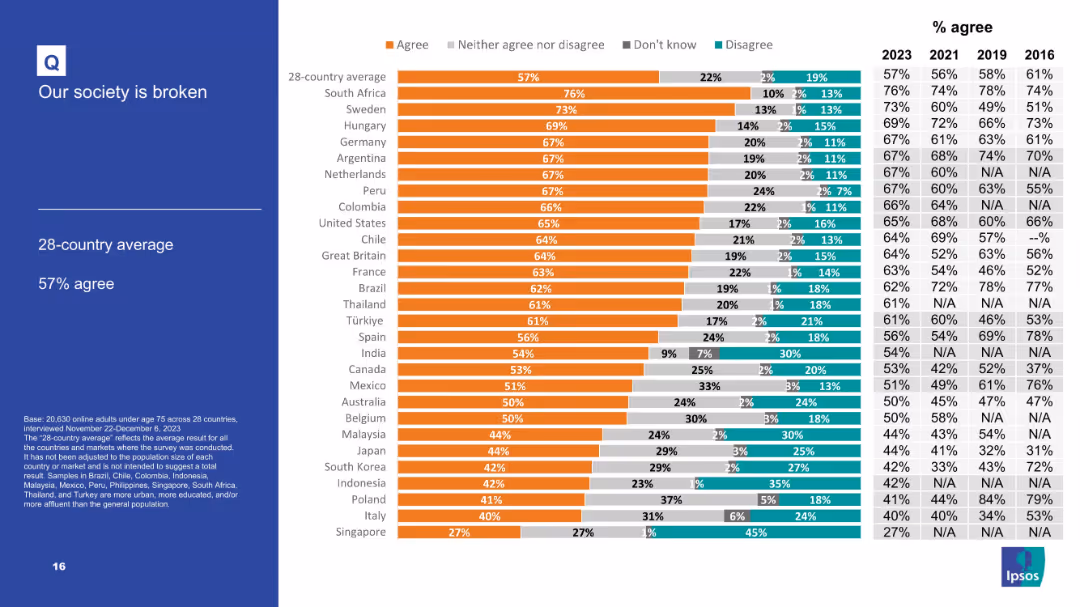
Horizontal stacked bar chart showing four response categories per country; data compared for 28 countries.
Market Analysis and Trends
Government & Public Sector
The slide displays the extent to which people in 28 countries agree, disagree, or are neutral about whether their society is broken. South Africa and Sweden show highest agreement, while Singapore shows the lowest.
Ipsos survey, global discontent, political sentiment, system failure, bar chart, public opinion, international comparison
false
Market Analysis and Trends
Government & Public Sector
Mixed Chart
IPSOS
Add to my slides
Remove from favorites
The slide has a title, bar charts, and a text table. It is color-coded in purple, red, and green to represent different sectors of the battery value chain.
Market Analysis and Trends
Energy & Utilities
This slide discusses the impact of the Inflation Reduction Act (IRA) on Australia's battery industry, analyzing opportunities in mining and challenges in manufacturing.
IRA, Australia, mining, manufacturing, subsidies
false
Market Analysis and Trends
Energy & Utilities
Mixed Chart
Accenture
Add to my slides
Remove from favorites
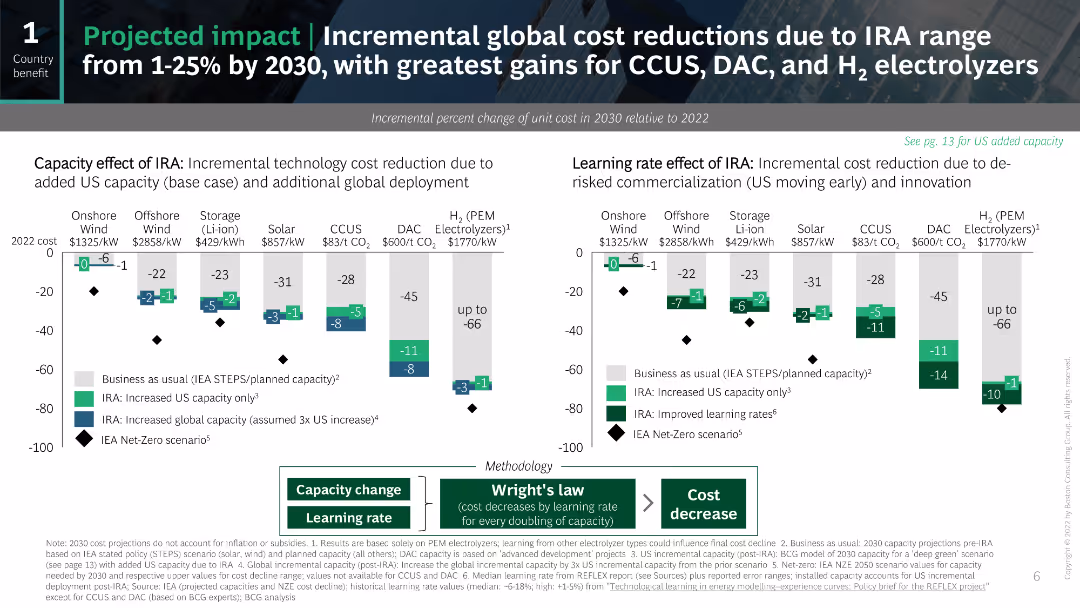
The slide features a series of column charts to show the incremental cost reductions and learning rate effects due to the IRA.
Market Analysis and Trends
Energy & Utilities
The slide projects cost reductions for various technologies due to the IRA and explains the methodology behind these projections.
IRA, cost reductions, projections, learning rate, technology
false
Market Analysis and Trends
Energy & Utilities
Multiple Chart
BCG
Add to my slides
Remove from favorites
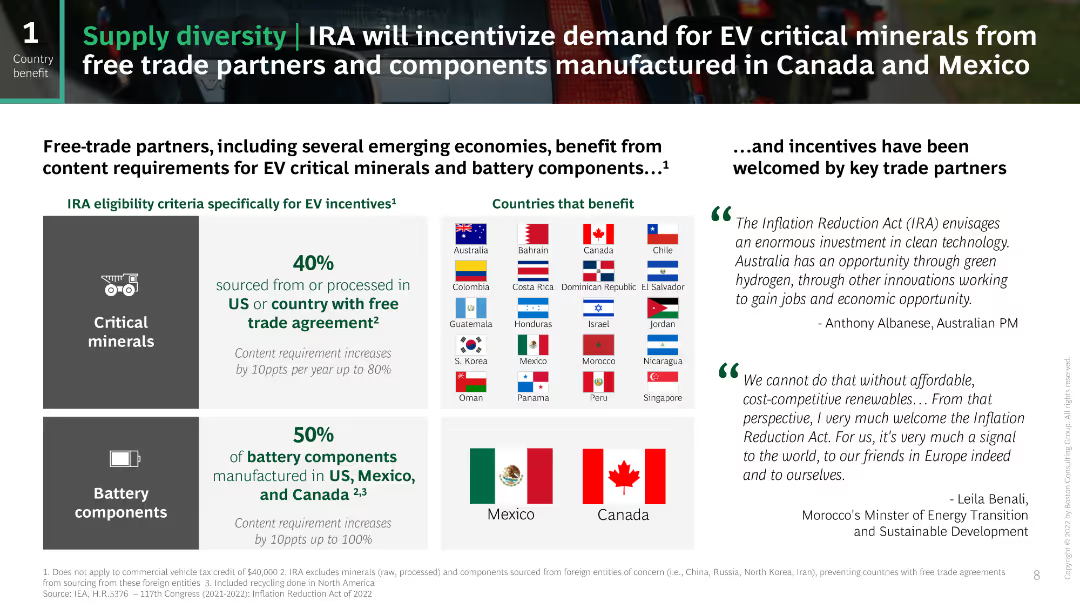
This slide features a two-column layout with text on the left and flags and quotes on the right. The left column has large icons and bullet points, while the right side shows country flags and quotes from international leaders. The design is clean and uses green highlights to emphasize key points.
Strategic Planning
Energy & Utilities
The slide discusses how the Inflation Reduction Act (IRA) incentivizes the use of EV critical minerals and battery components from countries with free trade agreements, highlighting the potential benefits for Canada and Mexico and including quotes from global leaders.
IRA, EV, critical minerals, battery components, trade
false
Strategic Planning
Energy & Utilities
Header Horizontal
BCG
Add to my slides
Remove from favorites
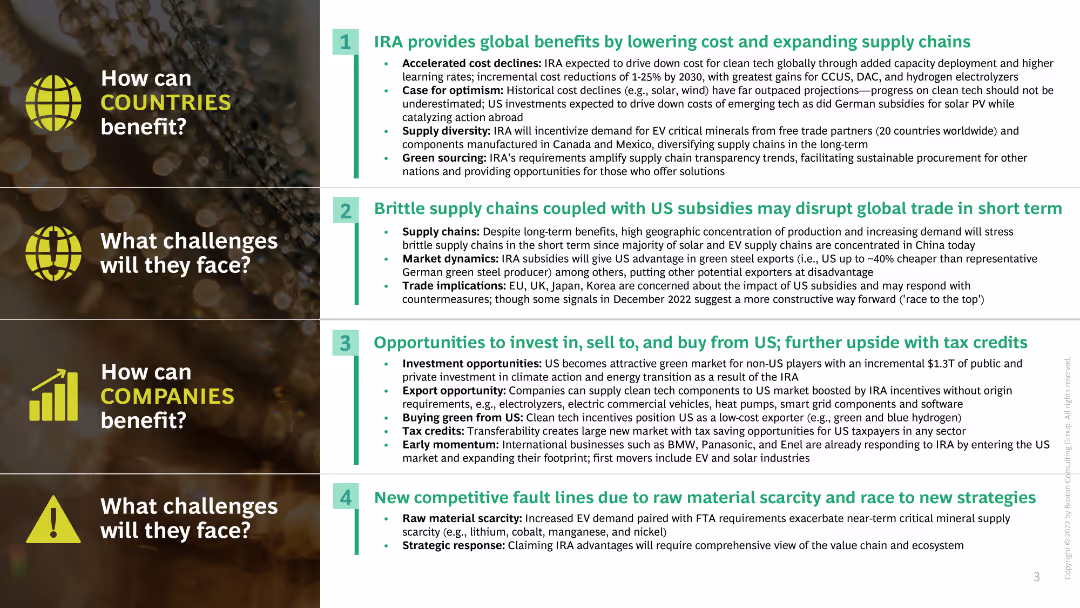
The slide uses a two-column layout with text and numbered lists detailing benefits and challenges for countries and companies.
Strategic Planning
Energy & Utilities
The slide discusses the global benefits of the Inflation Reduction Act (IRA) and potential challenges for countries and companies.
IRA, global benefits, challenges, countries, companies
false
Strategic Planning
Energy & Utilities
Header Vertical
BCG
Add to my slides
Remove from favorites
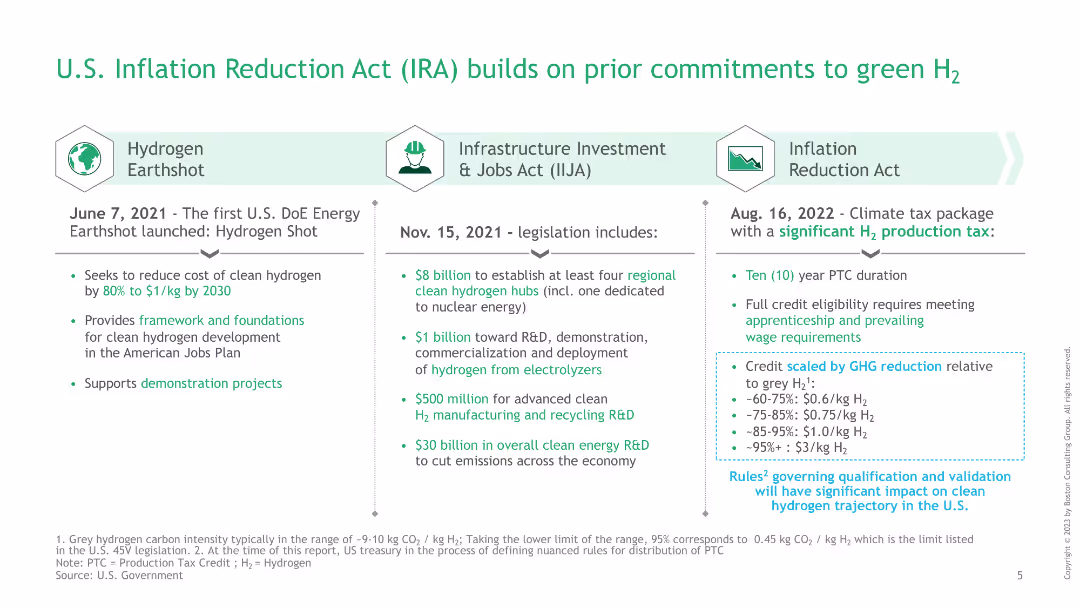
The slide is structured into three columns, each detailing different legislation acts and their contributions to green hydrogen initiatives, with bullet points.
Regulatory and Compliance
Government & Public Sector
This slide details the commitments of the U.S. government to green hydrogen through various acts, including the Hydrogen Earthshot, Infrastructure Investment and Jobs Act, and the Inflation Reduction Act, highlighting financial and policy support.
IRA, green hydrogen, legislation, infrastructure investment, Inflation Reduction Act
false
Regulatory and Compliance
Government & Public Sector
Table
BCG
Add to my slides
Remove from favorites
Block diagram showing U.S. IRA investment allocation and examples of SEA companies investing in the U.S.; includes a cost reduction chart for hydrogen pre- and post-IRA.
Strategic Planning
Financial Services
Highlights the effectiveness of the U.S. Inflation Reduction Act in accelerating clean energy investment, including from SEA firms. Discusses public investment split and specific SEA companies establishing operations in the U.S. Demonstrates how IRA incentives reduce the cost of green hydrogen, making emerging technologies more viable.
IRA, green investment, SEA companies, hydrogen cost, incentives, manufacturing, policy, clean energy
false
Strategic Planning
Financial Services
Mixed Chart
Bain
Add to my slides
Remove from favorites
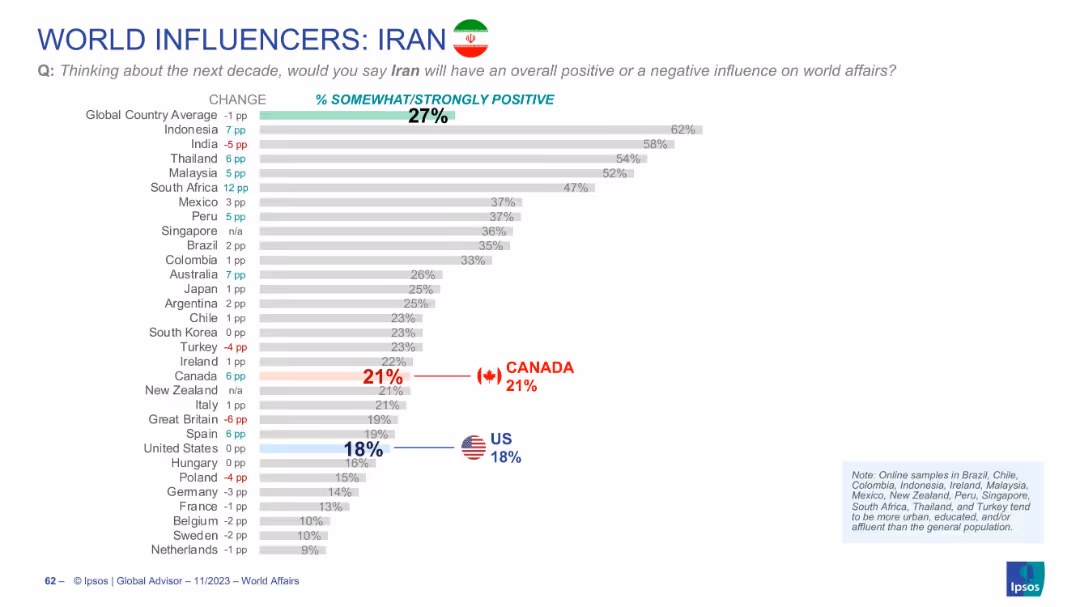
Bar chart displaying global perception of Iran’s influence, with flags highlighting US and Canada views and % changes.
Market Analysis and Trends
Government & Public Sector
Global perception of Iran’s influence is low (27% on average). Indonesia shows the highest approval, while the US (18%) and Canada (21%) are significantly below average.
Iran, global influence, international perception, Ipsos data, world affairs, rankings
false
Market Analysis and Trends
Government & Public Sector
Single Chart
IPSOS
Add to my slides
Remove from favorites
Similar layout to 18861; left-aligned title and question box, right-aligned bar chart with rankings and year-over-year change in positive perception of Iran.
Market Analysis and Trends
Government & Public Sector
This slide presents public sentiment about Iran’s influence on global affairs over the next decade. Results from 30 countries show a generally negative perception with visual emphasis on declining support across regions.
Iran, global influence, public opinion, perception change, survey, geopolitical, Ipsos, world affairs, rankings, sentiment
false
Market Analysis and Trends
Government & Public Sector
Mixed Chart
IPSOS
Add to my slides
Remove from favorites
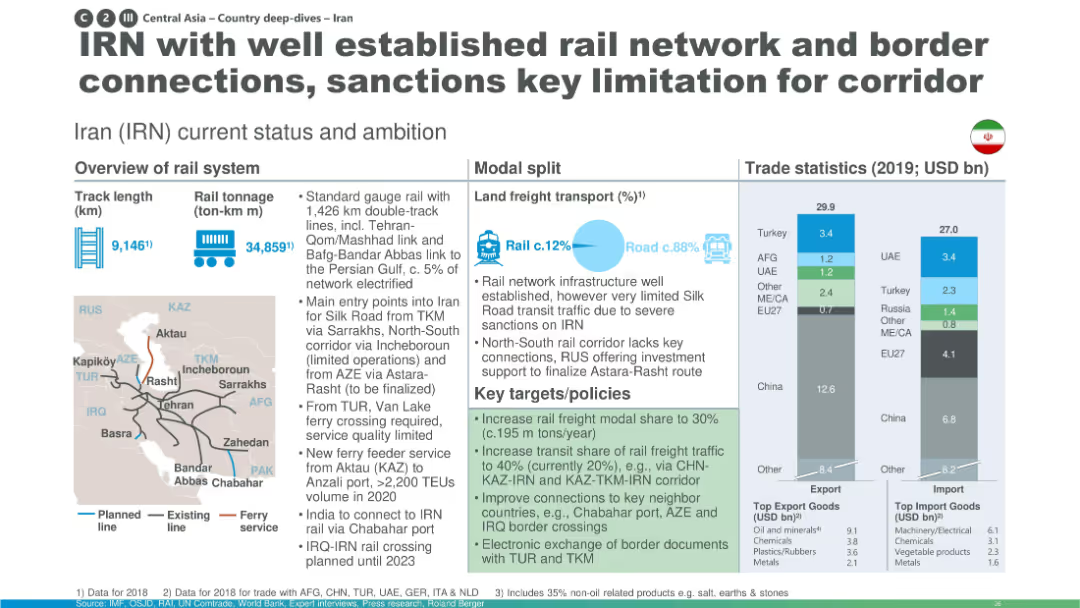
Structured with maps, transport data, and rail policies; emphasizes sanctions as a major limiting factor.
Industry Overview
Transportation & Logistics
Iran’s established rail system is highlighted, especially its border links and long track network. However, international sanctions restrict corridor utilization. Future goals include modernization, improved connections, and increased modal share.
Iran, sanctions, rail network, modal share, trade, Silk Road, freight corridors
false
Industry Overview
Transportation & Logistics
Multiple Chart
Roland Berger
Add to my slides
Remove from favorites
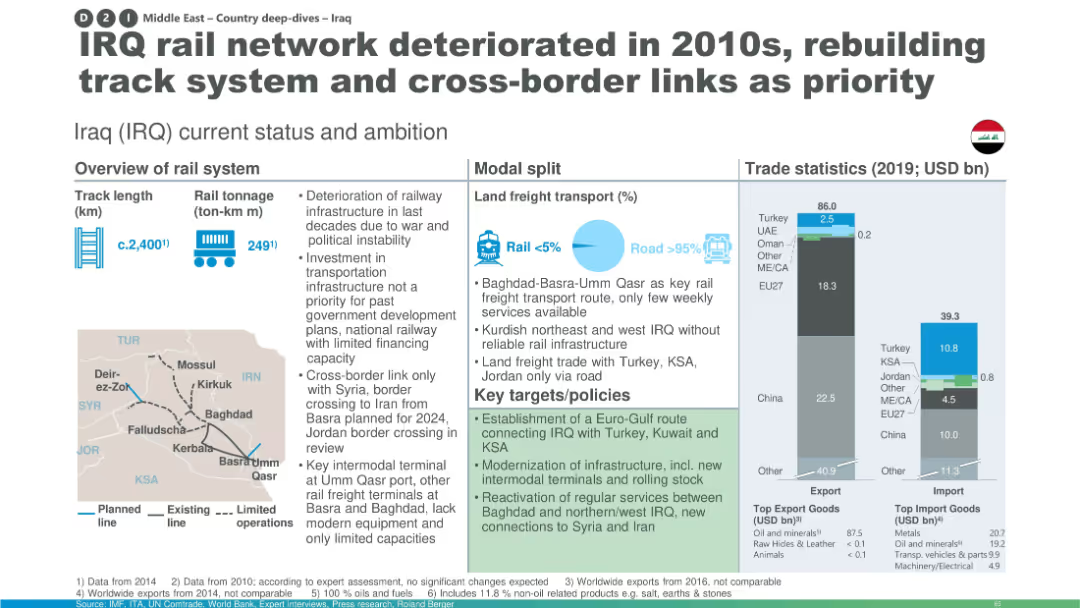
Layout with overview stats, modal split graphic, trade bar charts, and a small Iraq map showing rail routes; includes policy targets.
Strategic Planning
Transportation & Logistics
This slide presents Iraq’s rail system status, showing a small modal share for rail in freight transport and deteriorated infrastructure. It highlights key policies for modernization, expansion, and intermodal development, supported by trade data and network maps.
Iraq rail, infrastructure deterioration, modal split, trade statistics, policy targets, track rebuilding, intermodal terminals, cross-border links
false
Strategic Planning
Transportation & Logistics
Multiple Chart
Roland Berger
Add to my slides
Remove from favorites
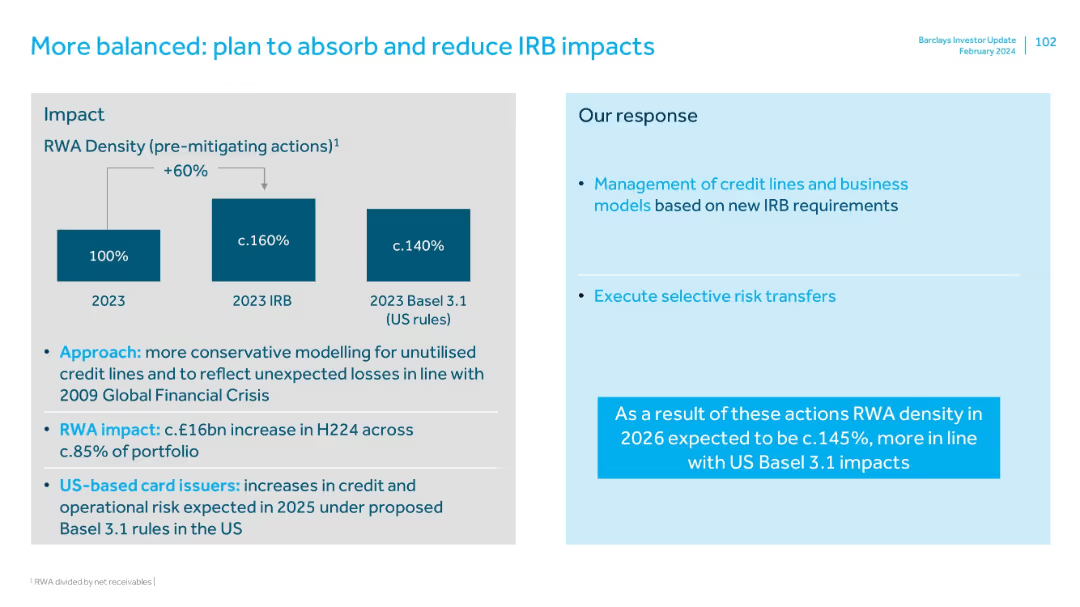
Two-panel layout: impact on left with bar graphics; response strategy on right. Blue text highlights key actions.
Regulatory and Compliance
Financial Services
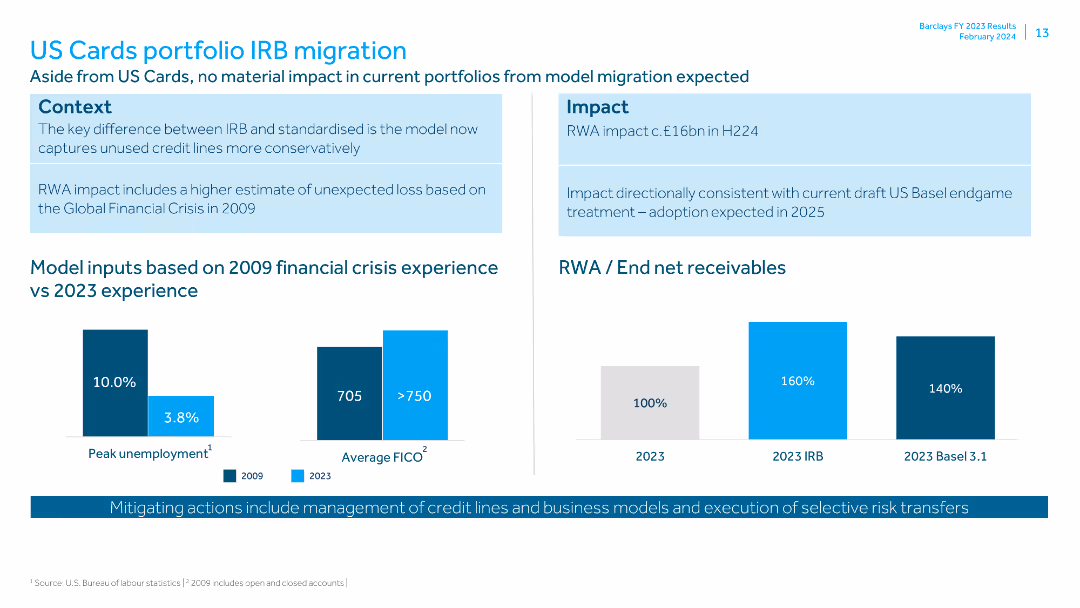
Explains the impact of new IRB rules and Basel 3.1 on risk-weighted assets. Barclays plans to reduce RWA density through credit line management and selective risk transfers, aiming to align with US regulatory expectations by 2026.
IRB, Basel 3.1, regulatory impact, RWA, risk mitigation, compliance strategy
false
Regulatory and Compliance
Financial Services
Mixed Chart
Barclays
Add to my slides
Remove from favorites
Contains bar charts comparing model inputs from 2009 financial crisis vs 2023, and data on RWA and end net receivables. Context and impact boxes are included.
Risk Assessment and Management
Financial Services
Discusses the impact of IRB migration on the US Cards portfolio, comparing past and current financial conditions. It details the RWA impact and mitigating actions.
IRB migration, US Cards, financial crisis, RWA, receivables, peak unemployment, FICO, liquidity pool, credit lines, risk transfer
false
Risk Assessment and Management
Financial Services
Multiple Chart
Barclays
Add to my slides
Remove from favorites
This slide presents a comparison of IRB and standardized models through column charts, focusing on RWA and net receivables.
Risk Assessment and Management
Financial Services
Analyzes the impact of migrating US Cards portfolio to IRB models on RWAs, comparing historical data and future expectations.
IRB, US Cards, RWA, risk management, migration
false
Risk Assessment and Management
Financial Services
Multiple Chart
Barclays
Add to my slides
Remove from favorites
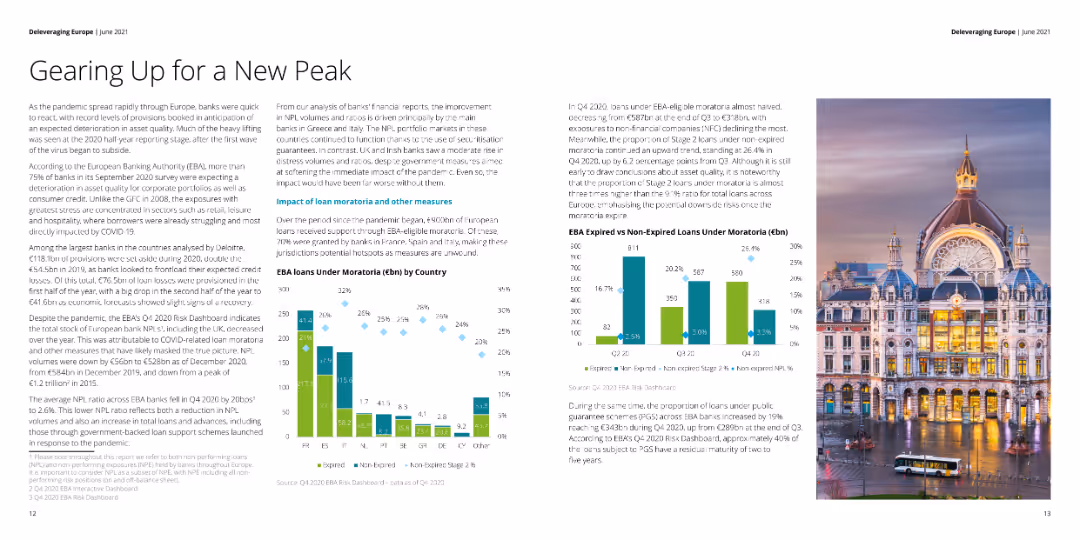
Column charts displaying NPL volumes, loan provisions by type, and Stage 2 loans for top Irish banks.
Risk Assessment and Management
Financial Services
Reviews the NPL volumes and provisions of leading Irish banks, examining risk mitigation strategies and trends.
Ireland, banks, NPL, risk, management
false
Risk Assessment and Management
Financial Services
Multiple Chart
Deloitte
Add to my slides
Remove from favorites
Horizontally segmented white-background slide with 5 columns, each showing a recommendation category with icon, header, and paragraph.
Strategic Planning
Financial Services
EY provides strategic recommendations for advancing Ireland’s Financial Services sector across five pillars: innovation, regulation, trade, labor, and macroeconomics. Each pillar includes specific policy suggestions to boost global competitiveness.
Ireland, EY, recommendations, financial services, innovation, labor, policy, regulation
false
Strategic Planning
Financial Services
Pillar
EY
Add to my slides
Remove from favorites
Left-aligned layout with title and narrative text at the top-left, a bar chart comparison occupying the center, and a full scenic image on the right side. Clear use of flags and rank indicators in the chart.
Industry Overview
Financial Services
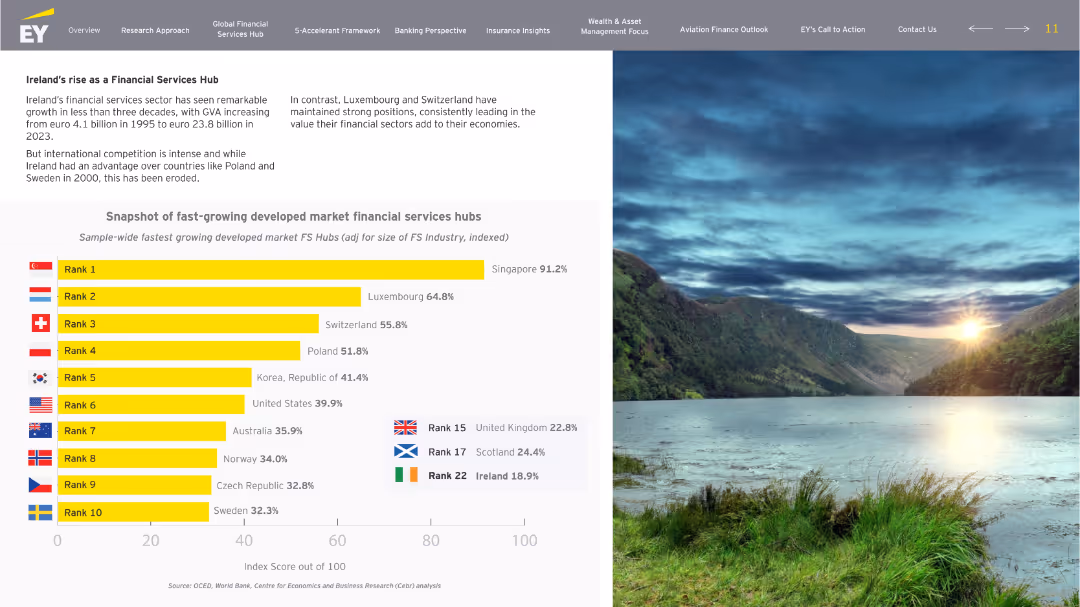
This slide highlights the growth trajectory of Ireland’s financial services sector, comparing it to other developed market financial hubs. It notes Ireland’s early advantage and how other countries like Singapore, Luxembourg, and Switzerland have emerged as leaders. A chart ranks countries based on the indexed size-adjusted FS growth.
Ireland, financial services, growth, rankings, GVA, competition, hubs
false
Industry Overview
Financial Services
Single Chart
EY
Add to my slides
Remove from favorites
Left side outlines drivers of fintech growth; chart shows investment trend; quote column in purple; regional layout consistent with others.
Market Analysis and Trends
Financial Services
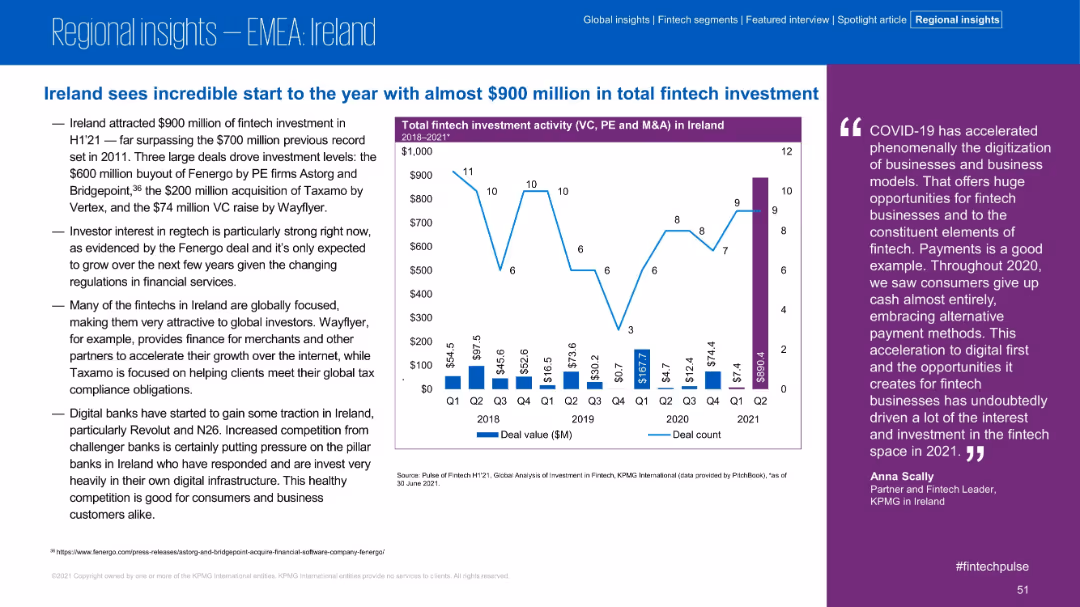
Ireland reached nearly $900M in fintech investment in H1 2021, driven by major M&A and VC deals. Interest in regtech and digital banks is growing, making Ireland an attractive destination for global investors.
Ireland, Fintech, VC, Regtech, Investment, H1 2021, Digital Banking, Global Investors
false
Market Analysis and Trends
Financial Services
Mixed Chart
KPMG
Add to my slides
Remove from favorites
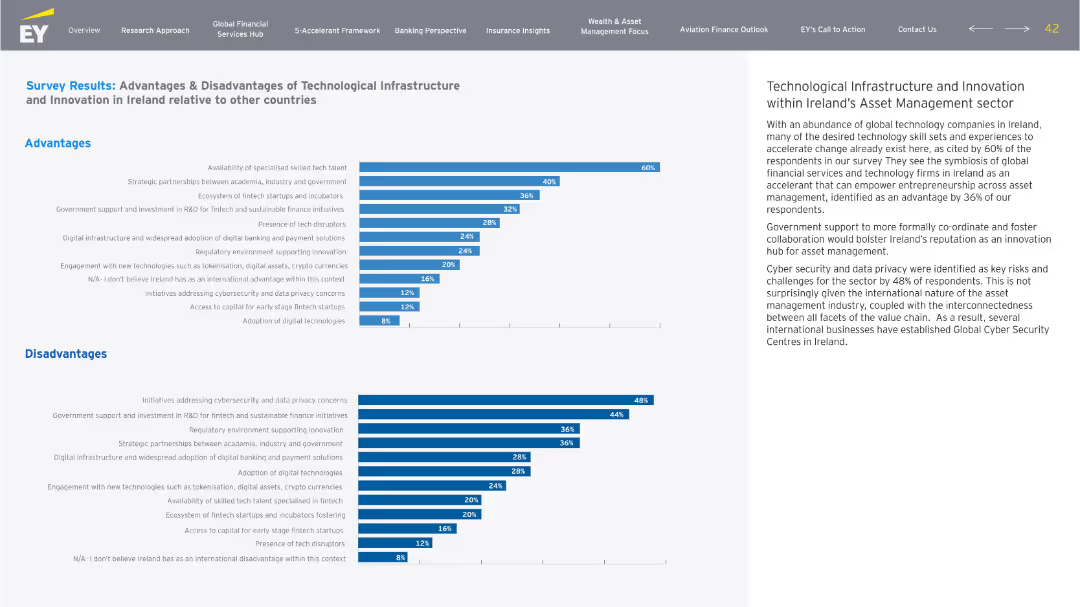
Two horizontal bar charts (Advantages and Disadvantages) on left, descriptive text on right. Blue and grey tones, structured data layout, EY branding.
Market Analysis and Trends
Financial Services
The slide compares perceived advantages and disadvantages of Ireland’s technological infrastructure for asset management, highlighting strengths like skilled talent and innovation, and weaknesses in cybersecurity and data privacy.
Ireland, tech infrastructure, asset management, advantages, disadvantages, innovation
false
Market Analysis and Trends
Financial Services
Multiple Chart
EY
Add to my slides
Remove from favorites
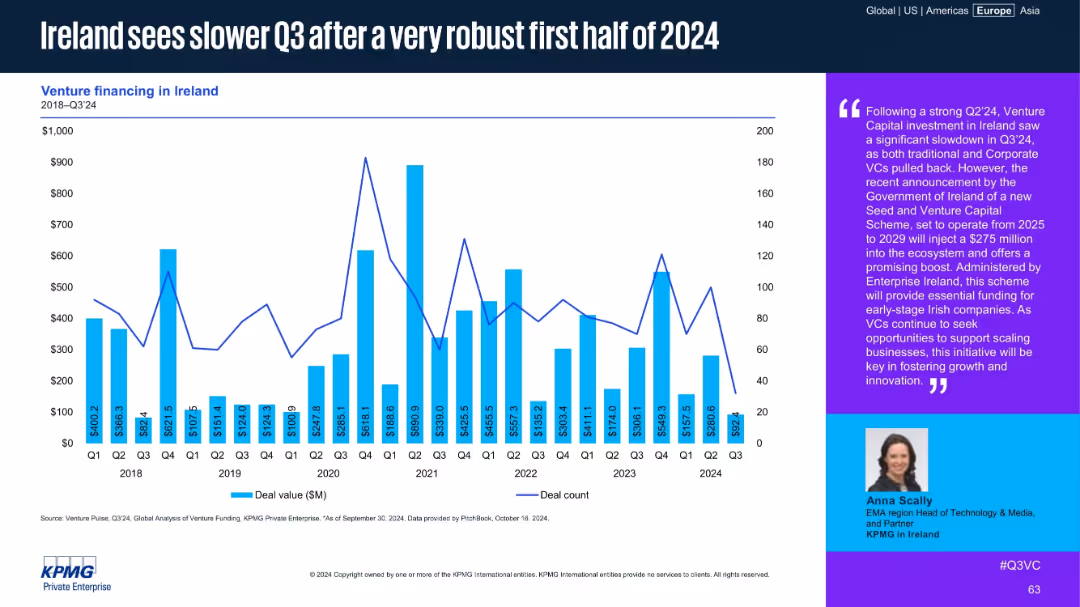
Bar and line chart of Irish venture financing from 2018 to Q3 2024, with a large text box commentary on the right. Highlights major ups and downs, with emphasis on Q2 and Q3 2024.
Market Analysis and Trends
Financial Services
After a strong first half in 2024, Ireland's VC market declined in Q3. Commentary discusses VC pullback and a new government scheme injecting $275M between 2025-2029 to support early-stage startups through Enterprise Ireland.
Ireland, venture capital, Q3 2024, government funding, Enterprise Ireland, early-stage, capital slowdown, investment trends
false
Market Analysis and Trends
Financial Services
Mixed Chart
KPMG
Add to my slides
Remove from favorites
Slide combines text with iconography illustrating various banking sectors. The visual complexity is moderate with a clear pathway graphic showing different stages of banking services.
Investment Analysis
Financial Services
Focuses on the potential for incremental revenue through Integrated Relationship Management (IRM), likely used to outline revenue growth strategies or in financial service innovation discussions.
IRM, revenue growth, banking sectors, financial services, strategy
false
Investment Analysis
Financial Services
Linear Flow
Goldman Sachs
Add to my slides
Remove from favorites
Includes a line chart detailing the historical and projected demand drivers for iron ore, marked against steel and scrap consumption.
Market Analysis and Trends
Industrial & Manufacturing
The slide analyzes the past and future challenges of the iron ore industry, highlighting the influence of steel demand and scrap consumption on iron ore demand.
iron ore, challenges, steel demand, scrap consumption, line chart
false
Market Analysis and Trends
Industrial & Manufacturing
Multiple Chart
McKinsey
Add to my slides
Remove from favorites
Features a line chart tracking seaborne cash costs against pricing margins over time, with detailed annotations and a timeline from 2012 to 2018.
Financial Performance
Industrial & Manufacturing
This slide examines the cost dynamics within the iron ore industry, focusing on seaborne cash costs and their relationship to pricing margins over several years.
iron ore, cost analysis, cash costs, pricing margins, line chart
false
Financial Performance
Industrial & Manufacturing
Single Chart
McKinsey
Add to my slides
Remove from favorites
The slide features two charts: a line chart on the left showing iron ore price over time, and a line chart on the right showing China steel production in millions of tons per annum.
Market Analysis and Trends
Industrial & Manufacturing
It provides data on iron ore prices and China steel production, useful for analyzing trends and making informed decisions in the industrial and manufacturing sector.
iron ore, price, China, steel production, industrial
false
Market Analysis and Trends
Industrial & Manufacturing
Multiple Chart
JP Morgan
Add to my slides
Remove from favorites
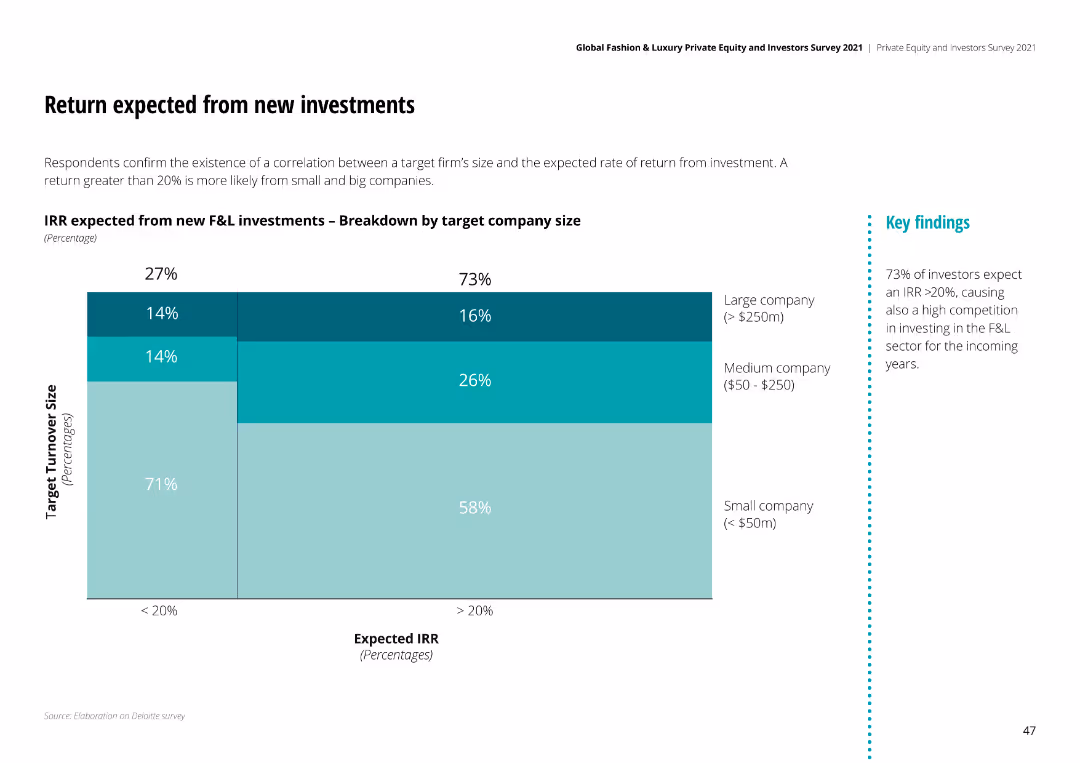
The slide includes a stacked column chart showing IRR expected from new F&L investments, categorized by target company size. Key findings are highlighted.
Investment Analysis
Financial Services
This slide discusses the expected returns from new investments in F&L, detailing the correlation between firm size and expected IRR.
IRR, investment, F&L, returns, company size
false
Investment Analysis
Financial Services
Mixed Chart
Deloitte
Add to my slides
Remove from favorites
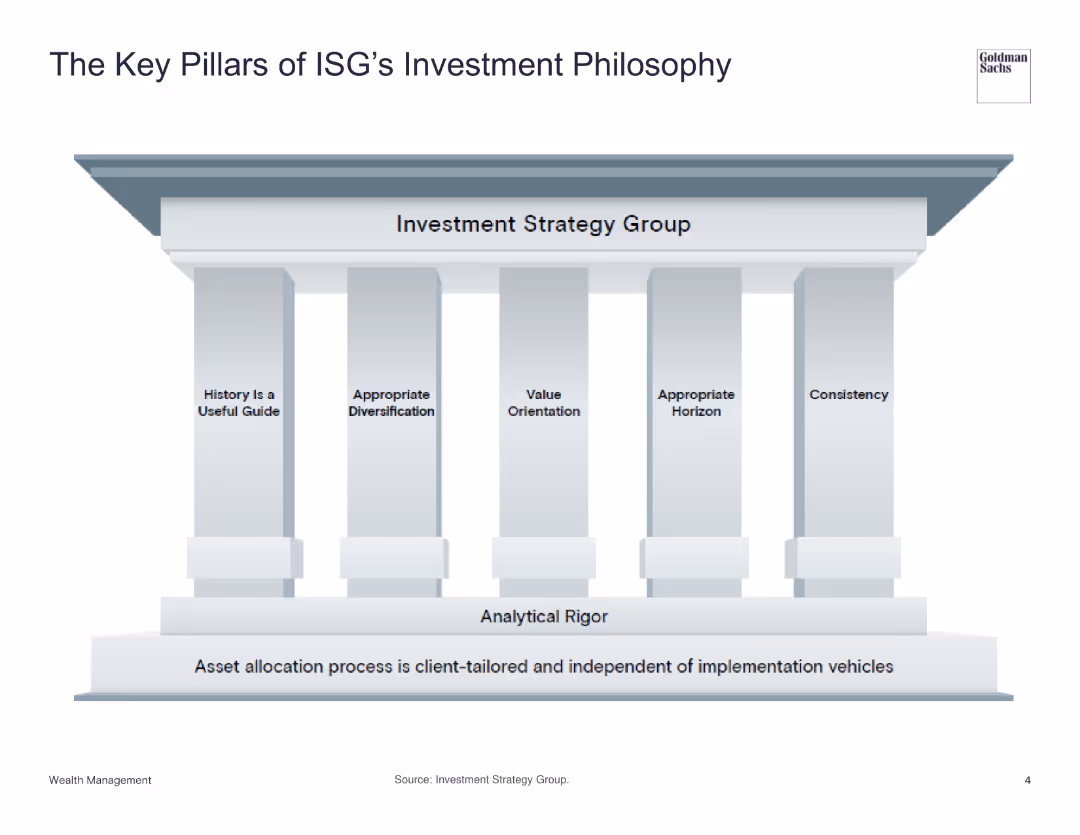
The slide features a graphic of a building with pillars representing different aspects of ISG's investment philosophy, highlighting core values.
Strategic Planning
Financial Services
The slide presents the key pillars of ISG's investment philosophy: History, Appropriate Diversification, Value Orientation, Appropriate Horizon, and Consistency, underpinning a rigorous analytical approach.
ISG, Investment Philosophy, Diversification, Value, Strategy
false
Strategic Planning
Financial Services
Pillar
Goldman Sachs
Add to my slides
Remove from favorites
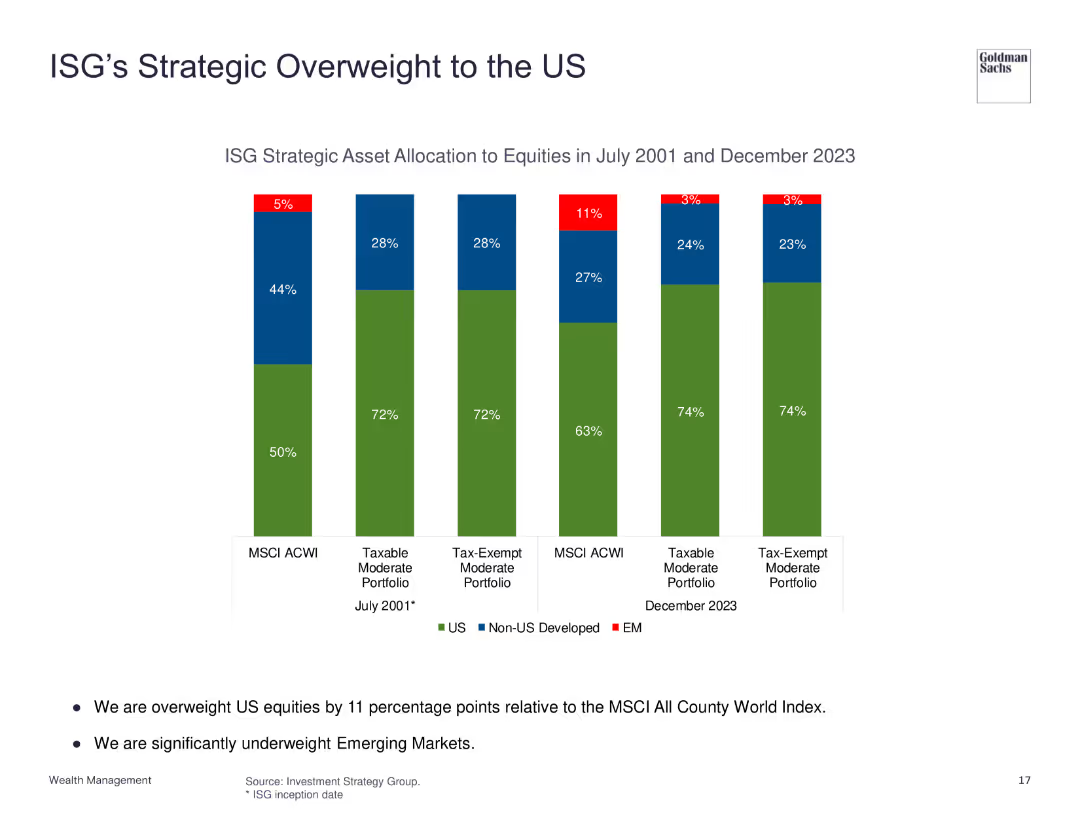
The slide shows column charts comparing ISG's asset allocation to equities in 2001 and 2023, highlighting an increased overweight to US equities.
Strategic Planning
Financial Services
The slide illustrates ISG's strategic decision to overweight US equities, showing the changes in asset allocation over time and the focus on US market investments compared to non-US developed and emerging markets.
ISG, Strategy, Asset Allocation, US Equities, Overweight
false
Strategic Planning
Financial Services
Single Chart
Goldman Sachs
Add to my slides
Remove from favorites
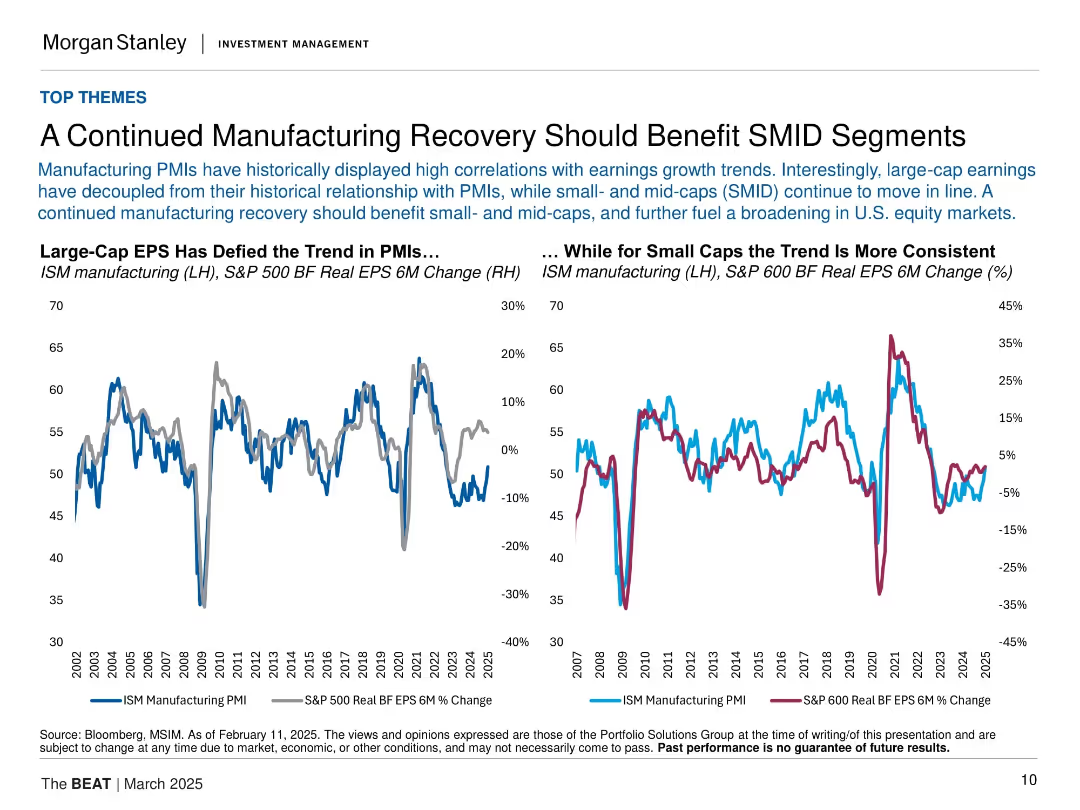
Dual line charts: left compares ISM PMI to S&P 500 EPS; right compares ISM PMI to S&P 600 EPS. Clean and parallel design structure.
Performance Metrics and KPIs
Industrial & Manufacturing
Suggests that small- and mid-cap earnings are still closely tracking manufacturing trends, unlike large-cap EPS which have decoupled. Argues for broader equity participation and growth in SMID segments as manufacturing recovers.
ISM PMI, EPS growth, S&P 500, S&P 600, small-cap, mid-cap, manufacturing, equities
false
Performance Metrics and KPIs
Industrial & Manufacturing
Multiple Chart
Morgan Stanley
Add to my slides
Remove from favorites
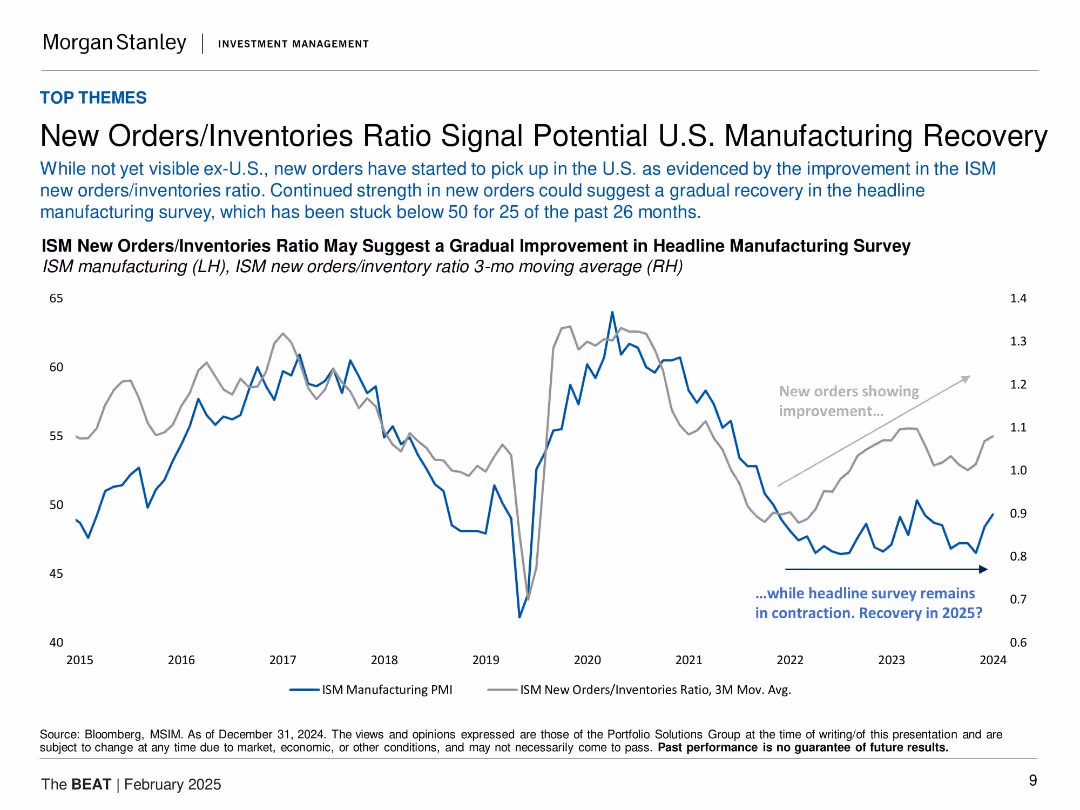
Dual-axis line chart comparing ISM Manufacturing PMI and new orders/inventories ratio from 2015–2024. Gray annotation indicating trend shift.
Performance Metrics and KPIs
Industrial & Manufacturing
The slide presents evidence of an early U.S. manufacturing recovery through rising new orders relative to inventories, despite the ISM headline manufacturing survey remaining below 50. It suggests cautious optimism for a recovery in 2025, with visual trends showing divergence between new orders and PMI metrics over time.
ISM PMI, new orders, inventories, U.S. manufacturing, recovery, economic signal, KPIs, factory output
false
Performance Metrics and KPIs
Industrial & Manufacturing
Single Chart
Morgan Stanley
Add to my slides
Remove from favorites
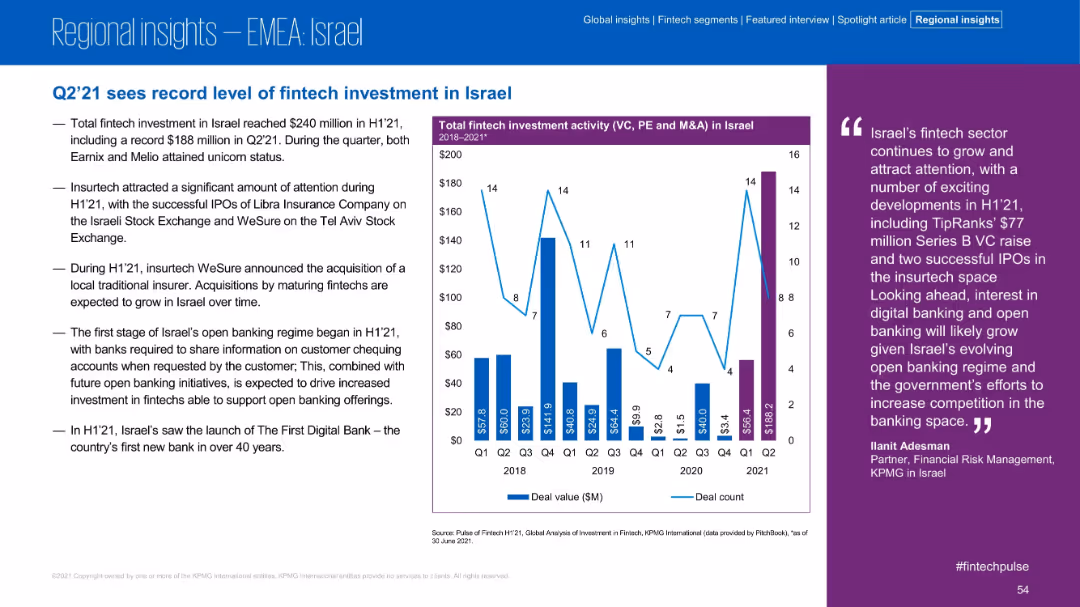
Standard layout format; chart center-right shows quarterly trends; purple quote box on far right. Blue-purple theme.
Market Analysis and Trends
Financial Services
Israel’s fintech sector reached a record $240M investment in H1 2021. The slide features key events including unicorns, IPOs, and the launch of the country’s first new bank in 40 years, all amid regulatory changes in open banking.
Israel, Fintech, VC, Unicorns, IPOs, Open Banking, Regulation, H1 2021
false
Market Analysis and Trends
Financial Services
Mixed Chart
KPMG
Add to my slides
Remove from favorites
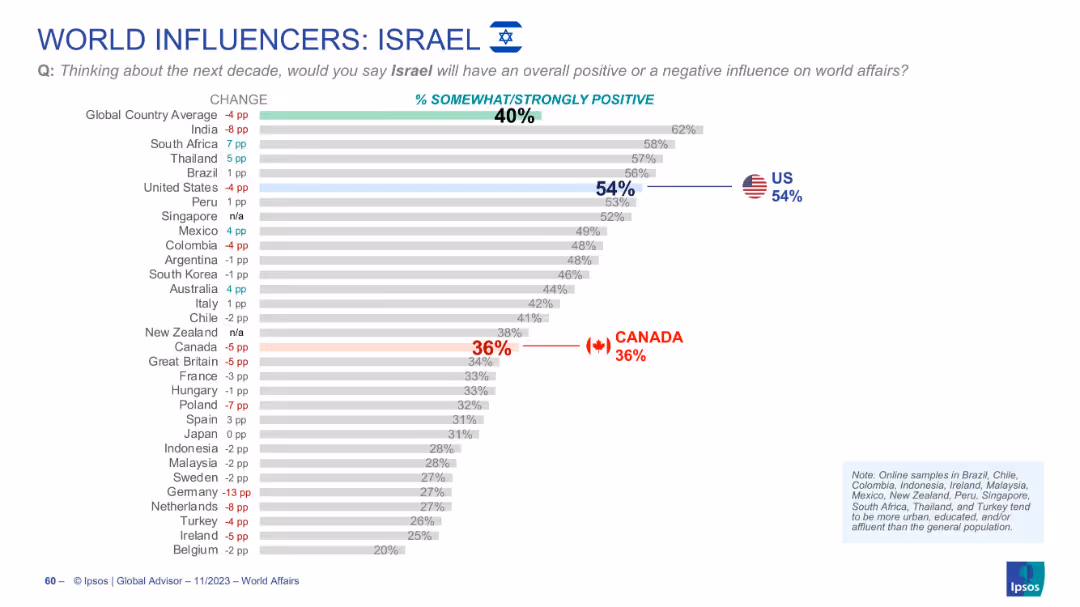
Horizontal bar chart displaying international sentiment toward Israel, with indicators for percent change and key flags.
Market Analysis and Trends
Government & Public Sector
The chart reveals varied opinions about Israel’s global influence, averaging 40% positive. South Africa and the US have relatively high opinions, while Canada and European countries tend to score lower than average.
Israel, global affairs, sentiment, world opinion, influence perception, Ipsos, comparative rankings
false
Market Analysis and Trends
Government & Public Sector
Single Chart
IPSOS
Add to my slides
Remove from favorites
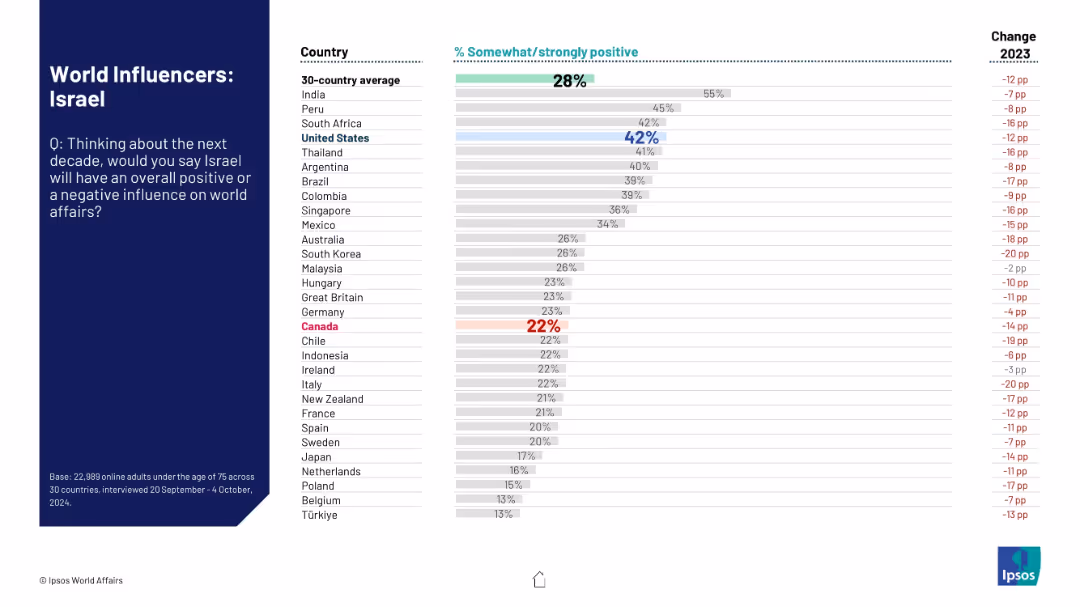
Classic Ipsos layout: left section with context and question, right side bar chart detailing perception data.
Market Analysis and Trends
Government & Public Sector
The slide reveals low and declining global approval of Israel’s influence over the next decade. It includes a comparison across 30 countries, most of which report significant decreases in positive sentiment since 2023.
Israel, global perception, Ipsos, international opinion, influence trends, country comparison, sentiment change, 2024, survey data
false
Market Analysis and Trends
Government & Public Sector
Mixed Chart
IPSOS
Add to my slides
Remove from favorites
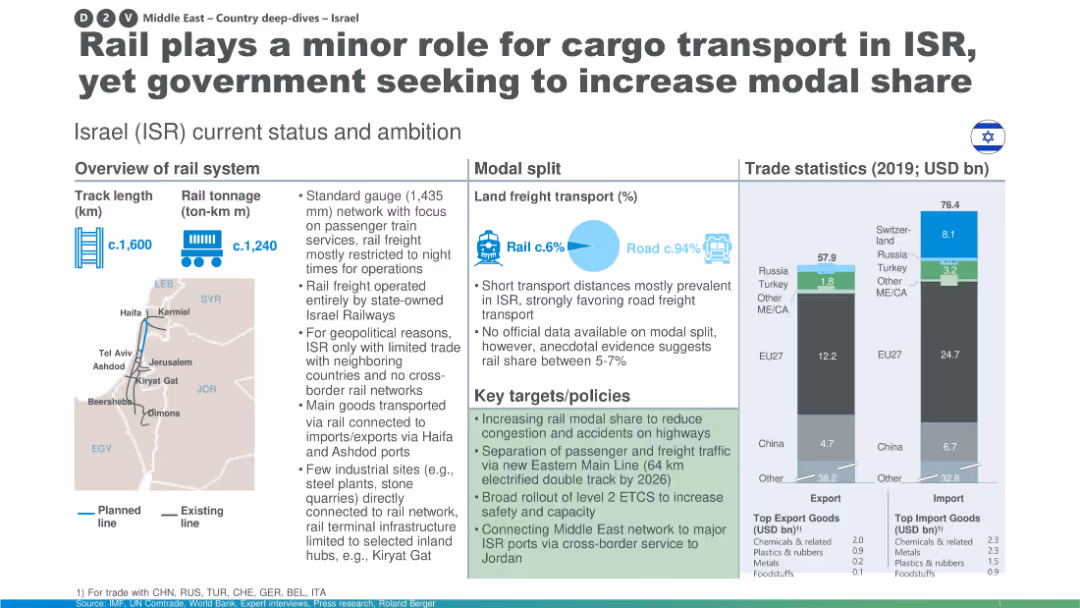
Map, modal split, rail system stats, and trade data with a focus on policy goals to enhance rail’s cargo role.
Strategic Planning
Transportation & Logistics
Israel’s rail system is underutilized for freight due to short distances and geopolitical constraints. The slide highlights modest rail modal share and lists initiatives to separate freight/passenger traffic and expand network connections, including a cross-border link with Jordan.
Israel rail, modal share, freight network, policy reform, passenger separation, infrastructure development, trade links
false
Strategic Planning
Transportation & Logistics
Multiple Chart
Roland Berger
Add to my slides
Remove from favorites
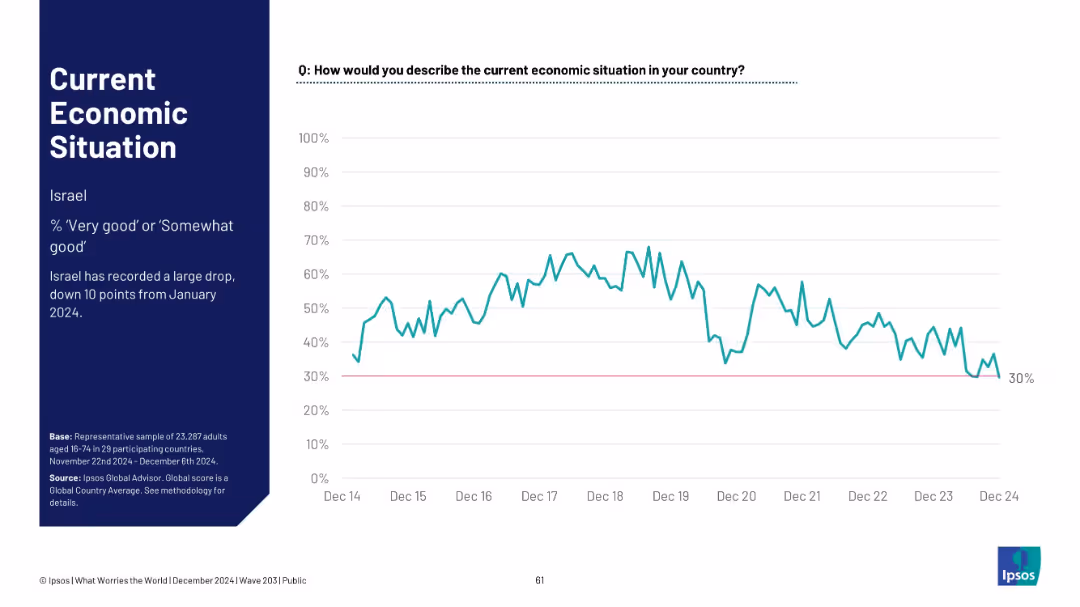
Line graph showing Israel's economic sentiment over time; notes a large recent decline.
Market Analysis and Trends
Financial Services
Israel experienced a sharp 10-point decline since January 2024, dropping to 30% of respondents viewing the economy as good, the lowest point in recent years.
Israel, sentiment drop, Ipsos, economic outlook, 2024 trend, survey data, macroeconomics, historical comparison
false
Market Analysis and Trends
Financial Services
Mixed Chart
IPSOS
Add to my slides
Remove from favorites
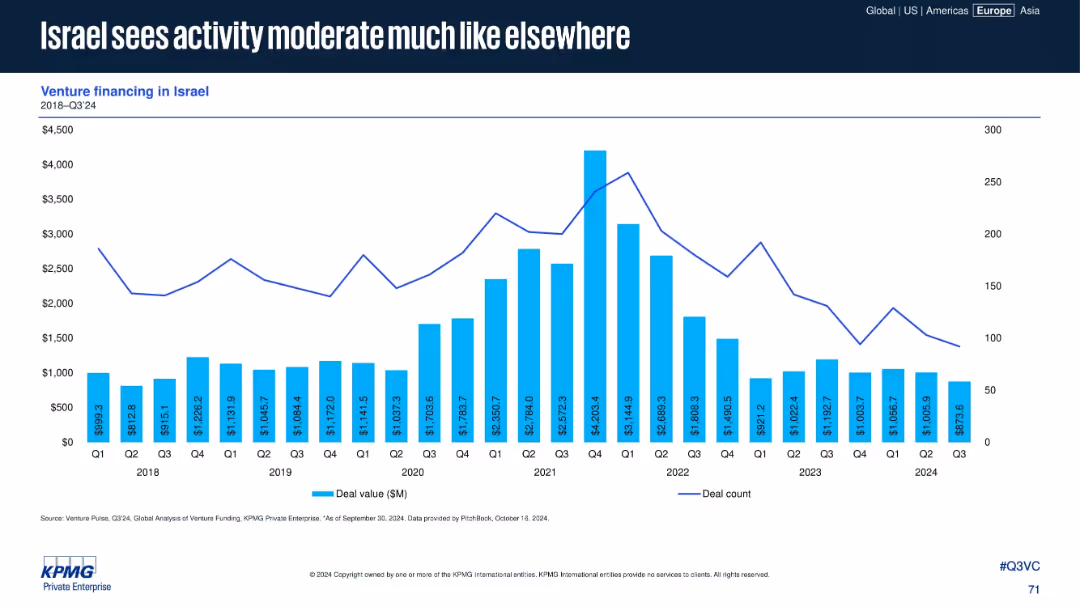
Similar format as previous slide with bar and line chart showing deal value and count for Israel from 2018 to Q3 2024. Minimalist design, focused on data trends.
Market Analysis and Trends
Financial Services
Presents a steady-to-declining venture funding trend in Israel over the past six years, mirroring global patterns. Includes detailed quarterly deal data showing reductions in both value and volume of deals since 2021.
Israel, Venture Financing, Deal Count, Market Trends, Q3 2024, KPMG, PitchBook
false
Market Analysis and Trends
Financial Services
Single Chart
KPMG
Add to my slides
Remove from favorites
Slide with pie charts, a stacked column chart, and legends explaining diversification in currency, tenor, and funding type. Visual elements are arranged in a balanced layout.
Strategic Planning
Financial Services
Demonstrates Macquarie's strategic approach to diversification of funding by currency, tenor, and type, also showing term funding maturity profiles.
Issuance, Currency, Tenor, Type, Maturity
false
Strategic Planning
Financial Services
Multiple Chart
Morgan Stanley
Add to my slides
Remove from favorites
Slide with various column charts showing past and planned issuances and redemptions of financial instruments.
Strategic Planning
Financial Services
Plans and reviews issuance strategies for 2024, detailing amounts and types of instruments, aligned with financial goals.
issuance, finance, planning, bonds, securities, strategy
false
Strategic Planning
Financial Services
Multiple Chart
Deutsche Bank
Add to my slides
Remove from favorites
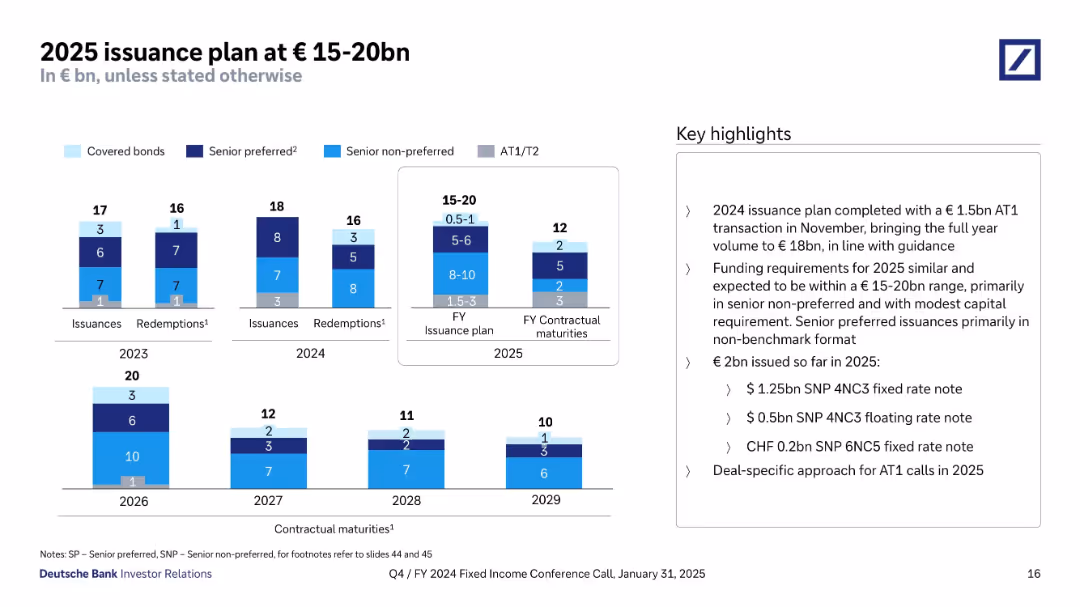
Multi-year bar charts showing issuance and redemption volumes by instrument type. The visual is compact and uses grouped colored segments. A side panel summarizes issuance plans and completions.
Strategic Planning
Financial Services
Deutsche Bank outlines its 2025 issuance plan (€15–20bn), including breakdowns of previous years (2023–2024) and upcoming maturities. It confirms the 2024 target was met with a €1.5bn AT1 issuance. The 2025 plan focuses on senior non-preferred and some capital instruments. A total of €2bn has already been issued in early 2025.
issuance plan, AT1, capital markets, funding, 2025, redemptions, maturities, senior non-preferred, Deutsche Bank
false
Strategic Planning
Financial Services
Multiple Chart
Deutsche Bank
Add to my slides
Remove from favorites
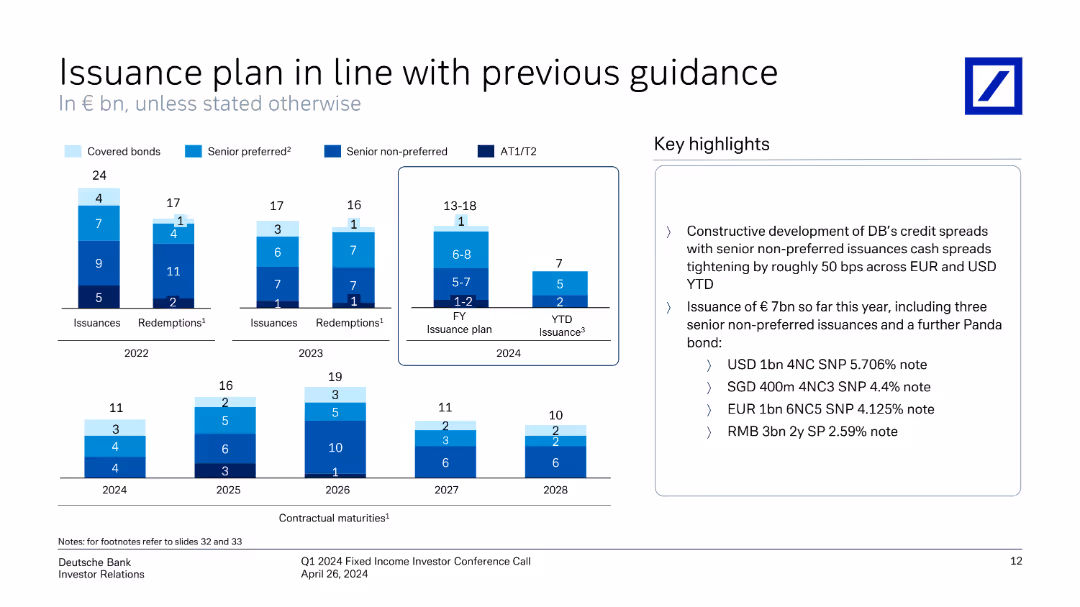
This slide features column charts showing issuances and redemptions from 2022 to 2028, with key highlights in text format on the right.
Financial Performance
Financial Services
The slide outlines Deutsche Bank's issuance and redemption plans from 2022 to 2028, detailing bond types and key highlights.
issuance, plan, bonds, financial, highlights, redemption, chart, guidance, key points, Deutsche Bank
false
Financial Performance
Financial Services
Multiple Chart
Deutsche Bank
Add to my slides
Remove from favorites
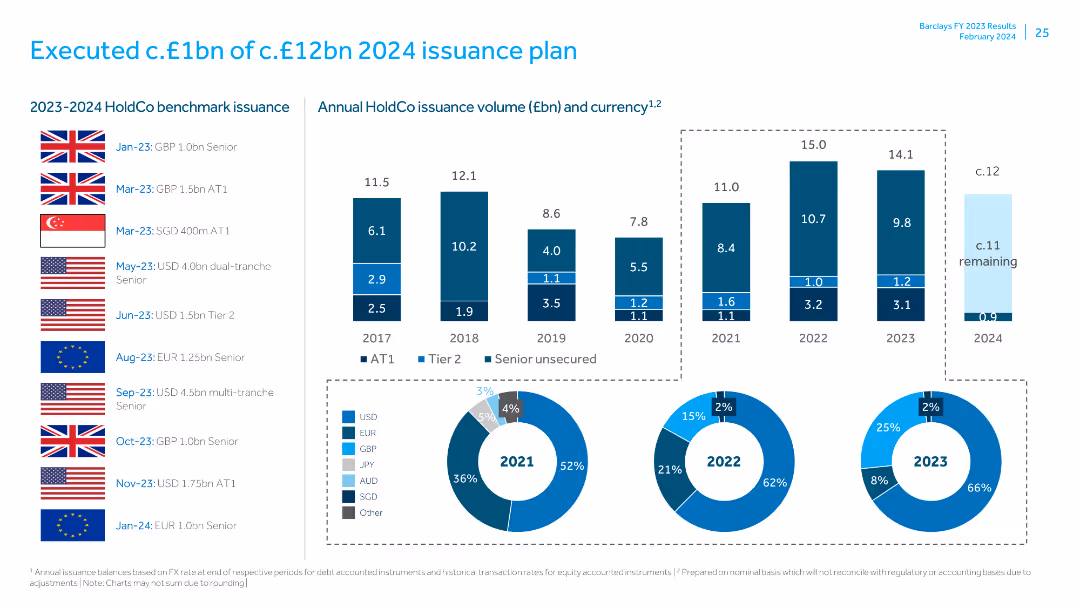
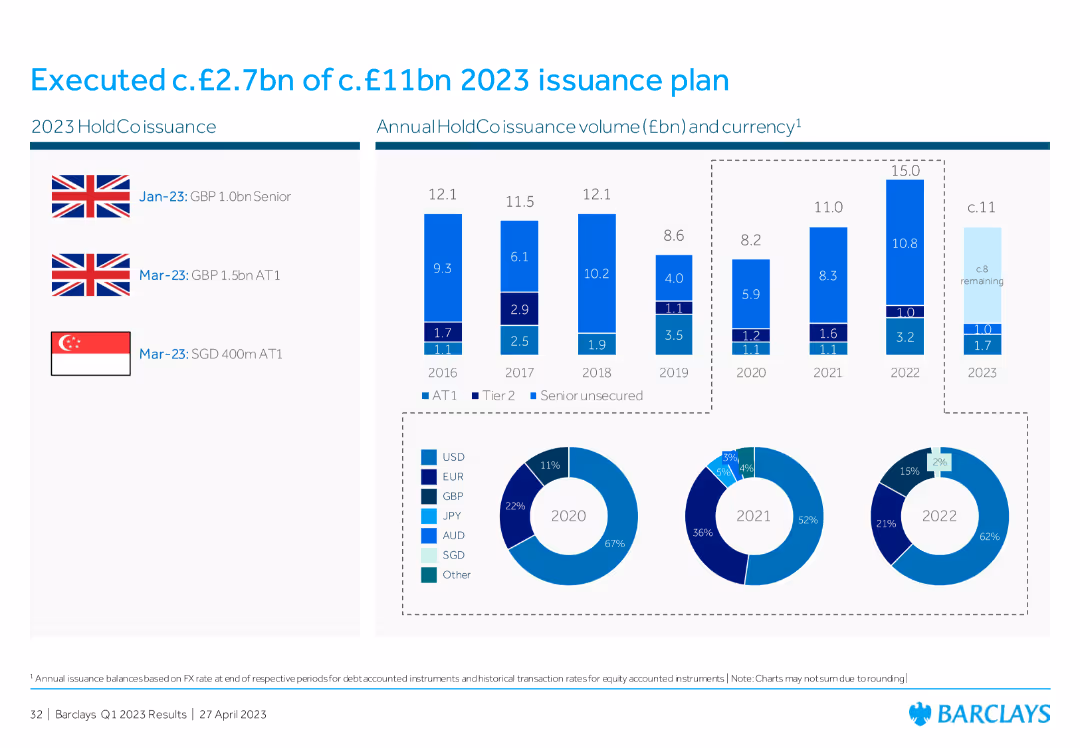
Features flags and column charts showing HoldCo benchmark issuance volumes and currency distribution for different years.
Financial Performance
Financial Services
Reviews the progress and details of the HoldCo issuance plan, including executed and remaining issuance volumes, and the distribution across different currencies.
issuance plan, HoldCo, financial performance, benchmark issuance, currency distribution, annual issuance, financial review, executed issuance, remaining issuance, financial planning
false
Financial Performance
Financial Services
Multiple Chart
Barclays
Add to my slides
Remove from favorites
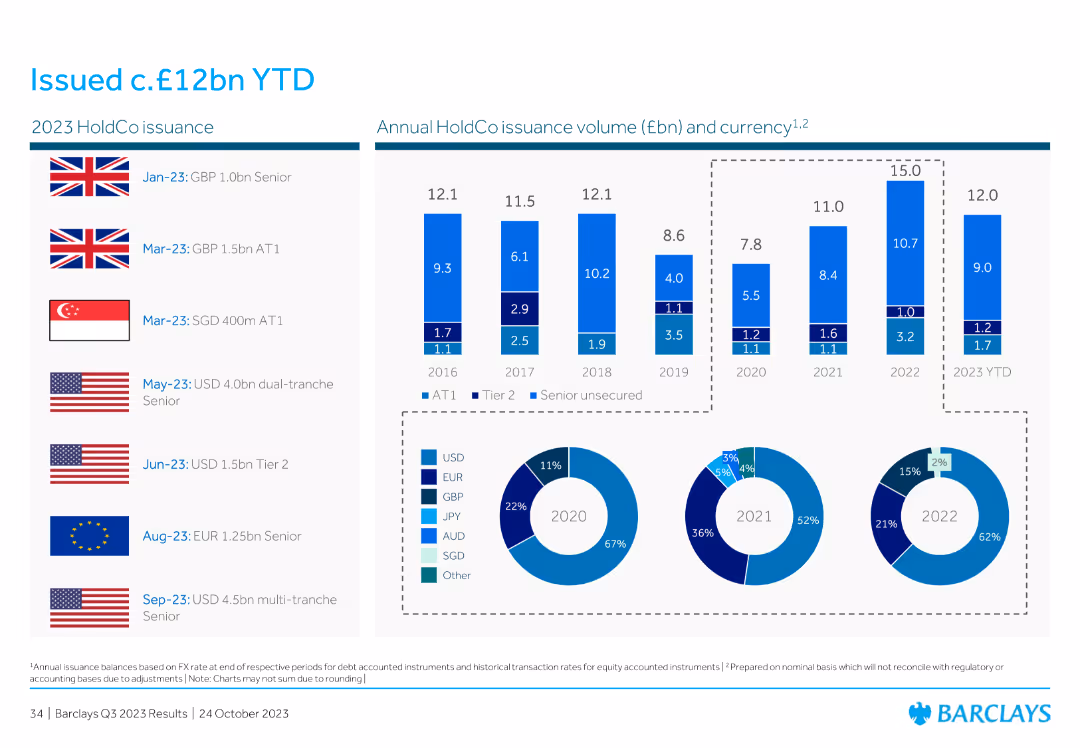
The slide displays bar charts showing annual HoldCo issuance volumes across different currencies and a table with recent issuance details for 2023.
Investment Analysis
Financial Services
This slide showcases the progress of the 2023 issuance plan, detailing executed and remaining amounts. It provides a breakdown of issuance volumes by year and currency, demonstrating the strategic investment approach.
issuance plan, HoldCo, investment, currency, volumes
false
Investment Analysis
Financial Services
Multiple Chart
Barclays
Add to my slides
Remove from favorites
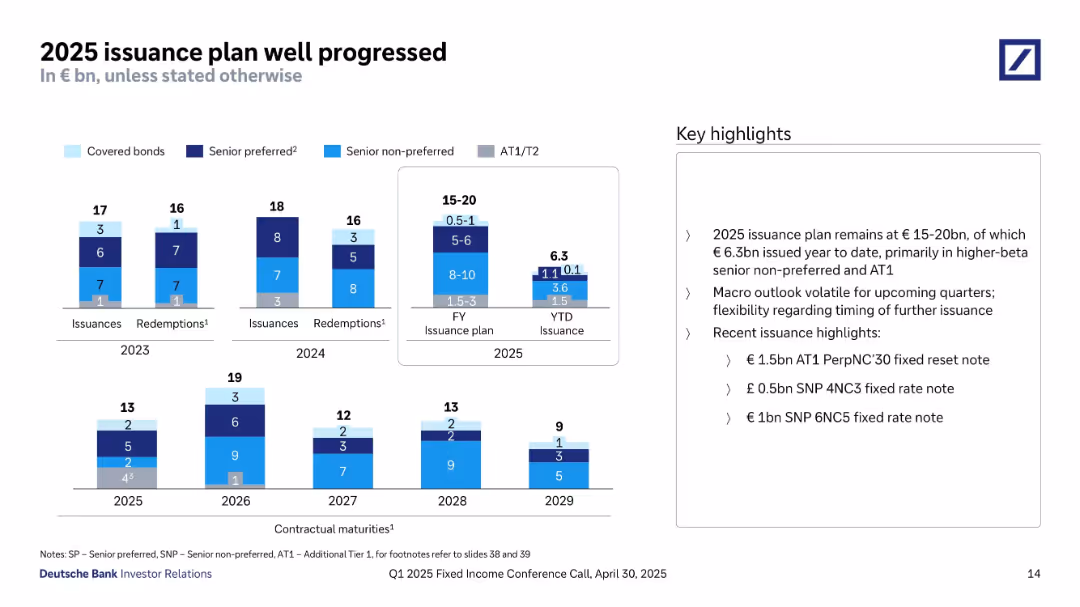
Multiple stacked bar charts show annual and YTD issuances, redemptions, and contractual maturities for various bond types through 2029. Uses color-coded categories and a central summary chart. Highlights on the right summarize plans and recent transactions.
Strategic Planning
Financial Services
The slide shows Deutsche Bank’s 2025 issuance plan (€15–20bn), of which €6.3bn has been issued, primarily in higher-beta senior non-preferred and AT1. It breaks down issuance and redemption by bond type over recent years, with a forward look at future maturities. Highlights mention recent successful AT1 and SNP issuances and describe macro volatility as a consideration in timing future issuances.
issuance plan, senior preferred, senior non-preferred, AT1, T2, redemptions, bond maturities, fixed rate
false
Strategic Planning
Financial Services
Mixed Chart
Deutsche Bank
Add to my slides
Remove from favorites
Column chart displaying issuances and redemptions, followed by a table listing details of 9M23 issuances such as ISIN, instrument, currency, and more.
Financial Performance
Financial Services
Provides detailed information on bond issuances by UBS in the first nine months of 2023, including specific data for analysis.
Issuances, Bonds, Financial Data, UBS, 2023
false
Financial Performance
Financial Services
Mixed Chart
UBS
Add to my slides
Remove from favorites
Multiple column charts depicting issuances and redemptions over time, along with upcoming maturities and first calls, including detailed callouts.
Investment Analysis
Financial Services
Analysis of capital market activities, including issuances, redemptions, and future call schedules.
Issuances, redemptions, maturities, bonds, capital markets
false
Investment Analysis
Financial Services
Multiple Chart
UBS
Add to my slides
Remove from favorites
Slide displays multiple column charts detailing year-to-date issuance volumes against past years, differentiated by color for types of securities. A side panel summarizes key points related to strategic financial operations.
Strategic Planning
Financial Services
Details the completion of a financial issuance plan, comparing current year data against previous years to evaluate the effectiveness of issuance strategies. It provides insights into strategic planning and operational efficiency in financial contexts.
issuance, strategic, financial, planning, efficiency
false
Strategic Planning
Financial Services
Multiple Chart
Deutsche Bank
Add to my slides
Remove from favorites
The slide is segmented into two main sections with column charts and a checklist. The upper section discusses the year-to-date issuance strategy, while the lower section compares debt and preferred stock issuances against maturities in a multi-bar chart.
Investment Analysis
Financial Services
This slide provides a strategic review of the year-to-date issuance performance, detailing benchmark and non-benchmark issuances, and planned maturities. Suitable for financial strategy meetings to assess and plan for capital market activities and investor relations.
Issuance Strategy, Capital Markets, Debt Management, Stock Issuance, Maturities
false
Investment Analysis
Financial Services
Mixed Chart
Goldman Sachs
Add to my slides
Remove from favorites
The slide contains multiple flags and icons to represent different issuance events throughout 2023. To the right, it features a combination of column charts and pie charts.
Financial Performance
Financial Services
Details Barclays' issuance volume across different currencies and financial instruments in 2023, illustrating annual issuance trends and currency breakdowns.
issuance, volume, currencies, financial instruments, trends, Barclays, 2023, annual, YTD
false
Financial Performance
Financial Services
Multiple Chart
Barclays
Add to my slides
Remove from favorites
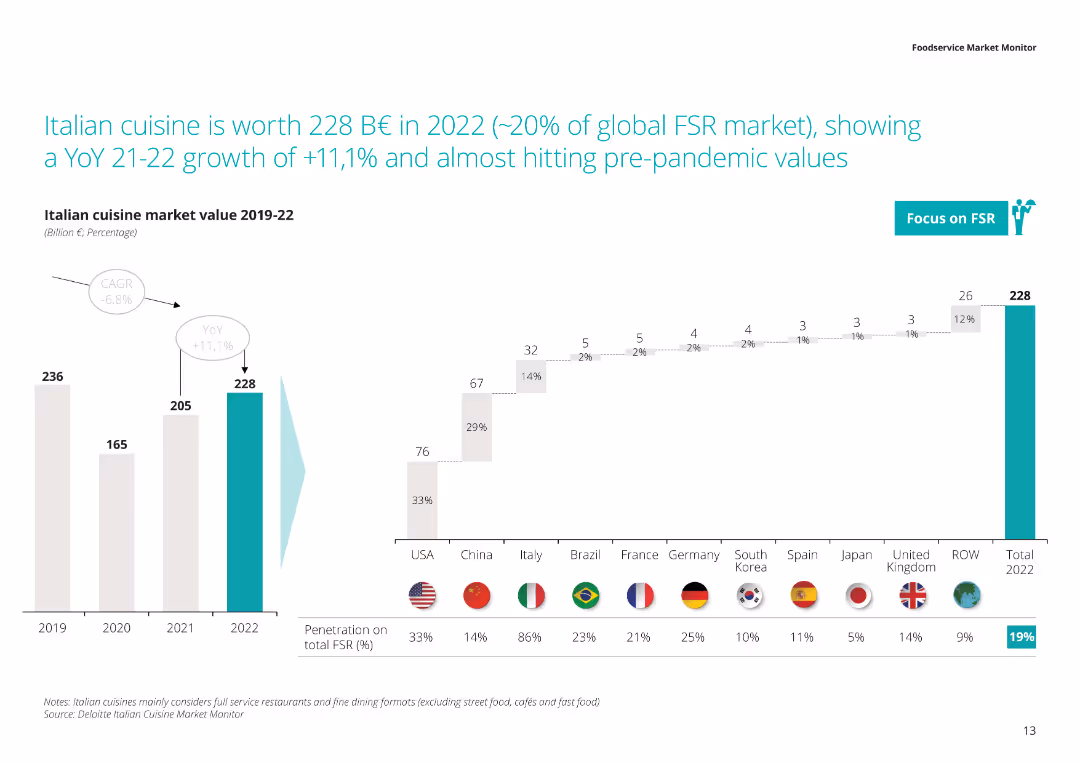
The slide displays a column chart showing the market value of Italian cuisine from 2019 to 2022, with a percentage breakdown of its penetration in the total FSR market across various countries.
Market Analysis and Trends
Hospitality & Tourism
This slide discusses the growth of the Italian cuisine market, highlighting its worth in 2022 and its significant year-over-year growth. It also shows its penetration in the full-service restaurant market globally.
Italian cuisine, market value, growth, full service restaurants, 2022
false
Market Analysis and Trends
Hospitality & Tourism
Multiple Chart
Deloitte
Add to my slides
Remove from favorites
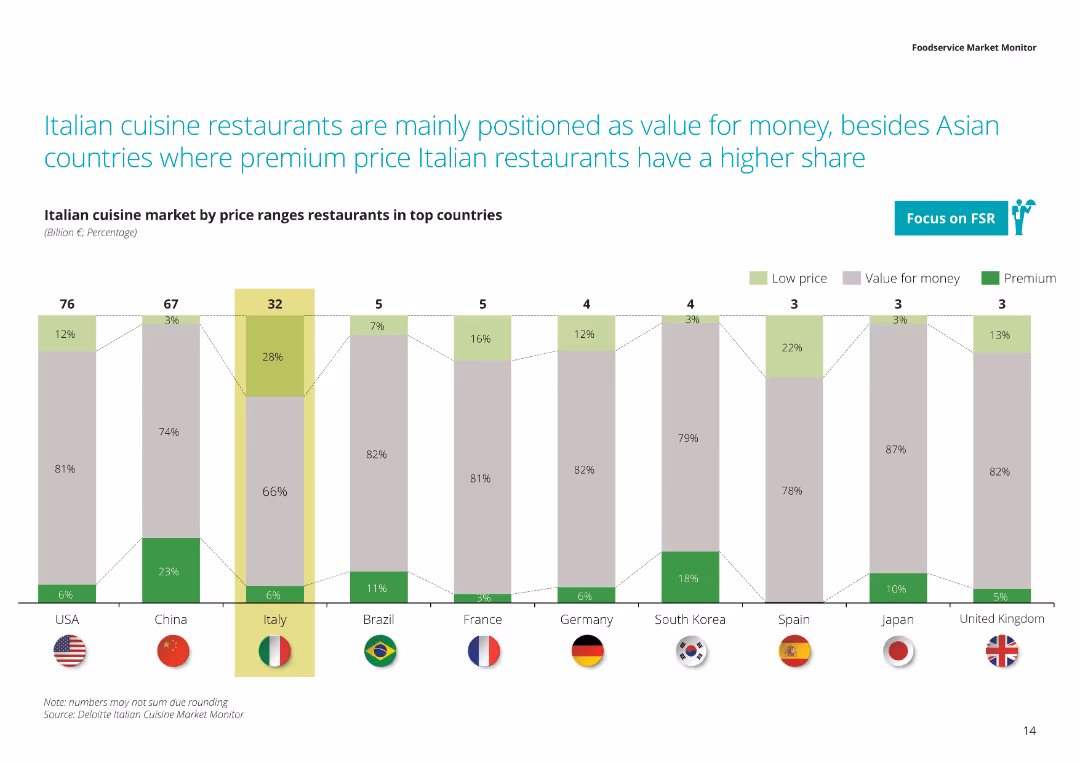
This slide includes a column chart illustrating the market share of Italian cuisine restaurants in top countries by price range (low, value for money, premium).
Market Analysis and Trends
Hospitality & Tourism
This slide analyzes the price positioning of Italian cuisine restaurants globally, highlighting that they are mainly seen as value for money compared to other regions where premium pricing is more common.
Italian cuisine, price positioning, value for money, premium, global analysis
false
Market Analysis and Trends
Hospitality & Tourism
Single Chart
Deloitte
Add to my slides
Remove from favorites
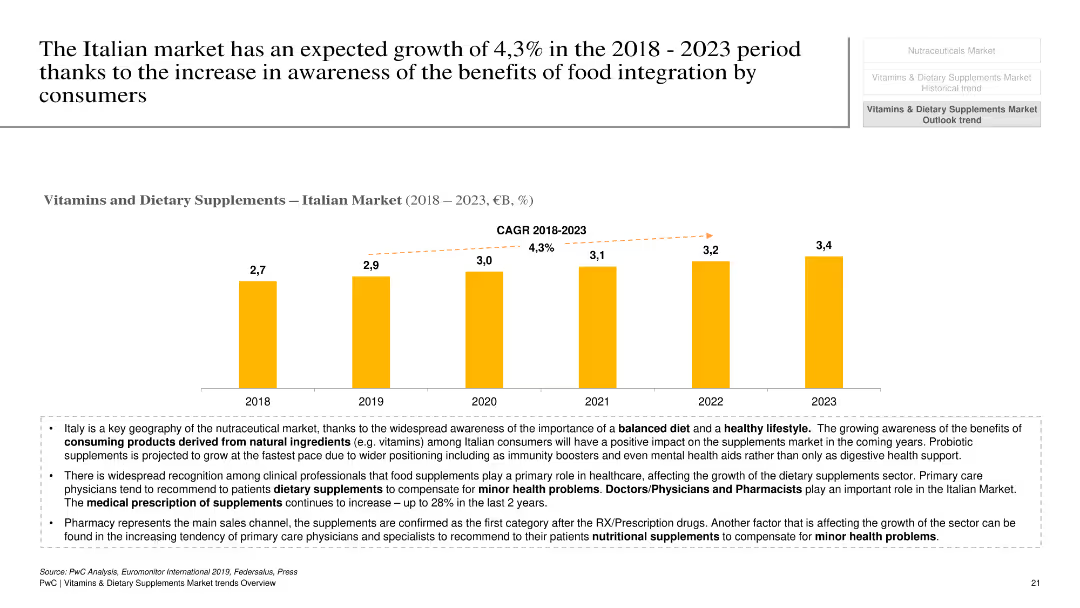
This slide features a column chart showing the growth of the Italian vitamins and dietary supplements market from 2018 to 2023, with a projected CAGR of 4.3%. Text boxes below the chart provide additional context and factors driving this growth.
Market Analysis and Trends
Healthcare & Pharmaceuticals
The slide presents the growth forecast for the Italian market for vitamins and dietary supplements, highlighting the projected CAGR and key factors contributing to this growth. It emphasizes the impact of increased consumer awareness and the role of healthcare professionals in recommending supplements.
Italian market, vitamins, dietary supplements, growth forecast, consumer awareness
false
Market Analysis and Trends
Healthcare & Pharmaceuticals
Mixed Chart
PwC/Strategy&
Add to my slides
Remove from favorites
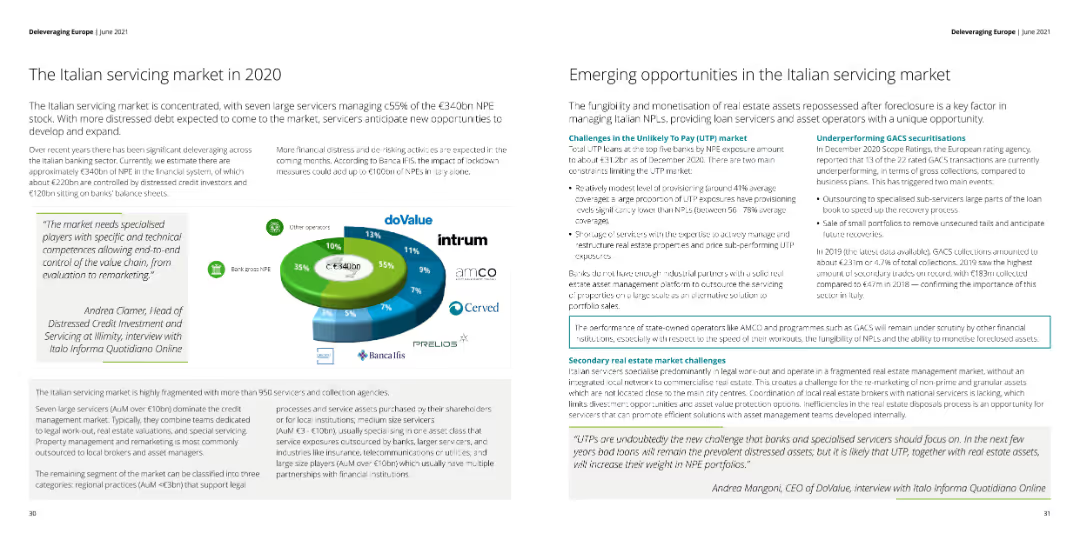
The slide features a pie chart illustrating the distribution of NPE stock among various servicers in Italy. Text sections discuss the challenges and opportunities in the Italian servicing market.
Market Analysis and Trends
Financial Services
This slide provides an overview of the Italian servicing market in 2020, highlighting the distribution of NPE stock and emerging opportunities for loan servicers and asset operators.
Italian servicing market, NPE stock, challenges
false
Market Analysis and Trends
Financial Services
Mixed Chart
Deloitte
Add to my slides
Remove from favorites
This slide displays a combination of a line graph and bar chart, detailing incremental cases and tests per day in Italy during the COVID-19 pandemic. Key dates and actions are annotated. It has a blue and black color scheme with text boxes for annotations.
Market Analysis and Trends
Healthcare & Pharmaceuticals
The slide presents data on COVID-19 case numbers and testing frequency in Italy, highlighting the timeline of government actions and their impact. It's useful for analyzing the effectiveness of policy measures in pandemic management.
Italy, COVID-19, Lockdown, Testing, Case Numbers
false
Market Analysis and Trends
Healthcare & Pharmaceuticals
Single Chart
McKinsey
Add to my slides
Remove from favorites
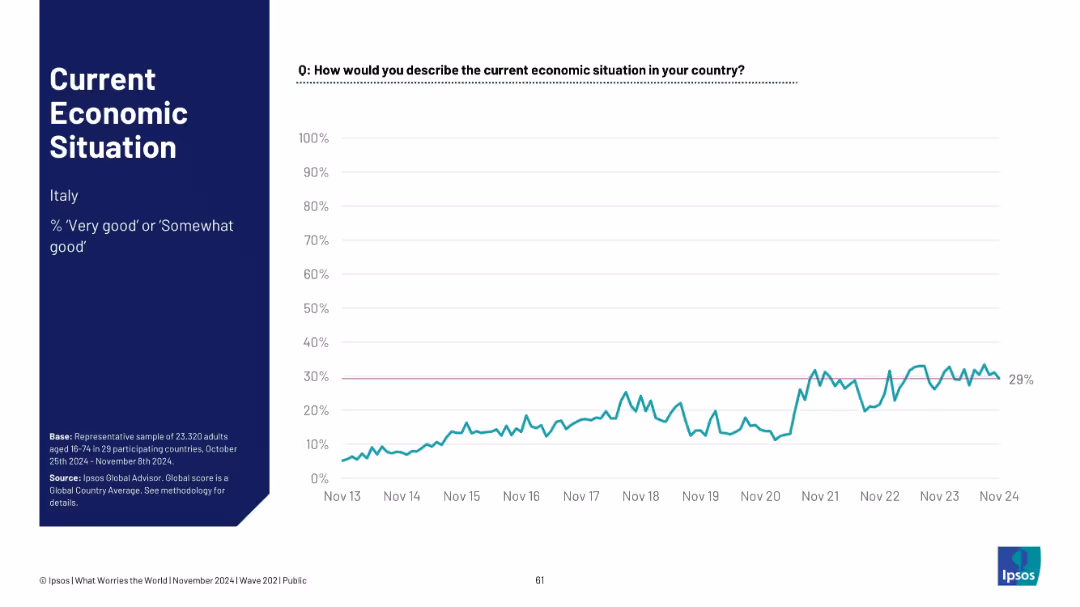
Layout consistent with prior slides; shows Italian public opinion trend graph with label at 29%
Market Analysis and Trends
Government & Public Sector
Italy’s economic sentiment stands at 29%. The trend shows a gradual rise post-2020 with improved public confidence, contrasting with more volatile or declining trends in other nations.
Italy, economic confidence, sentiment trend, economic perception, Ipsos survey, improvement, global comparison
false
Market Analysis and Trends
Government & Public Sector
Single Chart
IPSOS
Add to my slides
Remove from favorites
Long-term line chart for Italy; relatively flat trend with minor variation; sidebar text emphasizes stability.
Market Analysis and Trends
Financial Services
Italy's perception of its economic situation has remained among the most stable, fluctuating only six percentage points over the past 12 months, now at 28%.
Italy, economic sentiment, stability, 2024 data, long-term chart, Ipsos, survey results, consistent perception
false
Market Analysis and Trends
Financial Services
Mixed Chart
IPSOS
Add to my slides
Remove from favorites
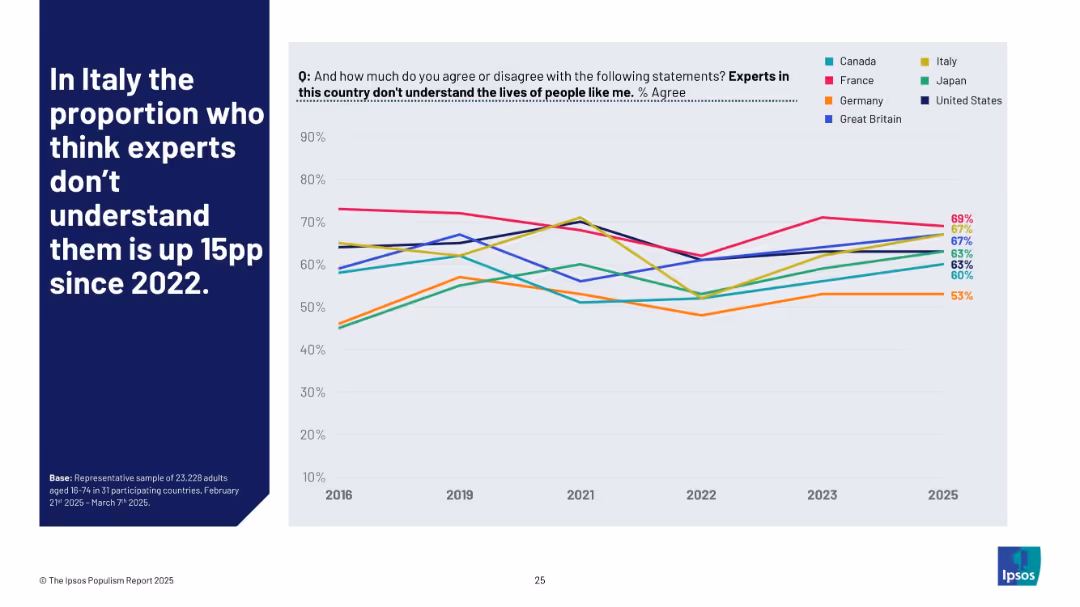
Left-aligned title on blue; right side has a multi-country line chart visualizing agreement with the expert disconnect statement from 2016–2025.
Market Analysis and Trends
Government & Public Sector
This slide tracks how various populations perceive experts’ understanding of citizens' lives. Italy shows a 15 percentage point increase since 2022, signaling a rise in expert distrust or disconnect perception.
Italy, experts, disconnect, opinion trends, 2025, Ipsos, populism, global sentiment, distrust, perception shift
false
Market Analysis and Trends
Government & Public Sector
Mixed Chart
IPSOS
Add to my slides
Remove from favorites
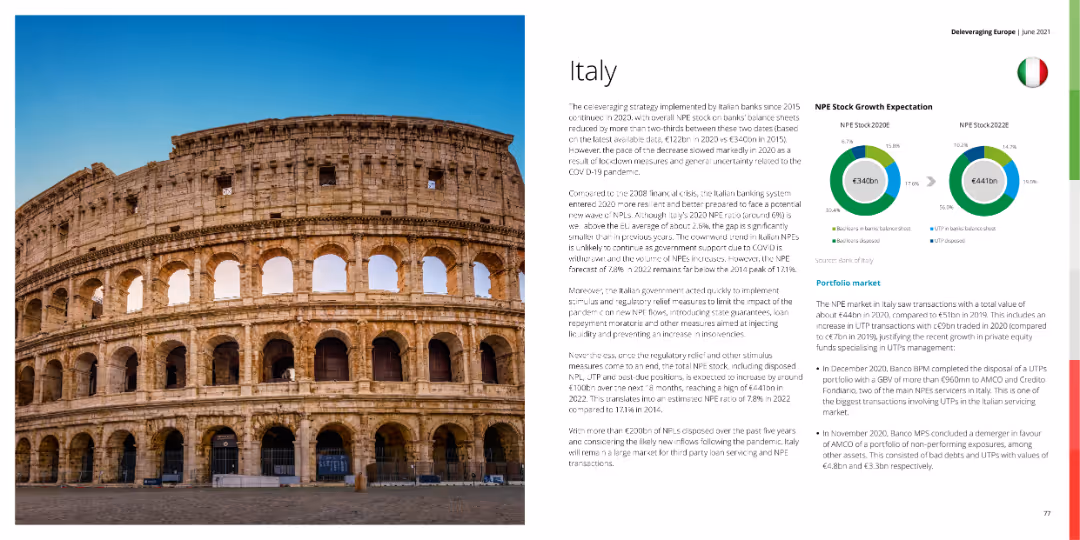
A photo of the Colosseum with circular charts showing NPE stock growth expectation and a detailed text explanation.
Market Analysis and Trends
Financial Services
This slide analyzes Italy's banking system and NPE stock growth expectations, discussing economic impacts and future outlooks.
Italy, NPE stock, banking, financial services, market analysis
false
Market Analysis and Trends
Financial Services
Mixed Chart
Deloitte
Add to my slides
Remove from favorites
A photo of the Colosseum with circular charts showing NPE stock growth expectation and a detailed text explanation.
Market Analysis and Trends
Financial Services
This slide analyzes Italy's banking system and NPE stock growth expectations, discussing economic impacts and future outlooks.
Italy, NPE stock, banking, financial services, market analysis
false
Market Analysis and Trends
Financial Services
Multiple Chart
Deloitte
Add to my slides
Remove from favorites
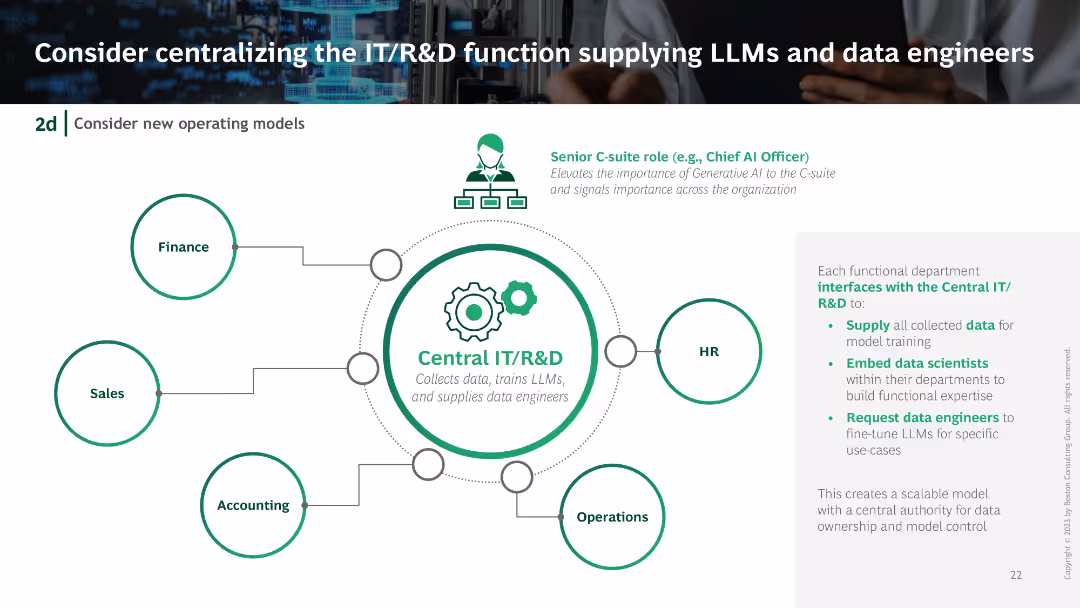
Centralized IT/R&D unit diagram with connections to different departments like Finance, HR, Sales, and Operations. Includes icons and flow lines illustrating the centralized structure.
Organizational Structure and Change
Technology & Software
Suggests centralizing the IT/R&D function to efficiently manage LLMs and data engineers, showing how this structure would interface with various departments.
IT centralization, R&D, LLMs, data engineers, organizational structure
false
Organizational Structure and Change
Technology & Software
Diagram
BCG
Add to my slides
Remove from favorites
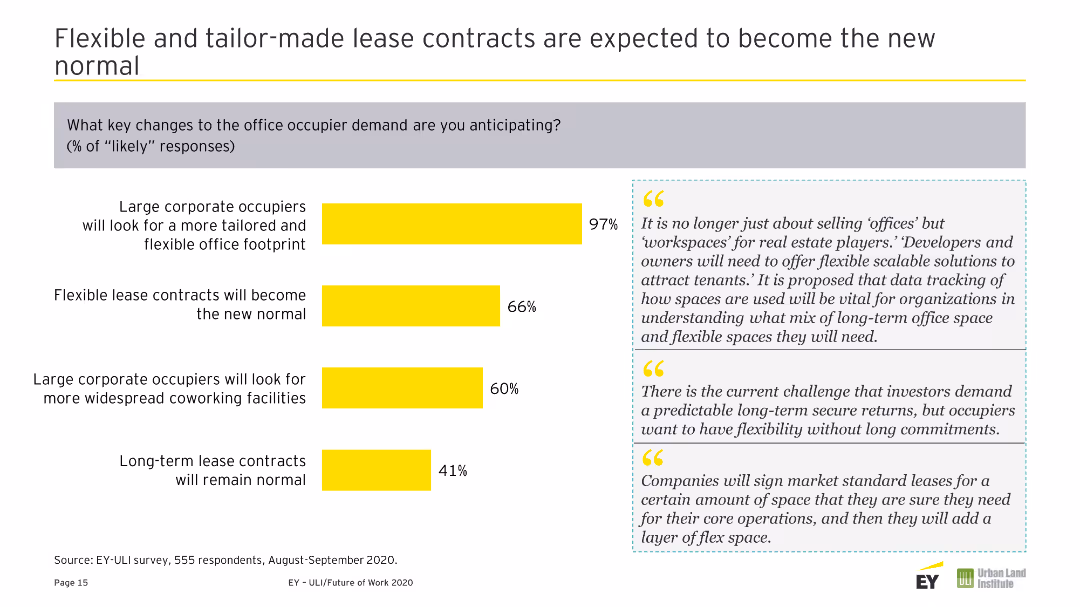
Column chart illustrating challenges from the Future of Work. Includes two text quotes on the right side in gray boxes. Uses yellow and gray colors.
Risk Assessment and Management
Real Estate & Construction
Identifies top challenges such as increased IT costs, loss of corporate culture, and less effective talent management.
IT Costs, Corporate Culture, Talent, Management, Turnover, Innovation, Creativity, Challenges, Future of Work
false
Risk Assessment and Management
Real Estate & Construction
Mixed Chart
EY
Add to my slides
Remove from favorites
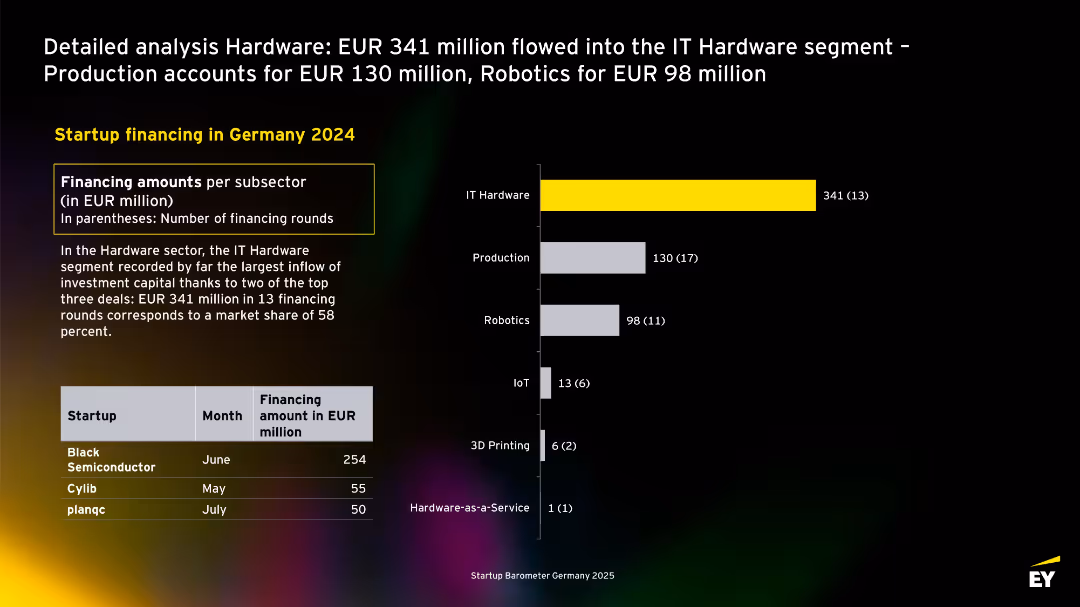
Layout with yellow-highlighted leading sector (IT Hardware), bar chart on right, and top startup table at bottom-left.
Investment Analysis
Technology & Software
The slide dissects hardware segment funding in 2024, led by IT Hardware (EUR 341M). It highlights significant investments into Black Semiconductor and others. Production and Robotics also secured notable shares.
IT hardware, robotics, production, startups, Germany, capital inflow, 2024, venture
false
Investment Analysis
Technology & Software
Mixed Chart
EY
Add to my slides
Remove from favorites
A scatter plot showing the relationship between IT spending per employee and value-added per employee for different countries. The countries are grouped and color-coded into different regions.
Market Analysis and Trends
Technology & Software
The slide analyzes IT intensity across various countries by comparing IT spending per employee to the economic value added per employee, used for international market comparisons.
IT Intensity, Country Analysis, Economic Value, IT Spending, International Comparison
false
Market Analysis and Trends
Technology & Software
Single Chart
Gartner
Add to my slides
Remove from favorites
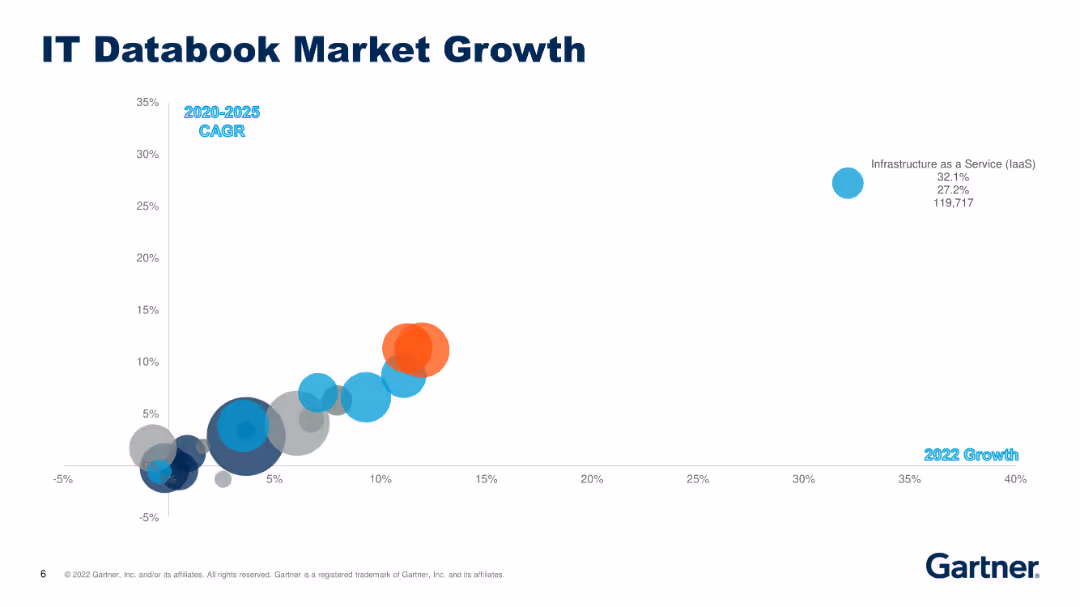
The slide includes a scatter plot showing IT market growth across various segments, highlighting growth rates and compound annual growth rates (CAGR) for different IT services and products from 2020 to 2025.
Market Analysis and Trends
Technology & Software
The slide presents a detailed analysis of market growth in the IT sector, highlighting segments like infrastructure as a service (IaaS), enterprise application software, and consulting with projected CAGR.
IT market, growth, CAGR, 2020-2025, segments, services, products, infrastructure, enterprise, consulting
false
Market Analysis and Trends
Technology & Software
Single Chart
Gartner
Add to my slides
Remove from favorites
The slide features a scatter plot showing growth rates for various IT segments, including infrastructure software, business process services, and consulting, with projected CAGR from 2020 to 2025.
Market Analysis and Trends
Technology & Software
The slide provides a comprehensive view of IT market growth, highlighting key segments such as infrastructure software and business process services, along with their projected growth rates.
IT market, growth, segments, infrastructure, software, business process, consulting, CAGR, 2020-2025
false
Market Analysis and Trends
Technology & Software
Single Chart
Gartner
Add to my slides
Remove from favorites
Graph depicting reduction in operational backlogs, images of textual data concerning IT improvements and customer service.
Operational Efficiency
Financial Services
Describes the outcomes of IT migration and service improvements at Postbank, focusing on operational efficiency and customer service enhancements.
IT migration, operational efficiency, customer service, Q4
false
Operational Efficiency
Financial Services
Multiple Chart
Deutsche Bank
Add to my slides
Remove from favorites
A line chart tracking the price inflation of WLAN, Comms, Devices, and Phones from 2020 to 2026, normalized to 2020 levels. Multiple lines with different colors represent each category.
Financial Performance
Technology & Software
This slide analyzes the price inflation trends of various IT products from 2020 to 2026, indicating how prices have increased or remained stable over time.
IT Prices, Inflation, Technology Trends, Price Normalization, Market Analysis
false
Financial Performance
Technology & Software
Single Chart
Gartner
Add to my slides
Remove from favorites
A slide featuring a bar chart showing an 80% revenue growth in ITS collaboration revenues from 9M16 to 9M18, and another chart showing the penetration of structured products among private banking clients.
Strategic Planning
Financial Services
This slide highlights the growth in ITS collaboration revenues and the penetration of structured products among private banking clients, indicating significant progress and future opportunities.
ITS collaboration, revenue growth, structured products, private banking, financial services, market penetration, strategic planning, growth opportunity
false
Strategic Planning
Financial Services
Multiple Chart
Credit Suisse
Add to my slides
Remove from favorites
Incorporates bullet points and icons to discuss potential acquisition targets in the IT services sector, focusing on six specific opportunities.
Investment Analysis
Technology & Software
Discusses strategic acquisition opportunities within the IT services sector, highlighting areas with potential growth and resilience in market downturns.
IT services, acquisitions, targets, opportunities, strategic growth
false
Investment Analysis
Technology & Software
Table
BCG
Add to my slides
Remove from favorites
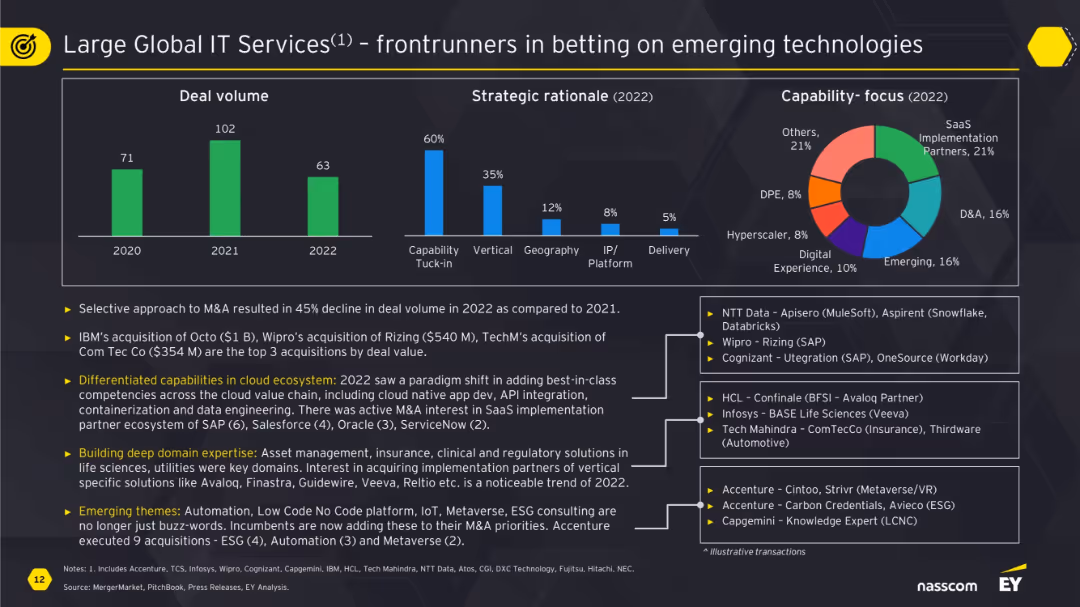
Three-part layout: bar chart on deal volume, bar chart on strategic rationale, and pie chart for capability focus; includes illustrative transactions.
Technology and Digital Transformation
Technology & Software
This slide outlines M&A trends among large global IT service providers. The focus is on capability tuck-ins and vertical integration, with significant deals in cloud and emerging tech. It mentions IBM, Wipro, and TechM among the major acquirers. Pie charts show SaaS and D&A as top priorities. Highlights show a strategic push toward building domain expertise and deepening cloud capabilities.
IT services, cloud, M&A, SaaS, vertical, emerging tech, deal volume
false
Technology and Digital Transformation
Technology & Software
Multiple Chart
EY
Add to my slides
Remove from favorites
Column chart for deal volume by buyer type (2022–2024); lower third features company callouts; black and yellow theme with segmented insights; clean, bold visual language.
Mergers and Acquisitions
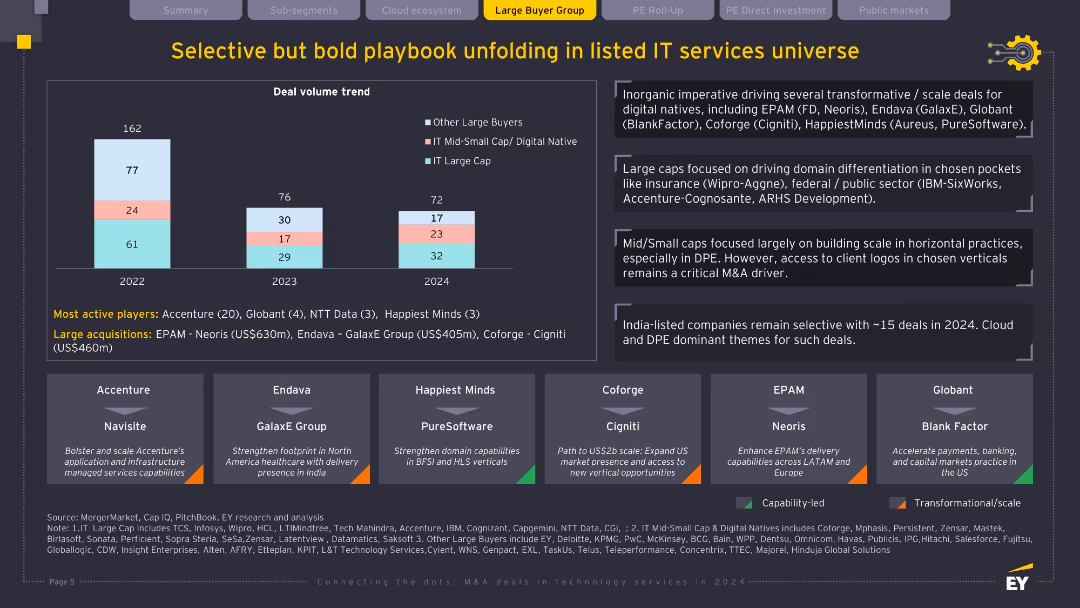
Technology & Software
This slide shows a nuanced M&A strategy among IT service providers, categorizing buyers into large caps, mid-small caps, and others. It highlights key players like Accenture, Globant, and Endava, and strategic themes such as domain expansion, vertical capabilities, and North American delivery enhancement. Deal volume is stable but more targeted.
IT services, M&A, listed companies, deal volume, strategic acquisition, buyer trends
false
Mergers and Acquisitions
Technology & Software
Mixed Chart
EY
Add to my slides
Remove from favorites
Two pie charts, one showing the spread of IT services spending by markets, and the other detailing the market share of the top 10 vendors in 2021. The first chart shows categories like Application Implementation and Infrastructure as a Service.
Financial Performance
Technology & Software
This slide breaks down the increase in IT services spending in 2021 by market segment and vendor, showing which areas and companies saw the most growth.
IT Services, Spending, Market Segments, Top Vendors, Financial Performance
false
Financial Performance
Technology & Software
Multiple Chart
Gartner
Add to my slides
Remove from favorites
Previous
Next
You don't have any favorites yet.
Please wait loading your favorites slides...
Create a FREE account to continue browsing
Receive Instant Access to 1,000+ slides from companies like McKinsey, Google, and Goldman Sachs
First Name
Last Name
Email
Password
I agree to all
Terms & Privacy Policy
Thank you! Your submission has been received!
Oops! Something went wrong while submitting the form.
Have an account?
Sign in
Upgrade to PRO to Save slides
Advanced Search and Filters
Access to 15,000+ slides
Access to Category Pages
Save/Bookmark Slides
PowerPoint Template Library
Pick a Plan
MONTHLY
$12/month
Billed every month, Cancel anytime.
YEARLY
$9/year
Billed $108 annually, Cancel anytime.
Checkout for $12/month
Checkout for $108/yr
Secured by Stripe | AES-256 bit encryption